Systematic Review

Data Typologies in Urban Housing Research: A Systematic Review of the Literature

by
Liton (Md) Kamruzzaman
1,*,
Sanaz Nikfalazar
2,
Fuad Yasin Huda
1,
Dharmalingam Arunachalam
3 and
Dickson Lukose
4
1
Monash Institute of Transport Studies, Department of Civil Engineering, Monash University, Melbourne, VIC 3800, Australia
2
Department of Human Centred Computing, Monash University, Melbourne, VIC 3800, Australia
3
School of Social Sciences, Monash University, Melbourne, VIC 3800, Australia
4
Monash Data Future Institute, Monash University, Melbourne, VIC 3800, Australia
*
Author to whom correspondence should be addressed.
Sustainability 2025, 17(11), 4809; https://doi.org/10.3390/su17114809
Submission received: 14 April 2025 / Revised: 15 May 2025 / Accepted: 22 May 2025 / Published: 23 May 2025
(This article belongs to the Section Sustainable Urban and Rural Development)

Abstract

:
The increasing digitalisation of housing markets has expanded the types and sources of data available for research. However, there is limited understanding of how these diverse data types are used across different themes in urban housing studies and which analytical approaches are applied. This study addresses these questions through a systematic review of 71 peer-reviewed studies published between 2010 and 2021, following PRISMA guidelines. The review identifies five dominant research themes: housing market analysis, rental market analysis, housing policy evaluation, housing affordability, and housing inequality. It also classifies five main data sources: official statistics, non-official statistics, surveys and qualitative data, big data, and social media. A cross-examination of themes and data types shows that official statistics remain the most frequently used across the themes, while emerging data sources such as big data and social media are underutilised—especially in research on informal housing and demand-side dynamics. Regression analysis and hedonic modelling are the most commonly applied analytical methods, with the choice of method largely shaped by research objectives and data types. By developing a cross-typology framework linking research themes, data sources, and methods, this study provides an evidence base for inclusive, responsive, and data-informed strategies that support socially and economically sustainable urban housing systems.

1. Introduction

Rapid digitalisation has transformed housing markets globally, shifting traditional data collection methods to digital platforms supported by internet technologies and online transactions [1,2,3]. This evolution has generated vast, accessible datasets, enabling new ways to analyse key dimensions of housing markets, such as affordability, inequality, and market dynamics (e.g., supply and demand). These dimensions are fundamental to understanding housing sustainability from social and economic perspectives. Reliable, disaggregated data are essential for measuring and addressing the housing-related Sustainable Development Goals (SDGs), including SDG 11.1: ensuring access to adequate, safe, and affordable housing. Consequently, urban housing research has increasingly leveraged diverse data sources—from government statistics to social media and web-scrapped listings [1,4,5,6]. Despite these developments, there is limited understanding of how different data types are used across urban housing research themes [4,7], or what methods are applied to analyse them. This gap is particularly evident in emerging areas of housing research, such as informal housing or digitally mediated rental markets [1,4,8,9,10,11].
Urban housing research has traditionally been framed around binaries such as formal vs. informal housing, public vs. private tenure, and supply vs. demand [8,12,13]. However, as scholars have noted, the usability, accessibility, and risks associated with different data sources vary significantly across these research types—for example, interviews in informal housing contexts may raise ethical and legal challenges that are less common in formal housing settings [9,10,12,13]. As a result, understanding how data are utilised within and across housing research domains is increasingly important for both methodological robustness and evidence-based planning for sustainable and inclusive housing systems.
Typologies offer structured insight into this complexity by classifying housing research and data use [14,15]. Prior studies have developed typologies focused on specific subdomains, including digital platforms [1,4,15,16,17], housing supply [18], informal rentals [19], shared housing [20], and housing policy [21] (Table 1). However, they often lack a cross-cutting analysis that links data source types with these research themes and their associated analytical methods. Most do not examine the methodological and data implications across themes, or how analytical methods align with data characteristics and research objectives. This study addresses these gaps by conducting a systematic review of urban housing literature. It aims to identify patterns in how data sources and analytical methods are applied across different types of housing research. The three objectives of this study are as follows:
  • To identify the dominant research themes in housing studies that engage with data;
  • To classify the types of data sources used in these studies and the methods applied to analyse them;
  • To explore how data availability shapes research focus, particularly in underexamined themes, to inform directions for future research.
By bridging typologies of housing research, data sources, and methods, this review provides a framework for improving data selection and integration in future studies. It also highlights substantial opportunities for expanding the use of underutilised data sources—especially in contexts where traditional data are limited or inadequate. In doing so, the study contributes to strengthening the data foundations needed to promote sustainable urban development, particularly in addressing affordability, inequality, and housing access.
Following this introduction, Section 2 outlines the method used to address the research objectives. Section 3 presents the findings, including the identified typologies for housing research and data sources, and a summary of the analytical methods used. Section 4 provides a cross-examination of housing research, data, and methodological typologies and discusses the implications of the results. Section 5 summarises the main findings and offers conclusions and directions for future studies.

2. Materials and Methods

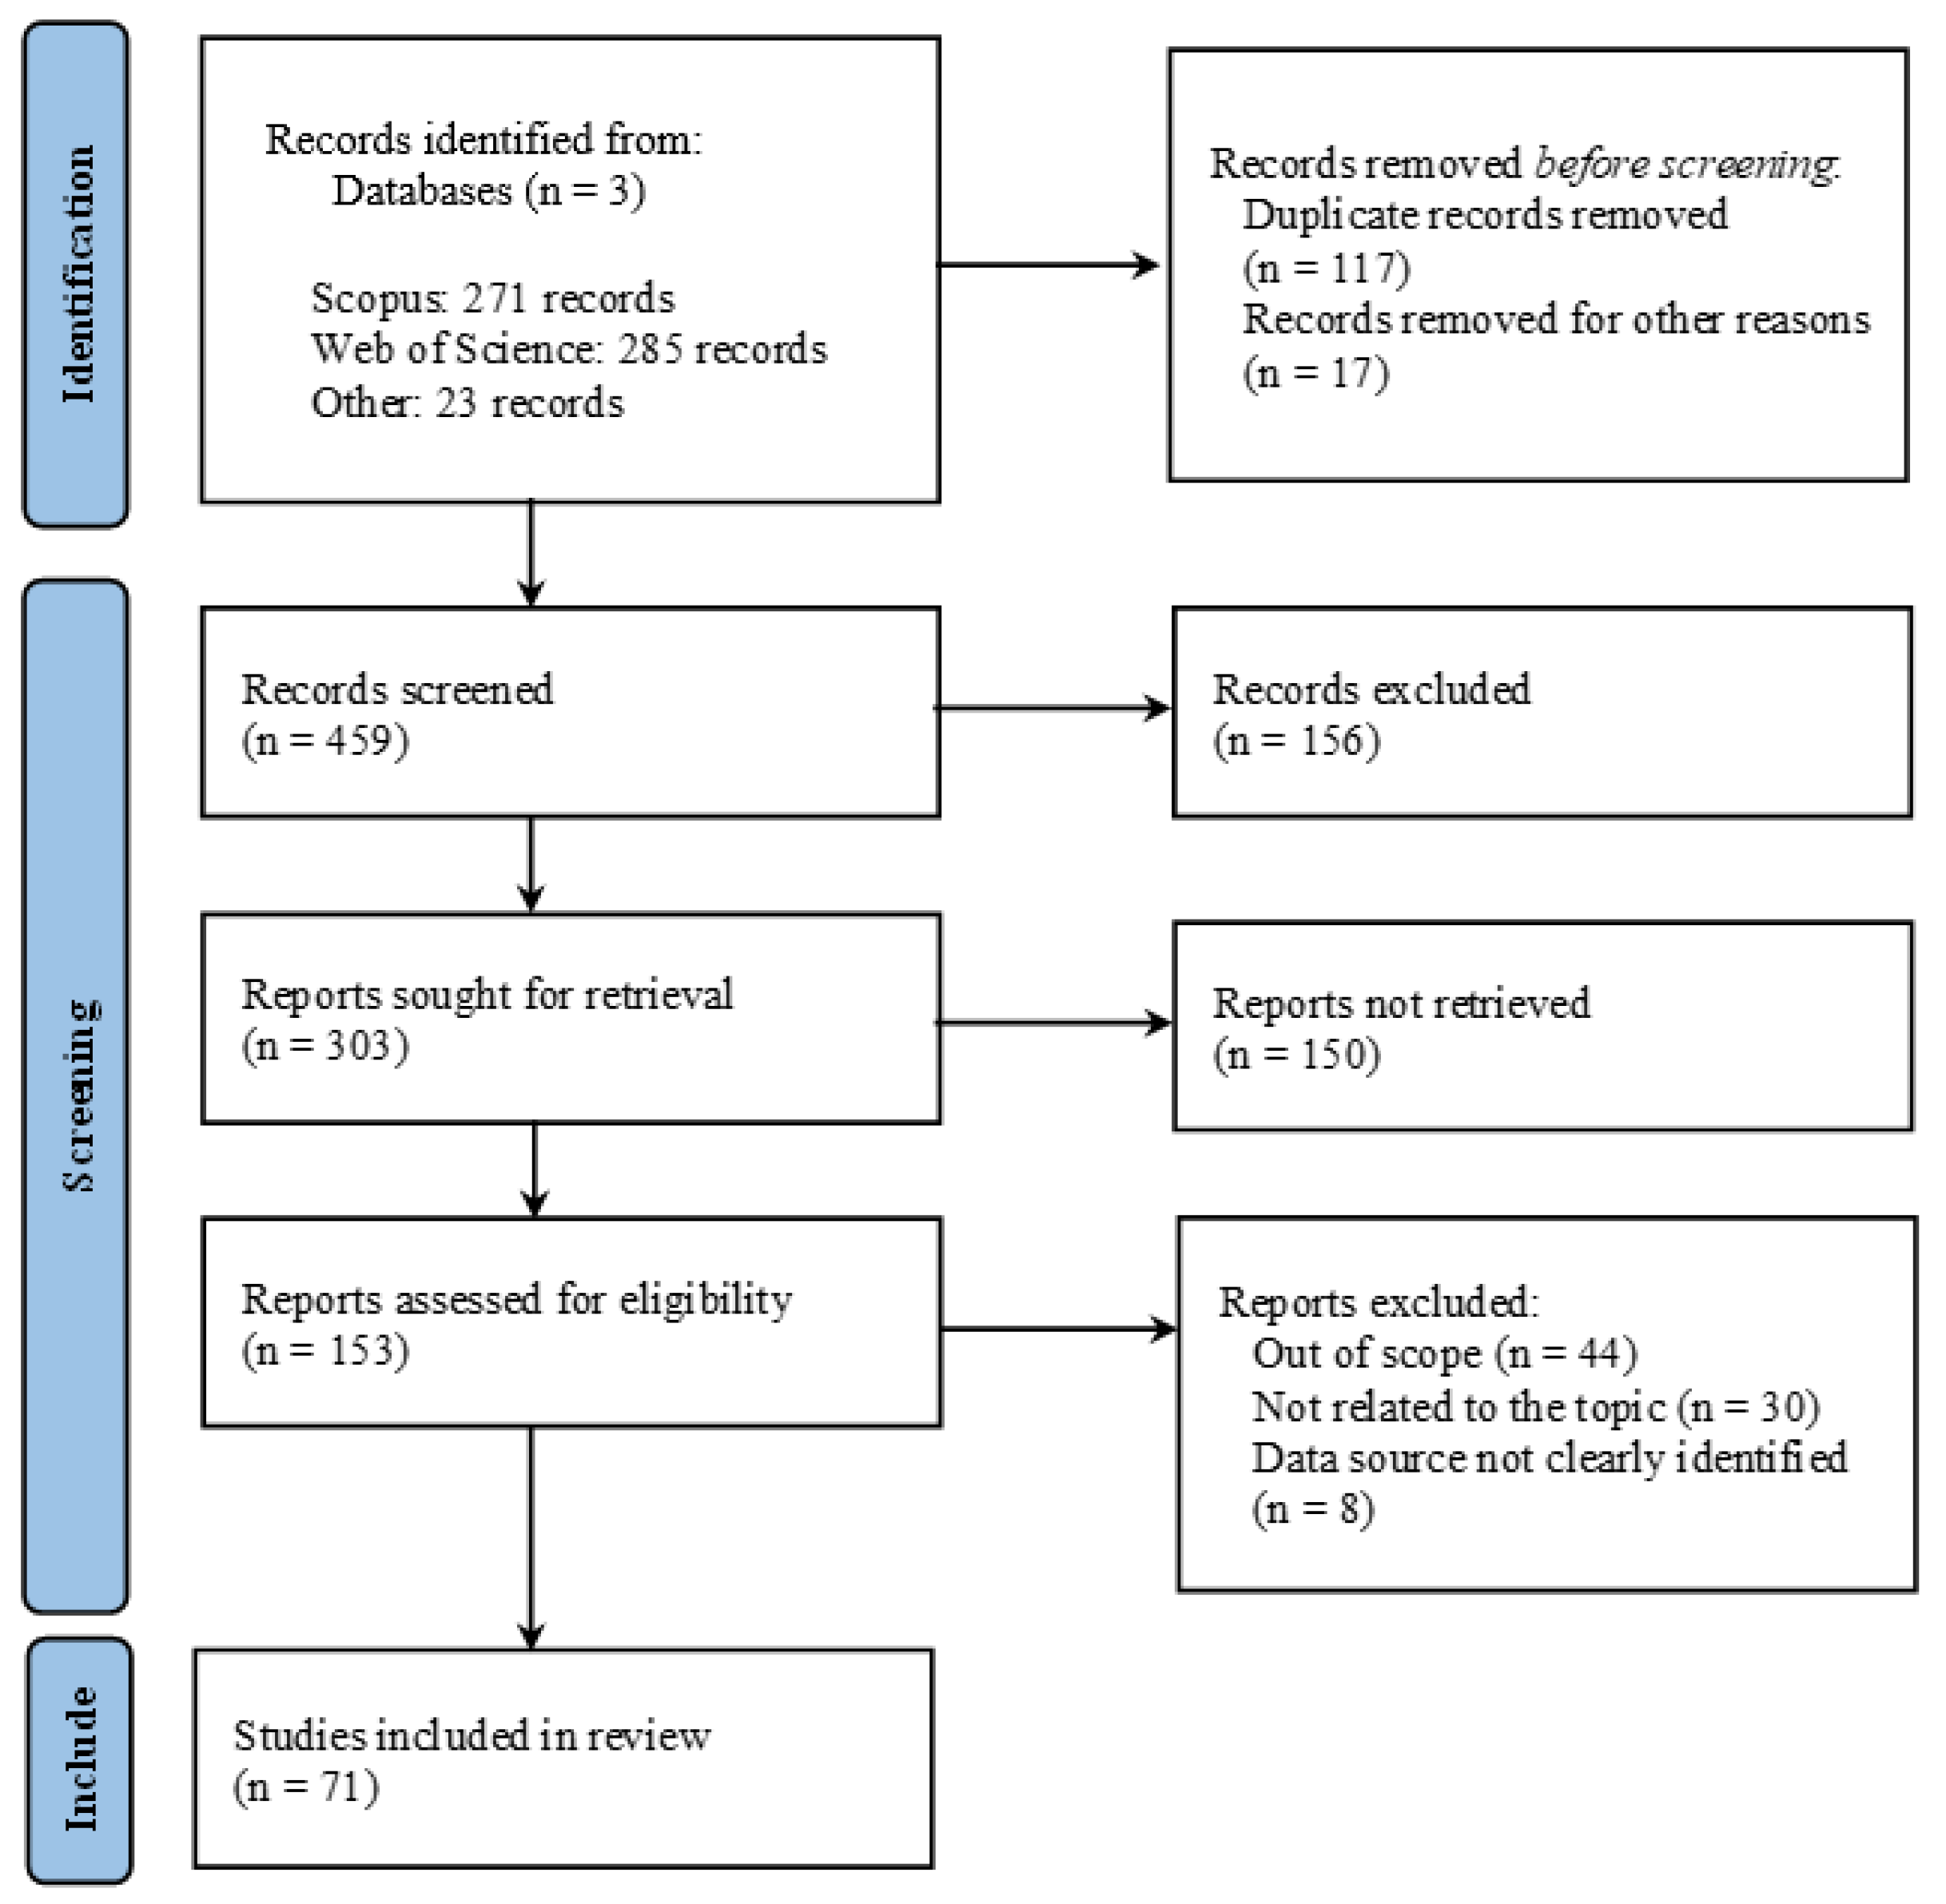
Figure 1 presents a visual summary of the methodological steps undertaken in this study. The process followed a series of structured steps: identifying the research problem, defining objectives, conducting a systematic literature search, screening and selecting studies, extracting and coding relevant data, and synthesising findings. This study aims to uncover how methodological choices and data usage vary across distinct strands of housing research. To address this aim, the study conducted a systematic review of the literature following the Preferred Reporting Items for Systematic Reviews and Meta-Analyses (PRISMA) guidelines [22]. Figure 2 shows the RPISMA flow diagram used for study identification and selection. A PRISMA checklist can be downloaded using the link provide in the Supplementary Materials section.

2.1. Search Strategy

A systematic search was conducted in November 2021 using two major academic databases: (1) Web of Science and (2) Scopus. The search query applied to titles, abstracts, and keywords was (“Housing”) AND (“formal*” OR “informal*” OR “share*” OR “rental”) AND (“data*”) AND (“supply” OR “demand”). This search yielded 556 records. To improve comprehensiveness, the same search terms were applied to Google Scholar, which added 23 relevant records.
The search terms were developed iteratively through a series of trial searches. Terms such as “formal”, “informal”, “rental”, and “shared” housing were selected because they consistently returned outputs aligned with the study’s objectives—examining the use of data in urban housing research from both demand and supply perspectives. In contrast, broader terms like “ownership”, “development”, or “markets” were tested but found to produce overly broad or unfocused results, often outside the scope of data source utilisation. Thus, the final search terms reflect a focused strategy to capture studies that explicitly engage with data-driven housing analysis.
The temporal scope of the search was limited to publications between 2010 and 2021, as the application of emerging data sources (such as big data or social media) was minimal prior to 2010. The search was restricted to English-language publications, and studies in fields unrelated to urban housing—such as medicine, agriculture, biology, and energy—were excluded. After removing duplicates, a total of 459 unique records were retained for screening.

2.2. Study Selection

Inclusion and exclusion criteria were applied to identify relevant studies.
  • Inclusion criteria: studies addressing housing supply and/or demand and applying one or more identifiable data sources.
  • Exclusion criteria: studies outside the scope of this research (e.g., unrelated disciplines), those lacking clarity on data sources, or those not aligned with the study objectives.
During the screening process (Figure 2), titles and keywords were first reviewed, leading to the exclusion of 156 studies. Abstracts of the remaining 303 records were assessed for eligibility, resulting in 153 studies being selected for full-text review. Following full-text screening, 71 studies met all criteria and were included in the final analysis.

2.3. Review Approach

The methodological approach of this study is based on an inductive, systematic review design guided by the PRISMA framework. As illustrated in Figure 1, the review classified studies into typologies of housing research, data sources, and analytical methods, and then cross-examined these typologies to identify patterns and underexplored areas.
In line with the inductive approach, typologies were not pre-defined but emerged from the review of the 71 selected studies [21]. For each article, we extracted information on research objectives, data sources, data collection methods, and analytical techniques. Using thematic coding and grouping, studies were categorised into five housing research themes, five data source types, and commonly used analytical methods. Studies with multiple objectives were assigned to more than one category to reflect overlaps. These typologies were then cross-examined to uncover relationships between research focus, data types, and methods, and to identify research gaps.
This approach allowed the development of a cross-typology framework that links data availability, research objectives, and methodological choices, offering insights into current practices and future opportunities in data-driven housing research.

3. Results

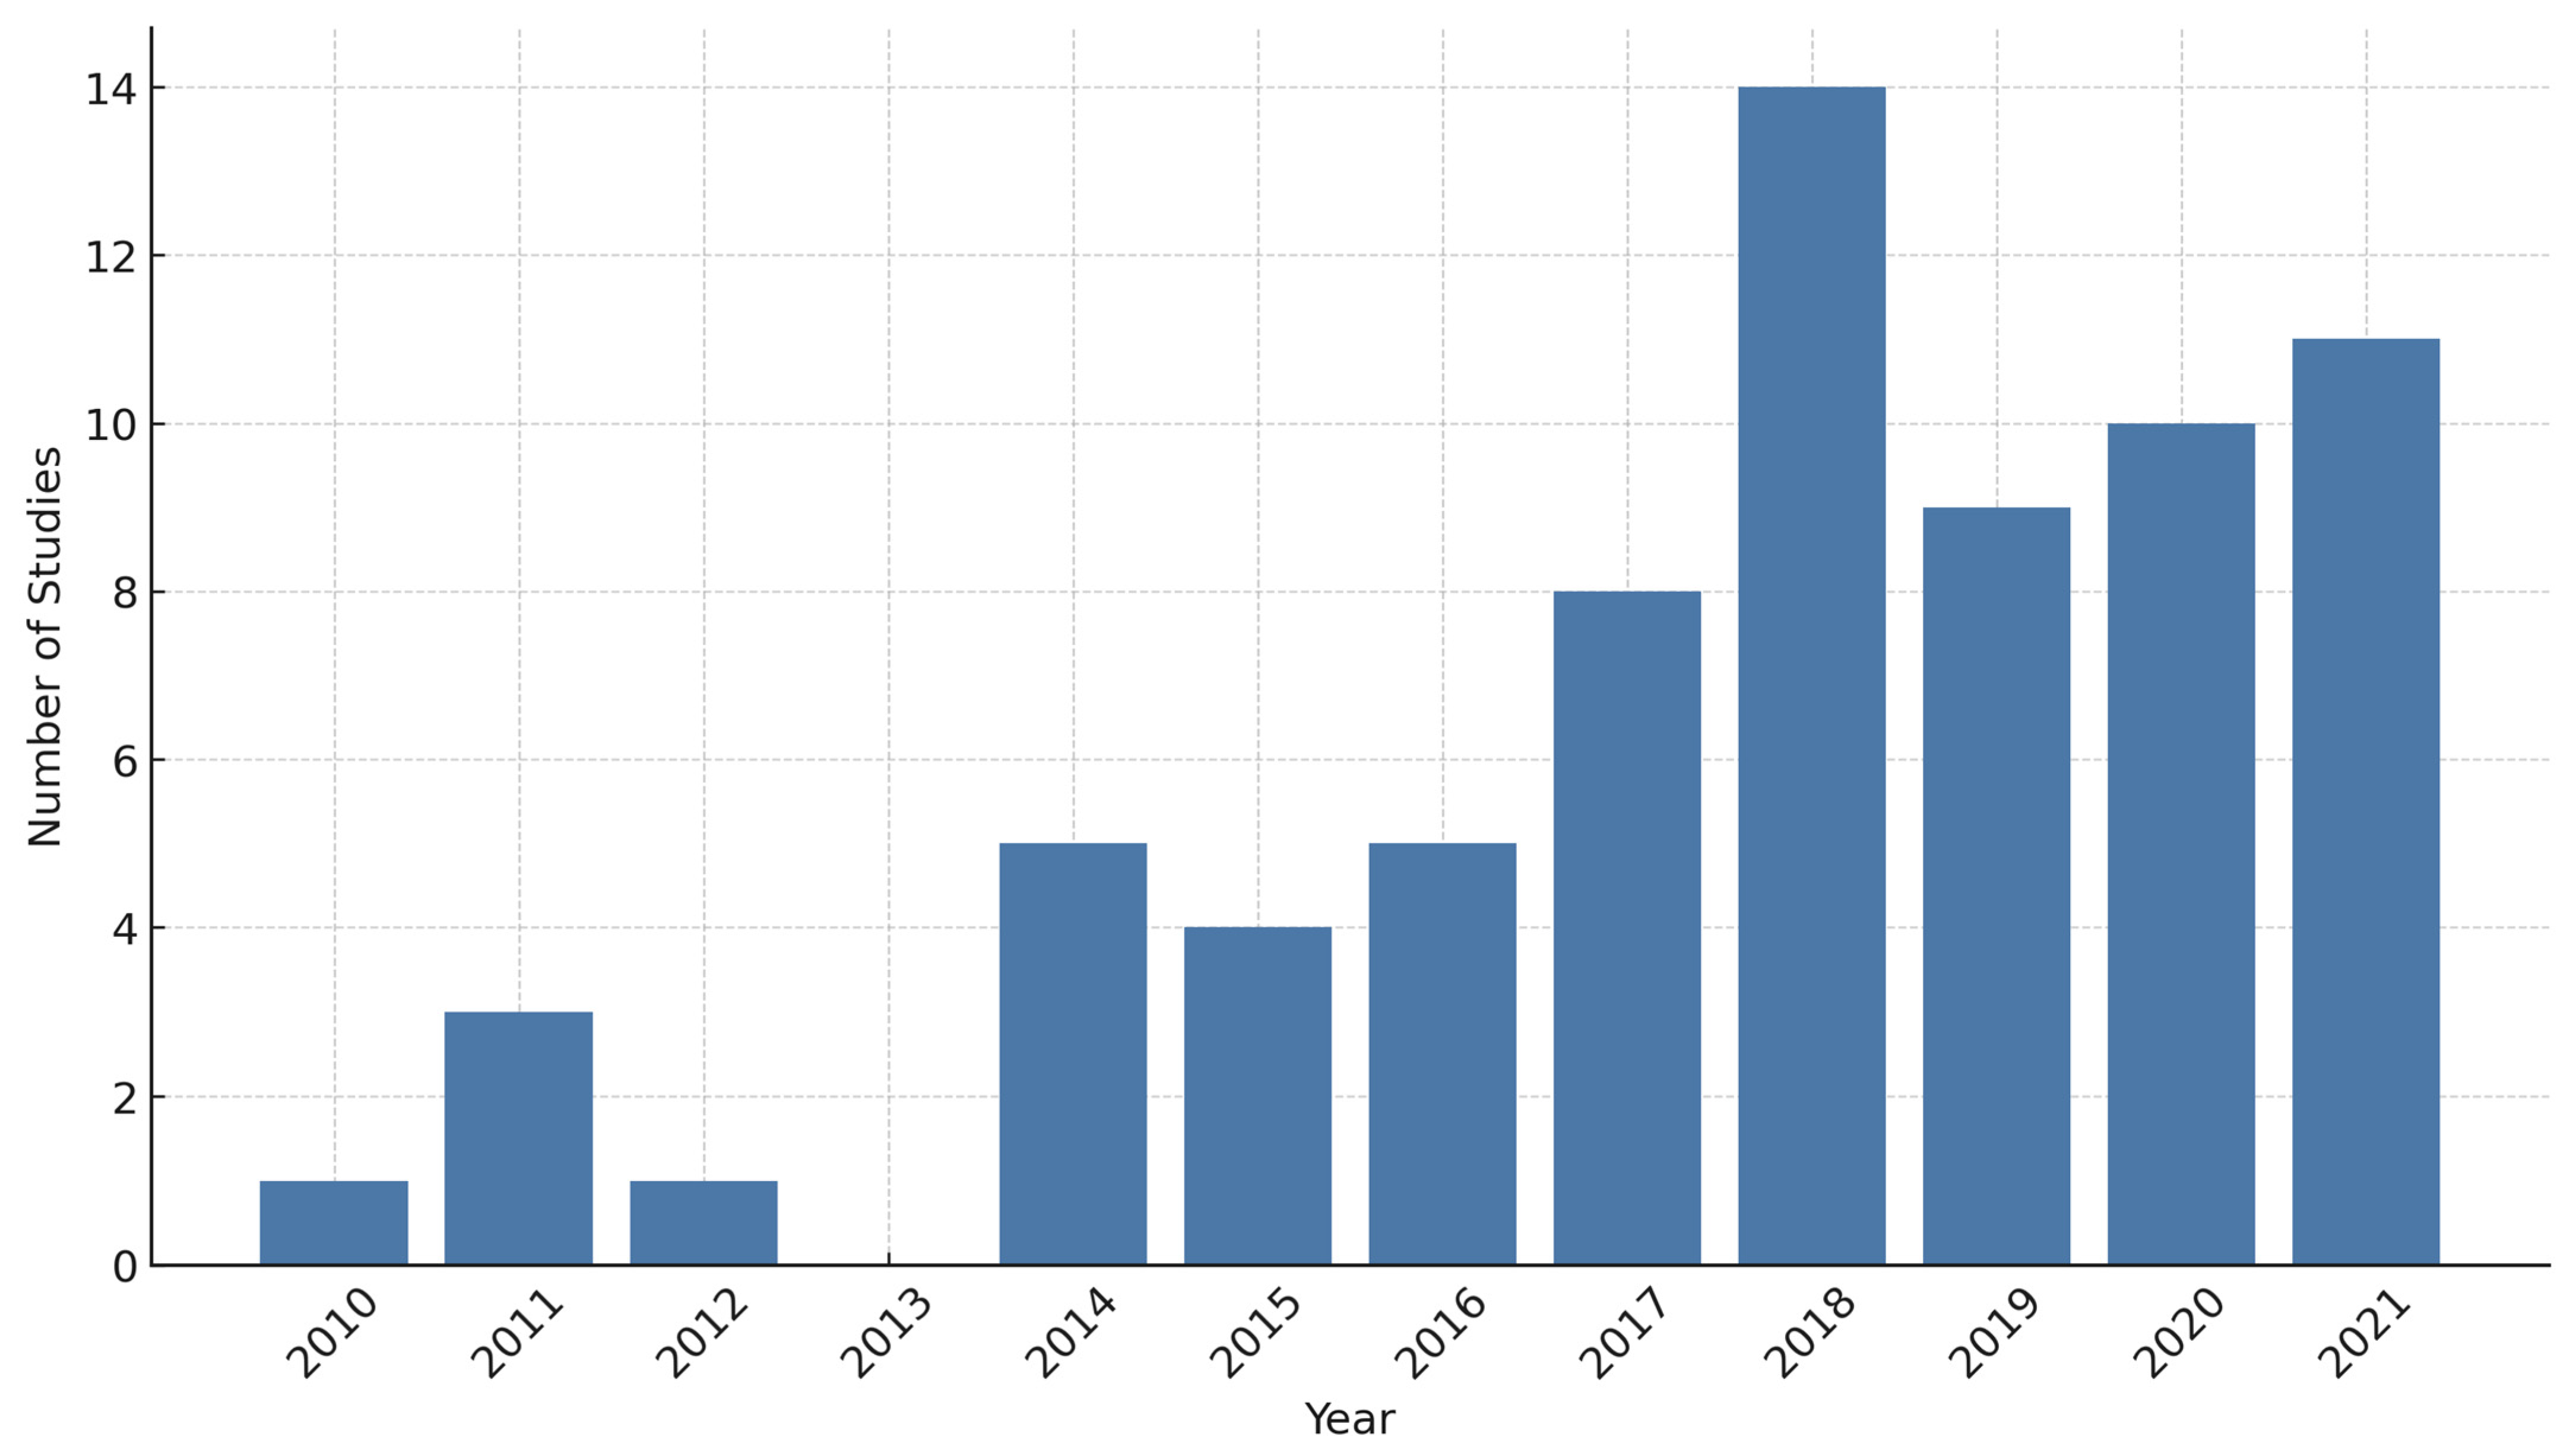
Figure 3 summarises the 71 eligible studies by year of publication. Before 2014, fewer than three studies in housing research were published each year that were within the scope of this review. However, the number of publications in this area has been increasing since 2014. The 2021 research outputs included only those published up to 30th November.

3.1. Housing Research Typology

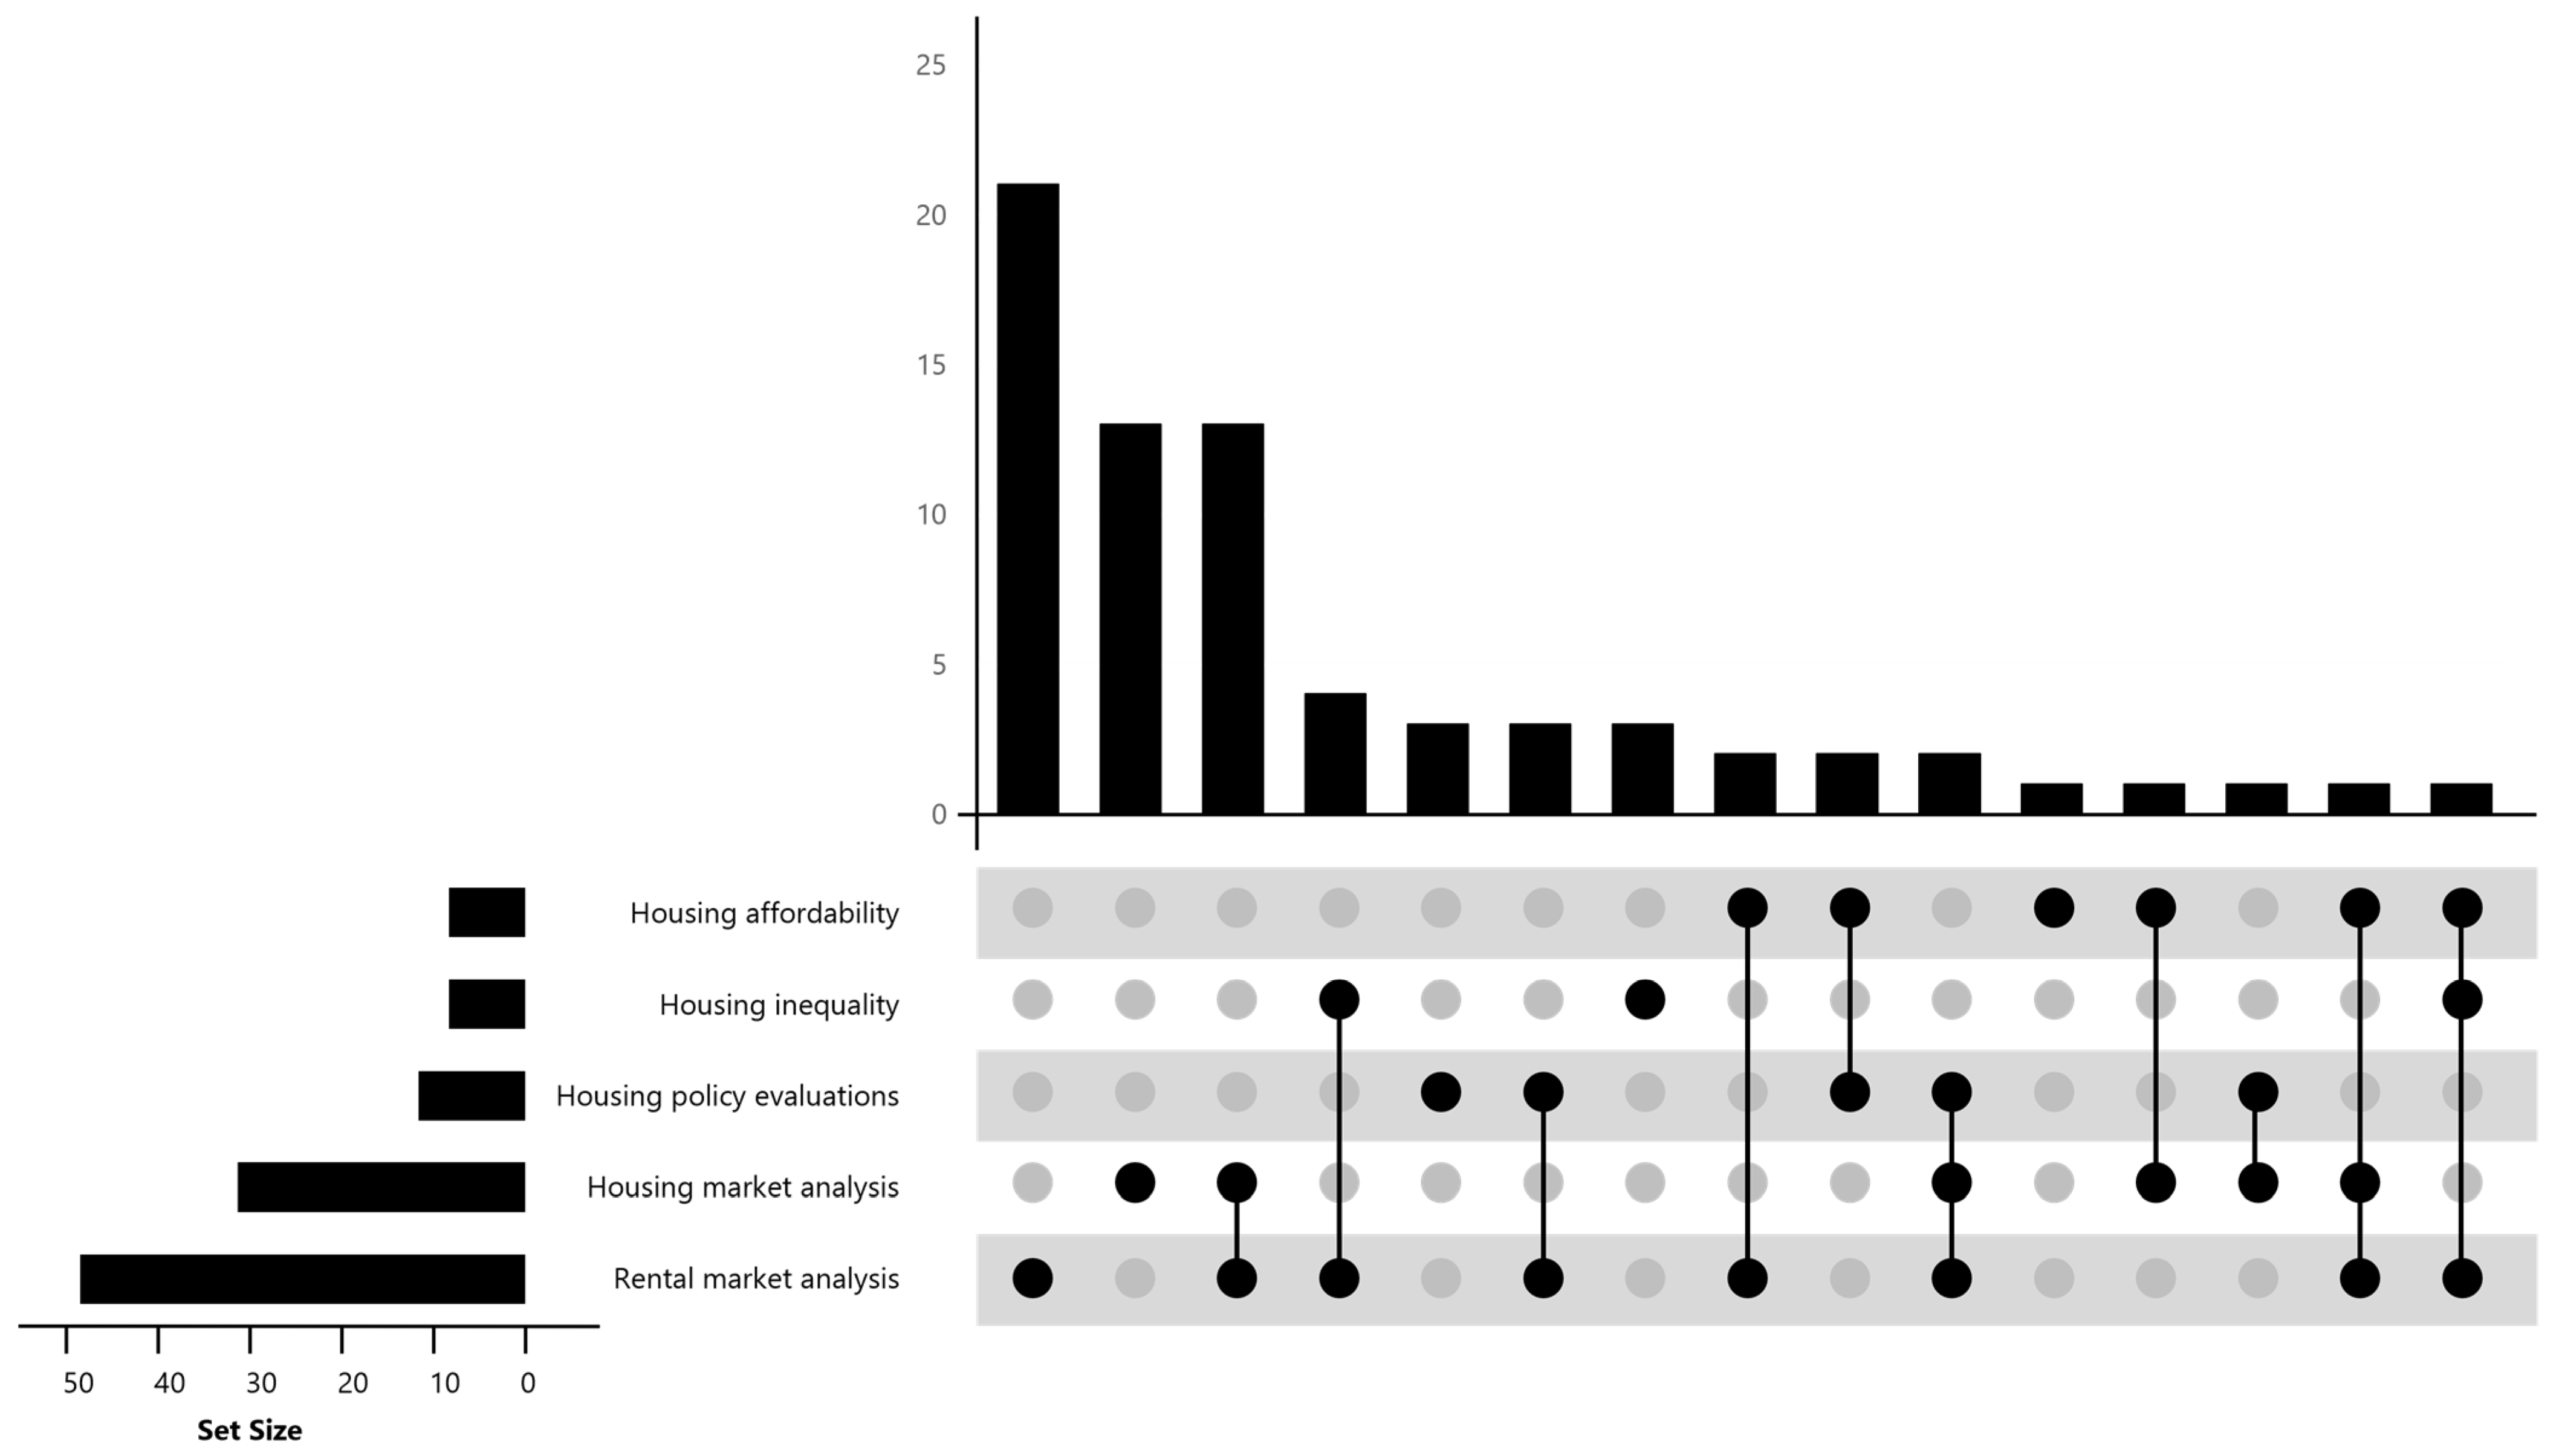
As noted in Section 2.3, the housing research typology was developed by extracting the research objectives of the 71 studies and grouping them into thematic categories. Table 2 illustrates the main research objectives of these. A secondary objective of these studies was also extracted, where available. These objectives were then categorised under main and cross-cutting themes. This information was summarised in an UpSet plot, as shown in Figure 4, to provide a visual summary of the findings. The bars on the left in Figure 4 represent the total number of studies addressing each individual theme, while the top bars show the number of studies covering specific combinations of one or more themes. Figure 4 shows that housing research can be grouped into five themes: (1) housing market analysis that includes analyses of real estate markets; (2) rental market analysis comprising analyses of supply and demand in rental markets; (3) housing policy evaluations that are focused on the impact of regulatory changes on housing; (4) housing affordability, examining the balance between household income and housing expenditure; and (5) housing inequality that examines discrimination and inequality in housing markets. However, it also shows that many of the studies reviewed do not have a unique thematic focus. This plot helps visualise both individual and intersecting research themes across the studies.
As shown in Figure 4, rental market analysis is the most dominant research type. It constitutes 47 (66.1%) out of the total 71 studies in the systematic review and has overlapping content with all other thematic areas. The second most researched type is housing market analysis with 31 studies (43.6%), followed by housing policy evaluation with eleven studies (15.5%), housing inequality with eight studies (11.3%), and housing affordability with eight studies (11.3%). Interestingly, housing inequality has not been researched in association with either housing market analysis or housing policy evaluations. All other types have overlapping contents.

3.1.1. Housing Market Analysis

Housing market analysis describes studies that examine the real estate market, its influential factors, and the dynamics of supply and demand. This research type appeared in 31 studies in the systematic review. The majority of studies in this category focus on price analysis and housing market dynamics, including the analysis of demand, supply, and the balance between the two.
It is interesting to note that the vast majority of studies in this type (80%) investigated formal housing, and formal and informal housing were jointly examined in about 16% of the studies (e.g., [35]). The focus of these studies was mainly on housing supply (e.g., [34]) and the relationship between supply and demand (e.g., [29]). Only one study addressed demand in informal housing [38].

3.1.2. Rental Market Analysis

Rental market analysis includes 48 studies in the systematic review. These studies reflect a wide range of topics including demand for rental properties (e.g., [6]), analysis and prediction of rent prices (e.g., [67]), and discrimination in rental markets (e.g., [75,77]).
Formal housing is discussed in 43.7% of the studies, informal housing in 31.8%, and both formal and informal housing in about 23% of the reviewed studies. A review of the publication years showed that only four studies had been published before 2016 [47,57,58,75], reflecting the emerging focus on informal housing and its growing relevance in research.
Over 50% of the studies are concerned with housing supply, including analyses of rental property provision and pricing. Housing demand comprises 20% of the studies and addresses topics such as factors affecting demand and tenure choice. The remaining 27% of studies examine both demand and supply, often comparing their respective drivers.

3.1.3. Housing Policy Evaluation

Housing policy evaluation is the theme of 11 studies. Major topics include evaluations of regulatory and policy changes (e.g., [71,79]) and analyses of public strategies such as subsidies and rent control (e.g., [83]).
Formal housing appeared in four studies, informal housing in three, and the remaining four studies included both. Attention to housing supply and demand perspectives is equally distributed; however, research on formal housing tended to focus more on supply-side dynamics.

3.1.4. Housing Affordability

Housing affordability is the theme of eight studies and explores the relationship between household income and housing costs (e.g., mortgage for homeowners and rent for renters) [88,89]. Affordability has emerged as a pressing challenge due to rising population pressures and household expenses [88]. Other topics include the implications of informal housing on affordability [73,78].
Formal housing appeared in four studies, informal housing in two, and both forms in two additional studies. Most of these studies focus on housing supply, although some also include demand-side assessments examining whether supply meets demand. One study exclusively focused on housing demand [82].

3.1.5. Housing Inequality

Eight studies addressed housing inequality, examining patterns of unequal access and the underlying factors—such as location and community economic conditions—that contribute to these disparities [85,86,87]. Additional topics include discrimination and bias in data provision and housing supply (e.g., [76]).
Formal housing was the focus in two studies, informal housing in three, and both types in the remaining three. All but one study concentrated on housing supply. Only Talukdar [74] examined the demand perspective.

3.2. Data Source Typology

One of the objectives of this study is to identify the data sources used in housing research. Upon reviewing the 71 eligible studies in the systematic review, the data sources can be grouped into five types: official statistics, non-official statistics, surveys and qualitative data, big data, and social media.
Table 3 summarises the typology of data sources and the supplementary sources often used alongside them and provides illustrative examples from the reviewed studies.

3.2.1. Official Statistics

Official statistics comprise data gathered through official means by government-funded agencies and national statistical institutions to inform societies about their economic, social, environmental, and demographic situation [90]. These statistics form an essential component of a country’s information infrastructure and are applied in a variety of contexts, from policy-making to assessments of social and economic conditions [91,92]. Some scholars consider official statistics to be public goods produced for the benefit of society [93].
Government-administered surveys, censuses, and administrative records are the main sources of official statistics [94]. Although essential, challenges such as limited accessibility and timeliness have encouraged the use of alternative or supplementary data sources, such as big data [90,95,96]. Other issues include declining response rates to official surveys, public budget constraints, and growing user demands that are difficult to meet with official statistics alone [90].
Official statistics were used in 39 of the reviewed studies. These sources include surveys [23,52,72], censuses [24,33,81], and administrative agency data [40,46,78]. Examples include GDP per capita [23]; housing transaction and rental prices [40]; unemployment rate and average incomes [24]; demographic details such as age, gender, age and education [39,67]; and building permits [33].
Some important housing attributes, such as housing type or number of floors, are often absent from official statistics [97]. Therefore, many studies combined official statistics with other data sources, such as non-official statistics, surveys, and qualitative data and big data. For example, additional data include local expenditure [81], number of houses [49], and lending interest rates [25,27]. Supplementary survey data covered features like furnishing, heating, distance to amenities, contract terms, and tenure [24,48]. Big data sources were used to add granular details. such as rent, region, area, and number of bedrooms [5,77], as well as photos [63], listing date [43,45], facilities like wheelchair access and parking [45], and user reviews [80].

3.2.2. Non-Official Statistics

Non-official statistics refers to data collected and published by private sector organisations and non-government entities [98,99,100], including trade associations, professional bodies, consultancies, research institutions, and universities [99]. These data are often viewed as both complementary to and rivals of official statistics [98]. Fifteen studies used non-official statistics. Examples include InsideAirbnb, AirDNA, and Idealista.com [61]. Extracted data from these sources include property rates and mortgage payments [51], crowding and housing quality [85], economic structure and purchasing power [41], transaction data and physical characteristics [62], and proximity to amenities and price histories [32]. Several studies combined non-official statistics with official statistics (see Section 3.2.1). For example, Zhou, Qin, Zhang, Zhao, and Song [42] used both official statistics and big data in their analysis.

3.2.3. Survey and Qualitative Data

Surveys are typically designed for statistical purposes [92,95] and may include both quantitative and qualitative elements. These data are valuable for understanding behaviours, needs, and perceptions across population groups [101]. Challenges include data interpretation, high survey costs, and non-response rates [101,102].
It is important to note that “survey” refers both to the method of data collection and the resulting dataset [95]. In this typology, we refer to the latter.
There is some overlap between surveys and qualitative data, official statistics, and non-official statistics. For instance, some national statistical institutes conduct surveys that would be categorised under official statistics, while private institutions may conduct similar surveys classified as non-official [92].
Surveys and qualitative data sources are used in 19 studies. Data extracted include the following: supply of properties for disadvantaged social groups [35]; tenure characteristics [8,13,36,74,83]; household demographics, property facilities, and infrastructure [10,53,57,74]; property and neighbourhood characteristics [13,38,53]; population growth and urbanisation rates [37]; household preferences in property selection [10,82,84]; and rental payment information [53,58,83].
Common data collection methods include questionnaires [12,13,53,57,82], online surveys [10,82], telephone interviews [84], and face-to-face interviews [8,10,74,84]. Sampling methods for data collection include random sampling [37,58], two-stage cluster sampling [53,74], three-stage sampling [38], systematic sampling [48], and convenience sampling [82].

3.2.4. Big Data

Big data refers to large-scale datasets sourced from the web [96], characterised by high volume, velocity, and variety [92,96,102]. Some argue that big data can complement or even enhance official statistics [90,92,94,102]. Advantages of big data include timeliness, detail, and customisability [96]. A major limitation is the lack of representatives, as web data often lack random sampling properties required for statistical inference [96]. To mitigate this, some studies combine big data with survey-based sources.
There is overlap between big data and non-official statistics, as many private firms use web scraping or crawler algorithms to collect data from online platforms. Examples include Idealista.com, AirDNA [61], and Daft.ie [43,45].
Big data is used in 26 studies. Common data collection methods include web scraping [5,50,63,73] or the use of crawler programs [28,60,65,66,67] to extract data from online rental advertisement platforms [30,60,65] or classified advertisement websites, such as Craigslist [5,66].
Common data obtained from big data sources include textual descriptions of the advertised properties [66,76], attributes of the properties [28,30,44,60,65,69,73,76], rent prices [60,65,69,73,76], location, neighbourhood, and amenities [28,60,69,73,76], and crowding levels [69].

3.2.5. Social Media

Social media platforms (e.g., Facebook, Twitter, Sina Weibo) offer high-volume, user-generated content that can be used to analyse public sentiment, spatial behaviour, and crowdsourced observations [6,28,92,96,103,104]. Social media data are often time-stamped, geo-tagged, and include basic demographic identifiers [104]. While sometimes categorised as a subset of big data, social media sources present distinct methodological challenges, including non-randomness, sampling bias, and underrepresentation of certain populations [96].
Social media data were used in combination with big data in several studies to gather information such as check-in locations, photos, timestamps, and points of interest [6,28].

3.3. Anaytic Methods Used in Housing Research

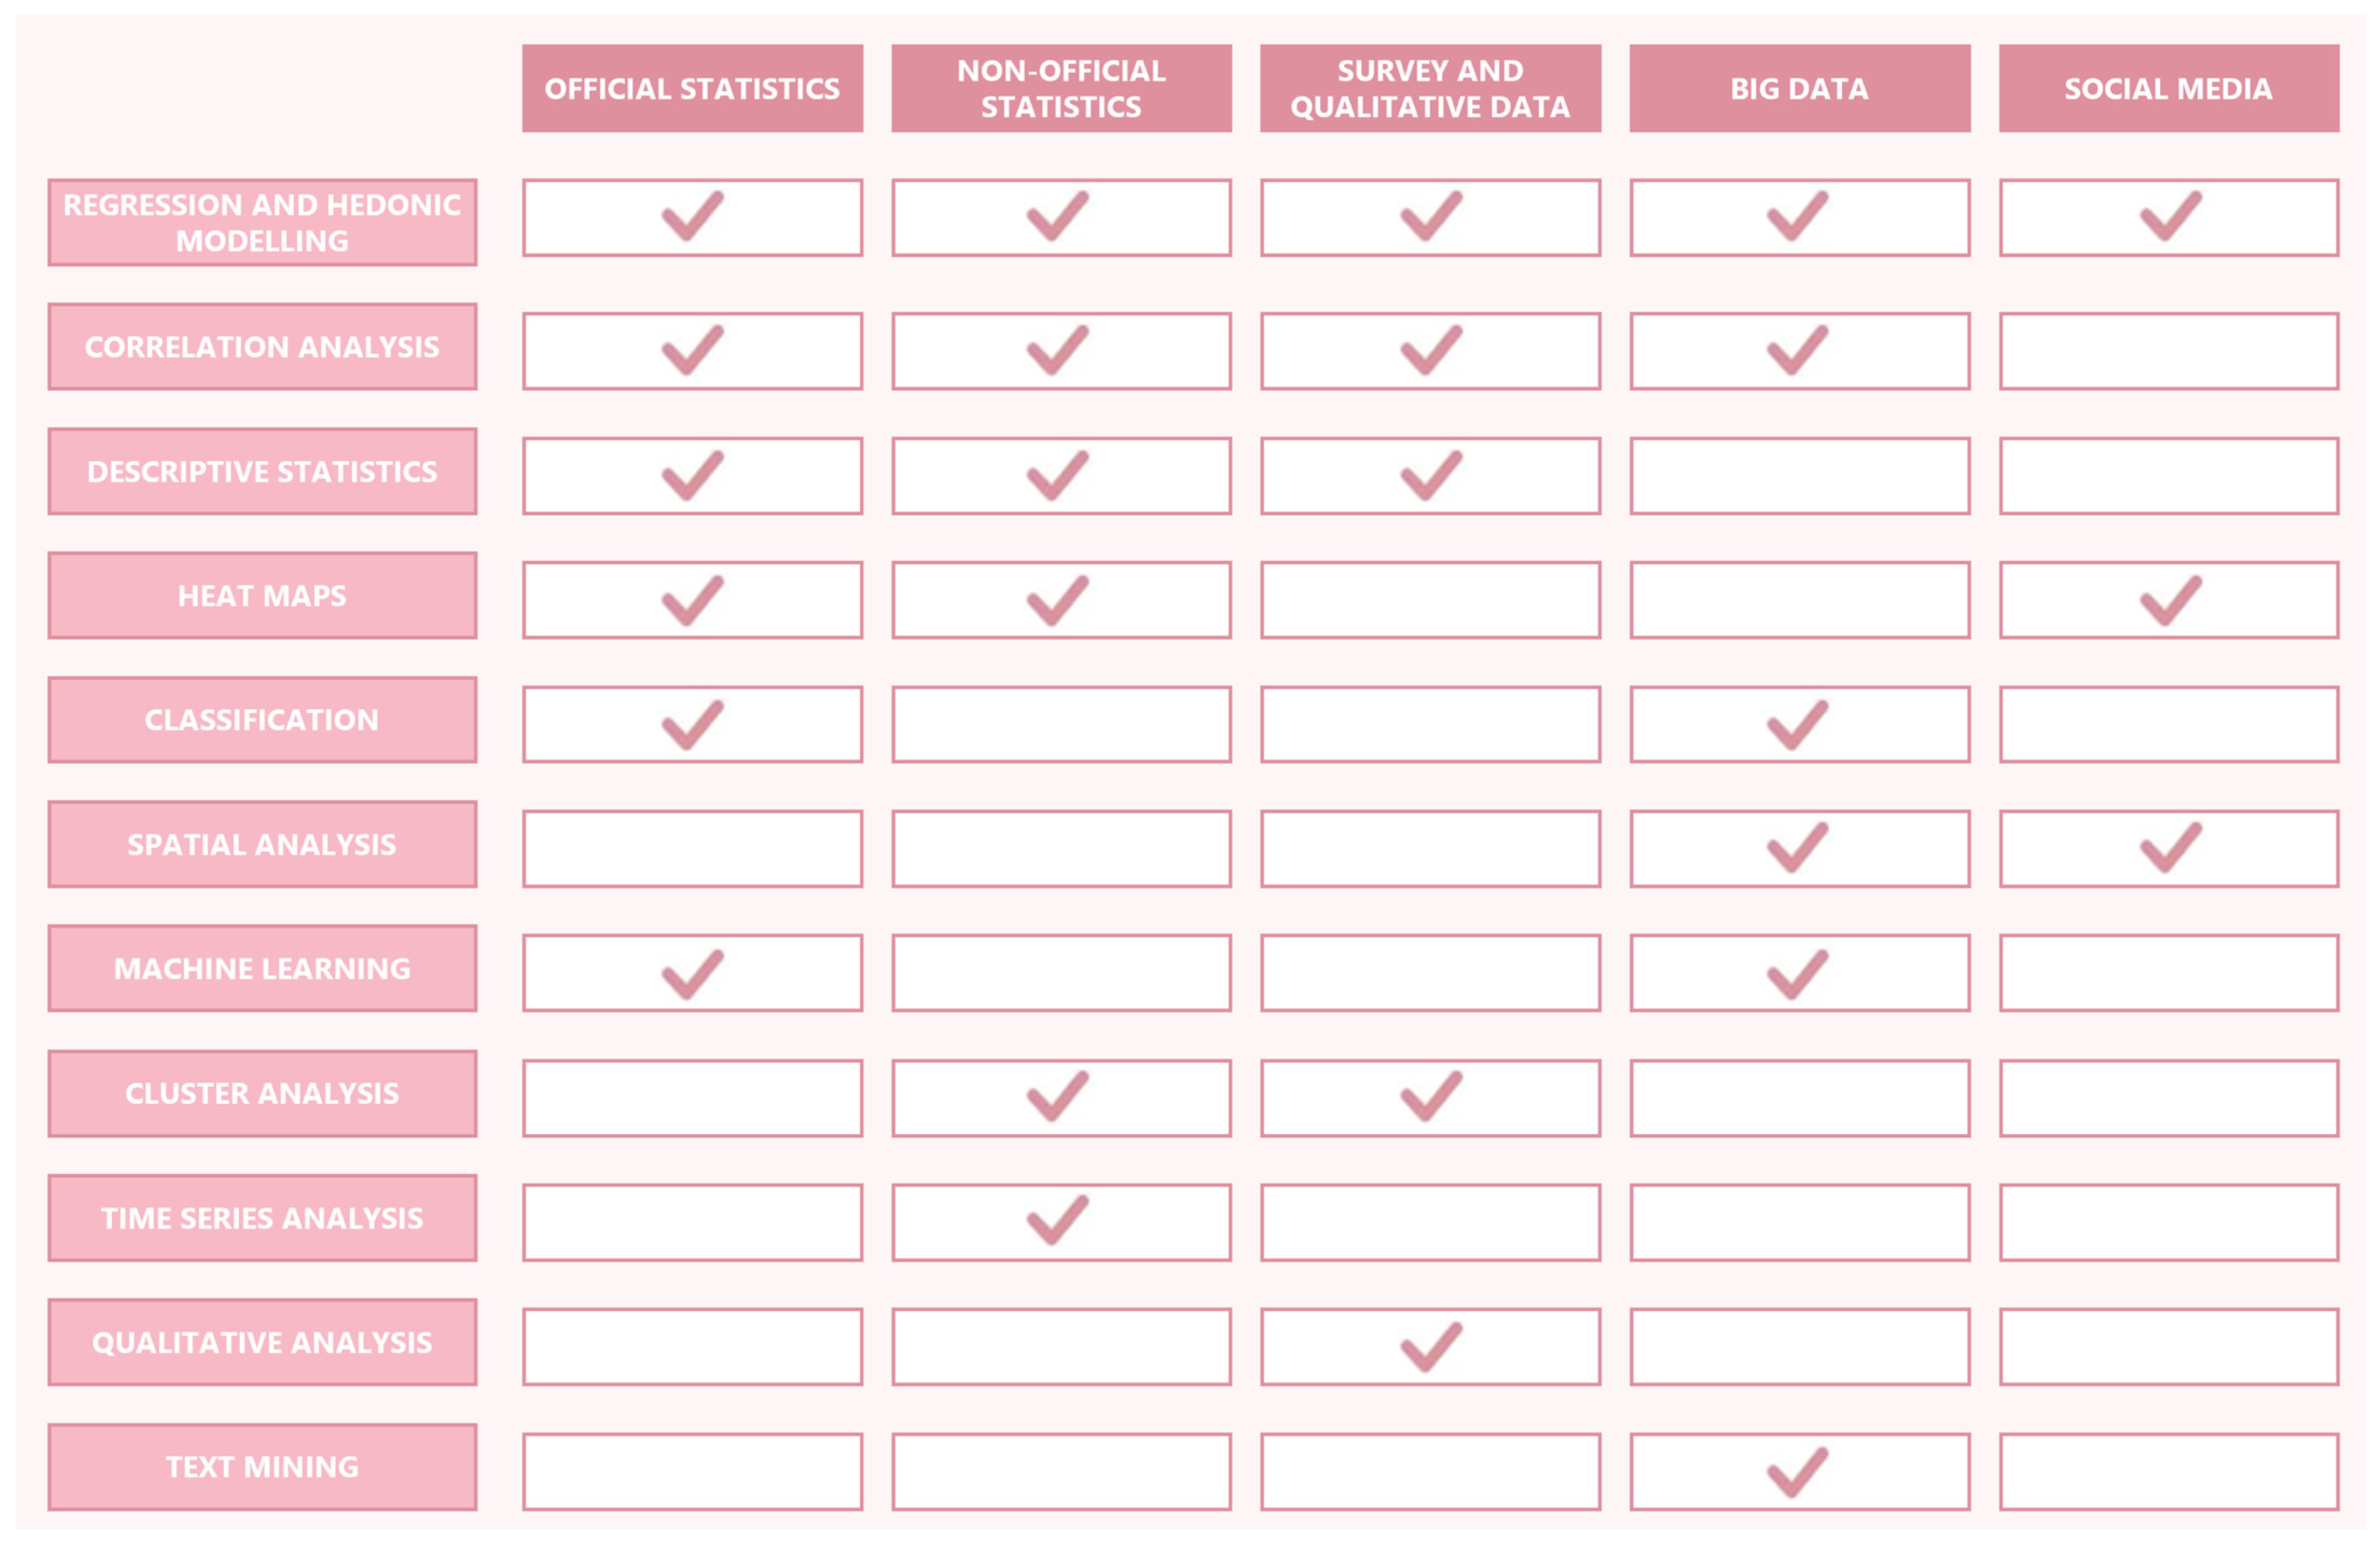
Figure 5 presents a list of analytical methods applied within the reviewed studies. These are cross-tabulated in relation to the five major data source types discussed above: official statistics, non-official statistics, surveys and qualitative data, big data, and social media. A check mark (√) indicates that the corresponding method was applied using the given data source. This overview illustrates the methodological diversity and alignment between data types and analysis approaches.
The figure shows that four types of analytical methods were applied across multiple data source types: regression and hedonic modelling, correlation analysis, descriptive statistics, and heatmap. However, our review shows that heat maps are not as commonly applied as the other three methods. Rather, regression and hedonic modelling, correlation analysis, and descriptive statistics have been the most frequently operationalised in housing studies (Table 4).
These methods were applied to generate deeper insight into variable distribution and cross-tabulation (descriptive statistics) and to understand relationships between two numeric variable (correlation analysis) and housing-related outcomes, such as prices (regression and hedonic modelling) [105].
As shown in Figure 5, additional data analysis methods applied in the reviewed studies include cluster analysis, classification, and machine learning. Cluster analysis groups records (observations) into clusters (i.e., groups with similar characteristics) based on the underlying data structure [106,107]. Clustering is commonly used for hypotheses generation [107]. Classification assigns records to predefined classes (groups or categories) based on their similarity to a classifier [97,106]. It was used for analysing official statistics and big data [71]. Machine learning methods extract patterns and structures in data using statistical and computational algorithms [108]. These methods were used in studies involving statistics [59] and big data [60,65,66].
Other analytical methods include text mining [69,76], deep learning [59,66], heat maps [6,31,45,61,63], spatial analysis [5,28,44,60,62,86], time series analysis [46] and qualitative analysis [8,10,80,84].

3.4. Formal and Informal Housing Typology

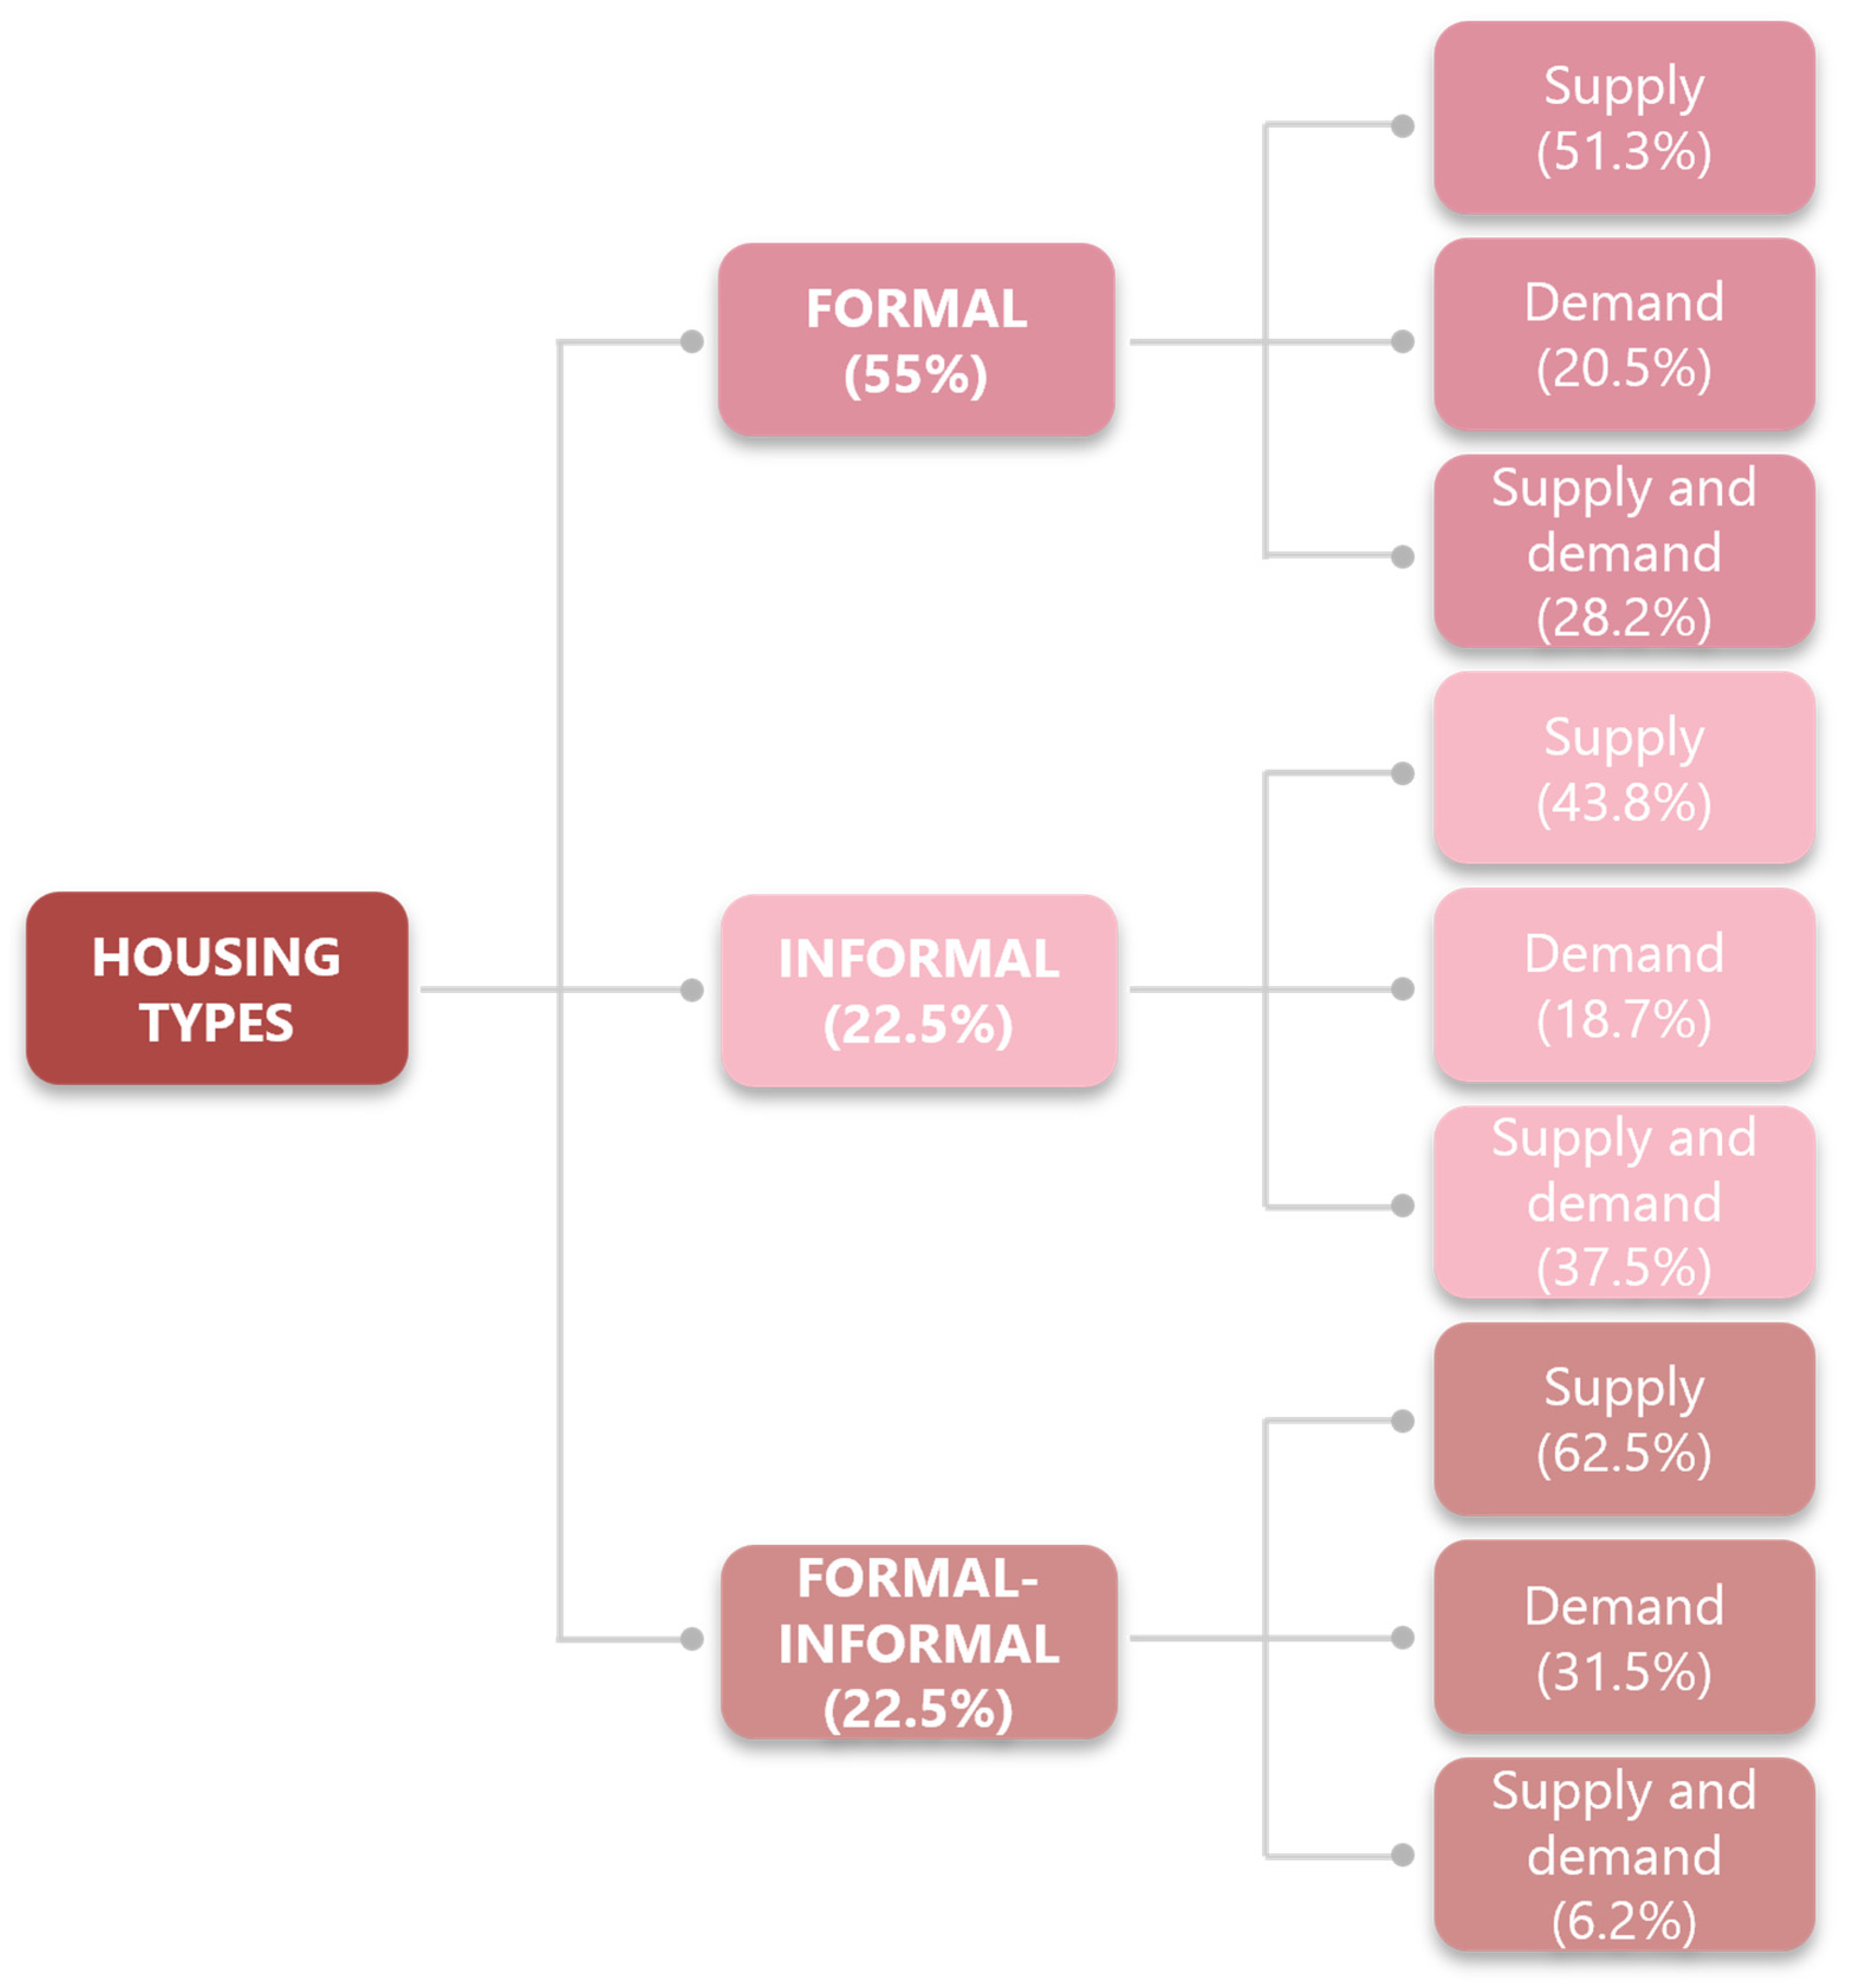
Three housing types—formal housing, informal housing, and formal–informal housing—are identified in the systematic review. Each housing type is investigated through a supply, demand, or supply-and-demand equilibrium perspective. Figure 6 shows the distribution of housing research by housing typology and the analytical perspectives employed.

3.4.1. Formal Housing

Formal housing is typically acquired through formal procedures and eligibility criteria [10]. It is generally regulated and compliant with standard living conditions [9].
In the systematic review, 39 studies focused on formal housing. More than 50% of these studies examined the supply of formal housing. The main themes within this group include price analysis, supply development and its community impacts, and factors influencing supply, such as economic, environmental, or regulatory drivers.
Approximately 20% of studies focused on the demand for formal housing. Key topics included tenure choice and its contributing factors, specifically household income and property characteristics.
Other studies investigated both supply and demand. Main themes include market trends analysis (including price trends), supply–demand equilibrium in housing markets, and factors influencing demand alongside supplier responses.

3.4.2. Informal Housing

Informal housing can be considered a contrast to formal housing [9]. The distinction lies in the modes of acquisition (e.g., informal procedures) and the lack of compliance with regulatory standards or acceptable living conditions. It is argued that informal housing results from broader social and economic changes in societies [20,70]. It comprises a wide range of housing types, from slums in the Global South to shared room tenancies in the Global North [10].
Sixteen studies in our review investigated informal housing. Almost half of these studies examined the supply of informal housing. Major themes include the development of informal housing, the underlying motivations for its growth, and the characteristics of informal dwellings. About 20% of the studies focused on demand, mainly analysing factors that drive demand for informal housing. Approximately 37% of the studies addressed both supply and demand, focusing on drivers of informal housing development, such as high demand, economic pressures, and regulatory constraints.

3.4.3. Formal–Informal Housing

The concepts of formal and informal housing are not mutually exclusive [109,110] and can be considered as points along a continuum. Therefore, some studies in the literature are best categorised as examining “formal–informal” housing.
There were 16 such studies, most of which (62%) focused on the supply perspective. Major themes in this group include housing price analysis, the impact of prices on informal housing development, and the role of online platforms in shaping the housing markets. These platforms are shown to provide new market opportunities, influence tenure choices, and contribute to discrimination and bias in housing access.
Approximately 30% of the studies focused on demand for formal–informal housing, mainly discussing factors influencing housing demand and choice. Only one study addressed both supply and demand [58], analysing housing supply characteristics and their responsiveness to increasing demand.

4. Discussion: A Cross-Examination of Housing Theme, Data Sources, and Analytic Methods

The results of the review demonstrate considerable variations in the utilisation of data sources depending on the research typology. The choice of data sources is also influenced by the housing typology (e.g., formal or informal) as well as by the availability and completeness of the data. Some sources, such as official statistics, are used more frequently, whereas others, such as social media data, have a limited presence in housing research. Similarly, the choice of analytical method is shaped by the characteristics of available data and by the specific research objectives and hypotheses. This section synthesises the application of data sources and analytical methods in the reviewed literature and cross-examines the typologies identified in the previous sections.

4.1. Application of Data Sources in Housing Research

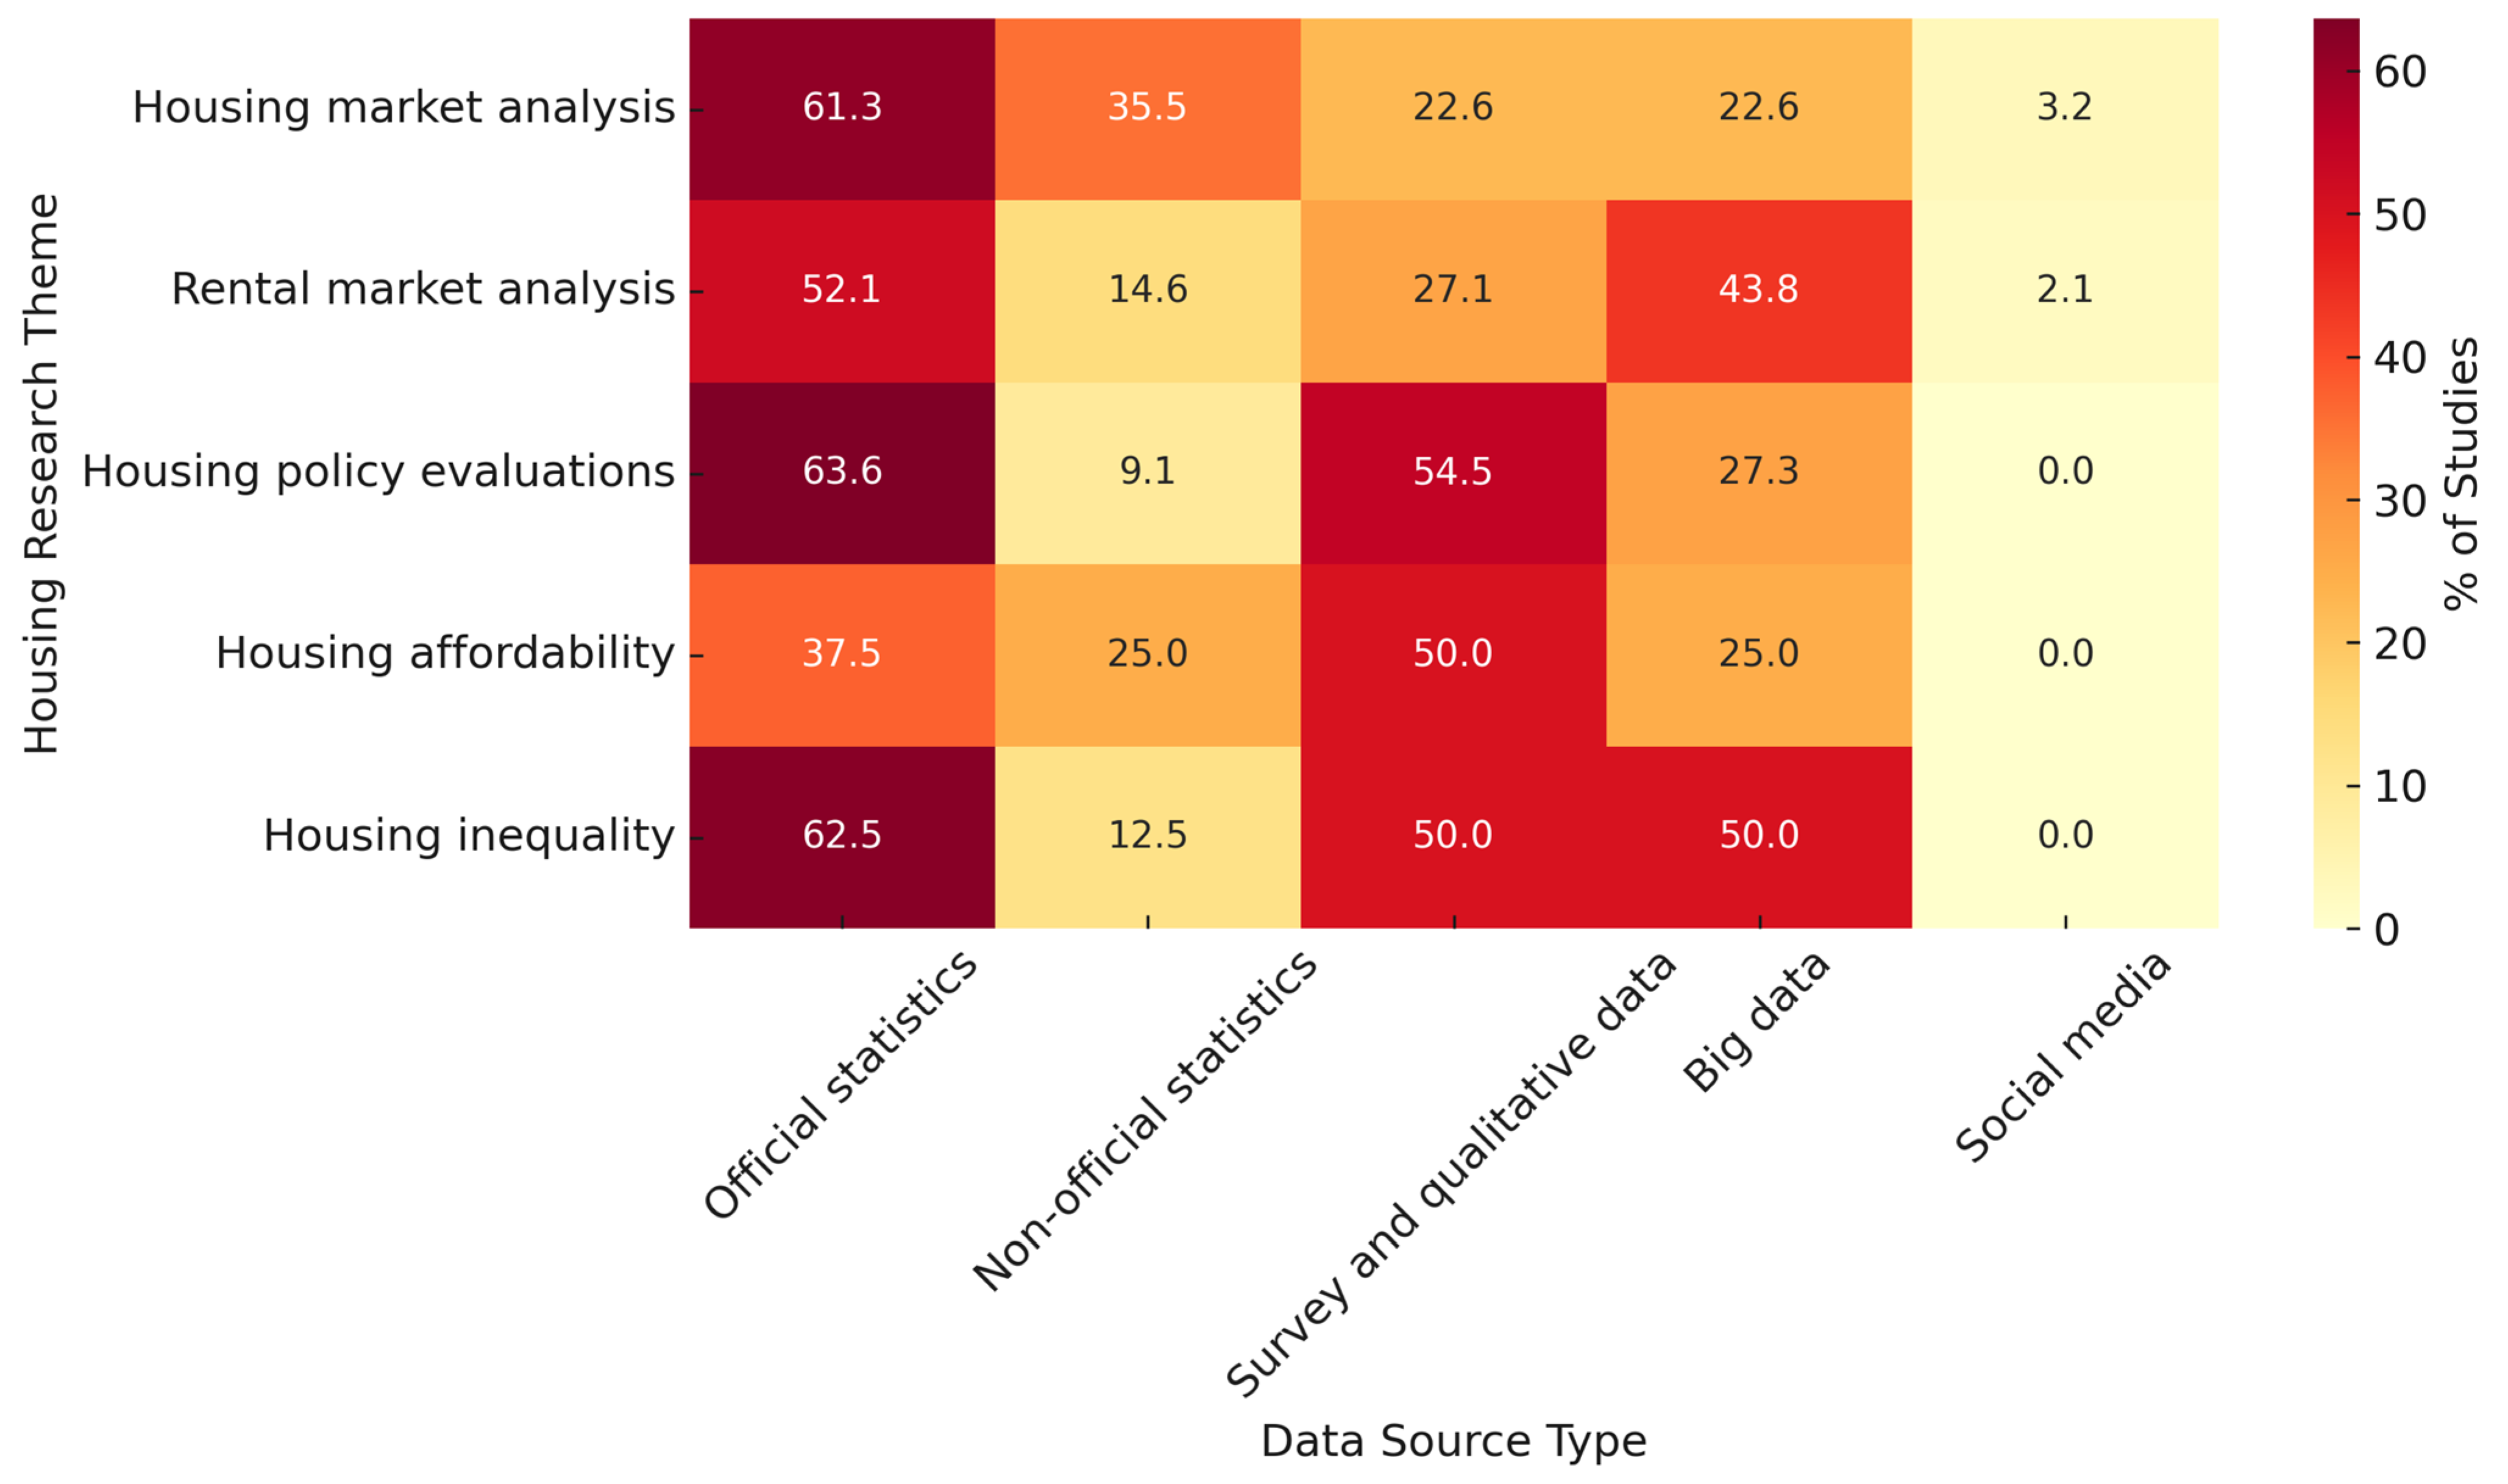
To explore how data availability shapes the research focus, a heatmap was developed to visualise the alignment between data source types and housing research themes. Figure 7 presents the percentage distribution of studies using each data source (official statistics, non-official statistics, surveys and qualitative data, big data, and social media) across the five identified research themes. This cross-tabulation reveals patterns in data usage, including the widespread reliance on official statistics in housing market and policy evaluation studies and the relative underutilisation of big data and social media across most themes.
Official statistics were found to be the most dominant source of data in four of the five research themes considered in this study: housing market analysis, rental market analysis, housing policy evaluations, and housing inequality (Figure 6). The choice of data type is largely determined by the research typology and objectives. In some studies, official statistics serve as the only source of data (e.g., [23,33]), while in others, they are supplemented with big data (e.g., Boeing and Waddell [5]), surveys, and qualitative data (e.g., Besbris and Faber [86]), or non-official statistics (e.g., Mei, Hite, and Sohngen [29]).
The use of big data and surveys and qualitative data is also substantial. Each has been used as a primary data source, such as in Chen, Liu, Li, Liu, and Xu [65] for big data, and Gurran, Pill, and Maalsen [8] for surveys, or in combination with other sources. Big data is frequently applied in rental market analysis and housing inequality, whereas surveys and qualitative data are prevalent in housing policy evaluation, housing affordability, and housing inequality research.
In contrast, non-official statistics are used less frequently than official statistics, big data, or surveys. Their application is concentrated in housing market analysis, with moderate-to-low usage in other research areas.
Finally, the use of social media in housing research remains very limited, with only two studies—Lifang, Ting, Yang, and Li [6] and Wu, Ye, Ren, Wan, Ning, and Du [28]—utilising it to collect check-in related data for housing and rental market analysis.

4.2. Analytic Methods and Data Source Types

The analysis of methodological patterns in the reviewed literature reveals a strong link between the choice of analytical method and the characteristics of the data source. As noted earlier (see Section 3.3), methods such as regression analysis and descriptive statistics are widely used across multiple data types due to their versatility and ease of application. However, the discussion here highlights how data-specific constraints—such as structure, granularity, and completeness—shape methodological decisions.
For instance, official statistics, often structured and longitudinal, lend themselves well to traditional econometric approaches like regression and correlation analysis [105]. In contrast, big data, with its unstructured and high-frequency nature, is more commonly analysed using machine learning, text mining, and clustering techniques, reflecting a shift toward data-driven discovery. Surveys and qualitative data often employ descriptive statistics, index construction, or thematic analysis, reflecting their depth and contextual richness.
Despite the growing availability of non-traditional data types, the adoption of advanced analytical techniques remains limited in housing research. The relatively low use of deep learning, spatial-temporal models, and natural language processing suggests that the methodological potential of newer data sources—particularly big data and social media—remains underutilised.

4.3. Use of Data Source Across Housing Types

Table 5 summarises the data sources used in research on the three housing types, disaggregated by supply, demand, and combined supply–demand perspectives. Note that most studies utilised more than one data source, and therefore the percentages across data source type do not sum to 100%.
Formal housing is the most prominently studied housing type in the literature, representing 55% of the articles reviewed. Informal housing and formal–informal housing each represent 22.5%, indicating a significant gap in attention relative to formal housing. This discrepancy may be attributed to limited or unavailable data on informal housing, particularly in official statistics.
While all three housing types have drawn on official statistics, studies on informal and formal–informal housing more often relied on alternative data sources, such as big data and surveys and qualitative data, which differ in terms of collection method and data characteristics. This pattern suggests that official sources alone are often insufficient to study these housing types, necessitating the integration of supplementary or non-traditional datasets.
Across all housing types, supply-focused studies dominate, particularly for formal housing (51.3%) and formal–informal housing (62.5%). This may reflect the relative availability and structure of supply-side data, especially from official sources. In contrast, studies focusing on housing demand tend to rely more heavily on surveys and qualitative data, likely due to the difficulty of obtaining demand-side insights through administrative or automated data channels.

4.4. Big Data for Forecasting in Housing Strategic Planning

Big data plays a critical role in enhancing forecasting for housing strategic planning by enabling more granular, timely, and dynamic insights. Academic studies highlight that big data—sourced from real estate platforms, mobile devices, and social media—can capture real-time trends in demand and supply, migration patterns, and socio-spatial behaviours that are often missed by traditional data sources [111,112]. As illustrated in Figure 7, big data remains underutilised across most housing research typologies. While traditional data sources are typically updated infrequently, big data provides high-frequency updates, thereby improving responsiveness in policy design and scenario modelling [113]. Moreover, the application of machine learning techniques applied to big data has been shown to enhance predictive accuracy, particularly in housing price forecasting and demand estimation [114]. By integrating big data into strategic planning, urban policymakers can better anticipate housing needs, detect emerging affordability issues, and design more targeted and timely interventions.

5. Conclusions

By linking research types with corresponding data sources and analytical methods, this study plays a crucial role in addressing the global housing crisis. Firstly, it enables researchers and policymakers to identify the specific types of data needed to investigate distinct housing phenomena. This knowledge empowers them to allocate efforts and resources more effectively, ensuring that research is targeted toward areas most relevant to the crisis. Secondly, this study highlights critical data gaps in housing research—an important finding in a field where data accuracy and completeness are paramount. Identifying these gaps allows researchers to explore new pathways to obtain accessible and reliable data, thereby creating a more robust foundation for housing analysis. Lastly, the ability to determine appropriate analytical methods for synthesising diverse data types is instrumental in illuminating the multifaceted nature of the housing crisis. Traditional data sources may not capture the nuances of contemporary housing trends—this is where non-traditional data sources, as examined in this study, become invaluable.
In essence, this study is not only about understanding the particulars of research typologies and data sources but about addressing a crisis that affects millions of lives. The emergence of non-traditional data sources, as highlighted in this review, represents a significant opportunity to gain fresh, timely insights into housing supply and demand trends. These insights are essential for informing policies and interventions that can mitigate the challenges posed by the global housing crisis. Thus, the urgency of this research is underscored by its potential to contribute meaningfully to the theoretical and practical frameworks needed to address this pressing global issue.

5.1. Importance of Data Sources in Housing Research

Data sources are critically important for housing research. The dynamic nature of housing markets requires reliable, timely, and sustainable data sources that can be effectively analysed. A clear understanding of the availability, limitations, and characteristics of each data source assists researchers in navigating the challenges of identifying and obtaining appropriate data.
While traditional data sources, such as official statistics, are widely used in housing research, emerging data sources—with their large volumes and greater flexibility—offer new perspectives. This is especially important for underexplored topics, such as informal housing or, more specifically, demand for both formal and informal housing types. Big data sources have increasingly been employed in housing studies in recent years; however, other high-volume sources—such as social media—have had only limited uptake. In many cases where big data is used, it serves as a supplementary rather than primary data source. This pattern points to a gap in the utilisation of high-volume, high-velocity, and high-variation data for housing research. Addressing this gap offers the potential to yield richer insights into under-researched areas, particularly demand for informal housing.

5.2. Research Gaps in Informal Housing and Underutilisation of Emerging Data Sources

A notable research gap identified in this study is the limited attention to informal housing and to demand-side analyses for both formal and informal housing types. This presents an opportunity for future studies to explore these areas in greater depth, particularly through the use of emerging data sources, such as big data.
The underutilisation of social media data in housing research is another key observation. While big data has gained popularity over the past decade, social media remains largely unexploited and is typically used only as a supplementary data source. Investigating the reasons behind this underutilisation—and exploring its potential to enrich housing research—represents a promising avenue for future work.
These newer data sources also have the potential to reinvigorate established research themes, such as housing affordability, which often face data limitations when relying mainly on official sources. Furthermore, this review not only identifies the most frequently studied housing research themes but also offers guidance for expanding research into less-explored areas, such as housing inequality.
The cross-examination of data sources and research typologies reveals opportunities to better exploit underused data types in addressing urgent housing challenges. The findings of this study offer a strong evidence base for urban planners and policymakers, enabling them to identify alternative data sources for specific housing challenges and to develop more informed policy responses. A promising future research direction lies in the development of best practices for data integration, as well as in examining the practical implications of housing research for urban governance and planning. This points to a broader methodological gap: while housing studies increasingly incorporate diverse data, their analytical frameworks have not always evolved in parallel. Future research could benefit from methodological innovation tailored to the specific affordances of emerging data types. Such methodological advancement is critical not only for improving analytical precision but also for supporting sustainability-oriented housing strategies. Leveraging new data sources in combination with appropriate analytical tools can better inform resilient, equitable, and environmentally conscious housing policy.

5.3. Limitations of the Study and Future Research Directions

This study has several limitations. First, the literature search was limited to English-language publications from 2010 to 2021. While this period aligns with the increasing availability of emerging data sources (e.g., big data and social media), it may exclude relevant earlier or non-English studies.
Second, the review employed a focused set of search terms—such as “formal”, “informal”, “rental”, and “shared”—which were refined through multiple trial searches to align with the study’s aim. While this ensured conceptual alignment, it may have inadvertently narrowed the scope, potentially omitting relevant studies using terms such as “ownership”, “development”, or “markets”. Consequently, the observed emphasis on rental markets may in part reflect the influence of the selected search terms rather than the actual distribution of research themes in the broader literature.
Third, the five research themes identified in this review were developed inductively from the included studies. As such, there is some degree of conceptual overlap—particularly between rental market and general housing market analysis, and between affordability, inequality, and housing policy. While this reflects how studies frame their research in practice, it also limits the precision of mutually exclusive categorisation. Future reviews may consider applying a more theory-driven or policy-aligned classification scheme to offer alternative analytical lenses.
Fourth, the review examined typologies of housing research, data sources, and analytical methods but did not undertake meta-analytical techniques, such as heterogeneity tests or sensitivity analyses. Future research could incorporate these quantitative methods to improve analytical robustness and depth.
Lastly, while this study presents a structured overview of how different data sources are used in housing research, it does not assess the quality, resolution, or policy relevance of those data. Further studies could investigate these dimensions more closely—especially in underexplored areas such as informal housing and demand-side dynamics. Thus, while our selection criteria were deliberately designed to support a typology-driven synthesis, we acknowledge that the findings represent a specific slice of the housing research landscape rather than its full breadth.

Supplementary Materials

The following supporting information can be downloaded at https://www.mdpi.com/article/10.3390/su17114809/s1, Table S1: PRISMA 2020 Checklist.

Author Contributions

Conceptualisation, L.K.; methodology, S.N. and L.K.; formal analysis, S.N.; writing—original draft preparation, S.N., L.K. and F.Y.H.; writing—review and editing, L.K., F.Y.H., D.A. and D.L.; supervision, L.K.; project administration, L.K.; funding acquisition, L.K., D.A. and D.L.; All authors have read and agreed to the published version of the manuscript.

Funding

This research was funded by Monash University: Monash Data Futures Institute (MDFI) 2021 Seed Grants Program and the APC was waived by the journal. We thank them for their support.

Institutional Review Board Statement

Not applicable.

Informed Consent Statement

Not applicable.

Data Availability Statement

Datasets can be sourced from the cited references.

Conflicts of Interest

The authors declare no conflicts of interest.

References

  1. Nasreen, Z.; Ruming, K. Struggles and opportunities at the platform interface: Tenants’ experiences of navigating shared room housing using digital platforms in Sydney. J. Hous. Built Environ. 2021, 37, 1537–1554. [Google Scholar] [CrossRef]
  2. Rae, A. Online Housing Search and the Geography of Submarkets. Hous. Stud. 2015, 30, 453–472. [Google Scholar] [CrossRef]
  3. Sawyer, S.; Crowston, K.; Wigand, R.T. Digital assemblages: Evidence and theorising from the computerisation of the US residential real estate industry. New Technol. Work. Employ. 2014, 29, 40–56. [Google Scholar] [CrossRef]
  4. Fields, D.; Rogers, D. Towards a Critical Housing Studies Research Agenda on Platform Real Estate. Hous. Theory Soc. 2021, 38, 72–94. [Google Scholar] [CrossRef]
  5. Boeing, G.; Waddell, P. New Insights into Rental Housing Markets across the United States: Web Scraping and Analyzing Craigslist Rental Listings. J. Plan. Educ. Res. 2016, 37, 457–476. [Google Scholar] [CrossRef]
  6. Lifang, Z.; Ting, Y.; Yang, L.; Li, Z. Analyses on the Spatial Distribution Characteristics of Urban Rental Housing Supply and Demand Hotspots Based on Social Media Data. In Proceedings of the 2020 5th IEEE International Conference on Big Data Analytics (ICBDA), Xiamen, China, 8–11 May 2020; pp. 126–130. [Google Scholar]
  7. Maalsen, S.; Shrestha, P.; Gurran, N. Informal housing practices in the global north: Digital technologies, methods, and ethics. Int. J. Hous. Policy 2022, 22, 1–9. [Google Scholar] [CrossRef]
  8. Gurran, N.; Pill, M.; Maalsen, S. Hidden homes? Uncovering Sydney’s informal housing market. Urban Stud. 2021, 58, 1712–1731. [Google Scholar] [CrossRef]
  9. Shrestha, P.; Gurran, N.; Maalsen, S. Informal housing practices. Int. J. Hous. Policy 2021, 21, 157–168. [Google Scholar] [CrossRef]
  10. Nasreen, Z.; Ruming, K.J. Informality, the marginalised and regulatory inadequacies: A case study of tenants’ experiences of shared room housing in Sydney, Australia. Int. J. Hous. Policy 2021, 21, 220–246. [Google Scholar] [CrossRef]
  11. Ferreri, M.; Sanyal, R. Digital informalisation: Rental housing, platforms, and the management of risk. Hous. Stud. 2021, 37, 1035–1053. [Google Scholar] [CrossRef]
  12. Alkan, Ö.; Karaaslan, A.; Abar, H.; ÇElİK, A.K.; Oktay, E. Factors affecting motives for housing demand the case of a Turkish province. Theor. Empir. Res. Urban Manag. 2014, 9, 70–86. [Google Scholar] [CrossRef]
  13. Opoku, R.A.; Abdul-Muhmin, A.G. Housing preferences and attribute importance among low-income consumers in Saudi Arabia. Habitat Int. 2010, 34, 219–227. [Google Scholar] [CrossRef]
  14. Trubka, R.; Glackin, S. Modelling housing typologies for urban redevelopment scenario planning. Comput. Environ. Urban Syst. 2016, 57, 199–211. [Google Scholar] [CrossRef]
  15. Goodchild, B.; Ferrari, E. Intermediaries and mediators: An actor-network understanding of online property platforms. Hous. Stud. 2021, 39, 102–123. [Google Scholar] [CrossRef]
  16. Pettit, C.; Crommelin, L.; Sharam, A.; Hulse, K. The Potential of New Technologies to Disrupt Housing Policy; Australian Housing and Urban Research Institute Limited: Melbourne, Australia, 2018. [Google Scholar]
  17. Shaw, J. Platform Real Estate: Theory and practice of new urban real estate markets. Urban Geogr. 2020, 41, 1037–1064. [Google Scholar] [CrossRef]
  18. Serin, B. Reviewing the Housing Supply Literature. Available online: https://housingevidence.ac.uk/publications/reviewing-the-housing-supply-literature/ (accessed on 14 April 2025).
  19. Naik, M. Informal Rental Housing Typologies and Experiences of Low-income Migrant Renters in Gurgaon, India. Environ. Urban. ASIA 2015, 6, 154–175. [Google Scholar] [CrossRef]
  20. Maalsen, S. I cannot afford to live alone in this city and I enjoy the company of others: Why people are share housing in Sydney. Aust. Geogr. 2019, 50, 315–332. [Google Scholar] [CrossRef]
  21. Khaire, M.; Muniappa, N. Housing policy research in India: A scoping review and thematic analysis. Int. J. Hous. Mark. Anal. 2022, 15, 339–356. [Google Scholar] [CrossRef]
  22. Page, M.J.; Moher, D.; Bossuyt, P.M.; Boutron, I.; Hoffmann, T.C.; Mulrow, C.D.; Shamseer, L.; Tetzlaff, J.M.; Akl, E.A.; Brennan, S.E.; et al. PRISMA 2020 explanation and elaboration: Updated guidance and exemplars for reporting systematic reviews. BMJ 2021, 372, n160. [Google Scholar] [CrossRef]
  23. Shosha, B.; Anamali, A.; Zisi, A. Anomalies of the housing market in Albania. Univers. J. Account. Financ. 2021, 9, 275–284. [Google Scholar] [CrossRef]
  24. Nistor, A.; Reianu, D. Determinants of housing prices: Evidence from Ontario cities, 2001–2011. Int. J. Hous. Mark. Anal. 2018, 11, 541–556. [Google Scholar] [CrossRef]
  25. Kuang, W.; Liu, P. Inflation and House Prices: Theory and Evidence from 35 Major Cities in China. Int. Real Estate Rev. 2015, 18, 217–240. [Google Scholar] [CrossRef]
  26. Osei, M.J.; Winters, J.V. Labor Demand Shocks and Housing Prices Across the United States: Does One Size Fit All? Econ. Dev. Q. 2019, 33, 212–219. [Google Scholar] [CrossRef]
  27. Trofimov, I.D.; Aris, N.M.; Xuan, D.C.D. Macroeconomic and Demographic Determinants of Residential Property Prices in Malaysia. Zagreb Int. Rev. Econ. Bus. 2018, 21, 71–96. [Google Scholar] [CrossRef]
  28. Wu, C.; Ye, X.; Ren, F.; Wan, Y.; Ning, P.; Du, Q. Spatial and Social Media Data Analytics of Housing Prices in Shenzhen, China. PLoS ONE 2016, 11, e0164553. [Google Scholar] [CrossRef]
  29. Mei, Y.; Hite, D.; Sohngen, B. Demand for urban tree cover: A two-stage hedonic price analysis in California. For. Policy Econ. 2017, 83, 29–35. [Google Scholar] [CrossRef]
  30. Gao, X.; Asami, Y. Preferential size of housing in Beijing. Habitat Int. 2011, 35, 206–213. [Google Scholar] [CrossRef]
  31. Ahsan, M.M.; Sadak, C. Exploring housing market and urban densification during COVID-19 in Turkey. J. Urban Manag. 2021, 10, 218–229. [Google Scholar] [CrossRef]
  32. Chu, J.; Duan, Y.; Yang, X.; Wang, L. The Last Mile Matters: Impact of Dockless Bike Sharing on Subway Housing Price Premium. Manag. Sci. 2021, 67, 297–316. [Google Scholar] [CrossRef]
  33. Hilber, C.A.L.; Rouwendal, J.; Vermeulen, W. Local economic conditions and the nature of new housing supply. J. Econ. Geogr. 2020, 21, 339–366. [Google Scholar] [CrossRef]
  34. Ramli, F.; Zainal, R.; Ali, M. Prediction supply modelling for high-cost housing in Malaysia. Int. J. Supply Chain Manag. 2019, 8, 657–664. [Google Scholar]
  35. Gulyani, S.; Talukdar, D.; Bassett, E.M. A sharing economy? Unpacking demand and living conditions in the urban housing market in Kenya. World Dev. 2018, 109, 57–72. [Google Scholar] [CrossRef]
  36. Rosenthal, S.S. Are Private Markets and Filtering a Viable Source of Low-Income Housing? Estimates from a "Repeat Income" Model. Am. Econ. Rev. 2014, 104, 687–706. [Google Scholar] [CrossRef]
  37. Du, J.; Yang, Y.; Li, D.; Zuo, J. Do investment and improvement demand outweigh basic consumption demand in housing market? Evidence from small cities in Jiangsu, China. Habitat Int. 2017, 66, 24–31. [Google Scholar] [CrossRef]
  38. Liu, H.; Yi, D.; Zheng, S. Small property rights housing in major Chinese cities: Its role and the uniqueness of dwellers. Habitat Int. 2018, 77, 121–129. [Google Scholar] [CrossRef]
  39. Lee, C.-C.; Liang, C.-M.; Chen, J.-Z.; Tung, C. Effects of the housing price to income ratio on tenure choice in Taiwan: Forecasting performance of the hierarchical generalized linear model and traditional binary logistic regression model. J. Hous. Built Environ. 2018, 33, 675–694. [Google Scholar] [CrossRef]
  40. Lee, S.; Shin, K.; Kim, J.-h.; Kim, J.-J. Comparison of Dynamics in the Korean Housing Market Based on the FDW Model for the Periods Before and After the Macroeconomic Fluctuations. J. Asian Arch. Build. Eng. 2014, 13, 117–124. [Google Scholar] [CrossRef]
  41. Belke, A.; Keil, J. Fundamental Determinants of Real Estate Prices: A Panel Study of German Regions. Int. Adv. Econ. Res. 2018, 24, 25–45. [Google Scholar] [CrossRef]
  42. Zhou, X.; Qin, Z.; Zhang, Y.; Zhao, L.; Song, Y. Quantitative Estimation and Spatiotemporal Characteristic Analysis of Price Deviation in China’s Housing Market. Sustainability 2019, 11, 7232. [Google Scholar] [CrossRef]
  43. Agnew, K.; Lyons, R.C. The impact of employment on housing prices: Detailed evidence from FDI in Ireland. Reg. Sci. Urban Econ. 2018, 70, 174–189. [Google Scholar] [CrossRef]
  44. Cui, N.; Gu, H.; Shen, T.; Feng, C. The Impact of Micro-Level Influencing Factors on Home Value: A Housing Price-Rent Comparison. Sustainability 2018, 10, 4343. [Google Scholar] [CrossRef]
  45. Lyons, R.C. The real value of house prices: What the cost of accommodation can tell policymakers. J. Stat. Soc. Inq. Soc. Irel. 2011, 41, 71–91. [Google Scholar]
  46. Ram, Y.; Tchetchik, A. Complementary or competitive? Interrelationships between hotels, Airbnb and housing in Tel Aviv, Israel. Curr. Issues Tour. 2021, 25, 3579–3590. [Google Scholar] [CrossRef]
  47. Ahmad, S. Housing demand and housing policy in urban Bangladesh. Urban Stud. 2014, 52, 738–755. [Google Scholar] [CrossRef]
  48. Ofori, P. Housing poverty in developing countries: Challenges and implications for decent accommodation in Swedru, Ghana. Acta Str. 2020, 27, 57–92. [Google Scholar] [CrossRef]
  49. Carmona, J.; Lampe, M.; Rosés, J. Housing affordability during the urban transition in Spain. Econ. Hist. Rev. 2017, 70, 632–658. [Google Scholar] [CrossRef]
  50. Zou, Z. Examining the Impact of Short-Term Rentals on Housing Prices in Washington, DC: Implications for Housing Policy and Equity. Hous. Policy Debate 2020, 30, 269–290. [Google Scholar] [CrossRef]
  51. Camilleri, D. A long-term analysis of housing affordability in Malta. Int. J. Hous. Mark. Anal. 2011, 4, 31–57. [Google Scholar] [CrossRef]
  52. Önder, K.; Turgut, H. Examination of the Factors Affecting Household Rental Housing Demand Through Data Mining. Eskişeh. Osman. Üniv. İktisadi İdari Bilim. Derg. 2018, 13, 227–238. [Google Scholar] [CrossRef]
  53. De, U.K.; Vupru, V. Location and neighbourhood conditions for housing choice and its rental value. Int. J. Hous. Mark. Anal. 2020, 10, 519–538. [Google Scholar] [CrossRef]
  54. Zheng, X.; Xia, Y.; Hui, E.C.M.; Zheng, L. Urban housing demand, permanent income and uncertainty: Microdata analysis of Hong Kong’s rental market. Habitat Int. 2018, 74, 9–17. [Google Scholar] [CrossRef]
  55. Festus Okoh, A.; Paul Kitson Baffour, A.; Obodai, J. Changing family systems in Ghana and its effects on access to urban rental housing: A study of the Offinso Municipality. J. Hous. Built Environ. 2018, 33, 893–916. [Google Scholar] [CrossRef]
  56. Li, H.; Wei, Y.D.; Wu, Y.; Tian, G. Analyzing housing prices in Shanghai with open data: Amenity, accessibility and urban structure. Cities 2019, 91, 165–179. [Google Scholar] [CrossRef]
  57. Famuyiwa, F.; Kayode Babawale, G. Hedonic values of physical infrastructure in house rentals. J. Facil. Manag. 2014, 12, 211–230. [Google Scholar] [CrossRef]
  58. Femi, A.B.; Khan, T.H.; Ahmad, A.S.B.H.; Udin, A.B. Impact of Tertiary Institutions on House Rental Value in Developing City. Procedia Soc. Behav. Sci. 2015, 172, 323–330. [Google Scholar] [CrossRef]
  59. Zhou, X.; Tong, W. Learning with self-attention for rental market spatial dynamics in the Atlanta metropolitan area. Earth Sci. Inform. 2021, 14, 837–845. [Google Scholar] [CrossRef]
  60. Hu, L.; He, S.; Han, Z.; Xiao, H.; Su, S.; Weng, M.; Cai, Z. Monitoring housing rental prices based on social media:An integrated approach of machine-learning algorithms and hedonic modeling to inform equitable housing policies. Land Use Policy 2019, 82, 657–673. [Google Scholar] [CrossRef]
  61. Ardura Urquiaga, A.; Lorente-Riverola, I.; Ruiz Sanchez, J. Platform-mediated short-term rentals and gentrification in Madrid. Urban Stud. 2020, 57, 3095–3115. [Google Scholar] [CrossRef]
  62. Sun, W.; Zheng, S.; Wang, R. The capitalization of subway access in home value: A repeat-rentals model with supply constraints in Beijing. Transp. Res. Part A Policy Pr. 2015, 80, 104–115. [Google Scholar] [CrossRef]
  63. Barron, K.; Kung, E.; Proserpio, D. The Effect of Home-Sharing on House Prices and Rents: Evidence from Airbnb. Mark. Sci. 2021, 40, 23–47. [Google Scholar] [CrossRef]
  64. Lima, V. Towards an understanding of the regional impact of Airbnb in Ireland. Reg. Stud. Reg. Sci. 2019, 6, 78–91. [Google Scholar] [CrossRef]
  65. Chen, Y.; Liu, X.; Li, X.; Liu, Y.; Xu, X. Mapping the fine-scale spatial pattern of housing rent in the metropolitan area by using online rental listings and ensemble learning. Appl. Geogr. 2016, 75, 200–212. [Google Scholar] [CrossRef]
  66. Zhou, X.; Tong, W.; Li, D. Modeling Housing Rent in the Atlanta Metropolitan Area Using Textual Information and Deep Learning. ISPRS Int. J. Geo-Inform. 2019, 8, 349. [Google Scholar] [CrossRef]
  67. Yang, Y.; Mao, Z. Welcome to My Home! An Empirical Analysis of Airbnb Supply in US Cities. J. Travel Res. 2018, 58, 1274–1287. [Google Scholar] [CrossRef]
  68. Dudás, G.; Vida, G.; Kovalcsik, T.; Boros, L. A socio-economic analysis of Airbnb in New York City. Reg. Stat. 2017, 7, 135–151. [Google Scholar]
  69. Harten, J.G.; Kim, A.M.; Brazier, J.C. Real and fake data in Shanghai’s informal rental housing market: Groundtruthing data scraped from the internet. Urban Stud. 2021, 58, 1831–1845. [Google Scholar] [CrossRef]
  70. Zhang, Y.; Gurran, N. Understanding the Share Housing Sector: A Geography of Group Housing Supply in Metropolitan Sydney. Urban Policy Res. 2021, 39, 16–32. [Google Scholar] [CrossRef]
  71. LaCour-Little, M.; Wu, W. Density Control, Home Price Appreciation, and Rental Growth in the United States. Cityscape 2021, 23, 75–100. [Google Scholar]
  72. Anenberg, E.; Kung, E. Can more housing supply solve the affordability crisis? Evidence from a neighborhood choice model. Reg. Sci. Urban Econ. 2020, 80, 103363. [Google Scholar] [CrossRef]
  73. Kim, A.M. The extreme primacy of location: Beijing’s underground rental housing market. Cities 2016, 52, 148–158. [Google Scholar] [CrossRef]
  74. Talukdar, D. Cost of being a slum dweller in Nairobi: Living under dismal conditions but still paying a housing rent premium. World Dev. 2018, 109, 42–56. [Google Scholar] [CrossRef]
  75. Beatty, T.K.M.; Sommervoll, D.E. Discrimination in rental markets: Evidence from Norway. J. Hous. Econ. 2012, 21, 121–130. [Google Scholar] [CrossRef]
  76. Boeing, G.; Besbris, M.; Schachter, A.; Kuk, J. Housing Search in the Age of Big Data: Smarter Cities or the Same Old Blind Spots? Hous. Policy Debate 2021, 31, 112–126. [Google Scholar] [CrossRef]
  77. Hess, C.; Acolin, A.; Walter, R.; Kennedy, I.; Chasins, S.; Crowder, K. Searching for housing in the digital age: Neighborhood representation on internet rental housing platforms across space, platform, and metropolitan segregation. Environ. Plan. A Econ. Space 2021, 53, 2012–2032. [Google Scholar] [CrossRef]
  78. Gurran, N.; Maalsen, S.; Shrestha, P. Is ‘informal’ housing an affordability solution for expensive cities? Evidence from Sydney, Australia. Int. J. Hous. Policy 2020, 22, 10–33. [Google Scholar] [CrossRef]
  79. Bensús Talavera, V. Densificación (no) planificada de una metrópoli. El caso del Área Metropolitana de Lima 2000–2014. Rev. INVI 2018, 33, 9–51. [Google Scholar] [CrossRef]
  80. Gurran, N.; Phibbs, P. When Tourists Move In: How Should Urban Planners Respond to Airbnb? J. Am. Plan. Assoc. 2017, 83, 80–92. [Google Scholar] [CrossRef]
  81. Cheshire, P.; Hilber, C.A.L.; Koster, H.R.A. Empty homes, longer commutes: The unintended consequences of more restrictive local planning. J. Public Econ. 2018, 158, 126–151. [Google Scholar] [CrossRef]
  82. Ezennia, I.S.; Hoskara, S.O. Exploring the Severity of Factors Influencing Sustainable Affordable Housing Choice: Evidence from Abuja, Nigeria. Sustainability 2019, 11, 5792. [Google Scholar] [CrossRef]
  83. Kadi, J.; Ronald, R. Undermining housing affordability for New York’s low-income households: The role of policy reform and rental sector restructuring. Crit. Soc. Policy 2016, 36, 265–288. [Google Scholar] [CrossRef]
  84. Teixeira, C. Living on the “edge of the suburbs” of Vancouver: A case study of the housing experiences and coping strategies of recent immigrants in Surrey and Richmond. Can. Geogr. Geogr. Can. 2014, 58, 168–187. [Google Scholar] [CrossRef]
  85. Dewilde, C.; De Decker, P. Changing Inequalities in Housing Outcomes across Western Europe. Hous. Theory Soc. 2016, 33, 121–161. [Google Scholar] [CrossRef]
  86. Besbris, M.; Faber, J.W. Investigating the Relationship Between Real Estate Agents, Segregation, and House Prices: Steering and Upselling in New York State. Sociol. Forum 2017, 32, 850–873. [Google Scholar] [CrossRef]
  87. Boeing, G. Online rental housing market representation and the digital reproduction of urban inequality. Environ. Plan. A Econ. Space 2020, 52, 449–468. [Google Scholar] [CrossRef]
  88. Anacker, K.B. Introduction: Housing affordability and affordable housing. Int. J. Hous. Policy 2019, 19, 1–16. [Google Scholar] [CrossRef]
  89. Perera, U.; Lee, P. A relational lens to understand housing affordability in the 21st Century. J. Urban Manag. 2021, 10, 314–324. [Google Scholar] [CrossRef]
  90. Allin, P. Opportunities and challenges for official statistics in a digital society. Contemp. Soc. Sci. 2021, 16, 156–169. [Google Scholar] [CrossRef]
  91. Radermacher, W.J. Official Statistics—An Introduction. In Official Statistics 4.0: Verified Facts for People in the 21st Century; Springer International Publishing: Cham, Switzerland, 2020; pp. 1–9. [Google Scholar]
  92. Kitchin, R. The opportunities, challenges and risks of big data for official statistics. Stat. J. IAOS 2015, 31, 471–481. [Google Scholar] [CrossRef]
  93. Rolland, A. The concept and commodity of official statistics. Stat. J. IAOS 2017, 33, 373–385. [Google Scholar] [CrossRef]
  94. Hackl, P. Big Data: What can official statistics expect? Stat. J. IAOS 2016, 32, 43–52. [Google Scholar] [CrossRef]
  95. Hand, D.J. Statistical challenges of administrative and transaction data. J. R. Stat. Soc. Ser. A Stat. Soc. 2018, 181, 555–605. [Google Scholar] [CrossRef]
  96. Tam, S.-M.; Clarke, F. Big Data, Official Statistics and Some Initiatives by the Australian Bureau of Statistics. Int. Stat. Rev. 2015, 83, 436–448. [Google Scholar] [CrossRef]
  97. Hecht, R.; Meinel, G.; Buchroithner, M. Automatic identification of building types based on topographic databases–a comparison of different data sources. Int. J. Cartogr. 2015, 1, 18–31. [Google Scholar] [CrossRef]
  98. Menghinello, S.; Faramondi, A.; Laureti, T. The future role of official statistics in the business data arena. Stat. J. IAOS 2020, 36, 519–533. [Google Scholar] [CrossRef]
  99. O’Hare, C. Hard-to-find statistics: Sources of non-official and international figures. Bus. Inf. Rev. 2006, 23, 264–269. [Google Scholar] [CrossRef]
  100. Mort, D.; Siddall, L.; Wilkins, W. Sources of Non-Official UK Statistics; Taylor & Francis Group: Milton, UK, 2002. [Google Scholar]
  101. Carr-Hill, R. Using survey data towards valid estimates of poverty in the South. In Data in Society, 1st ed.; Evans, J., Ruane, S., Southall, H., Eds.; Challenging Statistics in an Age of Globalisation; Bristol University Press: Bristol, UK, 2019; pp. 79–90. [Google Scholar]
  102. Japec, L.; Lyberg, L.E. Big Data Initiatives in Official Statistics. In Big Data Meets Survey Science: A Collection of Innovative Methods; Wiley Press: New York, NY, USA, 2020. [Google Scholar]
  103. Iacus, S.M.; Porro, G.; Salini, S.; Siletti, E. Controlling for Selection Bias in Social Media Indicators through Official Statistics: A Proposal. J. Off. Stat. 2020, 36, 315–338. [Google Scholar] [CrossRef]
  104. Tear, A.; Southall, H. Social media data. In Data in Society, 1 ed.; Southall, H., Evans, J., Ruane, S., Eds.; Challenging Statistics in an Age of Globalisation; Bristol University Press: Bristol, UK, 2019; pp. 47–60. [Google Scholar]
  105. Selvanathan, S.A.; Selvanathan, S.; Keller, G. Business Statistics Abridged; Cengage Learning Australia: Melbourne, Australia, 2016. [Google Scholar]
  106. Fielding, A.H. Cluster and Classification Techniques for the Biosciences; Cambridge University Press: Cambridge, UK, 2006. [Google Scholar]
  107. Ishikawa, H. Social Big Data Mining; Taylor & Francis Group: London, UK, 2015. [Google Scholar]
  108. Brand, J.E. Machine Learning; SAGE Publications Ltd.: London, UK, 2020. [Google Scholar]
  109. Banks, N.; Lombard, M.; Mitlin, D. Urban Informality as a Site of Critical Analysis. J. Dev. Stud. 2020, 56, 223–238. [Google Scholar] [CrossRef]
  110. McFarlane, C. Rethinking Informality: Politics, Crisis, and the City. Plan. Theory Pract. 2012, 13, 89–108. [Google Scholar] [CrossRef]
  111. Batty, M. Big data, smart cities and city planning. Dialog. Hum. Geogr. 2013, 3, 274–279. [Google Scholar] [CrossRef]
  112. Kandt, J.; Batty, M. Smart cities, big data and urban policy: Towards urban analytics for the long run. Cities 2021, 109, 102992. [Google Scholar] [CrossRef]
  113. Bibri, S.E. A novel model for data-driven smart sustainable cities of the future: The institutional transformations required for balancing and advancing the three goals of sustainability. Energy Inform 2021, 4, 4. [Google Scholar] [CrossRef]
  114. Truong, Q.; Nguyen, M.; Dang, H.; Mei, B. Housing Price Prediction via Improved Machine Learning Techniques. Procedia Comput. Sci. 2020, 174, 433–442. [Google Scholar] [CrossRef]
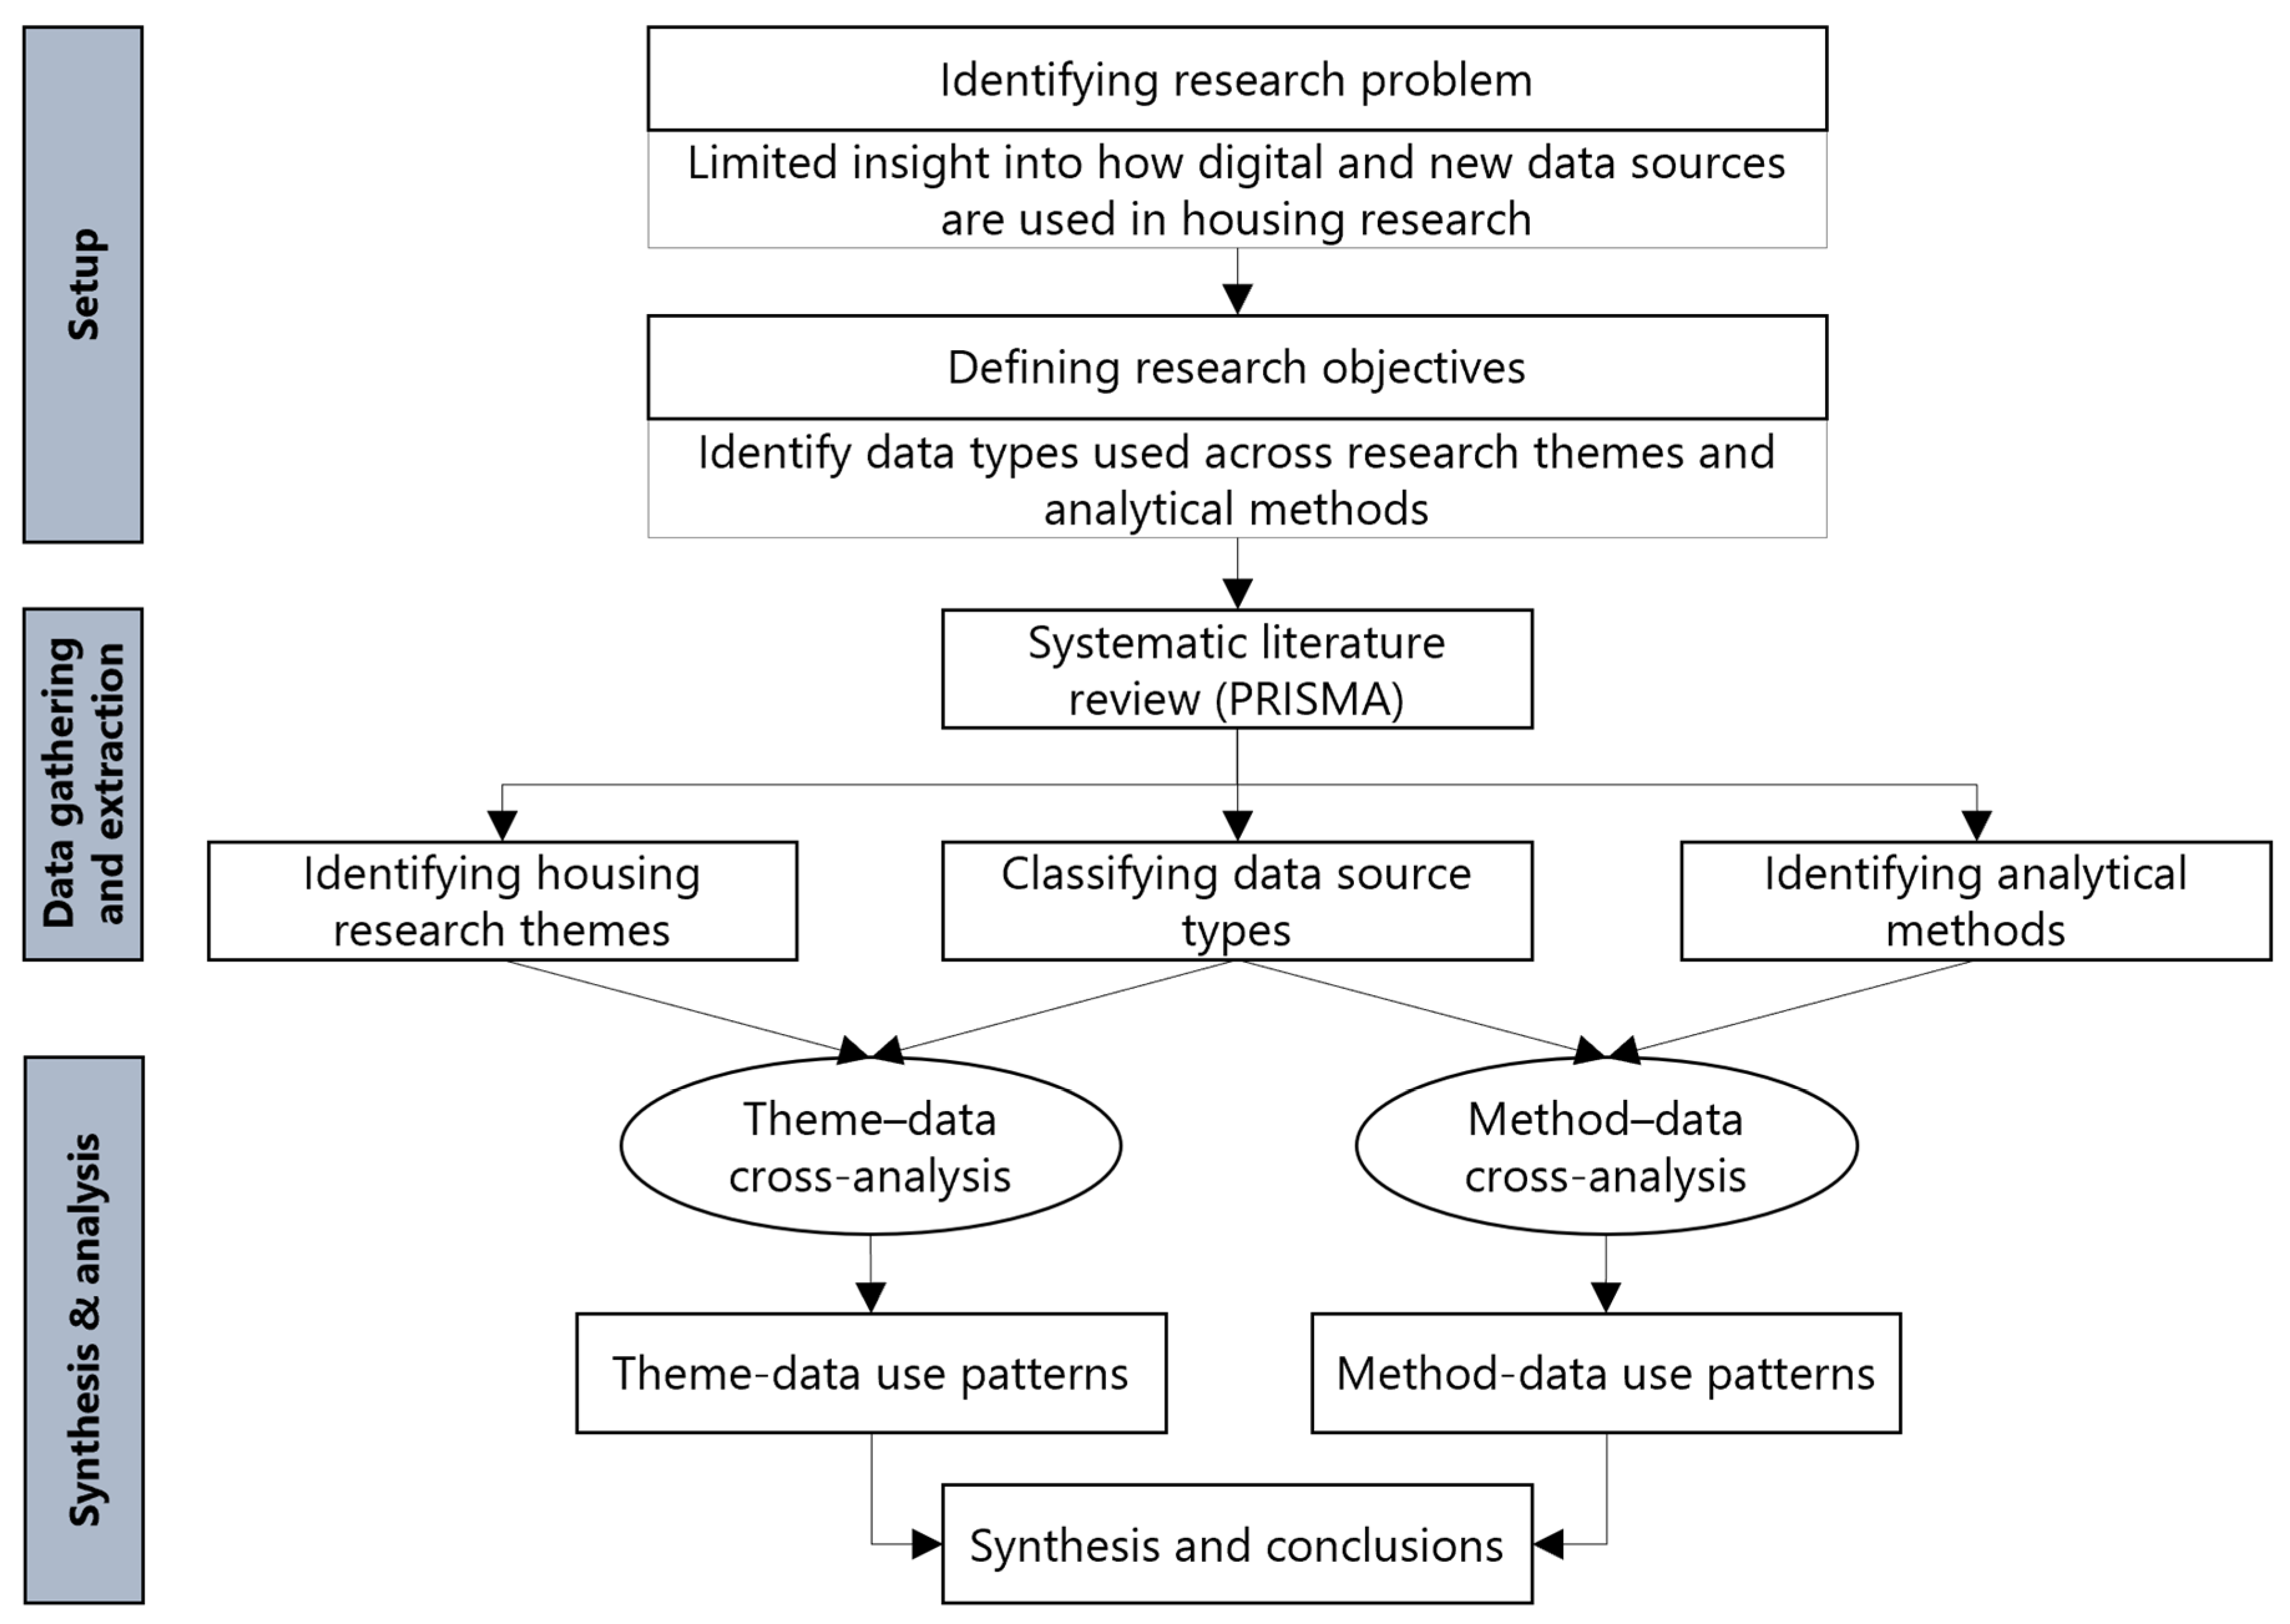
Figure 1. Flowchart showing the research process.
Sustainability 17 04809 g001
Figure 2. PRISMA flow diagram for the identification of the studies.
Sustainability 17 04809 g002
Figure 3. Annual distribution of reviewed studies (2010–2021).
Sustainability 17 04809 g003
Figure 4. UpSet plot showing intersections across housing research themes.
Sustainability 17 04809 g004
Figure 5. Analytical methods applied across different data source types in housing research.
Sustainability 17 04809 g005
Figure 6. Typology of housing types and analytical perspectives in the literature.
Sustainability 17 04809 g006
Figure 7. Heatmap of the use of data source types across housing research themes.
Sustainability 17 04809 g007
Table 1. Summary of previous housing research typologies.
StudyFocus AreaTypology Basis and TypesGeographic ScopeLimitation
Fields and Rogers [4]Real estate platformsFunctionality of platform: trading platform, operational platform, data platformUS, Canada, China, AustraliaExcludes social media; focused on formal data
Goodchild and Ferrari [15]Digital housing platformsPlatform roles: connectors, enablers, matchmakers, hubsUKExcludes social media; focused only on formal markets
Serin [18]Housing supplyPolicy: planning, regeneration and development, design construction and quality, tenure, new builds, private residential developers, affordable and social housing, energy consumptionUKRegulations oriented; focused only on supply
Naik [19]Informal rental housingPhysical and service: semi-permanent residence, permanent multi-story residence, rooms with shared toilets, rooms with separate toiletsIndiaQualitative only; limited to informal rental
Khaire and Muniappa [21]Housing policy researchFour themes: policy, slum housing, housing finance, affordable housingIndiaFocused on policy themes; no analytical framework across data types
Maalsen [20]Shared housingLegal and social status of tenants: co-tenant, head-tenant, formal sub-tenant, informal sub-tenant, boarder or lodgerAustraliaNarrow scope; specific to rental law categories
Table 2. Objectives of urban housing research and their thematic classification.
ThemeCross-ThemeObjectivesCitation
Housing market analysis-Housing price analysis [23,24,25,26,27,28]
Analysis of demand against supply[12,29,30]
Factors influencing housing demand and supply[31,32]
Determinants of supply and construction of housing units[33,34]
Rental market analysis Factors influencing housing demand [13,35,36,37,38,39]
Housing price analysis[40,41,42,43,44,45,46]
Rental market—policy evaluationHousing demand estimation[47]
Housing poverty assessment[48]
Rental market—affordabilityHousing demand analysis[49]
Policy evaluationImpact of short-term rentals on housing market[50]
AffordabilityHousing price analysis [51].
Rental market analysis-Factors influencing rental housing demand [6,52,53,54,55]
Rental price analysis[5,56,57,58,59,60,61,62,63,64]
Mapping and prediction of rental prices and supply [65,66,67,68]
Reliability of rental data available on online platforms[69]
A review of shared housing [70]
Housing policy evaluationDensity control in metropolitan areas[71]
Examination of informality on housing market[8]
Impact of policy regulations on informal housing[10]
AffordabilityImpact of housing supply on affordability[72]
Impact of informal housing on housing supply[73]
InequalityAnalysis of the slum challenges for developing countries[74]
Evaluation of discrimination in rental markets[75]
Information inequality and bias in housing supply[76,77]
Affordability–inequalityImpact of informal housing on affordability[78]
Policy evaluation-Impacts of policy and regulatory changes on housing[79,80,81]
AffordabilityAnalysis of the housing choice factors[82]
Impact of changes in rental markets on affordability[83]
Affordability -Review of the challenges faced by low-income groups[84]
Inequality-Inequality investigations in housing markets [85,86,87]
Table 3. Typology of data sources used in housing research.
Data Source TypologySupplementary Data SourceExamples of Data SourcesReviewed Studies
Official statistics-American Community Survey; population censuses; National Property and Information Centre (NAPIC)[23,24,33,34,39,40,47,54,59,72]
Non-official statisticseCognition; Chartered Institute for Public Finance and Accountancy; Central Bank of Turkey; Thomson Reuters DataStream; https://www.airdna.co/ (accessed on 14 April 2025)[25,26,27,29,31,46,49,81]
Surveys and qualitative dataInterviews; questionnaire surveys[48,75,79,86]
Big dataCoStar Group for rental data; Craigslist; Apartments.com (accessed on 14 April 2025); daft.ie (accessed on 14 April 2025)[5,43,45,50,56,63,64,67,70,71,77,80,87]
Non-official statistics-dhiperiti.com; EUROSTAT; Data provided by real estate agencies [32,41,51,62,85]
Big datawww.creprice.cn (accessed on 14 April 2025)[42]
Surveys and Qualitative data Household surveys; structured and unstructured questionnaires; structured interviews and focus groups[8,10,12,13,35,36,37,38,53,55,57,58,74,82,83,84]
Big data58.com (accessed on 14 April 2025); geofabrik.de (accessed on 14 April 2025)[68,69]
Big data-Craigslist; Ganji; Anjuke; 58tongcheng; bjhouse.com (accessed on 21 February 2021)[28,30,44,60,65,76]
Social media dataSina; SOFANG; Fangtianxia[6,28]
combination of data sourcesCREIS Databank; China Meteorological Data Service Centre; official statistical yearbooks; National Bureau of Statistics of China; Australian Bureau of Statistics (ABS); Flatmates.com.au (accessed on 14 April 2025); Rent and Sales Report, NSW government [42,78]
Social mediaBig dataSina; Lianjia[6,28]
Table 4. Commonly used data analysis methods in housing research.
Data Analysis MethodsData SourcesReviewed Studies
Correlation analysisOfficial statistics[5,23,26,33,42,46,47,48,52,54,61,63,71,77,79,81]
Non-official statistics[26,42,46,61,81,85]
Big data[5,42,63,69,71,77]
Surveys and qualitative data[13,48,52,53,69,74,82,86]
Regression modellingOfficial statistics[25,26,34,39,40,42,45,47,54,63,71,77,87]
Non-official statistics[25,26,32,41,42,62,85]
Big data[42,44,45,63,68,71,77,87]
Surveys and qualitative data[12,37,38,57]
Social media[28]
Hedonic modellingOfficial statistics[24,27,29,43,45,49,50,67,75]
Non-official statistics[27,29,49,62]
Big data[28,30,35,43,44,45,50,56,60,67,69,73]
Surveys and qualitative data[36,53,57,69,75]
Social media[28]
Descriptive statisticsOfficial statistics[23,25,31,35,47,51,55,61,63,64,71]
Non-official statistics[25,31,41,61,85]
Big data[60,63,64,71,73]
Surveys and qualitative data[38,53,55,57,58,74,82,83,84]
Table 5. Data sources used for the analysis of various housing types (percent distribution).
Housing TypesSupply and Demand PerspectivesData Source Type
PerspectivePercentOfficial StatisticsNon-Official StatisticsSurvey and Qualitative DataBig DataSocial Media
Formal (n = 39; 55%)Supply51.3%70.0%35.0%15.0%30.0%-
Demand20.5%37.5%12.5%50.0%12.5%-
Supply and demand28.2%54.5%72.7%9.0%18.2%-
Informal (n = 16; 22.5%)Supply43.8%71.4%28.5%57.2%71.4%-
Demand18.7%--66.7%33.3%33.3%
Supply and demand37.5%16.7%-83.4%33.3%-
Formal-informal (n = 16; 22.5%)Supply62.5%60.0%20.0%20.0%90.0%-
Demand31.5%20.0%-60.0%20.0%20.0%
Supply and demand6.2%--100.0%--
Disclaimer/Publisher’s Note: The statements, opinions and data contained in all publications are solely those of the individual author(s) and contributor(s) and not of MDPI and/or the editor(s). MDPI and/or the editor(s) disclaim responsibility for any injury to people or property resulting from any ideas, methods, instructions or products referred to in the content.