Article

Optimal Sustainable Energy Management for Isolated Microgrid: A Hybrid Jellyfish Search-Golden Jackal Optimization Approach

by
Dilip Kumar
1,*,
Yogesh Kumar Chauhan
2,
Ajay Shekhar Pandey
2,
Ankit Kumar Srivastava
1,
Raghavendra Rajan Vijayaraghavan
3,
Rajvikram Madurai Elavarasan
4,* and
G. M. Shafiullah
4
1
Department of Electrical Engineering, Institute of Engineering and Technology, Dr. Rammanohar Lohia Avadh University, Ayodhya, Faizabad 224001, India
2
Department of Electrical Engineering, Kamla Nehru Institute of Technology, Sultanpur 228118, India
3
Automotive Department, Harman Connected Services India Pvt. Ltd., Bengaluru 560066, India
4
School of Engineering and Energy, College of Science, Technology, Engineering & Mathematics, Murdoch University, Perth, WA 6150, Australia
*
Authors to whom correspondence should be addressed.
Sustainability 2025, 17(11), 4801; https://doi.org/10.3390/su17114801
Submission received: 25 March 2025 / Revised: 18 May 2025 / Accepted: 19 May 2025 / Published: 23 May 2025
(This article belongs to the Special Issue Smart Grid Technologies and Energy Sustainability)

Abstract

:
This study presents an advanced hybrid energy management system (EMS) designed for isolated microgrids, aiming to optimize the integration of renewable energy sources with backup systems to enhance energy efficiency and ensure a stable power supply. The proposed EMS incorporates solar photovoltaic (PV) and wind turbine (WT) generation systems, coupled with a battery energy storage system (BESS) for energy storage and management and a microturbine (MT) as a backup solution during low generation or peak demand periods. Maximum power point tracking (MPPT) is implemented for the PV and WT systems, with additional control mechanisms such as pitch angle, tip speed ratio (TSR) for wind power, and a proportional-integral (PI) controller for battery and microturbine management. To optimize EMS operations, a novel hybrid optimization algorithm, the JSO-GJO (Jellyfish Search and Golden Jackal hybrid Optimization), is applied and benchmarked against Particle Swarm Optimization (PSO), Bacterial Foraging Optimization (BFO), Artificial Bee Colony (ABC), Grey Wolf Optimization (GWO), and Whale Optimization Algorithm (WOA). Comparative analysis indicates that the JSO-GJO algorithm achieves the highest energy efficiency of 99.20%, minimizes power losses to 0.116 kW, maximizes annual energy production at 421,847.82 kWh, and reduces total annual costs to USD 50,617,477.51. These findings demonstrate the superiority of the JSO-GJO algorithm, establishing it as a highly effective solution for optimizing hybrid isolated EMS in renewable energy applications.

1. Introduction

There is a growing demand for accurate, reliable and sustainable power in remote and off-grid areas, which has led to considerable progress in standalone energy management system (EMS) [1,2]. These systems combine PV arrays, WECS, and storage, as well as backup generation, to provide continuous power supply. In a typical standalone EMS configuration, PV panels, PMSG-based WECS, BESS, as well as microturbines (MT) are coordinated to deal with the dynamic issues of energy generation, storage and consumption [3]. Additionally, such systems not only mitigate the dependence on fossil fuels but promote the spread of energy where the grid infrastructure is limited.
These systems are based on uninterrupted interaction of various energy sources. Solar PV and WECS capture renewable resources, and BESS and MT are important backups during times of low generation and high demand [4]. Renewables are extracted and optimized by means of boost converters and advanced control strategies such as maximum power point tracking (MPPT) for operational efficiency and stability of the system, respectively [5,6,7]. For example, MPPT algorithms regulate the PV and wind turbine outputs in order to maximize power yield as environmental conditions change [8,9,10]. BESS units stabilize supply by storing extra energy for discharge to meet sustained peaks in demand or to meet shortfall in generation [11,12,13]. Microturbines add to reliability by providing a quick emergency response to fill the gap between the utility and renewable generations.
However, the use of renewable sources requires their EMS to be robust and able to adapt in real time. To balance the generation, storage, and consumption and maintain system resilience, it is necessary to have proper sizing, optimization and control modalities [3,4,5,6]. Research on current development focuses on indoor resource allocation under uncertainty that integrates predictive algorithm and adaptive control frameworks to enable robust, effective decision under uncertainty [9,10,11,12]. This paper therefore makes four contributions; the first two build on these foundations; the third is a unified standalone EMS which synergizes solar PV, WECS, BESS, and MT technologies. Based on advanced MPPT techniques, adaptive energy management protocol, and real-time load forecasting, the proposed system offers more operational reliability, more resource utilization, and more scalable deployment in residential and commercial environment.
Literature Review and Research Contributions:
Standalone EMS systems provide practical solutions for off-grid and remote applications, reducing reliance on fossil fuel generators and traditional grids while supporting greener, more resilient energy infrastructures. Prior research has examined the integration of renewable energy and energy storage technologies to enhance EMS functionality; however, gaps remain, particularly in optimization and adaptability to real-time demand. Table 1 shows the summary of the recent works in the existing literature.
The study introduces three major contributions regarding renewable energy management by developing a novel JSO-GJO hybrid optimization technique tailored for microgrid applications. The research presents a complete energy management structure that links solar PV along with wind turbine systems and battery storage units and microturbines through dynamic control methods. The study presents experimental results demonstrating the performance of the implemented system in actual operational situations. The research shows how combined renewable systems function to solve sustainability along with energy security problems in remote areas. The documented approach provides other communities an adaptable solution to implement reliable low-cost power systems for unconnected areas that still operate within standard microgrid systems. Over the course of extensive system operation time, the research reveals that minor algorithmic improvements generate significant operational advantages.
In comparison to the existing literature, this work introduces several innovations:
  • Implementation of MPPT technique for optimizing PV system output under varied operating conditions;
  • Integration of pitch angle and tip speed ratio controller for WECS to maximize power extraction;
  • Utilization of micro-turbine for backup system control and battery management for storage system control, alongside hybrid system integration for feeding various DC loads, evaluated under different operational circumstances;
  • Introduction of a novel optimization algorithm, JSO-GJO, tailored for microgrids with HES and BESS, addressing limitations of conventional methods like PSO, BFO, ABC, GWO, and WOA;
  • JSO-GJO algorithm characterized by computational efficiency, rapid convergence, and proficiency in resolving complex ESS scheduling problems, yielding high-quality solutions;
  • Thorough evaluation of JSO-GJO algorithm across diverse microgrid cases, including those with HES, demonstrating superior efficacy compared to existing methods, leading to lower operation costs and higher efficiency.
This manuscript presents a hybrid approach that combines the JSO and GJO algorithms to improve energy dispatch management within standalone microgrids, integrating solar PV, WT, BESS, and MT. Section 2 describes the EMS configuration within the microgrid. Section 3 explains the proposed JSO-GJO Hybrid method for optimizing energy management. Section 4 presents results and discussion, while Section 5 concludes with findings.

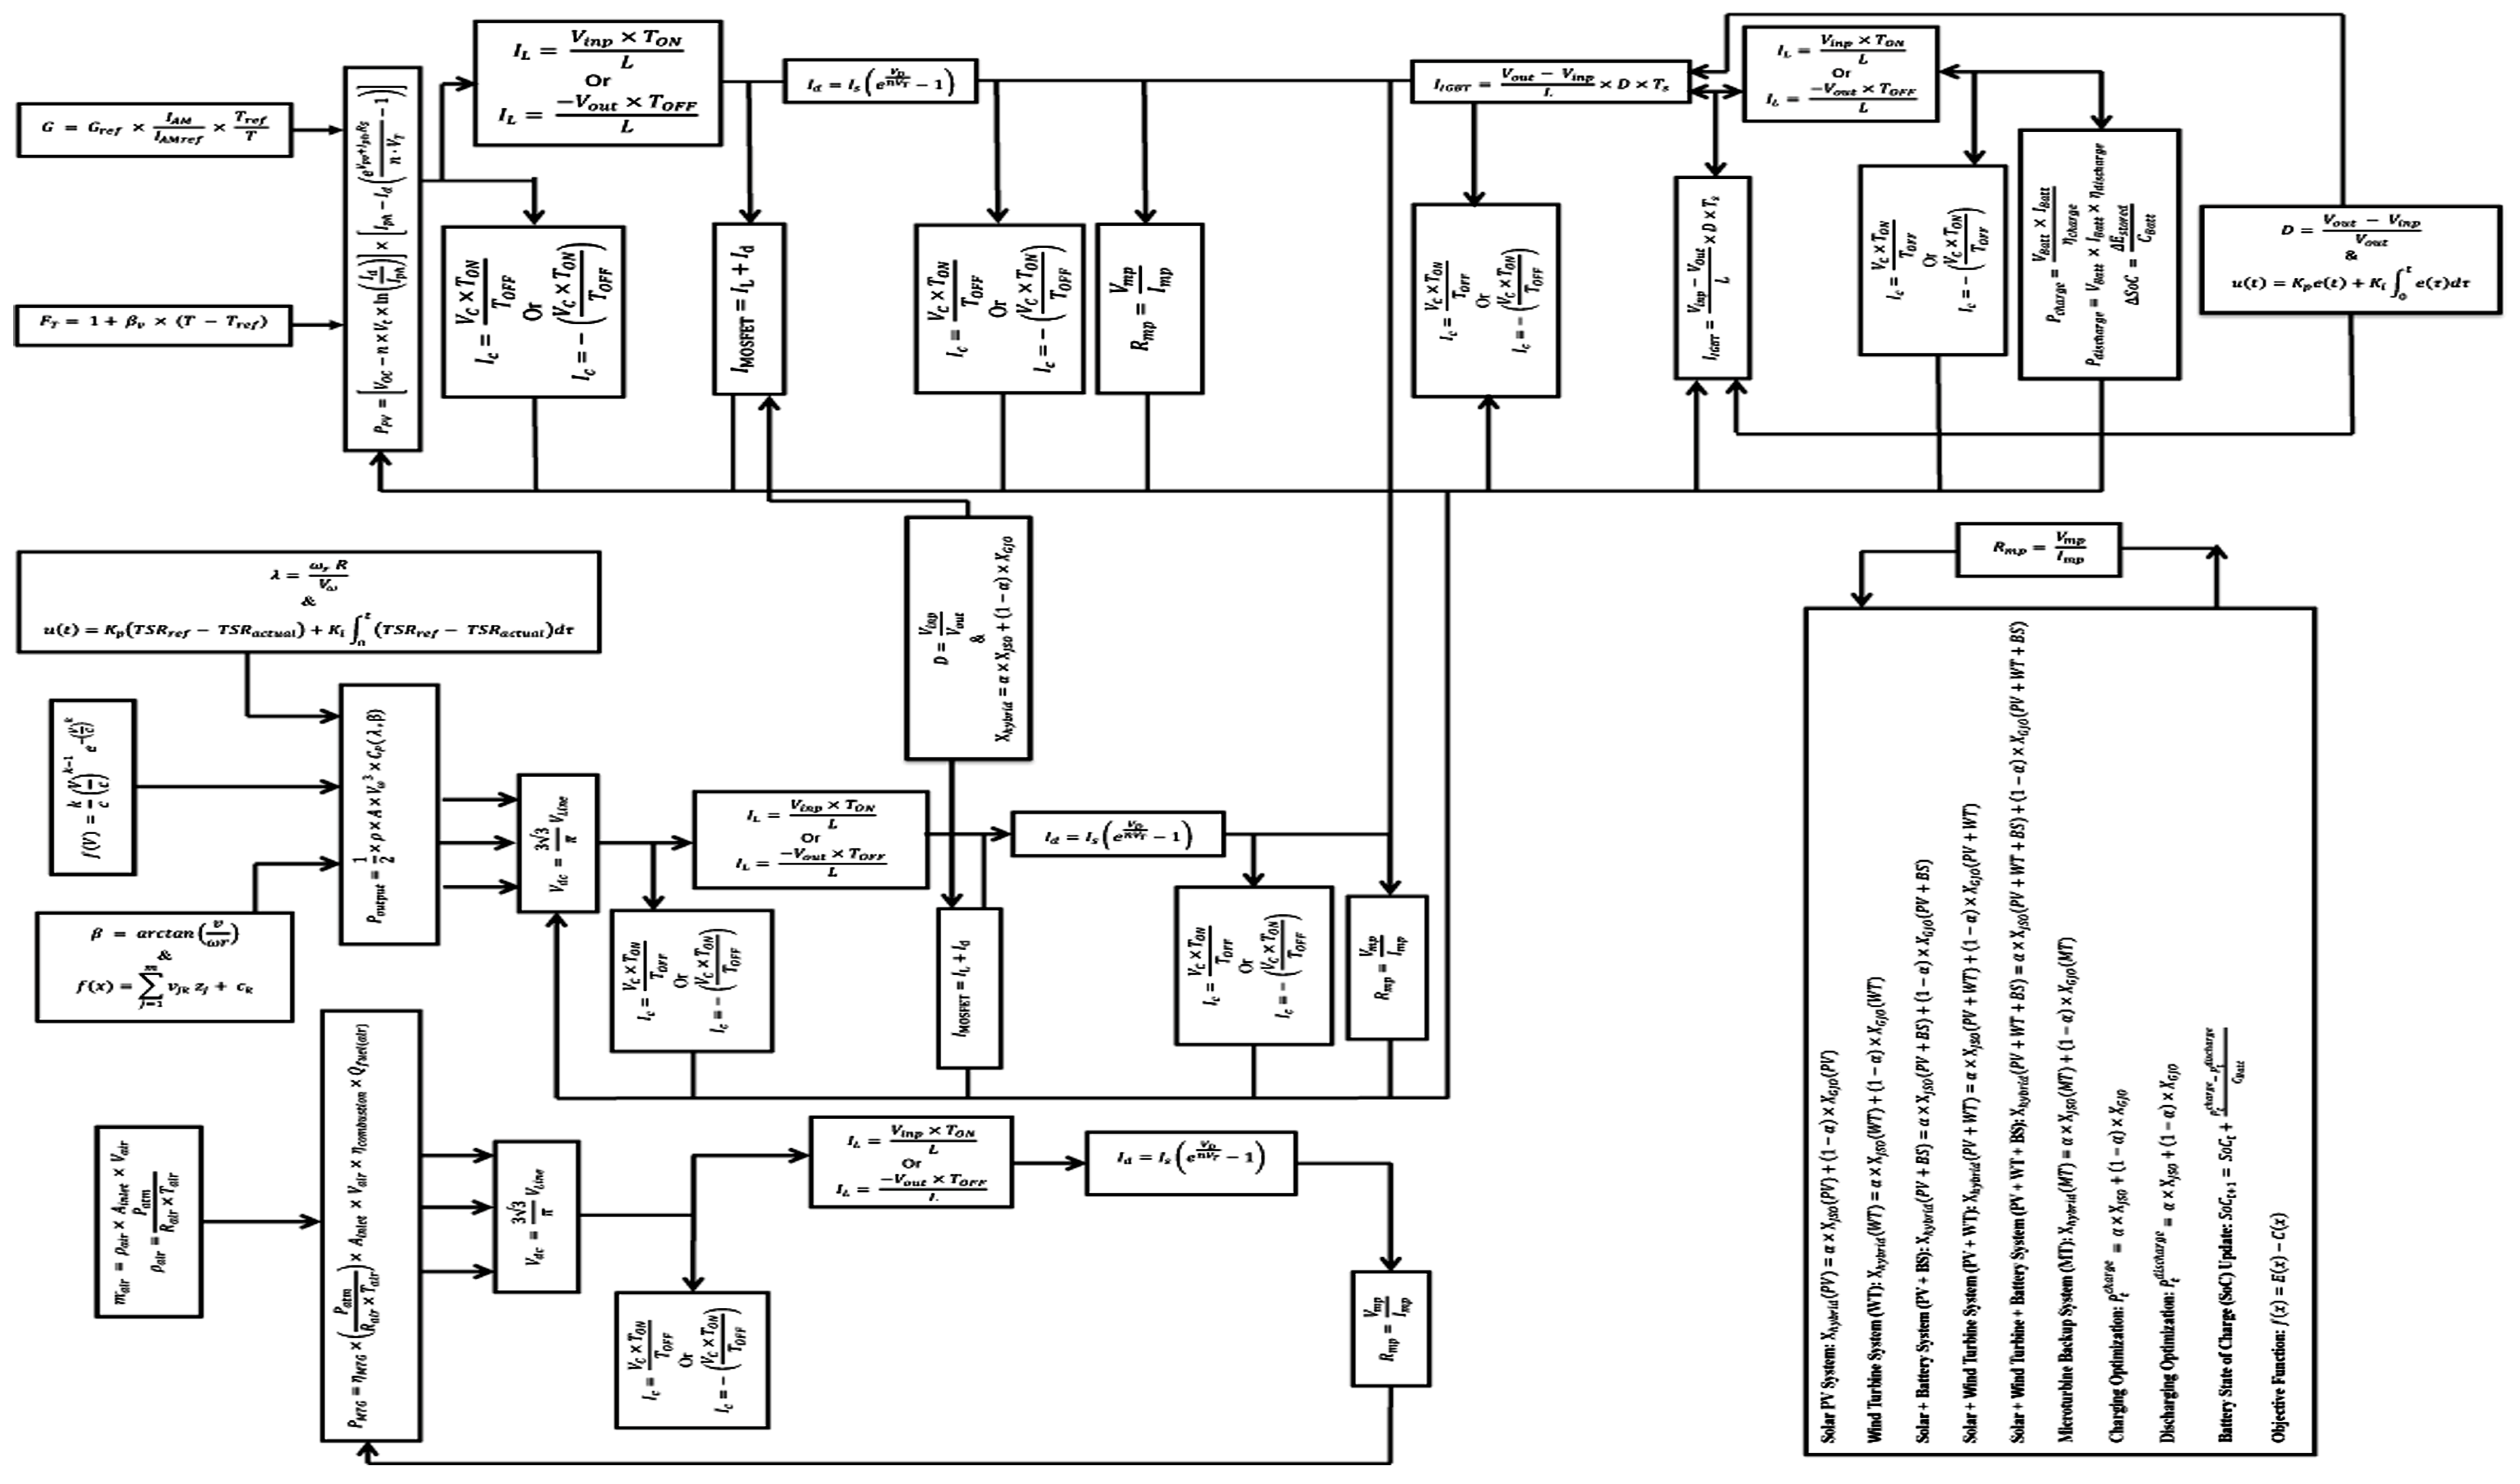
2. Mathematical Modeling of Proposed System

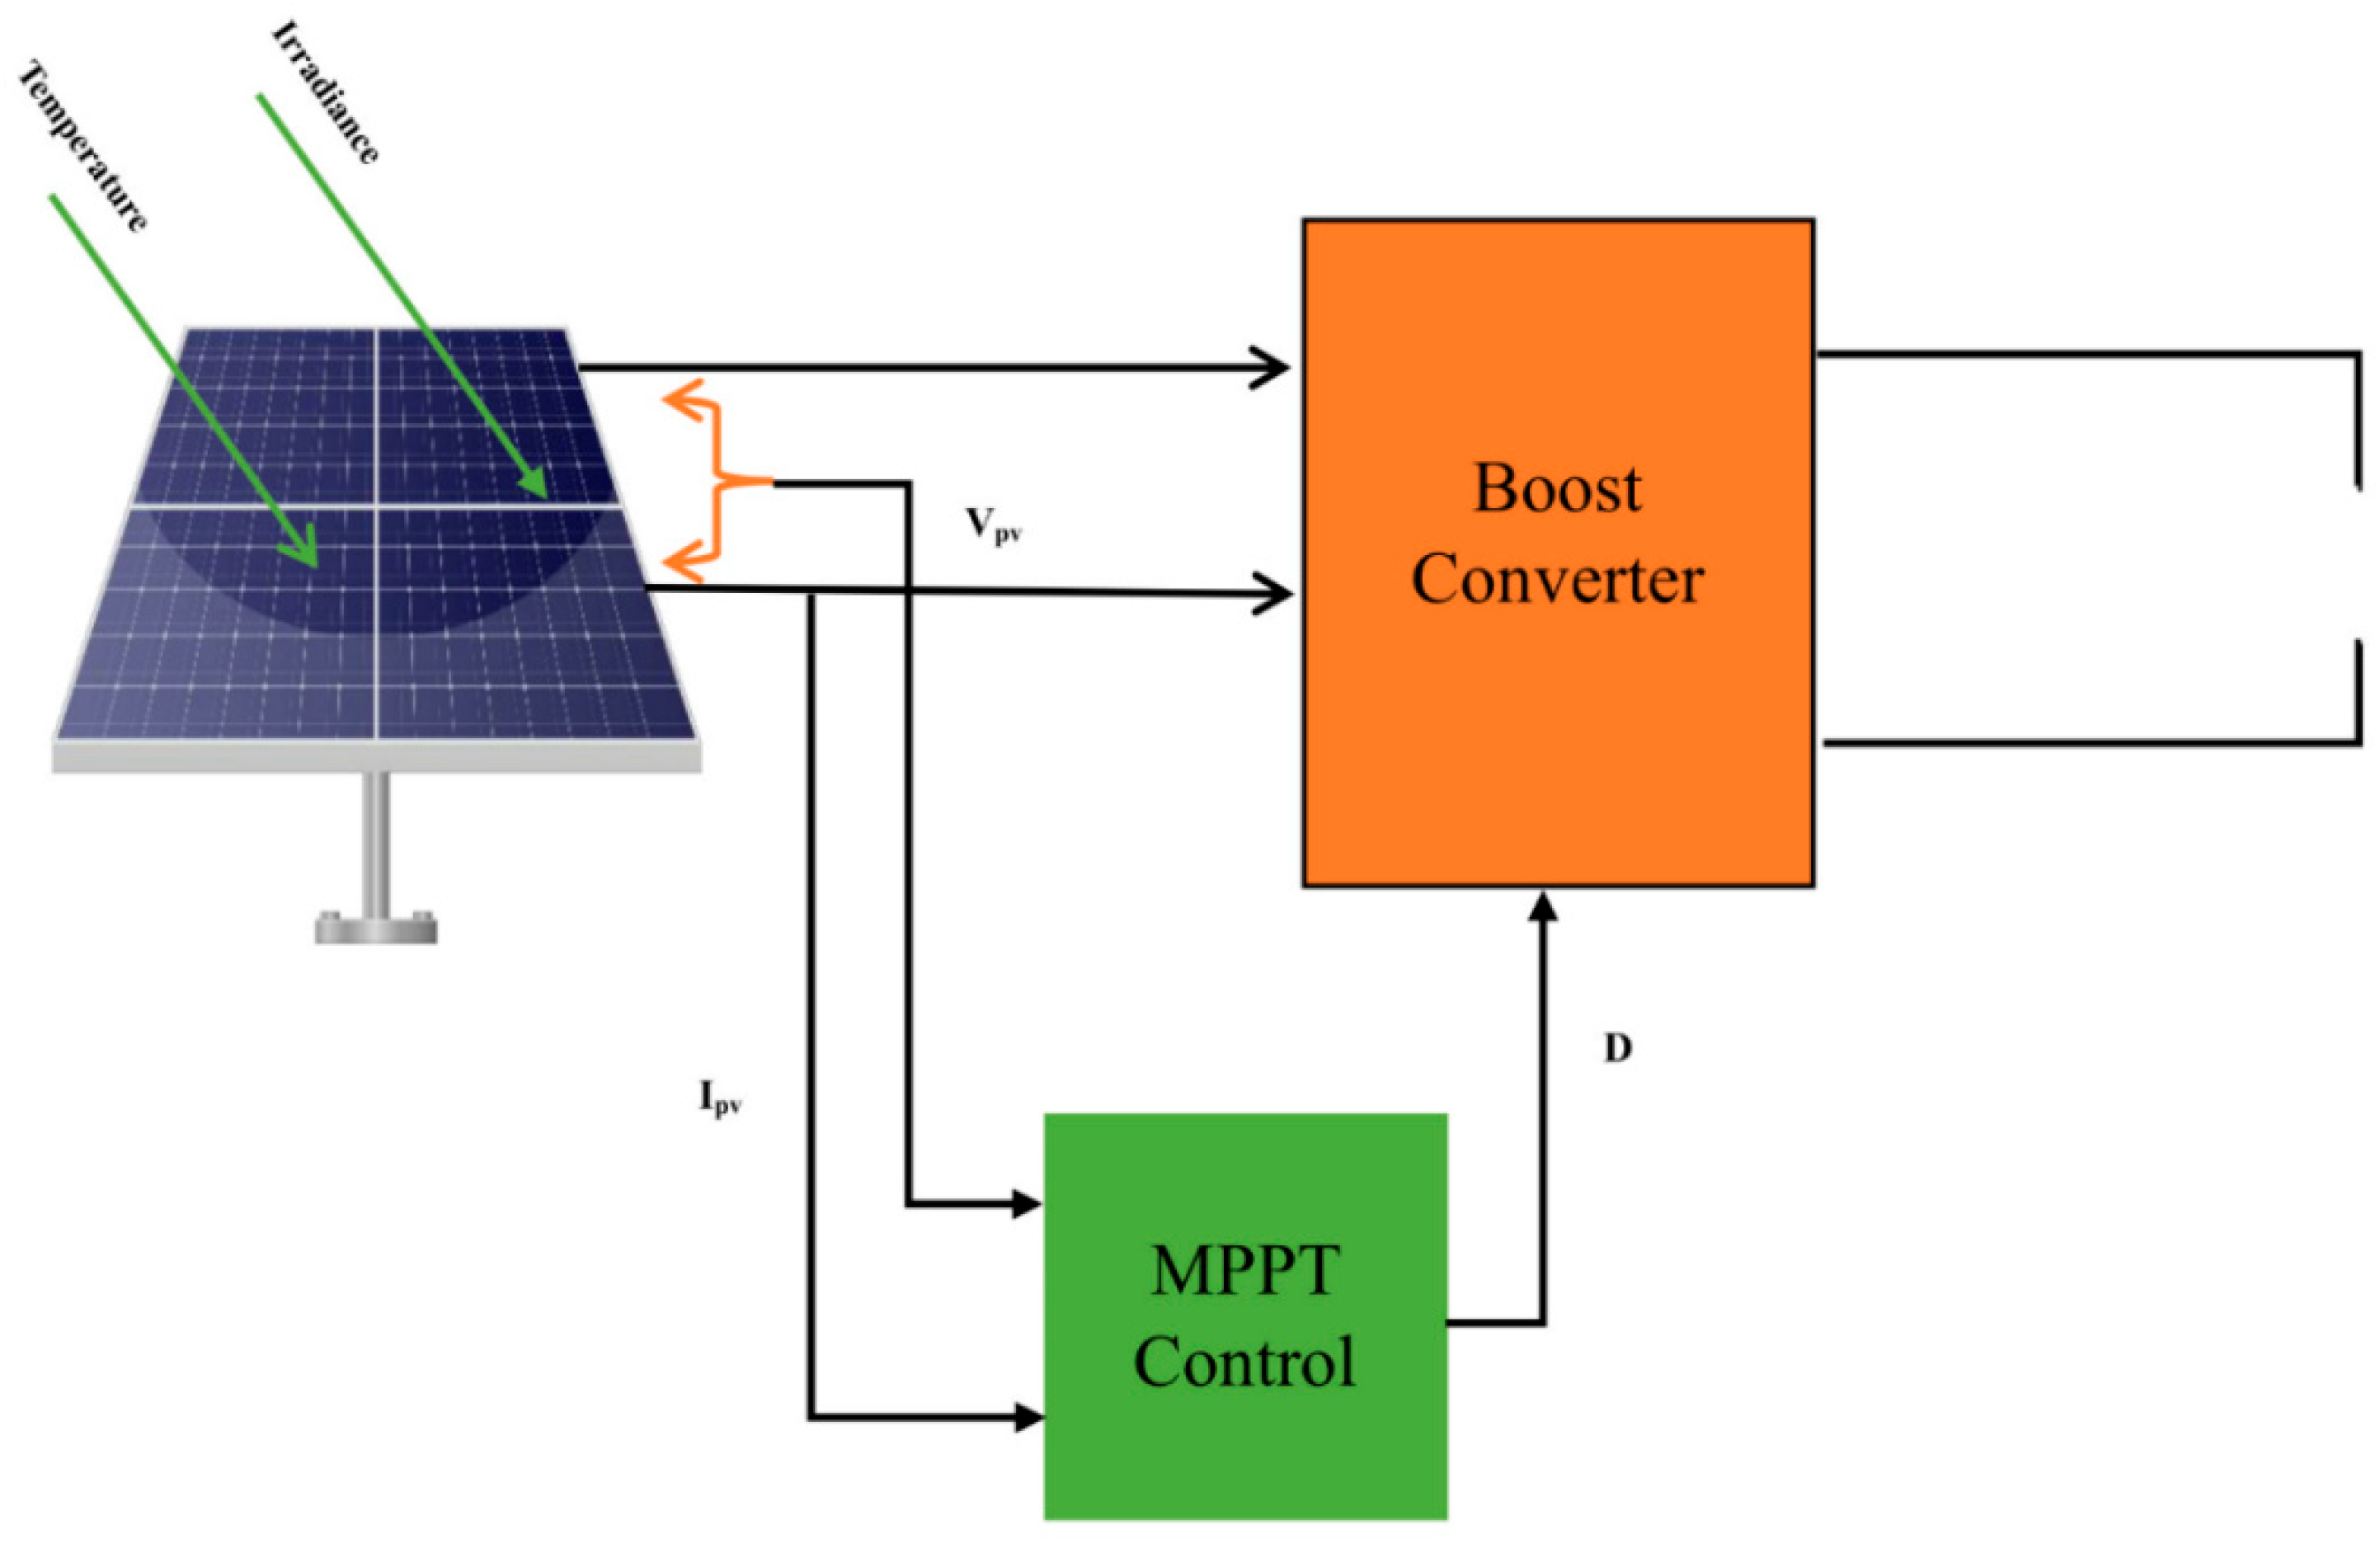
2.1. Mathematical Model of Solar Cell

To derive the output power equations for a solar PV system in terms of Iph (photogenerated current) and Id (diode current), we can use the standard equations governing the behavior of a solar cell under illumination. The output power PPV of the solar PV system can be expressed as the product of the voltage VPV and the current IPV generated by the solar cell, as shown in Figure 1, which represents the configuration for a PV System:
P P V   = V P V × I P V
The voltage VPV can be approximated as the difference between the open-circuit voltage Voc and the product of the diode ideality factor n, the thermal voltage Vt, and the natural logarithm of the ratio of the photo generated current Iph to the diode current Id:
V P V = V O C n × V t × ln I d I p h
Substituting this expression for VPV into the equation for PPV, we get:
P P V   = V O C n × V t × ln I d I p h × I P V
The mathematical model of a solar PV system typically includes equations representing the current-voltage (I-V) and power-voltage (P-V) characteristics of the PV array. The I-V characteristic equation can be represented as:
I P V = I p h d e V p v + I p h . R S n V T 1
Substituting this expression for IPV into the equation for PPV, we obtain the final expression for the output power of the solar PV system in terms of Iph and Id:
P P V   = V O C n × V t × ln I d I p h × I p h I d e V p v + I p h . R S n V T 1

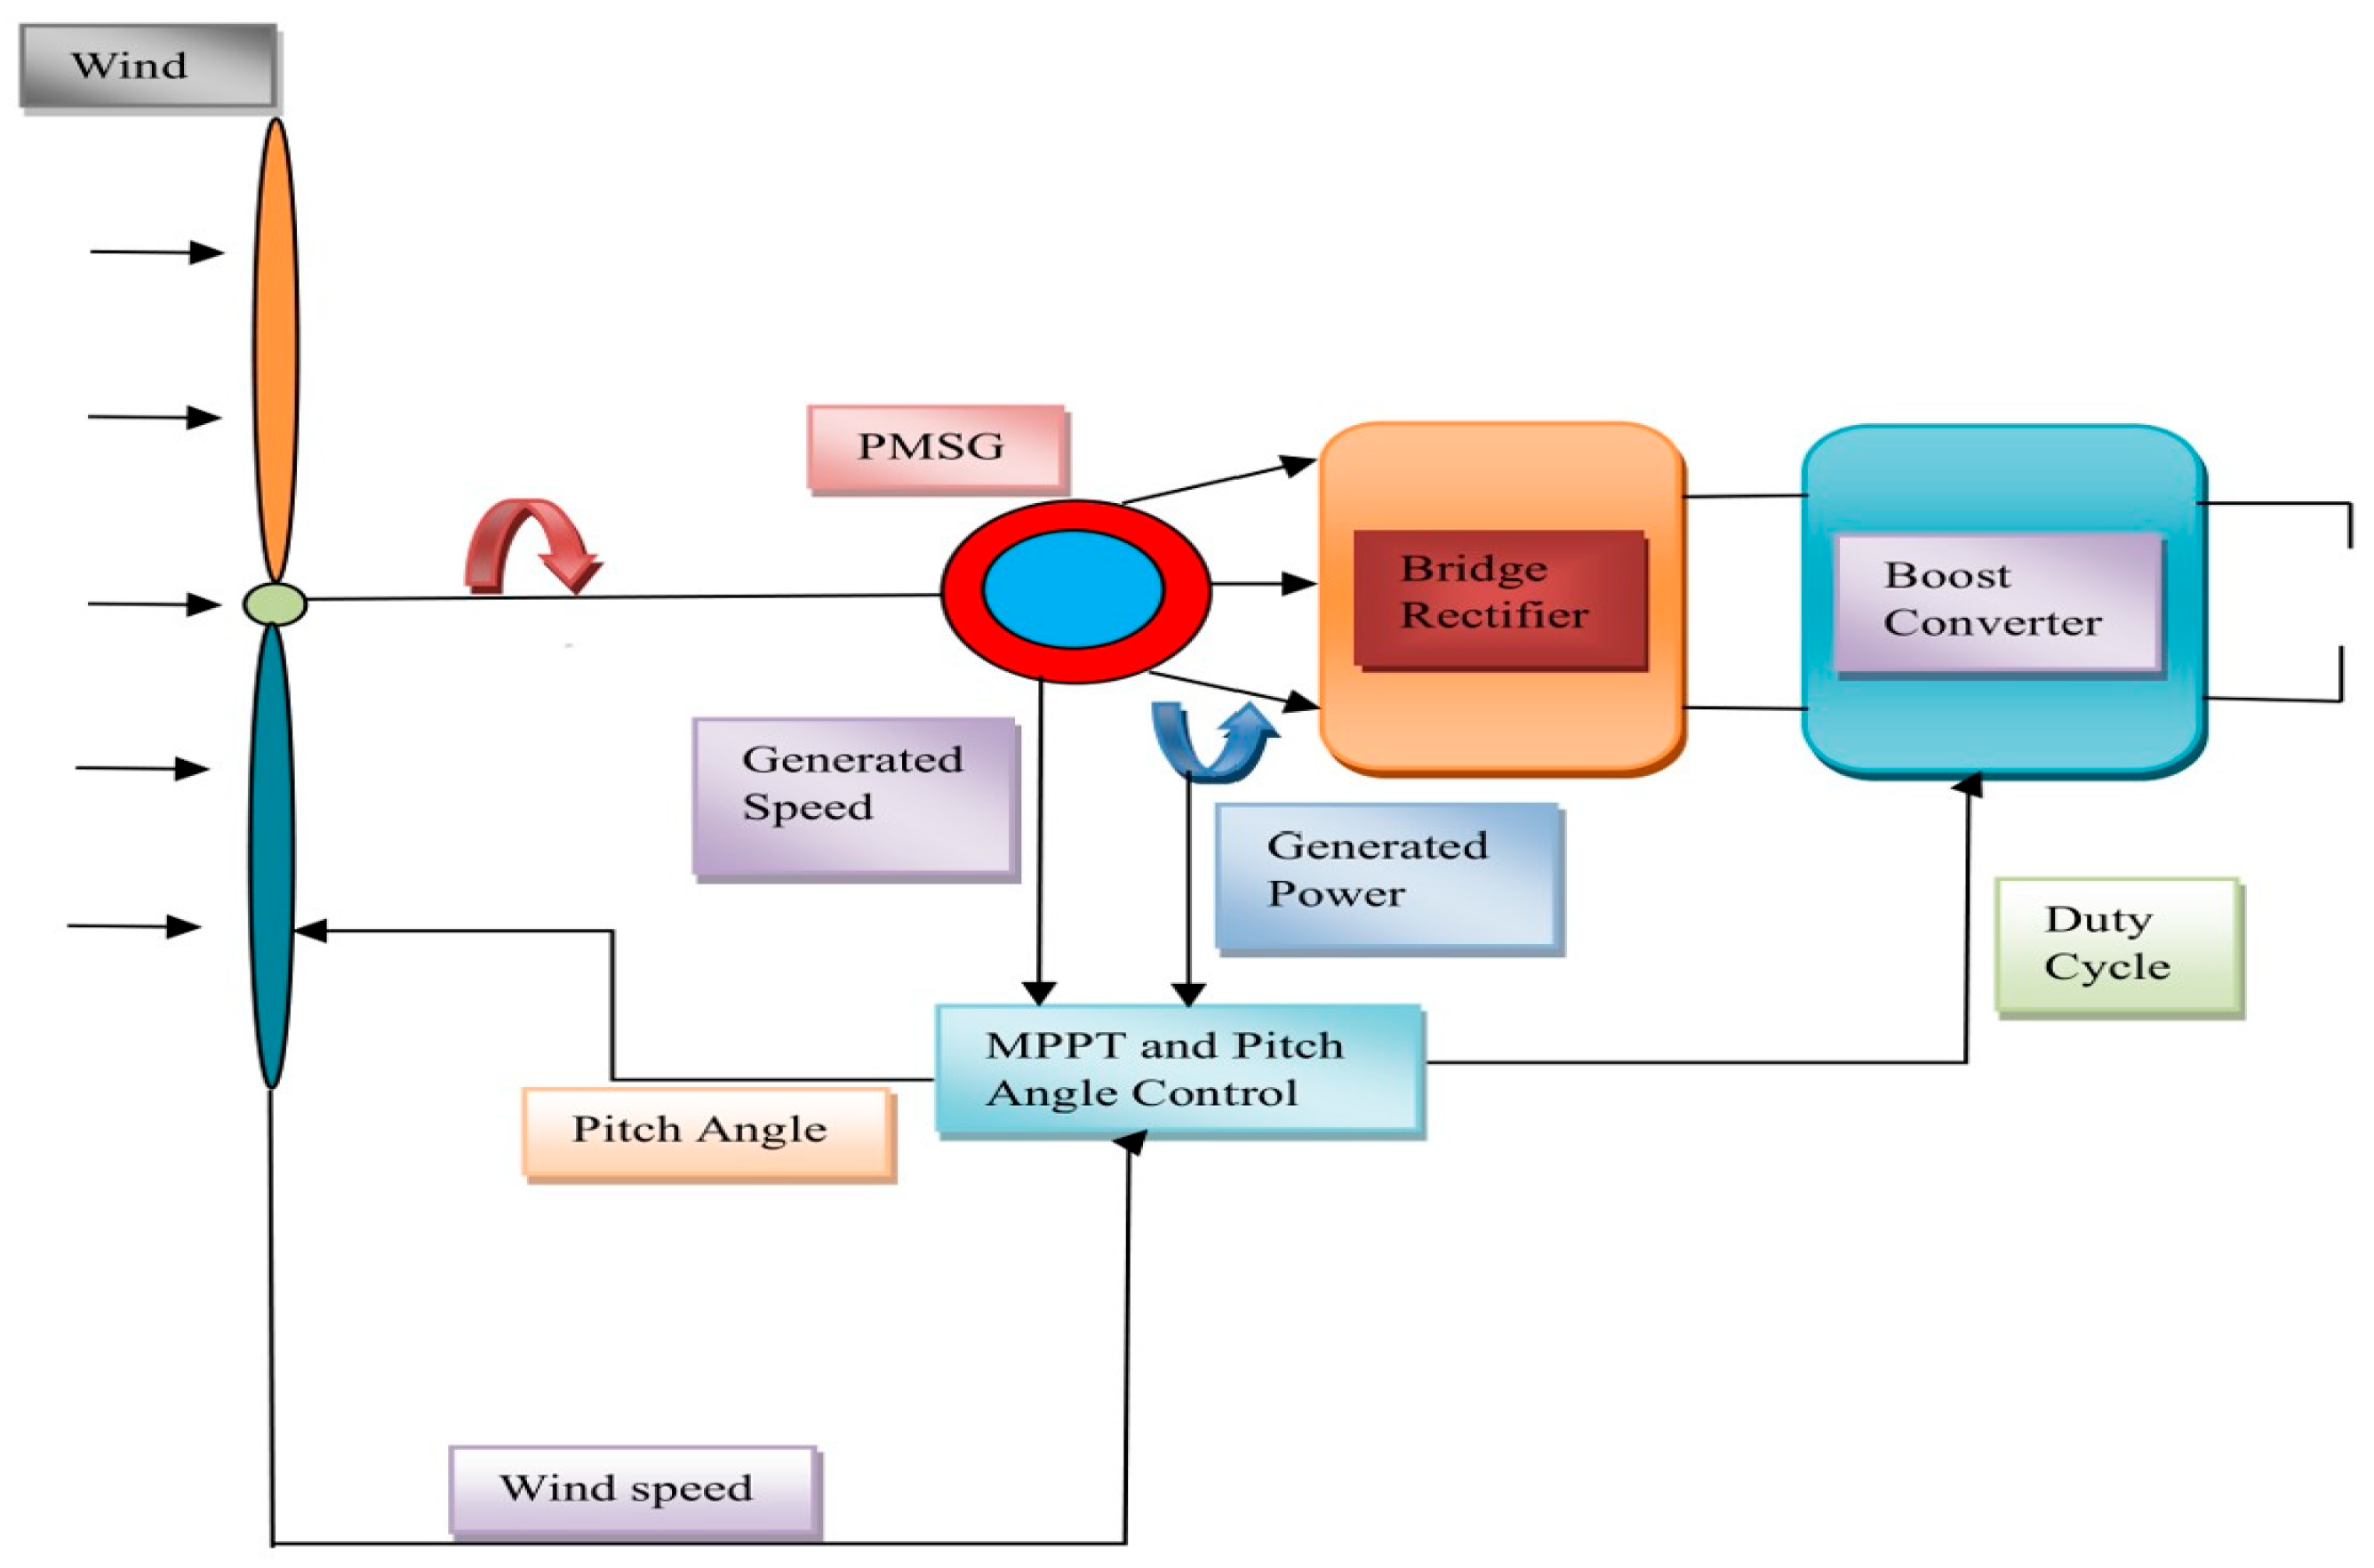
2.2. Mathematical Model of WECS

The power coefficient Cp ( λ , β) is defined as the ratio of the power extracted by the turbine to the kinetic power available in the wind. It depends on various factors such as the turbine design, blade profile, and wind conditions. The power extracted by the turbine is given by the product of the air density ρ, the swept A, the wind V ω , ω r is the angular velocity of the generator, λ is Tip Speed Ratio and β is the blade pitch angle, as shown in Figure 2, which represents the configuration for a WECS System:
The kinetic power available in the wind PWind is given by
P W i n d = 1 2 × ρ × A × V ω 3
The power extracted by the turbine PTurbine is:
P T u r b i n e = P W i n d × C P ( λ , β )
Substituting PWind into the equation for PTurbine
P T u r b i n e = 1 2 × ρ × A × V ω 3 × C P ( λ , β )
So, the output power equation for the WT system
P o u t p u t = 1 2 × ρ × A × V ω 3 × C P ( λ , β )
C1, C2, C3, C4, C5, and C6 are constants, and λ is the tip-speed ratio.
C P λ , β = C 1 C 2 λ 1 C 3 × β C 4 × β C 5 e C 6 λ i
C P = 0.41034
1 λ i = 1 1 + 0.08 β 0.035 1 + β 3
λ i = 11.304
λ = ω r   R V ω

2.3. Battery Energy Storage Systems and Their Enhancements

To derive the output power equations for a Battery Energy Storage System (BESS) in an energy management system, we need to consider various factors that affect the power output of the battery. Here is a mathematical derivation:
The power output Pout of a battery can be calculated as the product of the battery voltage VBatt and the battery current IBatt:
P o u t = V B a t t × I B a t t
The battery voltage depends on various factors, including the state of charge SoC of the battery SoC, the load connected to the battery RLoad, and the internal resistance of the battery Rint:
V B a t t = E B a t t I B a t t × R B a t t
where E B a t t is the open-circuit voltage of the battery, which varies with the state of charge.
The battery current I B a t t depends on the load connected to the battery RLoad and the battery voltage VBatt:
I B a t t = V B a t t R L o a d
Substituting the expression for battery current into the equation for power output, we get:
P o u t = E B a t t I B a t t × R B a t t ×   V B a t t R L o a d
P o u t = E B a t t × V B a t t R L o a d I B a t t × R B a t t R L o a d
P o u t = E B a t t 2 R L o a d V B a t t 2 × R B a t t R L o a d
This equation represents the output power of the battery Pout in terms of the battery’s open-circuit voltage E B a t t , the battery’s internal resistance Rint, the load resistance RLoad, and the battery voltage VBatt.
Energy Stored in the Battery is E s t o r e d , Maximum State of Charge of the battery (dimensionless, in percentage) is S o C m a x , Minimum State of Charge of the battery (dimensionless, in percentage) is S o C m i n , Charging efficiency of the battery (dimensionless, typically between 0 and 1) is η c h a r g e , Discharging efficiency of the battery (dimensionless, typically between 0 and 1) is η d i s c h a r g e , Charging power of the battery (kW) is P c h a r g e , Discharging power of the battery (kW) is P d i s c h a r g e ,Time step (hours) is Δ t and the total amount of energy a battery can store, (kWh) C B a t t .
P c h a r g e = V B a t t × I B a t t η c h a r g e
P d i s c h a r g e = V B a t t × I B a t t × η d i s c h a r g e
E s t o r e d = S o C × C B a t t
Change in Energy Δ E s t o r e d over a time step Δ t :
Δ E s t o r e d = P c h a r g e P d i s c h a r g e Δ t
Change in SoC, S o C over a time step Δ t :
S o C = Δ E s t o r e d C B a t t
New SoC, S o C n e w after a time step Δ t :
S o C n e w = S o C o l d + S o C  
Ensuring SoC stays within bounds:
S o C n e w = m a x ( m i n ( S o C n e w ,   S o C m a x ) S o C m i n
These equations describe the power flow and SoC dynamics of a BS over a time step Δ t . By iteratively applying these equations, the behavior of the BS can be modeled accurately over time, considering both charging and discharging operations while ensuring that the SoC remains within the specified bounds.

2.4. Microturbine Energy Contribution

To derive the output power equations for a Micro Turbine Generator (MTG) with fuel in an energy management system, we will consider the thermodynamic principles involved in the combustion process and the power generation mechanism of the turbine, as shown in Figure 3, which represents equivalent Circuit for MT System.
The combustion of fuel in the Micro Turbine follows the equation:
C H 4 + 2 O 2 C O 2 + 2 H 2
By measuring the mass flow rate of air through the turbine and the enthalpy change, the MTG can produce electricity. Assuming steady-state operation, the power output P M T G can be expressed as:
P M T G = η M T G × m c o m p r e s s e d   a i r . × L H V f u e l
where,
  • η M T G is the efficiency of the microturbine
  • L H V is lower heating value.
The mass flow rate of air m c o m p r e s s e d   a i r . can be calculated using the density of compressed air ρ c o m p r e s s e d   a i r , inlet area A i n l e t , and inlet velocity V c o m p r e s s e d   a i r :
m c o m p r e s s e d   a i r . = ρ c o m p r e s s e d   a i r × A i n l e t × V c o m p r e s s e d   a i r
The density of air ρ c o m p r e s s e d   a i r can be calculated using the ideal gas law:
ρ c o m p r e s s e d   a i r = P a t m R a i r × T a i r
P a t m is the atmospheric pressure, R a i r = 287   J / k g K is the specific gas constant for air, and T c o m p r e s s e d   a i r is the temperature of the compressed air.
The enthalpy change H can be obtained from the enthalpy of combustion h c o m b u s t i o n of fuel:
H = h c o m b u s t i o n = η c o m b u s t i o n × Q f u e l
η c o m b u s t i o n is the combustion efficiency, and Q f u e l is the heating value of the fuel.
Substituting the expressions for m c o m p r e s s e d   a i r . , H , and ρ c o m p r e s s e d   a i r into the power generation equation, we get:
P M T G = η M T G × P a t m R a i r × T a i r × A i n l e t × V a i r × η c o m b u s t i o n × Q f u e l ( c o m p r e s s e d   a i r )

2.5. MPPT Control

To derive the mathematical expressions for MPPT control of PV and WT systems using a hybrid algorithm combining JSO and GJO, we need to establish the equations representing the power generation of each system, the objective function for MPPT, and the optimization algorithm. Let us break it down for each system:

2.5.1. Solar PV System

  • Power Generation Equation
    P P V = V P V × I P V
  • MPPT Objective Function:
    M a x i m i z e   P P V
  • Hybrid Optimization Algorithm
    X h y b r i d = α × X J S O + 1 α × X G J O
The parameter α functions as the hybridization factor to balance the process of searching globally via ( X J S O ) with the process of searching locally through ( X G J O ).

2.5.2. Wind Turbine System

  • A MPPT Control Equation:
    V P V = X h y b r i d   ( V P V ,   I P V )
  • Power Generation Equation:
    P W i n d = 1 2 × ρ × A × V ω 3
  • The power extracted through the turbine is given by the product of the air density ρ, the swept A, the wind V ω , ω r is the angular velocity of the generator.
  • MPPT Objective Function:
    M a x i m i z e   P W T
  • Hybrid Optimization Algorithm
    X h y b r i d = α × X J S O + 1 α × X G J O
    where α is the hybridization parameter controlling the balance between global exploration ( X J S O ) and local exploitation ( X G J O ).
  • MPPT Control Equation:
    V W T = X h y b r i d   ( V W T ,   I W T )
The proposed mathematical model defines the process for Maximum Power Point tracking control of Photovoltaic and Wind Turbine systems through JSO-GJO hybrid optimization. The power output maximum is the optimization goal of the hybrid algorithm which controls operating parameters (PV voltage and WT wind speed). The modification of these operating parameters allows systems to reach their maximum power points which results in optimized energy harvesting performance.

2.6. Boost Converter

The following section establishes mathematical expressions for the boost converter and its capability to increase the input voltage before generating elevated output voltages within the EMS system. The boost converter consists of a switch (MOSFET), an inductor (L) and a capacitor (C) alongside a diode during its operation, which divides into two fundamental states of switch position: ON and OFF mode.
Both ON and OFF modes involve specific voltage and current relations which Table 2 explains carefully for the inductor and capacitor. The equations serve as core components for boost converter simulation and operation optimization within the EMS.
Where V i n p Input voltage to the boost converter, V o u t : Output voltage of the boost converter, D : Duty cycle of the switch (ON time/(ON time + OFF time)), V L : Voltage across the inductor, I L : Current flowing through the inductor, V C : Voltage across the capacitor, I c : Current flowing through the capacitor, T O N : ON time of the switch, T O F F : OFF time of the switch, f   s w i t c h : Switching frequency of the boost converter.
V o u t = V C
I o u t = I C

2.7. Bi-Directional Converter

This section outlines the derivation of voltage, current, and power equations governing the bidirectional DC-DC converter used in battery charging and discharging operations within the EMS. By applying fundamental energy conversion principles, we model the converter’s performance under both charging and discharging modes, capturing the dynamics essential for accurate EMS control and optimization.
The voltage, current, and power equations which describe the converter in its two operational modes appear in Table 3. The system of equations serves as a simulation foundation for converter modeling so EMS operators can achieve effective and efficient battery operation.
The equations explain mathematical rules for representing the bi-directional DC-DC converter throughout EMS operation in charging and discharging conditions. The duty cycle of the converter determines relationships between all input and all output voltages currents and powers. These mathematical rules enable analysis of and design work for efficient energy management systems that enable battery-to-load two-way energy movements.

2.8. PI-Controller

The mathematical expressions need derivation for both PI controllers; one in the BMS and the other in the tip speed ratio of the WT in an EMS.

2.8.1. PI Controller in Battery System (BS)

BSS systems use the PI controller as a standard method to regulate charging and discharging currents for fulfilling load requirements and SoC maintenance. The duty cycle of the DC-DC Bi-directional converter operates according to the control output from the PI controller.
The mathematical expression for a PI controller is given by:
u t = K p e t + K i 0 t e τ d τ
where u t is the control input to the system (charging or discharging current), e t the error signal (difference between the desired SoC and the actual (SoC) K p is the proportional gain, and K i is the integral gain, 0 t e τ d τ is the integral of the error signal over time.
The control output u t is used to adjust the charging or discharging current of the battery system
P B S = V B S × I B S
where P B S is the power output of the BS, V B S is the voltage, and I B S is the current flowing into or out of the battery.

2.8.2. PI Controller in Tip Speed Ratio of Wind Turbine (WT)

The tip speed ratio (TSR) is an important parameter in wind turbine control, as it determines the optimal rotational speed of the blades for maximum power extraction from the wind. A PI controller is often used to adjust the pitch angle of the blades or the generator torque to maintain the TSR at its desired value.
The mathematical expression for the TSR PI controller is similar to the standard PI controller, with the control output used to adjust the pitch angle or generator torque of the wind turbine. Let us denote the TSR reference as T S R r e f and the actual TSR as T S R a c t u a l . Then, the expression for the TSR PI controller is:
u t = K p T S R r e f T S R a c t u a l + K i 0 t T S R r e f T S R a c t u a l d τ
where u t is the control input to the system (pitch angle or generator torque), T S R r e f T S R a c t u a l the error signal (difference between the desired SoC and the actual SoC), K p is the proportional gain, and K i is the integral gain, 0 t T S R r e f T S R a c t u a l d τ is the integral of the error signal over time.
The control output u t   is used to adjust the pitch angle or generator torque of the wind turbine to maintain the TSR at its desired value.
These mathematical expressions describe how PI controllers are used in both the battery system and the tip speed ratio control of the wind turbine in an energy management system.

2.9. ANN Controller in Pitch Angle Optimization of WT

To derive the mathematical expressions for modeling ANN controller in the pitch angle optimization of a WT within an EMS, we need to define the structure of the ANN and its training process. Here is a step-by-step derivation:

Mathematical Expression

  • Let x 1 , x 2 , , x n represent the input variables (e.g., wind speed, generator speed);
  • Let w i j represent the weight connecting neuron i in the input layer to neuron j in the hidden layer;
  • Let b j represent the bias term for neuron j in the hidden layer;
  • Let σ ( x ) represent the activation function applied to the output of each neuron in the hidden layer;
  • Let v j k represent the weight connecting neuron j in the hidden layer to neuron k in the output layer;
  • Let c k represent the bias term for neuron k in the output layer;
  • Let f ( x ) represent the predicted optimal pitch angle;
  • The expression for the output of neuron j in the hidden layer is:
    z j = σ i = 1 n w i j x i + b j
  • The expression for the predicted optimal pitch angle f ( x ) is:
    f ( x ) = j = 1 m v j k z j + c k
  • During the training process, the weights w i j , v j k , biases b j , c k , and parameters of the activation function σ ( x ) are adjusted iteratively to minimize the loss function and improve the accuracy of the predicted pitch angle;
  • These mathematical expressions form the basis for modeling an ANN controller for pitch angle optimization of a wind turbine within an Energy Management System.

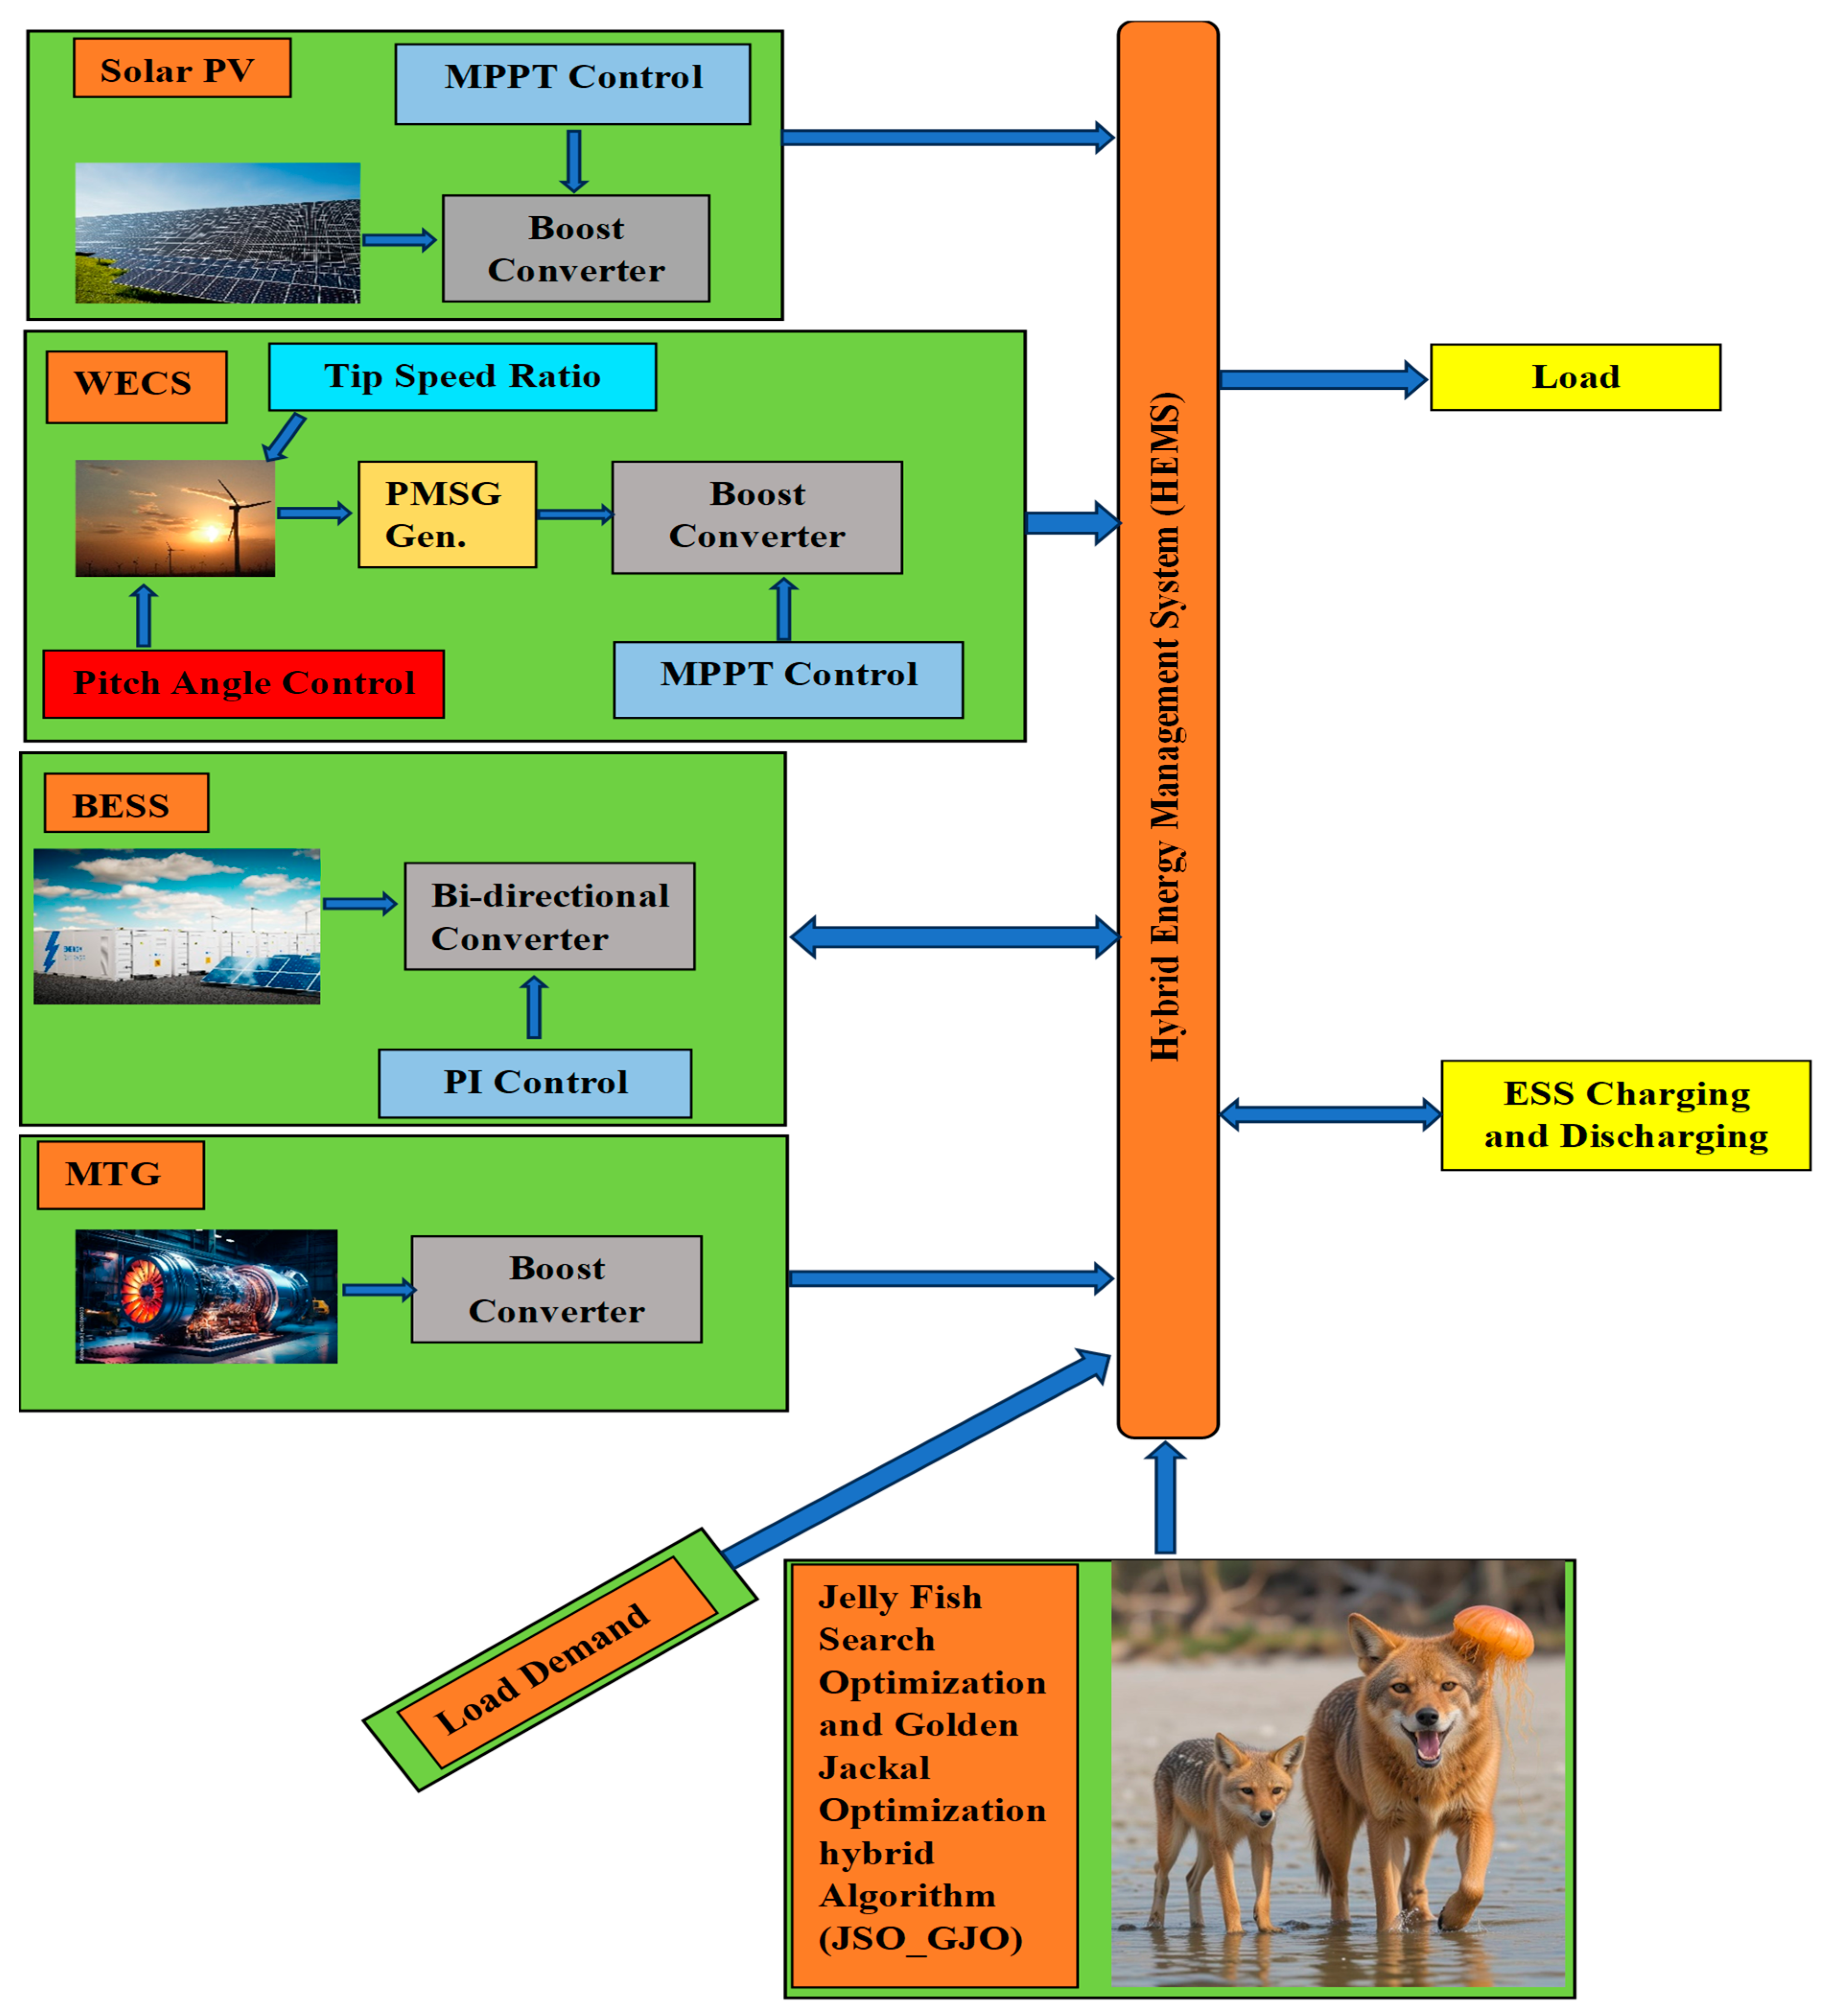
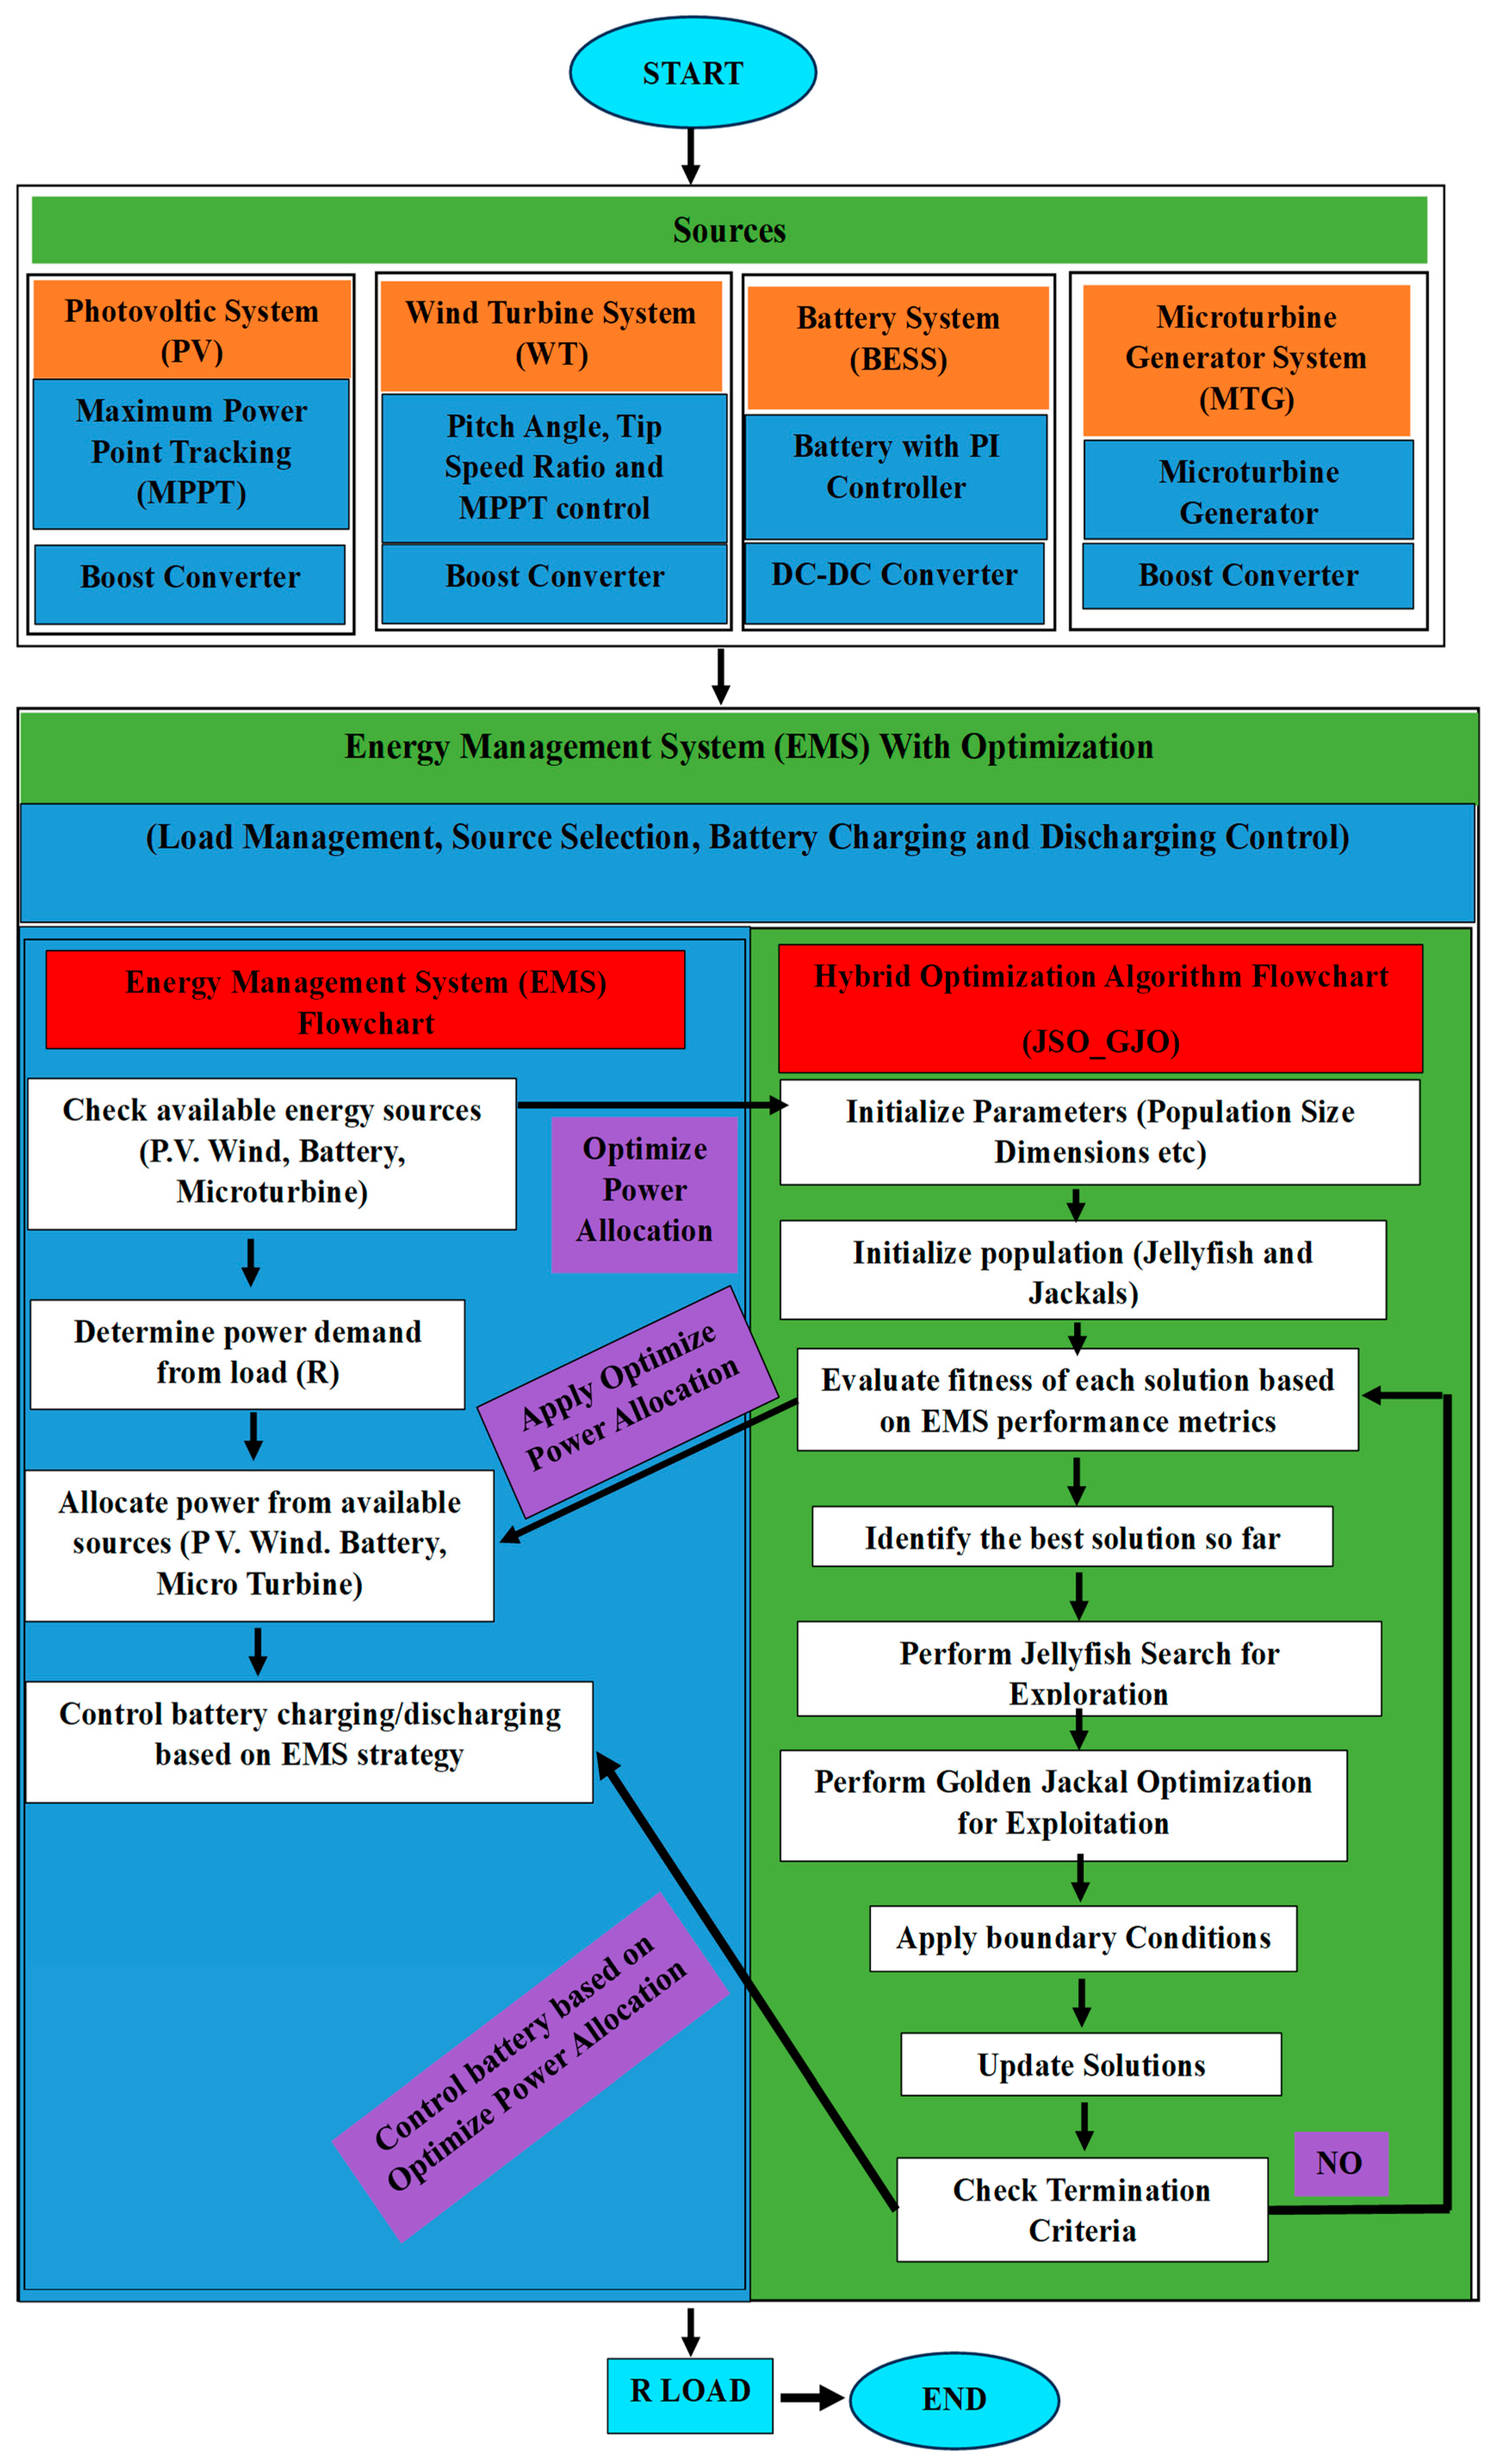
3. Proposed Optimization Framework for EMS

The proposed energy management algorithm utilizing JSO and GJO combines two nature-inspired metaheuristic optimization techniques to optimize the operation of various components within a microgrid. Here is a detailed explanation of how the algorithm works:
  • Jellyfish Search Optimization (JSO):JSO is inspired by the collective behavior of jellyfish in their search for food. In JSO, a population of potential solutions, called “jellyfish”, is initially randomly generated. Each jellyfish represents a potential solution to the optimization problem, with its position in the search space corresponding to a set of control parameters for the energy management system. The jellyfish move through the search space using a combination of random motion and attraction towards better solutions [14,18]. As the jellyfish move, they communicate and share information with each other, allowing them to collectively converge towards promising areas of the search space [19,20]. Through iterative movement and communication, JSO aims to find the optimal set of control parameters that maximize the objective function (e.g., system efficiency) while satisfying any constraints.
    X J S O t + 1 = X J S O t + R . M . + S b e t t e r
    where X J S O represent the current solution in the JSO algorithm, R . M . is the random motion of the fish, and S b e t t e r is the AttractiontowardsBetterSolutions.
  • Golden Jackal Optimization (GJO): GJO is inspired by the foraging behavior of golden jackals in search of food [21]. In GJO, a population of potential solutions, represented by “jackals”, is initialized randomly. Each jackal represents a potential solution, similar to jellyfish in JSO, with its position corresponding to a set of control parameters for the energy management system. The jackals move through the search space using a combination of random exploration and exploitation of promising regions based on the quality of solutions encountered. Like JSO, jackals communicate and share information with each other to collectively converge towards better solutions. GJO aims to find the optimal set of control parameters by iteratively improving the quality of solutions through exploration and exploitation of the search space [15,22].
    X G J O t + 1 = X G J O t + R . E . + E
    where X G J O represent the current solution in the GJO algorithm, R . E . represents RandomExploration and E represents ExploitationofPromisingRegions.

3.1. Hybridization of JSO and GJO for Controller Optimization in EMS

The hybrid JSO-GJO approach leverages JSO’s global search efficiency to identify broader solution spaces, while GJO provides depth by refining solutions locally. This hybrid model uniquely positions JSO as the primary algorithm for expansive search, with GJO fine-tuning within identified regions. This ensures that the controller parameters governing energy production, storage, and delivery are optimally configured. The approach not only improves EMS efficiency but also adapts dynamically to varying conditions, meeting constraints while achieving maximal operational efficacy in isolated hybrid setups.
By combining JSO’s exploratory potential with GJO’s exploitative precision, the JSO-GJO hybrid algorithm introduces a comprehensive model for EMS optimization, showing significant promise in improving energy efficiency and management quality over traditional models. This integration addresses both the extensive search needed for hybrid systems and the refinement required to achieve sustainable power delivery under varying demands.
f x = E x C x
X h y b r i d = α × X J S O + 1 α × X G J O
where E x represent the efficiency function and C x represent the cost function, the objective function f x aims to maximize efficiency and minimize cost in the energy management system. α is the hybridization parameter controlling the balance between global exploration ( X J S O ) and local exploitation ( X G J O ).
  • Parameter Tuning: The hybrid algorithm serves to optimize controller parameters including set points alongside gain values and control strategies according to references [23,24]. The algorithm performs iterative optimization to adjust parameters through which it optimizes system efficiency and upholds operational limits and performance standards.
    Θ * = a r g m i n Θ ( α × X J S O ( Θ ) + ( 1 α ) × X G J O ( Θ ) )
    where Θ * represents the optimized set of parameters that minimize the objective function, a r g m i n Θ finding the value of Θ that minimizes the expression.
  • Dynamic Adaptation:The hybrid algorithm uses dynamic search adaptation for the EMS through modifications based on current operational conditions and environmental factors. When renewable energy generation reaches peak levels, the algorithm adjusts by putting focus on parameters that improve storage and distribution operations. The algorithm operates differently under situations characterized by low generation versus periods with high energy demands.
    α t + 1 = α t + η δ f δ α +   γ 0.5 α t
    where:
    • η = learning rate (0.01);
    • γ = stabilization factor (0.1);
    • δ f δ α = gradient of objective function.
    H i g h   R e n e w a b l e   E n e r g y   G e n e r a t i o n   S t r a t e g y i f   c o n d i t i o n   i s   m e t
    L o w   G e n e r a t i o n   o r   H i g h   D e m a n d   S t r a t e g y i f   c o n d i t i o n   i s   m e t
    where f is a function that determines the value of α at each iteration based on the system state and environmental conditions.
  • Iterative Improvement:The hybrid algorithm executes multiple sequential optimization cycles through which it improves controller parameters based on data received from the EMS. During its execution, the algorithm moves toward an optimal solution which achieves both maximum efficiency levels as well as EMS objectives.
    S n e w = S o l d + γ × X h y b r i d
    where γ is the iteration factor controlling the rate of convergence towards the optimal solution, S n e w and S o l d are new and old solutions, respectively.
  • Performance Evaluation: Throughout the optimization process, the performance of the EMS is continuously evaluated based on predefined metrics such as efficiency, reliability, and cost-effectiveness. The hybrid algorithm aims to find controller parameters that optimize these metrics while ensuring the smooth and reliable operation of the EMS.
    P M = α × X J S O ( Θ * ) + ( 1 α ) × X G J O ( Θ * )
    P M = η C o s t × R
    where PM is Performance matrices, η is efficiency and R is Reliability.
JSO-GJO algorithm is the integration of Jellyfish Search Optimization ocean current motion that offers broader exploration compared with other optimization techniques, and Golden Jackal Optimization collaborative hunting that provides more precise local optimization than others. Our method has the following three key advantages: (1) JSO’s fluid like exploration is more broad than other swarm based techniques; (2) GJO’s local search inspired local search is more robust than other metaheuristic algorithms; (3) our dynamic α by which we adapt exploration and exploitation is more efficient than fixed hybridization heuristic. Figure 4 shows the superiority of this biologicallyinspired dual strategy in optimizing the EMS in terms of dynamically responding to the fluctuations in renewable power while still providing a desired system performance. In addition, the algorithm has great potential when dealing with the intermittent features of hybrid microgrid systems.

3.2. Hybrid Optimization for Charging and Discharging Operations

Charging and discharging operations in an EMS involve managing energy flow to and from energy storage systems, such as batteries, to ensure reliable power supply to the load while maximizing the utilization of renewable energy sources. The hybrid optimization approach using JSO and GJO algorithms can optimize these operations by dynamically adjusting charging and discharging schedules based on real-time data and system constraints.
  • Charging Optimization: The combined operation of JSO and GJO algorithms enables optimized energy storage system charging by monitoring renewable energy outputs, load requirements and battery status. The solution space exploration capability of JSO helps detect efficient charging methods that GJO subsequently enhances through its adaptive strategy optimization techniques.
    P t c h a r g e = α × X J S O + 1 α × X G J O
    where the charging parameters include charging rates, timings, renewable energy forecasts, load demand profiles, and battery health parameters. P t c h a r g e is the charging power at time t , and α is the hybridization parameter controlling the balance between JSO and GJO.
  • Discharging Optimization: Under hybrid optimization, the scheduling system benefits from maximized energy efficiency by managing the discharge regime of energy storages to maintain reliable power distribution. JSO and GJO algorithms operate as a coordinated system for dynamic adjustments of release rates and time frames according to present load requirements, renewable energy availability and grid state for optimal stored energy use.
    P t d i s c h a r g e = α × X J S O + 1 α × X G J O
    where the discharging parameters include discharging rates, timings, real-time load demand, renewable energy availability, and standalone conditions. P t d i s c h a r g e is the discharging power at time t , and α is the same hybridization parameter as in the charging process.
  • Battery State of Charge (SoC) Update: The battery’s state of charge (SoC) at time t + 1 can be updated based on the charging and discharging processes as follows:
    S o C t + 1 = S o C t + P t c h a r g e P t d i s c h a r g e C B a t t
    where the total amount of energy a battery can store, (kWh) C B a t t .
By incorporating JSO and GJO algorithms into the charging and discharging processes of the battery in the Energy Management System (EMS) and adjusting the hybridization parameter α, we can optimize the charging and discharging operations effectively. This hybridization allows the system to benefit from both algorithms by combining the global exploration capabilities of JSO with the local exploitation strengths of GJO, leading to improved performance and efficiency in battery management.
The process begins by measuring the voltage and the required power across the system. Based on these measurements, the system evaluates the need for the battery in Logic No.1. If the outcome is “True”, solar charging is initiated; if “False”, the system proceeds to Logic No.2 to further assess the battery requirement. If Logic No.2 returns “True”, wind charging is activated. Otherwise, the system checks Logic No.3, which, if “True”, initiates both solar and wind charging simultaneously. If Logic No.3 is “False”, the process terminates.
This flowchart, as shown in Figure 5, demonstrates the structured approach of the EMS in dynamically selecting charging methods, supporting the adaptive JSO-GJO hybrid algorithm in real-time decision-making for efficient battery charging and management.

3.3. Hybrid Optimization in Operation of Renewable Energy Sources and Backup Systems

In addition to optimizing charging and discharging processes, the hybrid optimization approach can also optimize the operation of various energy sources based on load demand and available resources [16,17]:
  • Solar PV System: When solar energy generation is sufficient to meet the load demand, the hybrid optimization approach ensures optimal utilization of solar panels by MPPT to maximize energy capture. JSO and GJO algorithms collaborate to explore and exploit optimal operating conditions for solar panels based on real-time solar irradiance and load demand.
    f x = E x C x
    X h y b r i d ( P V ) = α × X J S O ( P V ) + 1 α × X G J O ( P V )
    where PV parameters include real-time solar irradiance and load demand.
  • Wind Turbine System (WT): Similarly, when wind energy generation is available, the hybrid optimization approach optimizes the operation of wind turbines by adjusting the blade pitch angle and MPPT to maximize power output. JSO and GJO algorithms work together to identify optimal operating parameters for wind turbines based on wind speed forecasts and load demand.
    f x = E x C x
    X h y b r i d ( W T ) = α × X J S O ( W T ) + 1 α × X G J O ( W T )
    where WT parameters include wind speed forecasts and load demand.
  • Solar + Battery System: In cases where solar energy generation exceeds the immediate load demand, the excess energy can be stored in batteries for later use. The hybrid optimization approach optimizes the charging and discharging schedules of batteries to efficiently manage the balance between solar generation and load demand, maximizing self-consumption and minimizing grid dependence.
    f x = E x C x
    X h y b r i d ( P V + B S ) = α × X J S O ( P V + B S ) + 1 α × X G J O ( P V + B S )
    where Battery parameters include solar generation, load demand, and battery state of charge.
  • Solar + Wind System: When both solar and wind energy sources are available, the hybrid optimization approach dynamically allocates power generation between the two sources based on their respective output and load demand [16]. JSO and GJO algorithms collaborate to optimize the operation of both solar panels and wind turbines, ensuring optimal utilization of available renewable energy resources.
    f x = E x C x
    X h y b r i d ( P V + W T ) = α × X J S O ( P V + W T ) + 1 α × X G J O ( P V + W T )
    where P V + W T parameters include solar and wind output and load demand.
  • Solar + Wind + Battery System:In cases where solar and wind energy generation alone cannot meet the load demand, the hybrid optimization approach utilizes energy stored in batteries to bridge the gap [17,25]. JSO and GJO algorithms optimize the coordination between renewable energy generation and battery storage, ensuring reliable power supply to the load while minimizing grid dependence.
    f x = E x C x
    X h y b r i d ( P V + W T + B S ) = α × X J S O ( P V + W T + B S ) + 1 α × X G J O ( P V + W T + B S )
    where P V + W T + B S parameters include solar and wind generation, battery state of charge, and load demand.
  • Microturbine Backup System: In situations where renewable energy generation is insufficient or unavailable, a microturbine can serve as a backup power source to supplement energy supply [26]. The hybrid optimization approach dynamically activates the microturbine based on load demand and renewable energy availability, ensuring uninterrupted power supply during periods of low renewable energy generation.
    f x = E x C x
    X h y b r i d ( M T ) = α × X J S O ( M T ) + 1 α × X G J O ( M T )
    where Microturbine parameters include load demand and renewable energy availability.
By incorporating these equations into the hybrid optimization approach, the BEMS can dynamically adjust charging and discharging operations across various renewable energy cases to maximize efficiency, minimize operational costs, and ensure reliable power supply to the load.
In summary, the hybrid optimization approach using JSO and GJO algorithms can enhance the performance of an EMS by optimizing charging and discharging operations and the operation of various renewable energy sources and backup systems based on load demand. By leveraging the strengths of both algorithms, we can achieve optimal utilization of renewable energy resources, maximize system reliability, and minimize energy costs and environmental impacts. Table 4 and Figure 6 below represent the working operation of EMS.

3.4. Cost Analysis with Optimization

The evaluation of an EMS based on hybrid optimization through JSO and GJO algorithms requires complete cost analysis for feasibility and economic assessments. System implementation costs with their parts, installation expenses, operational costs and maintenance costs form the basis for assessment under this extensive analysis, which additionally includes energy savings potential alongside financial incentives and Total Cost of Ownership (TCO).

3.4.1. Initial Cost

The initial cost of the EMS includes expenses related to acquiring and installing system components, such as renewable energy sources (PV and WT), ESS (BS), control and monitoring systems, and backup power sources (MT). These costs consist of the purchase price of equipment, installation fees, and integration costs [15,16]. Additional expenses like site preparation, labour, wiring, and electrical connections further contribute to the initial investment. The initial cost can be expressed as:
C i n t = i = 1 N C C p t + C I n s t  
where C i n t is initial Cost, C C p t is the Component Cost and C I n s t   is the Installation Cost, N is the total number of system components, and Component Cost and Installation Cost represent the purchase price and installation expenses, respectively.

3.4.2. Operational Costs

Operational costs refer to the ongoing expenses involved in maintaining and running the EMS, such as routine maintenance, repairs, and servicing of system components to ensure optimal performance. Monitoring costs involve tracking energy generation, consumption, and system performance, which may require dedicated personnel or software tools [27]. Software maintenance, including updates for the JSO and GJO algorithms, adds to these operational expenses. Operational cost can be represented as:
C O p = i = 1 N C M a i n t + C M o n + C S o f t
where Operational cost is Denoted by C O p Maintenance Cost is denoted by C M a i n t , Monitoring Cost is denoted by C M o n , and Software Maintenance Cost is denoted by C S o f t which represent expenses related to routine maintenance, system monitoring, and software updates, respectively.

3.4.3. Financial Incentives

The financing possibilities including government subsidies in combination with tax credits and rebates help reduce the priced cost of installation of renewable energy systems and expand the appeal of EMS programs. The initiatives and rebates along with tax credits reduce the original expense of the device, therefore calculating the net initial price.
C N e t = C i n t C F I
where C N e t is net initial cost, C i n t is the initial cost of the system, C F I is Financial Incentives include government incentives, tax credits, and rebates.

3.4.4. Total Cost of Ownership (TCO)

The Total Cost of Ownership (TCO) method shows the complete economic picture for an EMS system because it combines both initial financial investment with operational expenses along with energy costs throughout the system’s operational life. The evaluation model provides stakeholders with information about the complete economic influence of the EMS. The TCO is calculated as:
T C O = C N e t + C O p
T C O = C i n t C F I + C O p
T C O = i = 1 N C C p t + C I n s t   C F I + i = 1 N C M a i n t + C M o n + C S o f t
T C O P V = i = 1 N C P V C p t + C P V I n s t C P V F I + i = 1 N C P V M a i n t + C P V M o n + C P V S o f t
T C O W T = i = 1 N C W T C p t + C W T I n s t C W T F I + i = 1 N C W T M a i n t + C W T M o n + C W T S o f t
T C O B S = i = 1 N C B S C p t + C B S I n s t C B S F I + i = 1 N C B S M a i n t + C B S M o n + C B S S o f t
T C O M T = i = 1 N C M T C p t + C M T I n s t C M T F I + i = 1 N C M T M a i n t + C M T M o n + C M T S o f t
T C O E M S = T C O P V + T C O W T + T C O B S + T C O M T
The TCO provides a comprehensive view of the economic feasibility and long-term cost-effectiveness of the BEMS.
By Hybrid optimization approach, now features these mathematical models as stakeholders need to assess the BEMS economic viability when deciding about deployment strategies and optimization measures.
The implementation of hybrid JSO and GJO algorithms requires cost evaluation to establish economic suitability for an EMS deployment. Stakeholder decisions about deploying and optimizing EMSs become wiser through careful system component cost evaluation along with installation expenses, operational costs, maintenance expenses, financial incentives, and TCO analysis, so stakeholders achieve highest economic success throughout time.

4. Results and Discussion

The proposed Energy Management System (EMS) connects multiple renewable energy sources through JSO-GJO algorithm operation to generate optimized power distribution. The proposed EMS combines four fundamental energy components that connect a photovoltaic generation system controlled by a boost converter for MPPT control with a wind energy system based on PMSG generators using boost converters for MPPT and TSR and pitch angle control, a battery storage system using bidirectional DC-DC converters operated by a PI controller, and a single microturbine system with boost converter. Under the optimized control of JSO-GJO, the system components combine efforts to optimize the performance during resistance load (R) treatment.
The combination of wind turbine (WT) with PMSG enables energy transformation from wind kinetic power into mechanical motion that becomes power through the PMSG before boost converter conditioning. The PV system obtains maximum power output through its boost converter and MPPT strategy while simultaneously supplying renewable power to the load. Extra power produced by both PV system and WECS is stored within the battery for load support when renewable output is reduced.
The MT provides small-scale generation, using compressed air. Comprising a turbine, generator, and power conditioning unit, the MT’s energy output is conditioned by a boost converter to match the load’s voltage requirements. Through this setup, the EMS ensures reliable energy availability, with the JSO-GJO algorithm coordinating the energy flow to optimize overall performance.
Results for the optimized EMS are discussed in terms of power output, energy yield, efficiency, State of Charge (SOC) of the battery, power quality, and economic viability. Power output data demonstrate the relative contribution of each source to total generation, highlighting the effectiveness of the JSO-GJO algorithm in balancing generation and storage. Efficiency is calculated by comparing output to input power, while SOC monitoring verifies safe operation ranges for battery usage. The overall framework and process flow of this EMS, along with its management strategy, are illustrated in Figure 7 and Figure 8.
The MATLAB/Simulink platform (MATLAB 2018a) wasused for simulation testing to model standard testing conditions and microgrid features with changing irradiance levels (1000 W/m2, 800 W/m2, 600 W/m2) combined with temperature ranges from 30 °C, 20 °C and 15 °C alongside various wind speeds (10 m/s,7 m/s, 9 m/s) and fixed load.
The Results section of the research paper evaluates the performance of various optimization algorithms in managing an EMS comprising PV, WT, BS, and MT as backup.
Case 1: Analysis of the simulation’s performance with 1000 W/m2 of irradiance, a constant temperature of 25°C, and a wind speed of 12 m/s
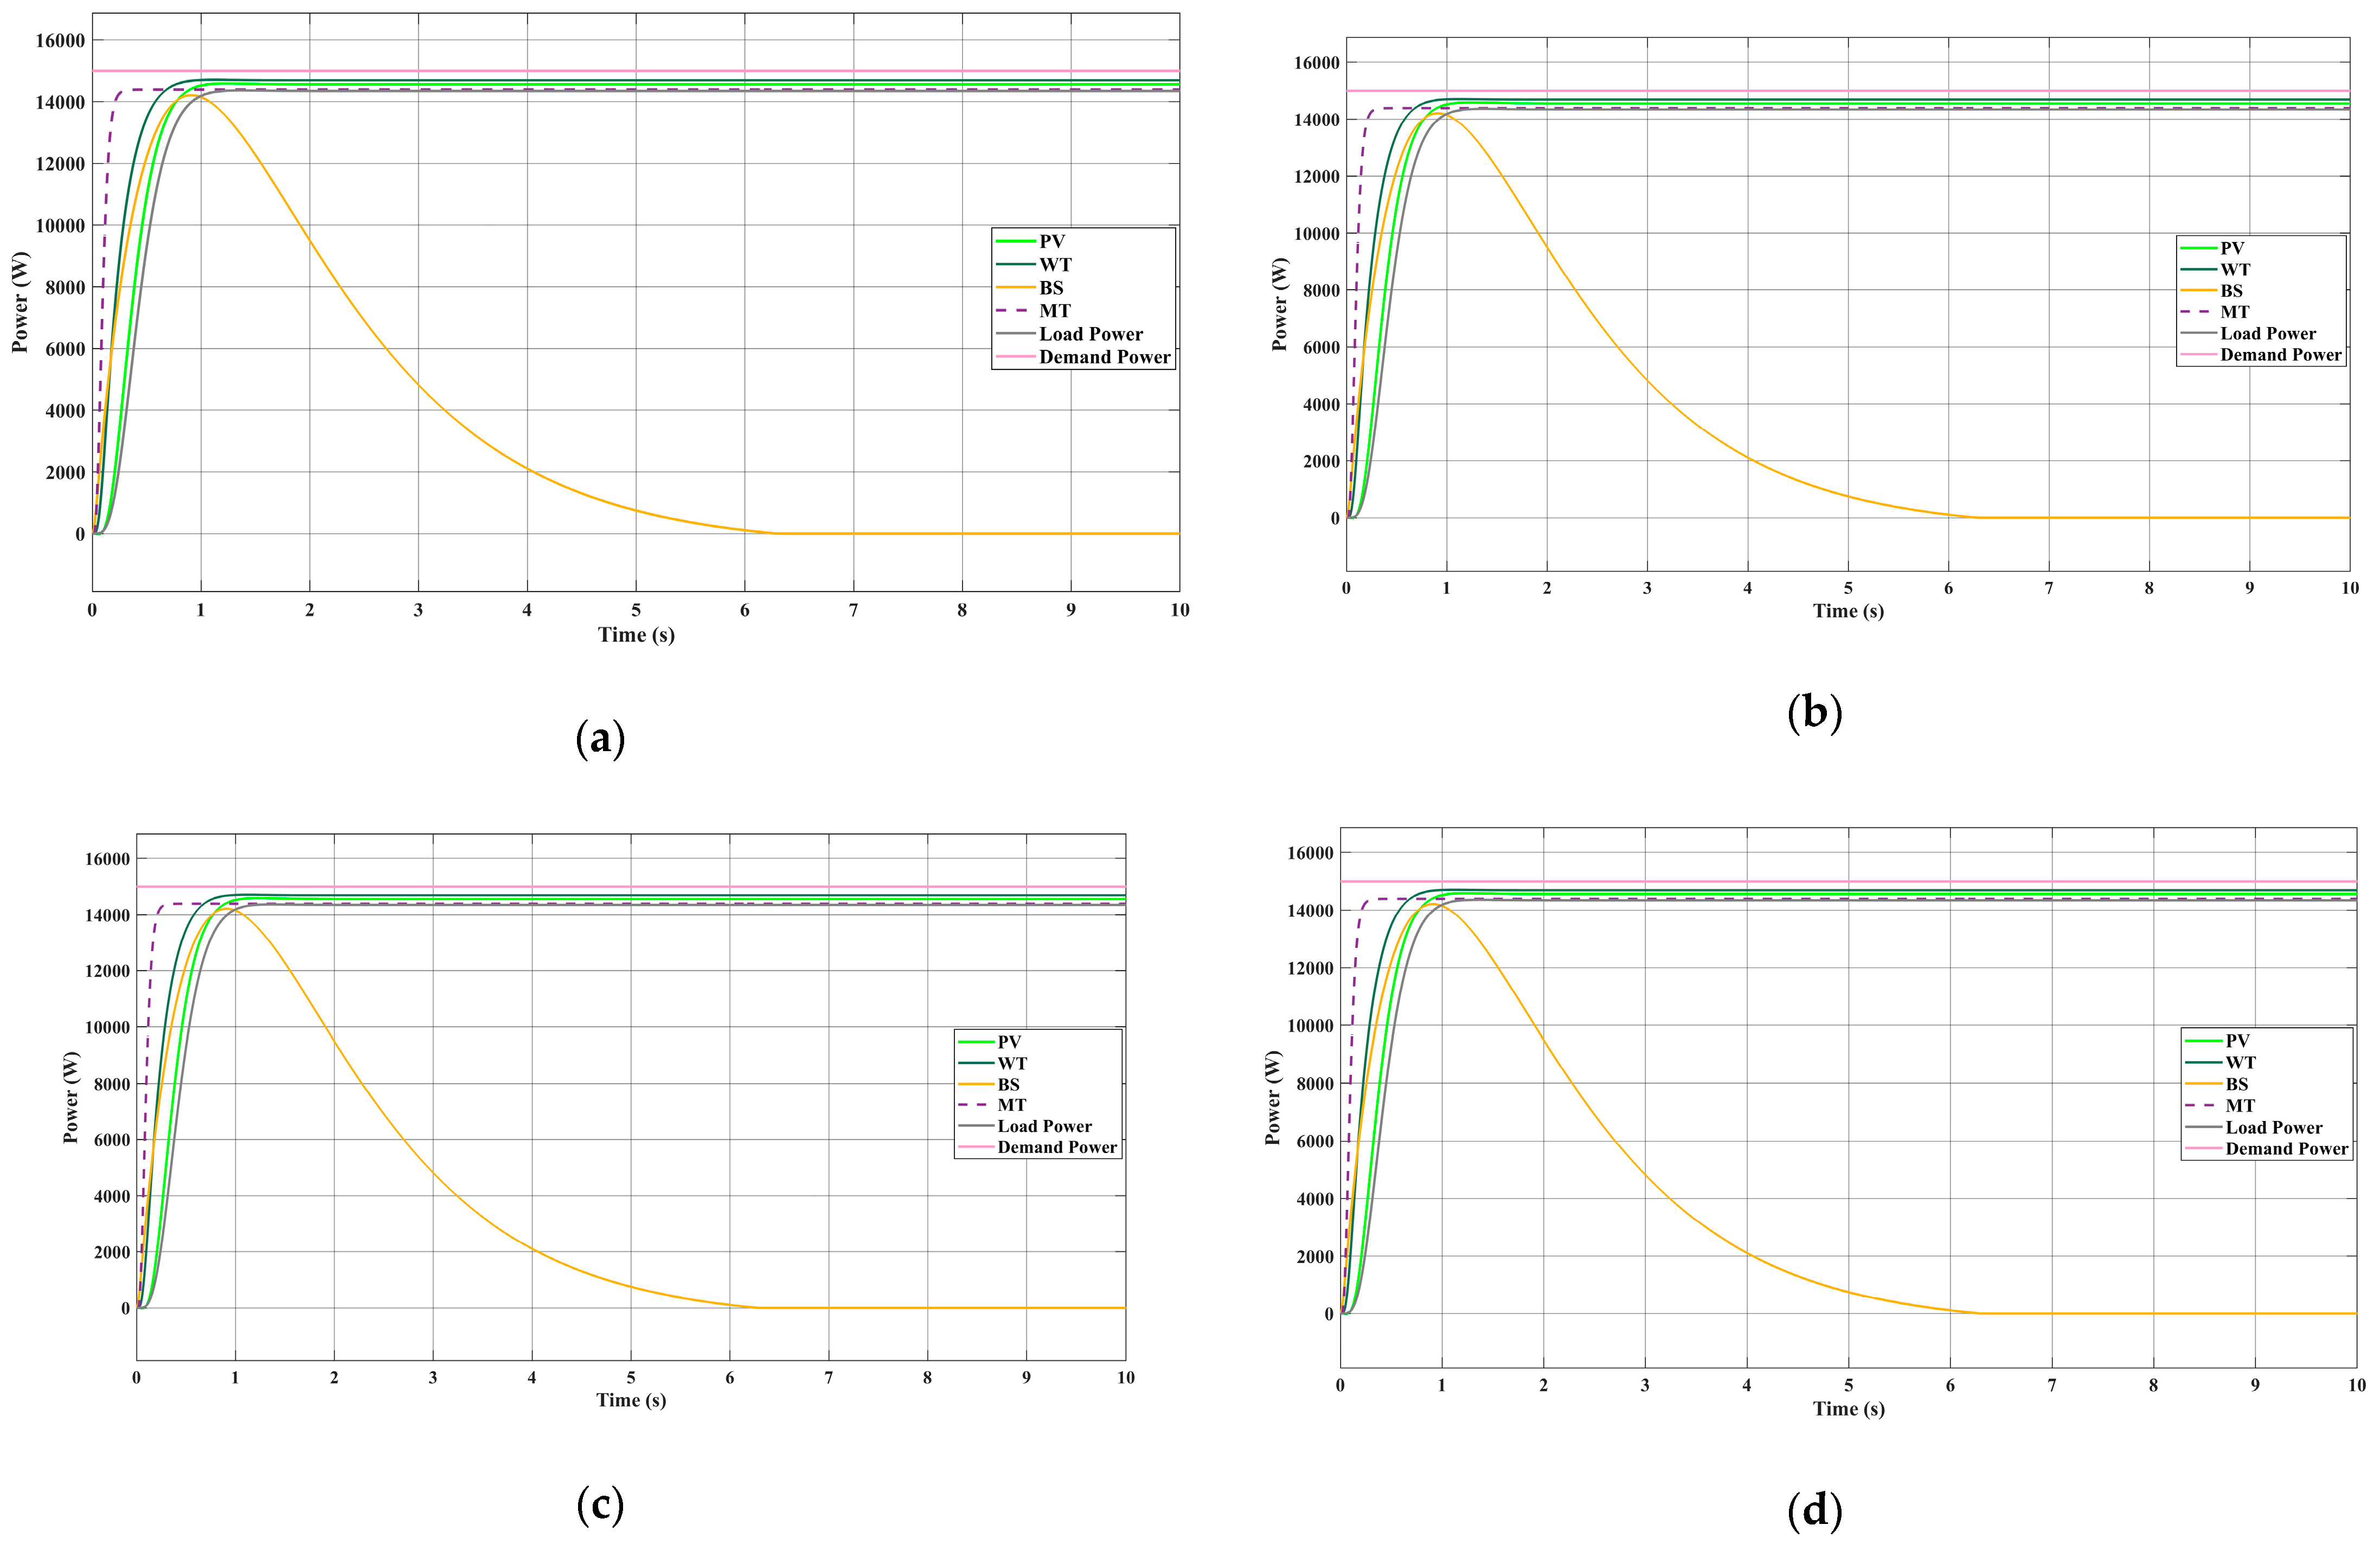
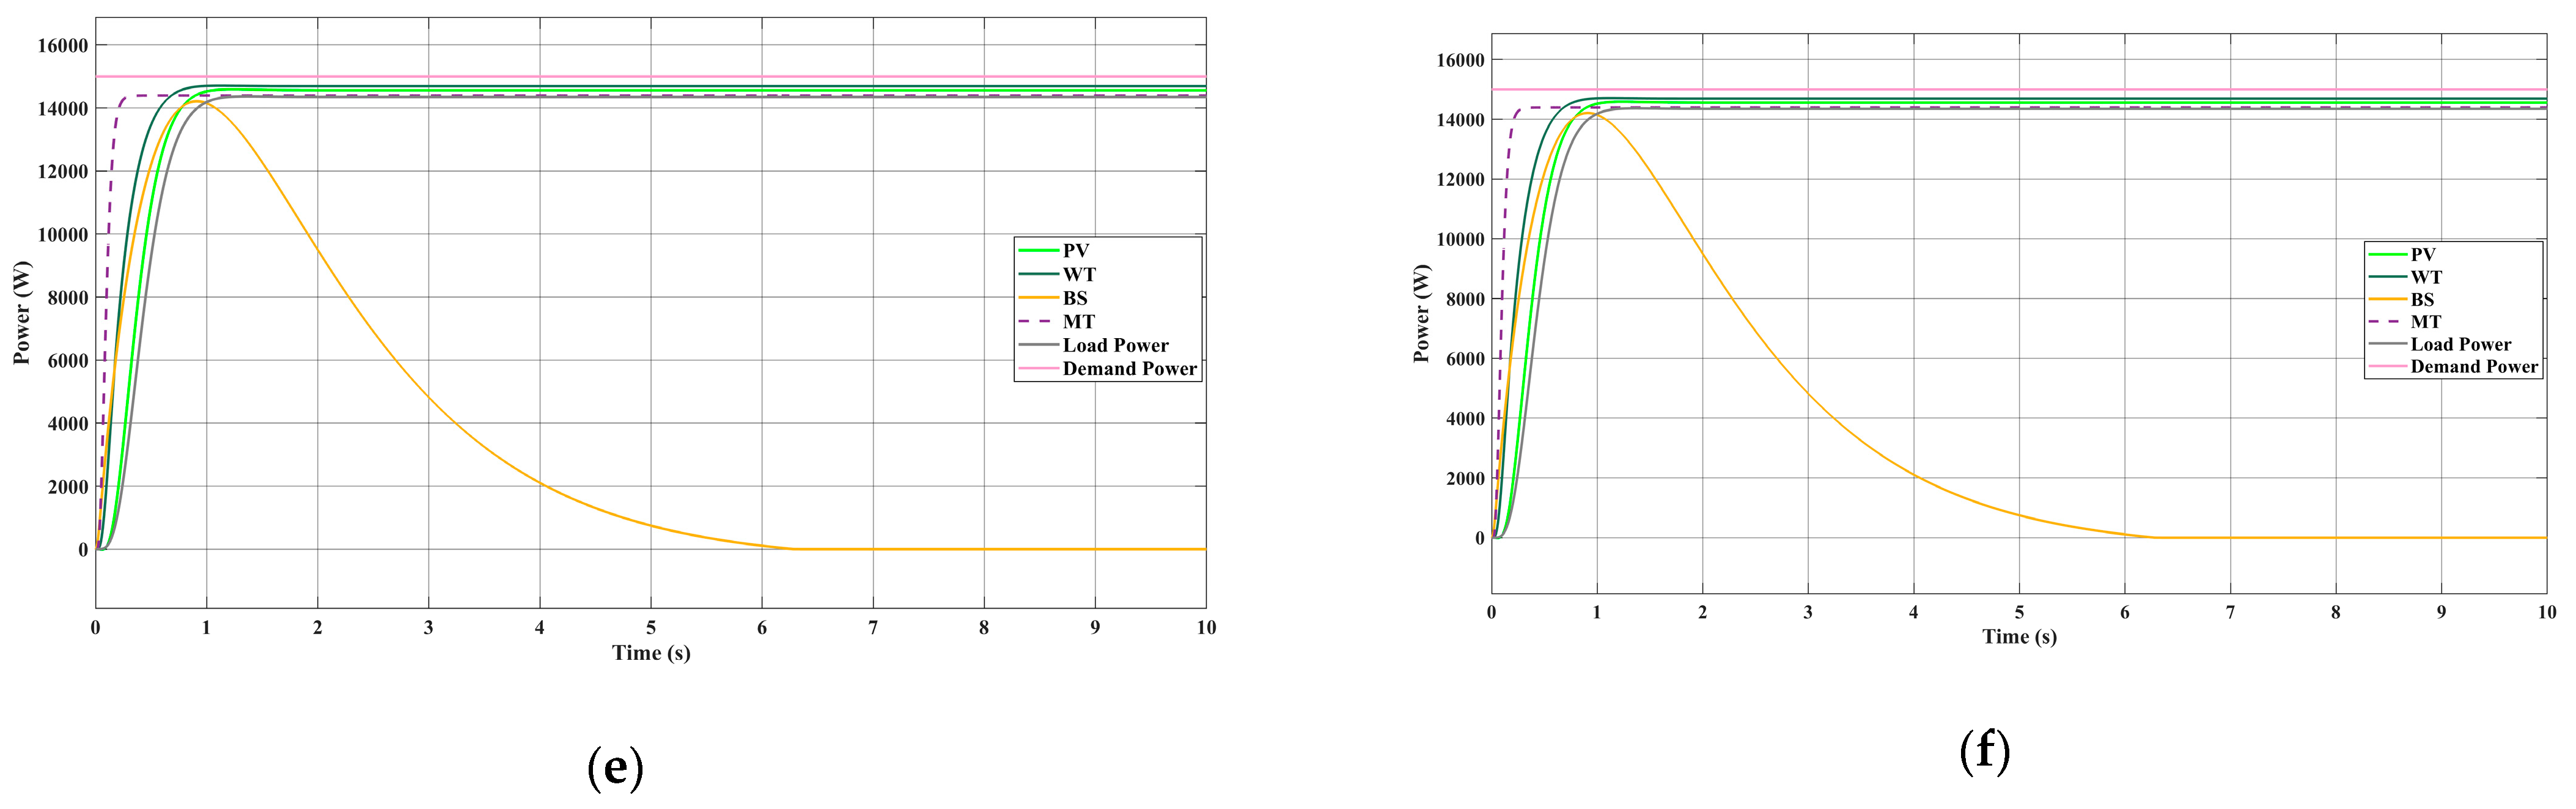
  • Photovoltaic (PV) System: Under peak irradiance (1000 W/m2) and a temperature of 25 °C, the PV system, integrated with MPPT and a boost converter, contributes substantially to the EMS, producing 14,561.76 W with JSO-GJO. The MPPT ensures that even with variations in irradiance, the PV system extracts maximum available power, optimizing energy capture during peak solar hours. Under optimal conditions, the PV system serves as the primary power source, reducing dependency on other sources and minimizing battery discharge cycles.
  • Wind Energy Conversion System (WECS): The WECS, incorporating Permanent Magnet Synchronous Generator (PMSG) technology with Tip Speed Ratio and Pitch Angle Control, performs consistently, especially at the evaluated wind speed of 12 m/s, generating a stable output of 14,695.54 W under JSO-GJO. This component provides crucial support during low solar periods, especially in the evening or on cloudy days. The Pitch Angle and Tip Speed Ratio adjustments dynamically enhance energy capture and stabilize power output, compensating for wind fluctuations.
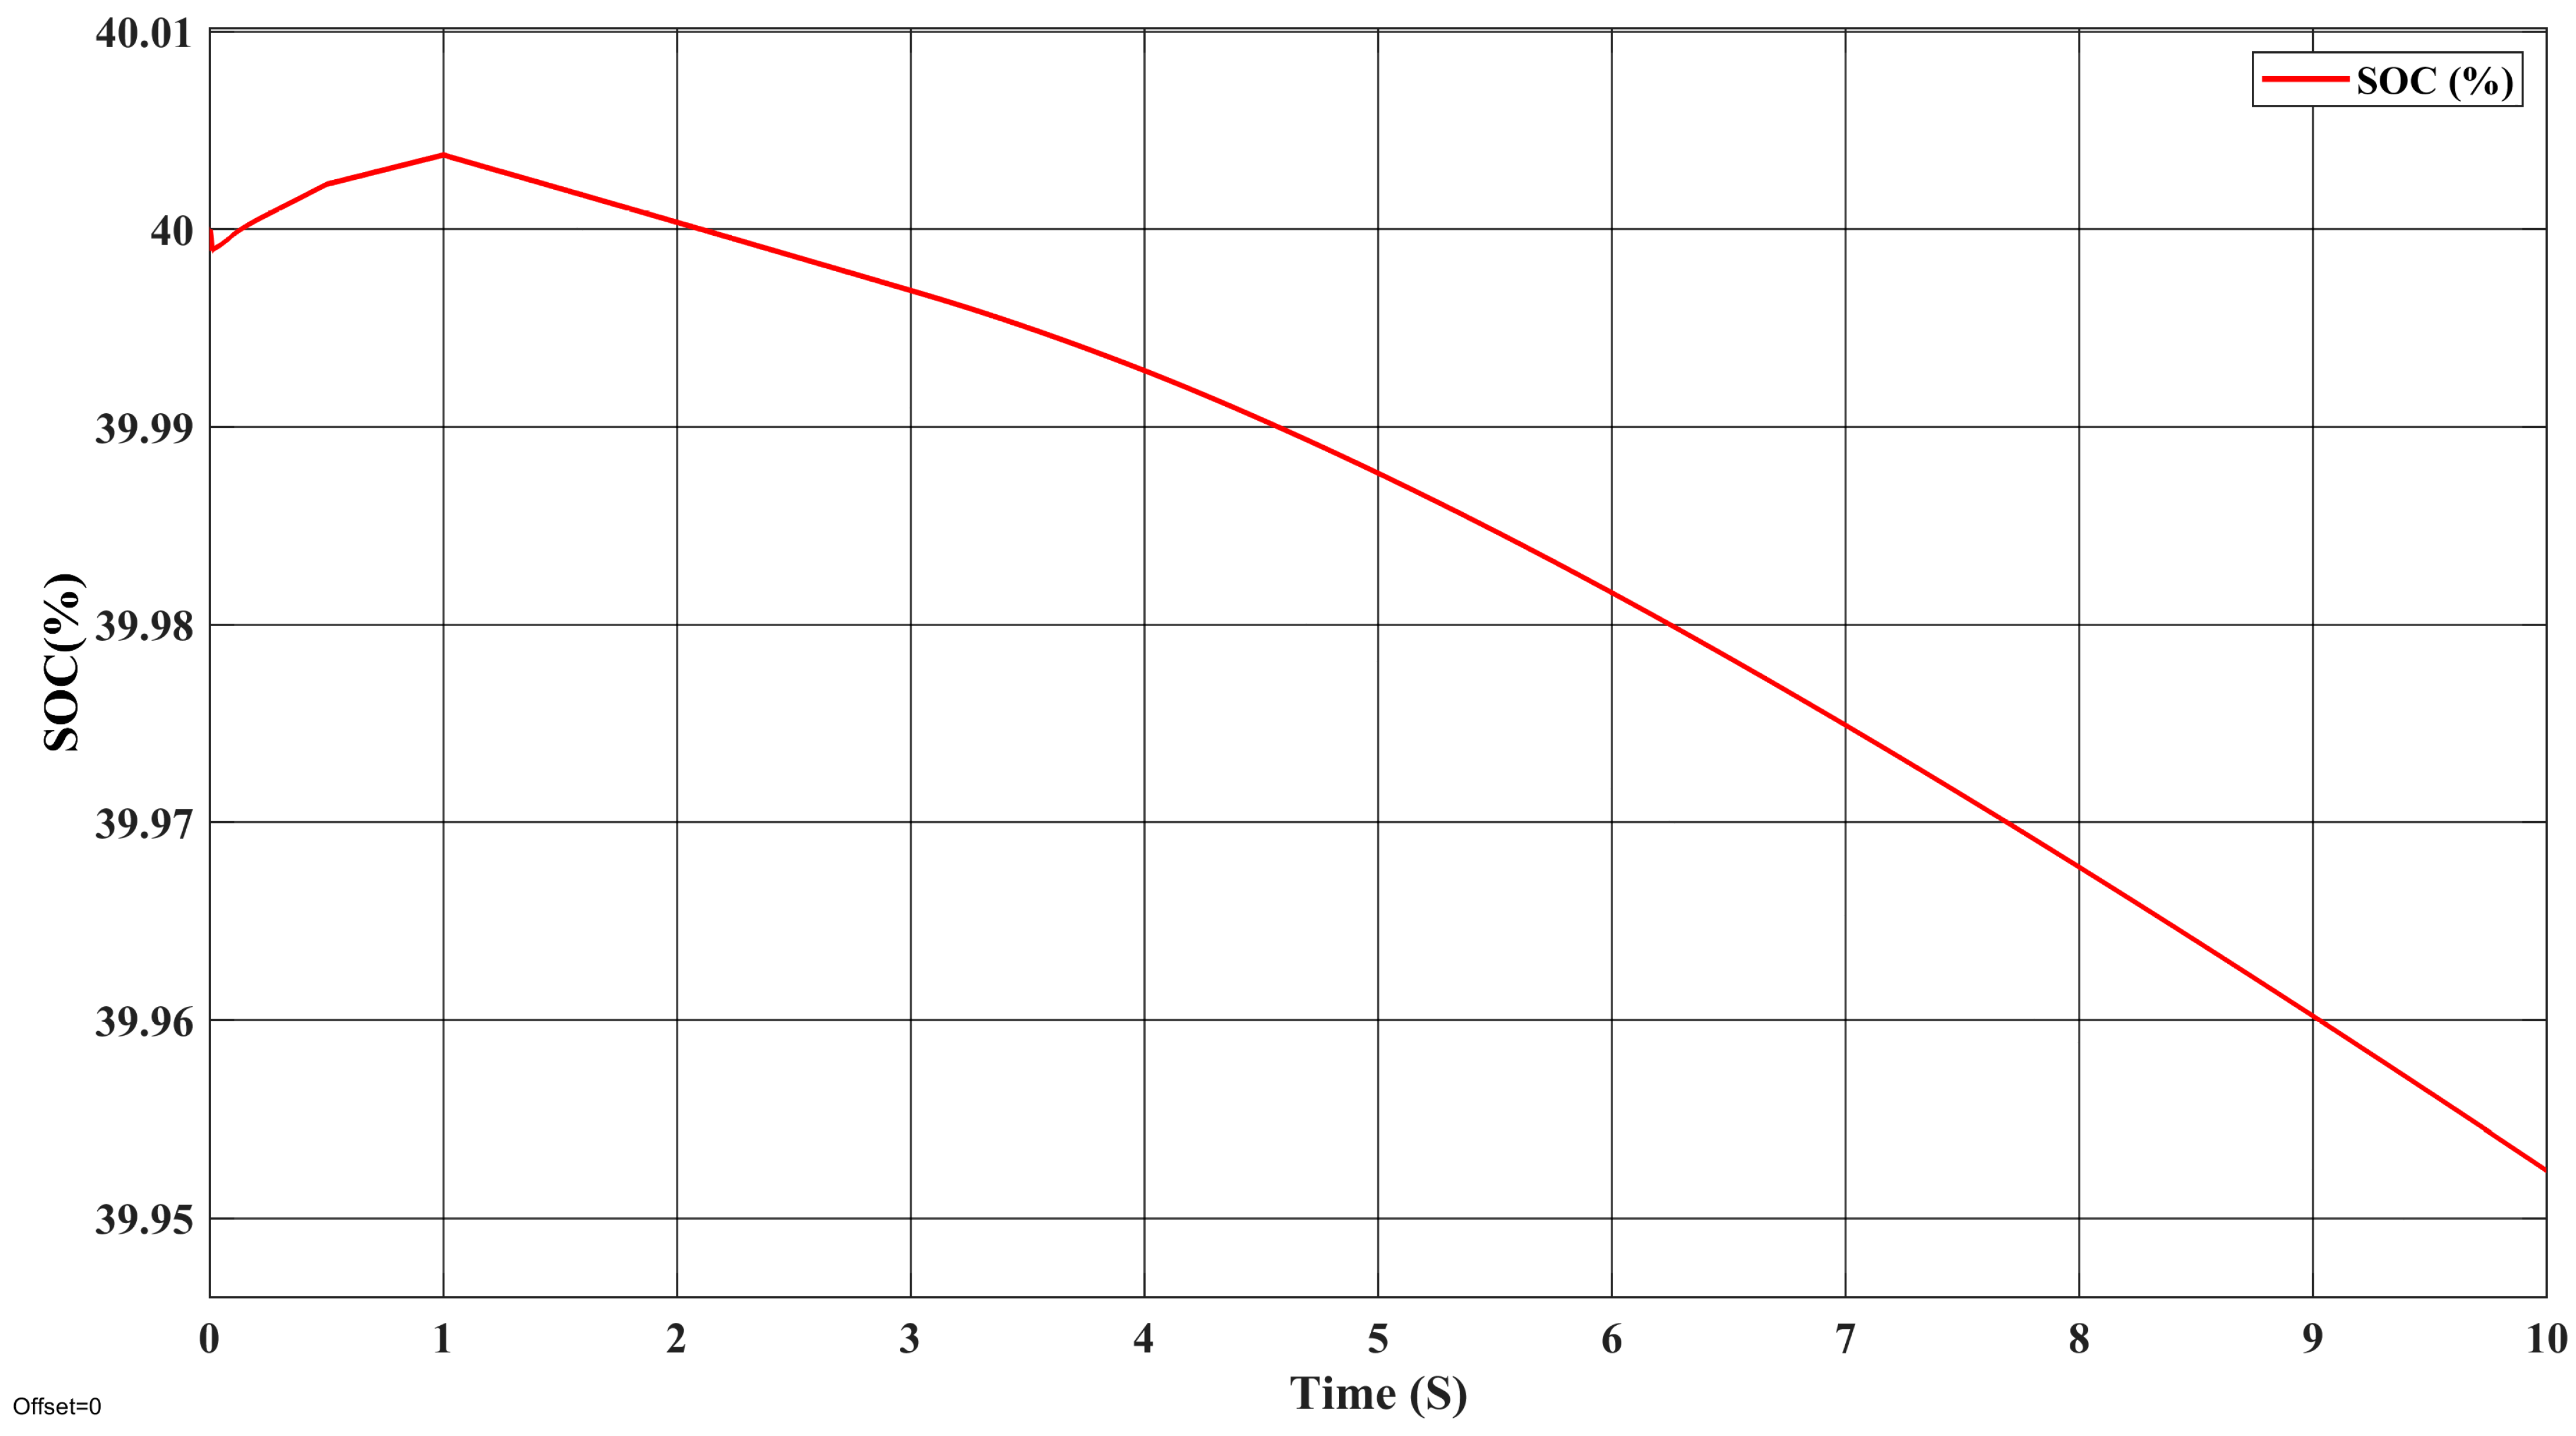
  • Battery Storage (BS): The battery’s role is to balance supply and demand, charging when excess power is available and discharging when demand exceeds generation. In optimized operation, the BS typically outputs 14,212.8 W to help meet load demands. The bidirectional converter with PI control maintains stable SOC, preventing critical discharge levels and prolonging battery life by avoiding rapid cycling.
  • Micro-Turbine (MT): Operating as a reliable backup, the MT adds stability during demand surges or power shortfalls, particularly when renewable sources fluctuate. In the JSO-GJO optimized scenario, it consistently contributes 14,393.88 W, effectively complementing other power sources and ensuring continuous operation.
The output efficiencies of the different algorithms, namely PSO, BFO, ABC, GWO, WOA, and the proposed JSO-GJO hybrid algorithm, are compared. The efficiencies obtained are as follows: 99.181%, 99.182%, 99.183%, 99.184%, 99.186%, and 99.20%, respectively.
Additionally, the power losses incurred by each algorithm are reported as follows: 0.11842 kW, 0.11831025 kW, 0.118131 kW, 0.1180975 kW, 0.11779 kW, and 0.116106 kW, respectively.
In Case 1, the analysis reveals that PSO demonstrates relatively high efficiency in optimizing the energy management system, although it falls slightly short compared to other algorithms. BFO exhibits similar performance to PSO, with a slightly higher efficiency. ABC performs comparably to PSO and BFO, demonstrating effectiveness in optimization but without significant superiority.
GWO shows a slightly improved efficiency compared to PSO, BFO, and ABC, indicating competency in optimization. WOA exhibits further improvement in efficiency compared to the aforementioned algorithms, demonstrating effectiveness in optimization.
However, the proposed JSO-GJO hybrid algorithm surpasses all other algorithms in terms of efficiency, demonstrating remarkable effectiveness in optimizing the EMS with significantly higher efficiency. This superior performance suggests the potential of the JSO-GJO hybrid algorithm for optimizing energy management systems with greater effectiveness, convergence speed and accuracy.
The analysis conducted in the research paper compares the performance of six optimization algorithms, including PSO, BFO, ABC, GWO, WOA, and a JSO-GJO hybrid algorithm, across varying environmental conditions. These conditions involve different levels of solar irradiance, temperatures, and wind speeds.
Results indicate that while all algorithms demonstrate varying degrees of effectiveness, the JSO-GJO hybrid algorithm consistently outperforms the others across the diverse cases. The JSO-GJO algorithm showcases superior adaptability and effectiveness in managing the EMS under changing environmental parameters. Its ability to integrate both the JSO-GJO techniques enables it to navigate complex optimization landscapes more efficiently.
Figure 9 and Figure 10 illustrate the comparative efficiency and power loss for each algorithm under Case 1, showcasing JSO-GJO’s optimization effectiveness. Table 5 details simulation performance under constant temperature (25 °C), wind speed (12 m/s), and irradiance (1000 W/m2), highlighting JSO-GJO’s efficiency gains over conventional algorithms.
Case 2: Performance analysis of simulation results varying irradiance, varying temperature, and variable wind speed
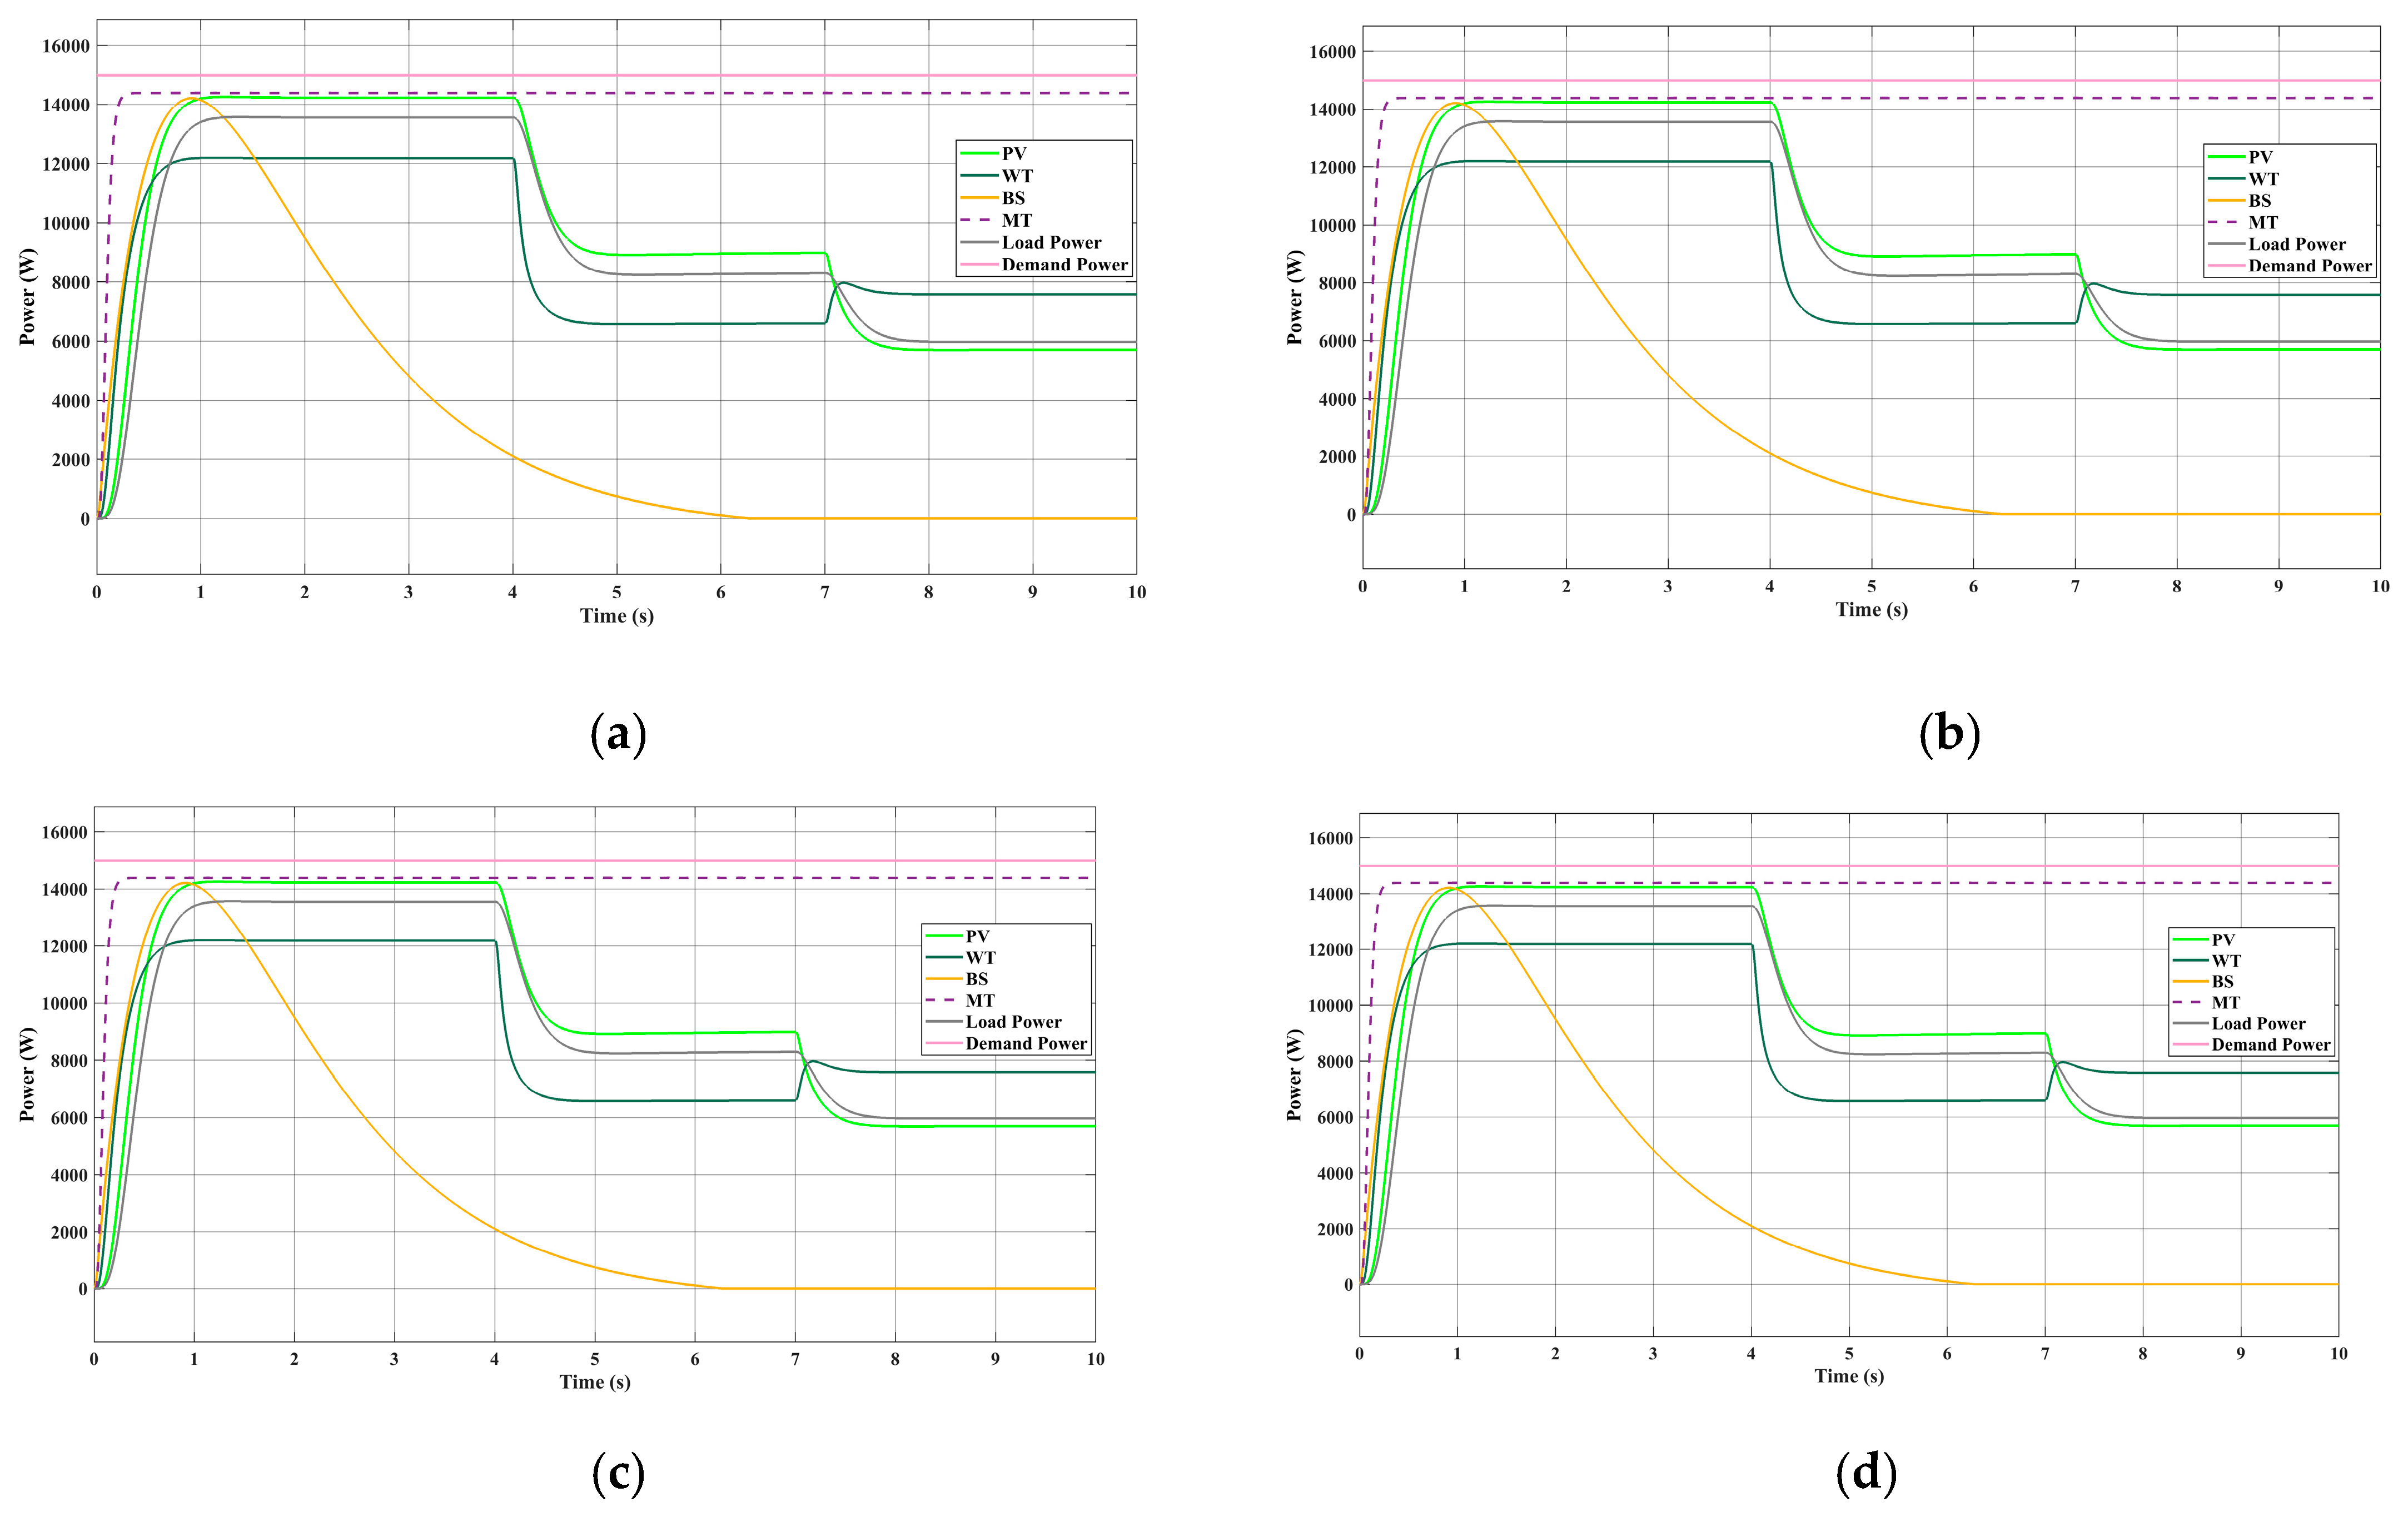
  • PV System Contribution: The PV system utilizes Maximum Power Point Tracking (MPPT) control and a boost converter to optimize energy extraction from solar irradiance. Its power output is directly influenced by irradiance levels, as illustrated in Table 6. For instance, when irradiance is at 1000 W/m2 (high sunlight conditions), the PV output contributes significantly to the total system power, delivering up to 14,235.68 W under optimal conditions. However, as irradiance reduces to 800 W/m2 and 600 W/m2, the PV output correspondingly drops to 8930.784 W and 5701.8 W, respectively. This decrease highlights the PV system’s dependency on irradiance and underscores the importance of integrating other sources to maintain power output during low-sunlight periods.
  • Wind Energy Conversion System (WECS) Contribution: The WECS, comprising a Permanent Magnet Synchronous Generator (PMSG), uses Tip Speed Ratio (TSR) and Pitch Angle control to maintain power production across fluctuating wind speeds. It is evident that the WECS provides stable power output under different wind speeds, with a peak contribution at 10 m/s yielding up to 12,184.469 W. When wind speed decreases to 7 m/s and 9 m/s, the output slightly drops but remains substantial at 6578.609 W and 7581.91 W, respectively. This capability to sustain output in varying wind conditions demonstrates the WECS’s reliability as a key energy source for the EMS, especially during nighttime or cloudy days when solar input is limited.
  • Battery Storage (BS) Contribution: Battery Storage acts as the energy reservoir, storing surplus energy produced by the PV and WECS for later use, ensuring continuity of supply during low generation periods. The battery provides consistent power support, contributing 14,212.8 W across all tested conditions. By maintaining the State of Charge (SOC) within optimal levels (as regulated by the PI controller), BS ensures that stored energy is efficiently managed and available when generation from PV and WECS decreases. For instance, during lower irradiance (600 W/m2) and moderate wind conditions (9 m/s), the BS supplements load requirements effectively, underscoring its role in stabilizing the EMS.
  • Micro-Turbine (MT) Contribution: The Micro-Turbine (MT) serves as a reliable backup power source, particularly useful when both PV and WECS output are low due to unfavorable environmental conditions. Table 6 reflects the MT’s consistent output of 14,393.88 W across all scenarios, as it remains largely unaffected by external weather conditions. Its presence within the EMS framework ensures a steady, uninterrupted power supply to meet load demands. In instances of extreme weather fluctuations (e.g., low irradiance and low wind speed), the MT’s contribution proves crucial in maintaining power stability.
  • Component Interactions and Balancing Power Output: As a result of PV, WECS, BS, and MT operating together, the power output system adjusts dynamically to current energy availability and customer demand requirements. During optimal wind and light conditions, the EMS directs power output first to PV and WECS systems before engaging BS and MT technologies. Under reduced sunlight and wind conditions, the battery system performs power discharge so the motor-generator system functions to fill any differences with the demand requirements. The system’s multiple layers improve operational reliability while maximizing renewable energy sources, thus cutting down operational expenses and backup requirements.
This case encompasses settings as Solar Irradiance of 1000 W/m2, Temperature of 30 °C, and Wind Speed of 10 m/s; 800 W/m2, 20 °C, and 7 m/s; and 600 W/m2, 15 °C, and 9 m/s. The study compares the effectiveness of six optimization algorithms—BFO, ABC, GWO, WOA, and a JSO-GJO hybrid algorithm—across these varied conditions.
The JSO-GJO hybrid algorithm maintains superior performance when used in different environmental settings compared toother algorithms. The system uses an effective method to manage energy supply and demand, which optimizes operational performance while supporting stable system operation. The flexible nature combined with optimized effectiveness positions the JSO-GJO hybrid algorithm as an ideal choice for real-world energy management purposes that prove better than individual optimization methods.
The research findings emphasize how the adaptable and flexible proposed algorithm improves energy management systems by responding to different environmental factors. The JSO-GJO hybrid algorithm demonstrates optimal functionality for handling dynamic operating conditions, which makes it a suitable solution for system efficiency optimization.
The input parameter adjustments and energy management performance under Case 2 are portrayed in Figure 11 and Figure 12 for each algorithm. Under various conditions, Table 6 shows that the JSO-GJO hybrid algorithm stands out by offering optimal combinations of system performance while remaining steady throughout many operational ranges. JSO-GJO demonstrates adaptability that qualifies it as a strategic solution for real-world EMS implementations, which experience frequent alterations in environmental factors.
The measurement of energy status within battery cells through real-time assessment forms the state of charge (SOC) variable, which technical systems express as a percentage of total battery capacity. SOC serves as a key performance indicator because it demonstrates current energy storage levels to control battery operations that achieve peak performance while extending lifetime.
The results demonstrate that implementing a proportional-integral (PI) controller on the EMS produces superior SOC management results through balanced battery energy distribution. The battery starts operating with 40% of its total capacity according to the 40% initial SOC value in Figure 13. A PI controller-based management system activates battery charging and discharging operations to establish and maintain a specific stable SOC range that supports system performance and prolongs battery life.
The PI controller tracks renewable inputs from PV systems and WT sources during charging to achieve targeted SOC levels while avoiding overcharge conditions. The controller manages discharge operations to supply enough output energy for load requirements and simultaneously prevents damaging SOC decreases that shorten battery life.
The PI controller manages a dynamic system that delivers optimal performance between energy use efficiency and battery maintenance effectiveness. The EMS system uses real-time controls of battery charging and discharging operations to optimize utilization between maximizing power output and extending battery lifetime and preventing excessive wear.
The combination between SOC management and PI-controlled electronic batteries delivers enhanced system stability while improving reliability. The energy management system achieves better resilience through these controls, which both optimize energy usage and stabilize power flows as well as extend battery service life.
The PI-controlled operation of the battery appears in Figure 13 as it displays SOC variations to maintain optimal energy management linked with battery health across diverse renewable energy inputs and changing load requests.
Figure 14 provides a comparative analysis of the total energy produced per year using various optimization algorithms for a hybrid EMS comprising PV, WT, BS, and an MT backup. The system’s operational parameters include PV operating for 2920h annually and WT, BS, and MT operating for 8760h annually. This setup serves a constant load demand of 15,000 W.
The optimization algorithms analyzed include PSO, BFO, ABC, GWO, WOA, and the hybrid JSO-GJO approach. Total energy consumption over a year is computed by multiplying the load demand by the operational hours. The algorithms’ primary goal is to maximize the total energy production while accounting for power losses, which are factored into the overall cost of energy production. Component costs are calculated based on the initial setup costs and energy produced, alongside the operational maintenance costs of USD 1000 per year.
Each algorithm’s annual cost-saving impact is presented, comparing the total cost of energy production across PSO, BFO, ABC, GWO, WOA, and JSO-GJO.
PSO generates an annual energy output of 421,804.63 kWh, with incremental improvements seen across the algorithms. BFO increases energy production to 421,812.64 kWh, while ABC boosts it further to 421,818.67 kWh. GWO slightly improves the output to 421,822 kWh, followed by WOA with 421,828.49 kWh. The hybrid JSO-GJO algorithm significantly outperforms the others, achieving the highest energy output of 421,847.82 kWh, showcasing its superiority in optimizing energy generation.
Figure 15 presents the cost performance of various optimization algorithms applied to an energy management system, including PSO, BFO, ABC, GWO, WOA, and JSO-GJO. The comparative analysis focuses on the system’s total cost per year after optimization, revealing the effectiveness of each algorithm in reducing operational expenses. Notably, PSO achieves an annual cost of approximately USD 50,617,479.9391, showing standard efficiency, while BFO slightly improves on that with USD 50,617,479.8237. ABC leads to a further reduction, reaching USD 50,617,479.6353. GWO reduces costs to USD 50,617,479.6001, and WOA shows an even greater cost savings of USD 50,617,479.2768. The JSO-GJO hybrid algorithm outperforms all, delivering the lowest cost at USD 50,617,477.5066. This demonstrates that while each algorithm enhances cost efficiency to varying degrees, the JSO-GJO hybrid offers the most substantial reduction.
Over a year, the financial benefits of higher energy yield are substantial. For instance, if external electricity is priced at USD 0.10 per kWh, this increased output from JSO-GJO (compared to WOA’s 421,828.49 kWh or PSO’s 421,804.63 kWh) can save approximately USD 1914.93 yearly. Such savings accumulate over the operational life of the EMS.
Notably, the JSO-GJO algorithm achieves the lowest cost, approximately USD 50,617,477.5066 annually, a marked improvement over other algorithms, such as WOA at USD 50,617,479.2768 and PSO at USD 50,617,479.9391. Although the individual cost reductions per algorithm may seem minor, even slight improvements can add up to substantial savings over time, particularly in large-scale EMS where energy demands and operational costs are high.
Overall, the JSO-GJO algorithm not only enhances EMS efficiency but also ensures a resilient, cost-effective, and sustainable operation. Its combination of increased energy yield, decreased power losses, lower operational costs, and enhanced resilience to energy price changes positions it as a valuable investment for EMS applications.
The incremental efficiency disparities between JSO-GJO and other algorithms prove substantial for continuous operation despite showing subtle numerical variations (99.20% against 99.186%). Long-term operation reinforces the meaningful energy efficiency and component thermal protection that derives from the 0.014–0.02% sustained efficiency improvement. The stable algorithm operation demonstrated by decreased standard deviations cuts down maintenance requirements that help maintain system reliability.

5. Conclusions

The research performs thorough performance evaluations of various optimization algorithms used in a standalone Energy Management System (EMS) containing solar PV systems alongside Wind Energy Conversion Systems (WECS) with Permanent Magnet Synchronous Generators (PMSG),Battery Energy Storage Systems (BESS) and Microturbines (MT) as backups. The study demonstrates that the JSO-GJO hybrid algorithm surpasses other algorithms by achieving maximum efficiency at affordable prices.
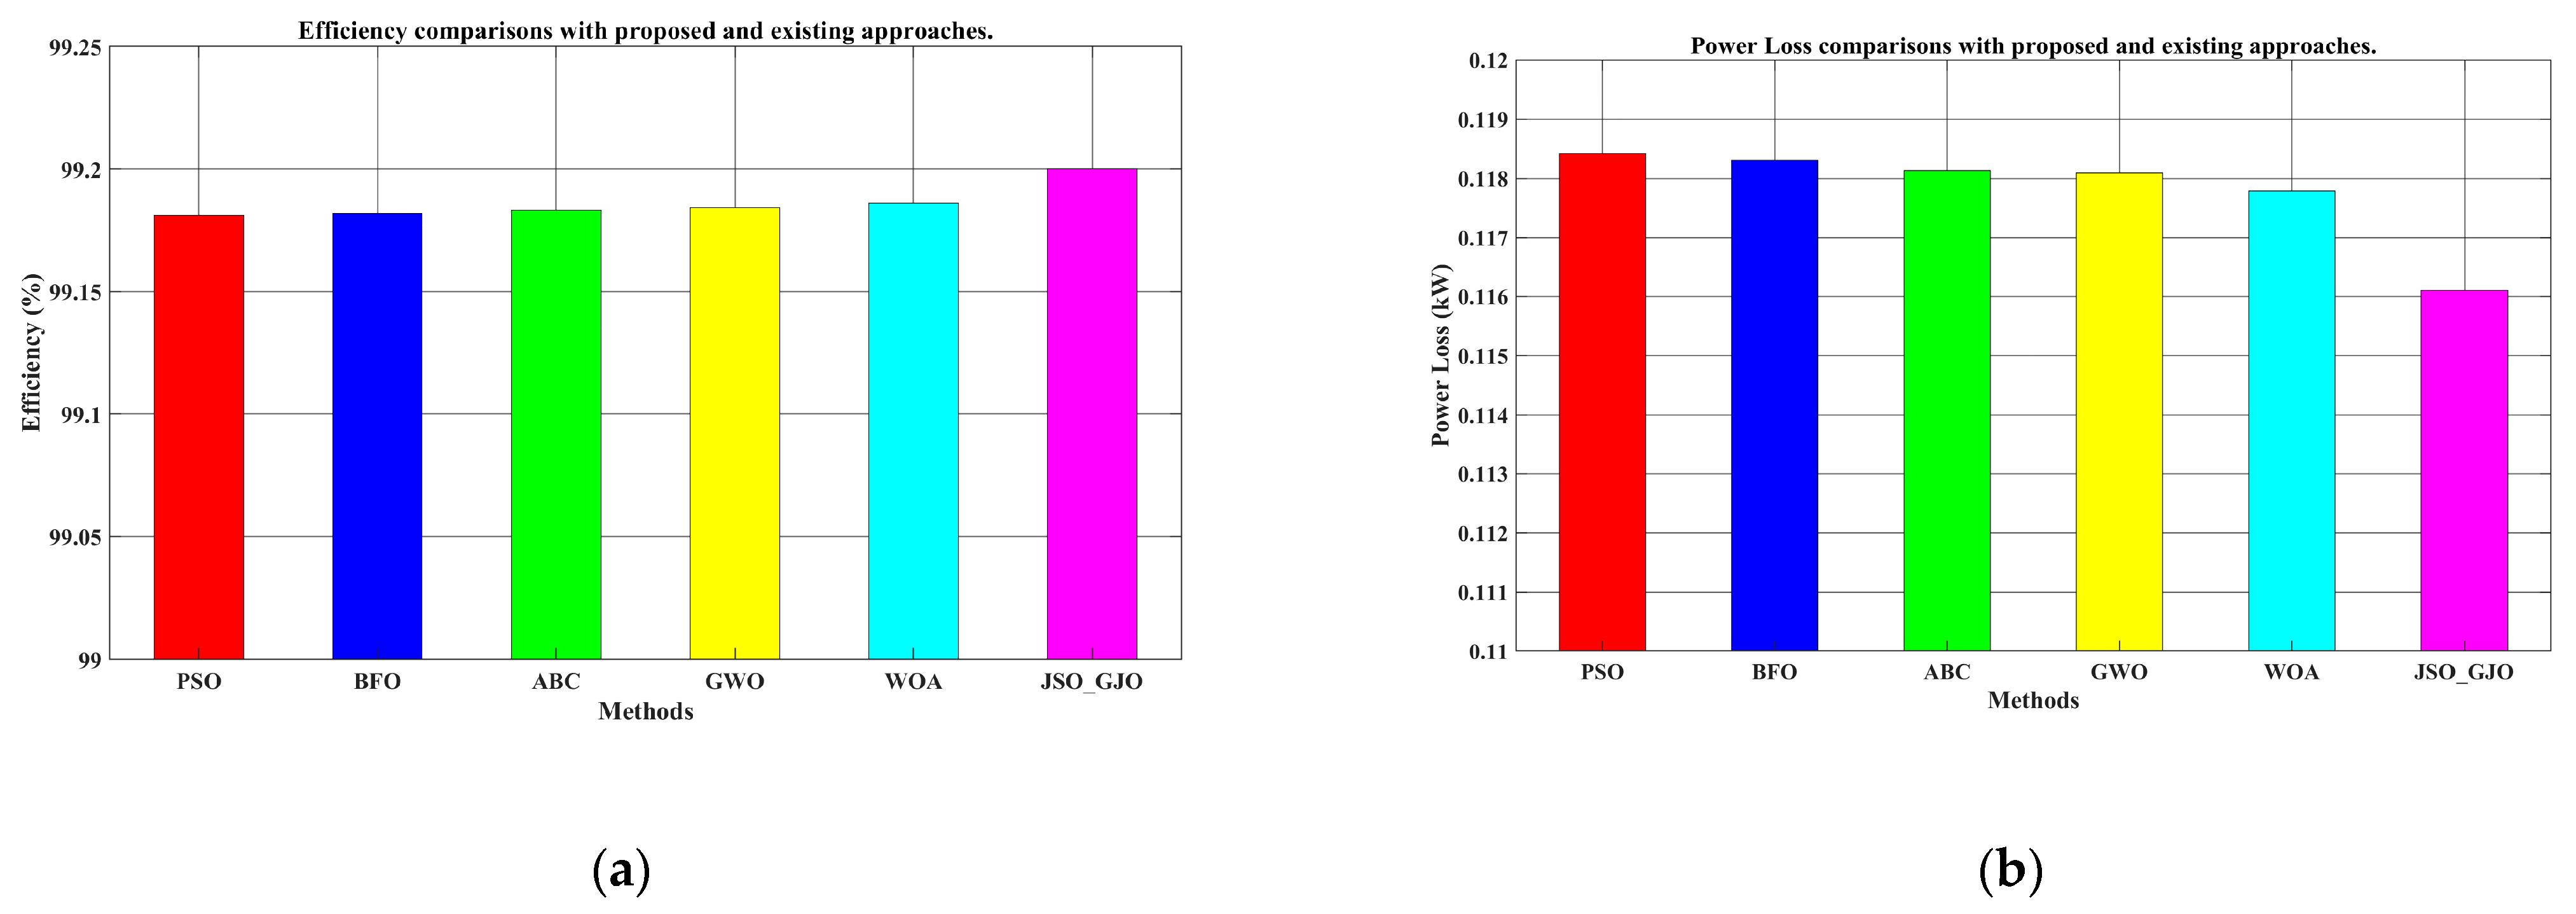
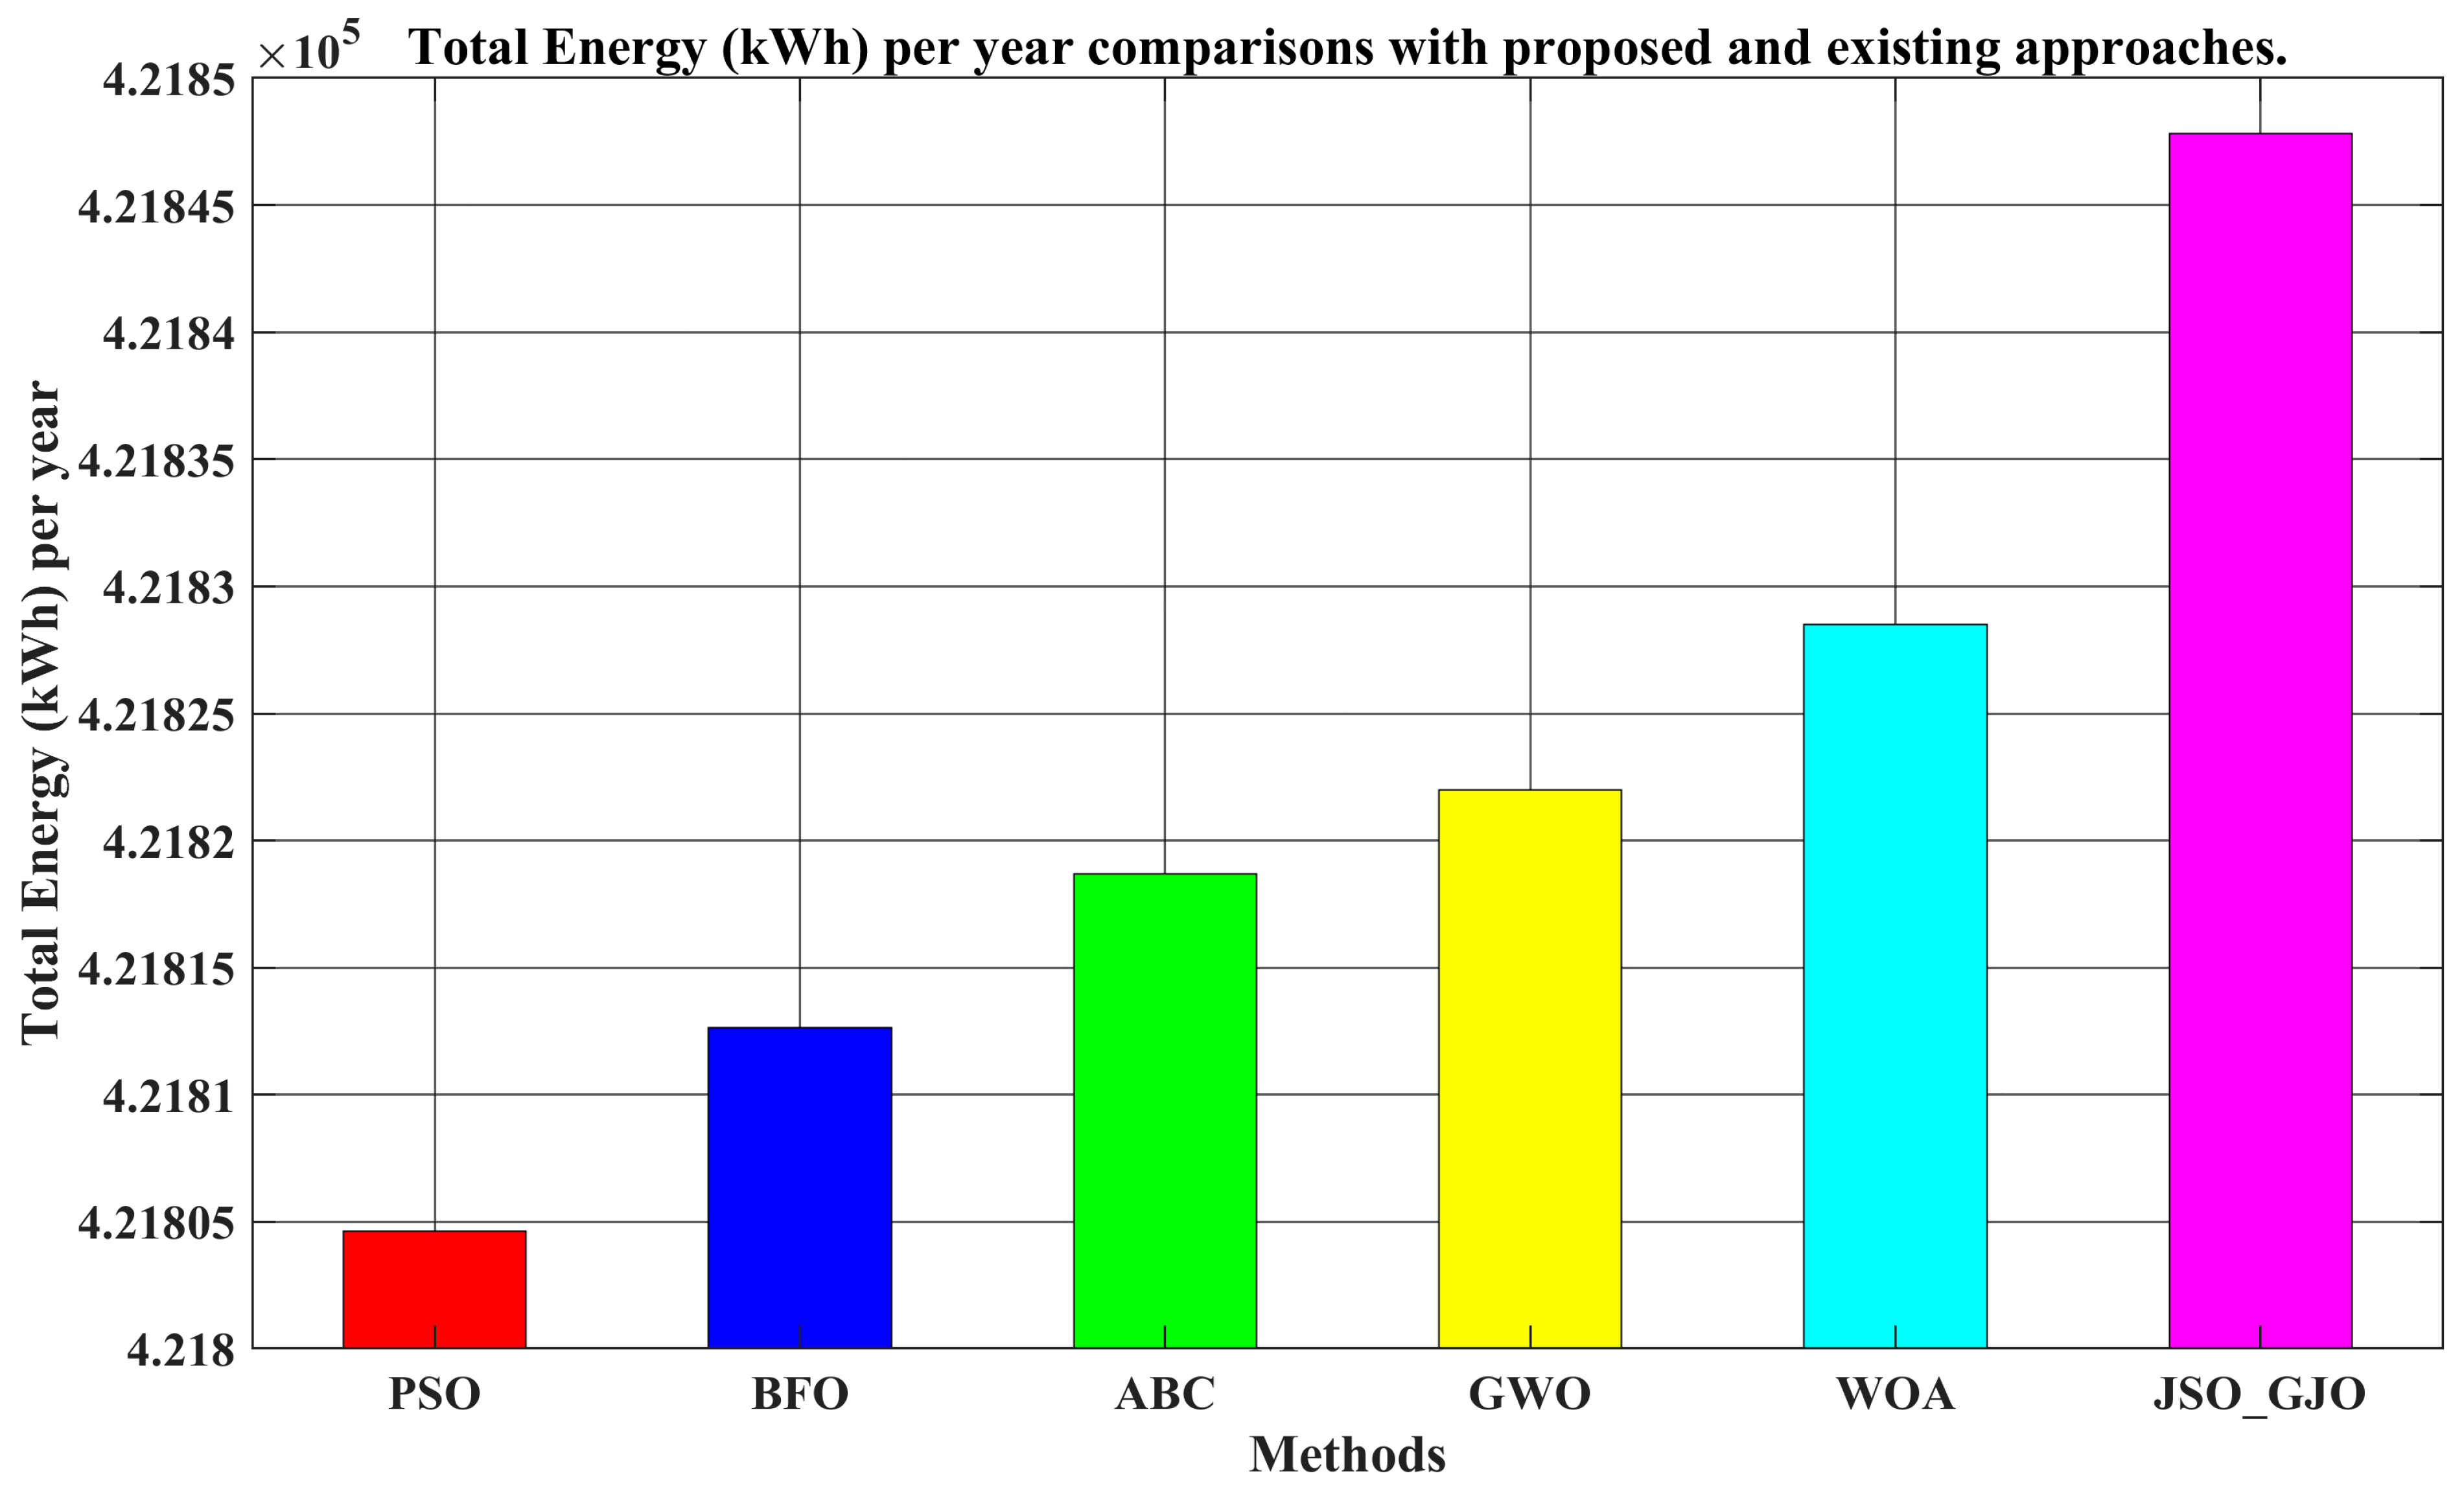
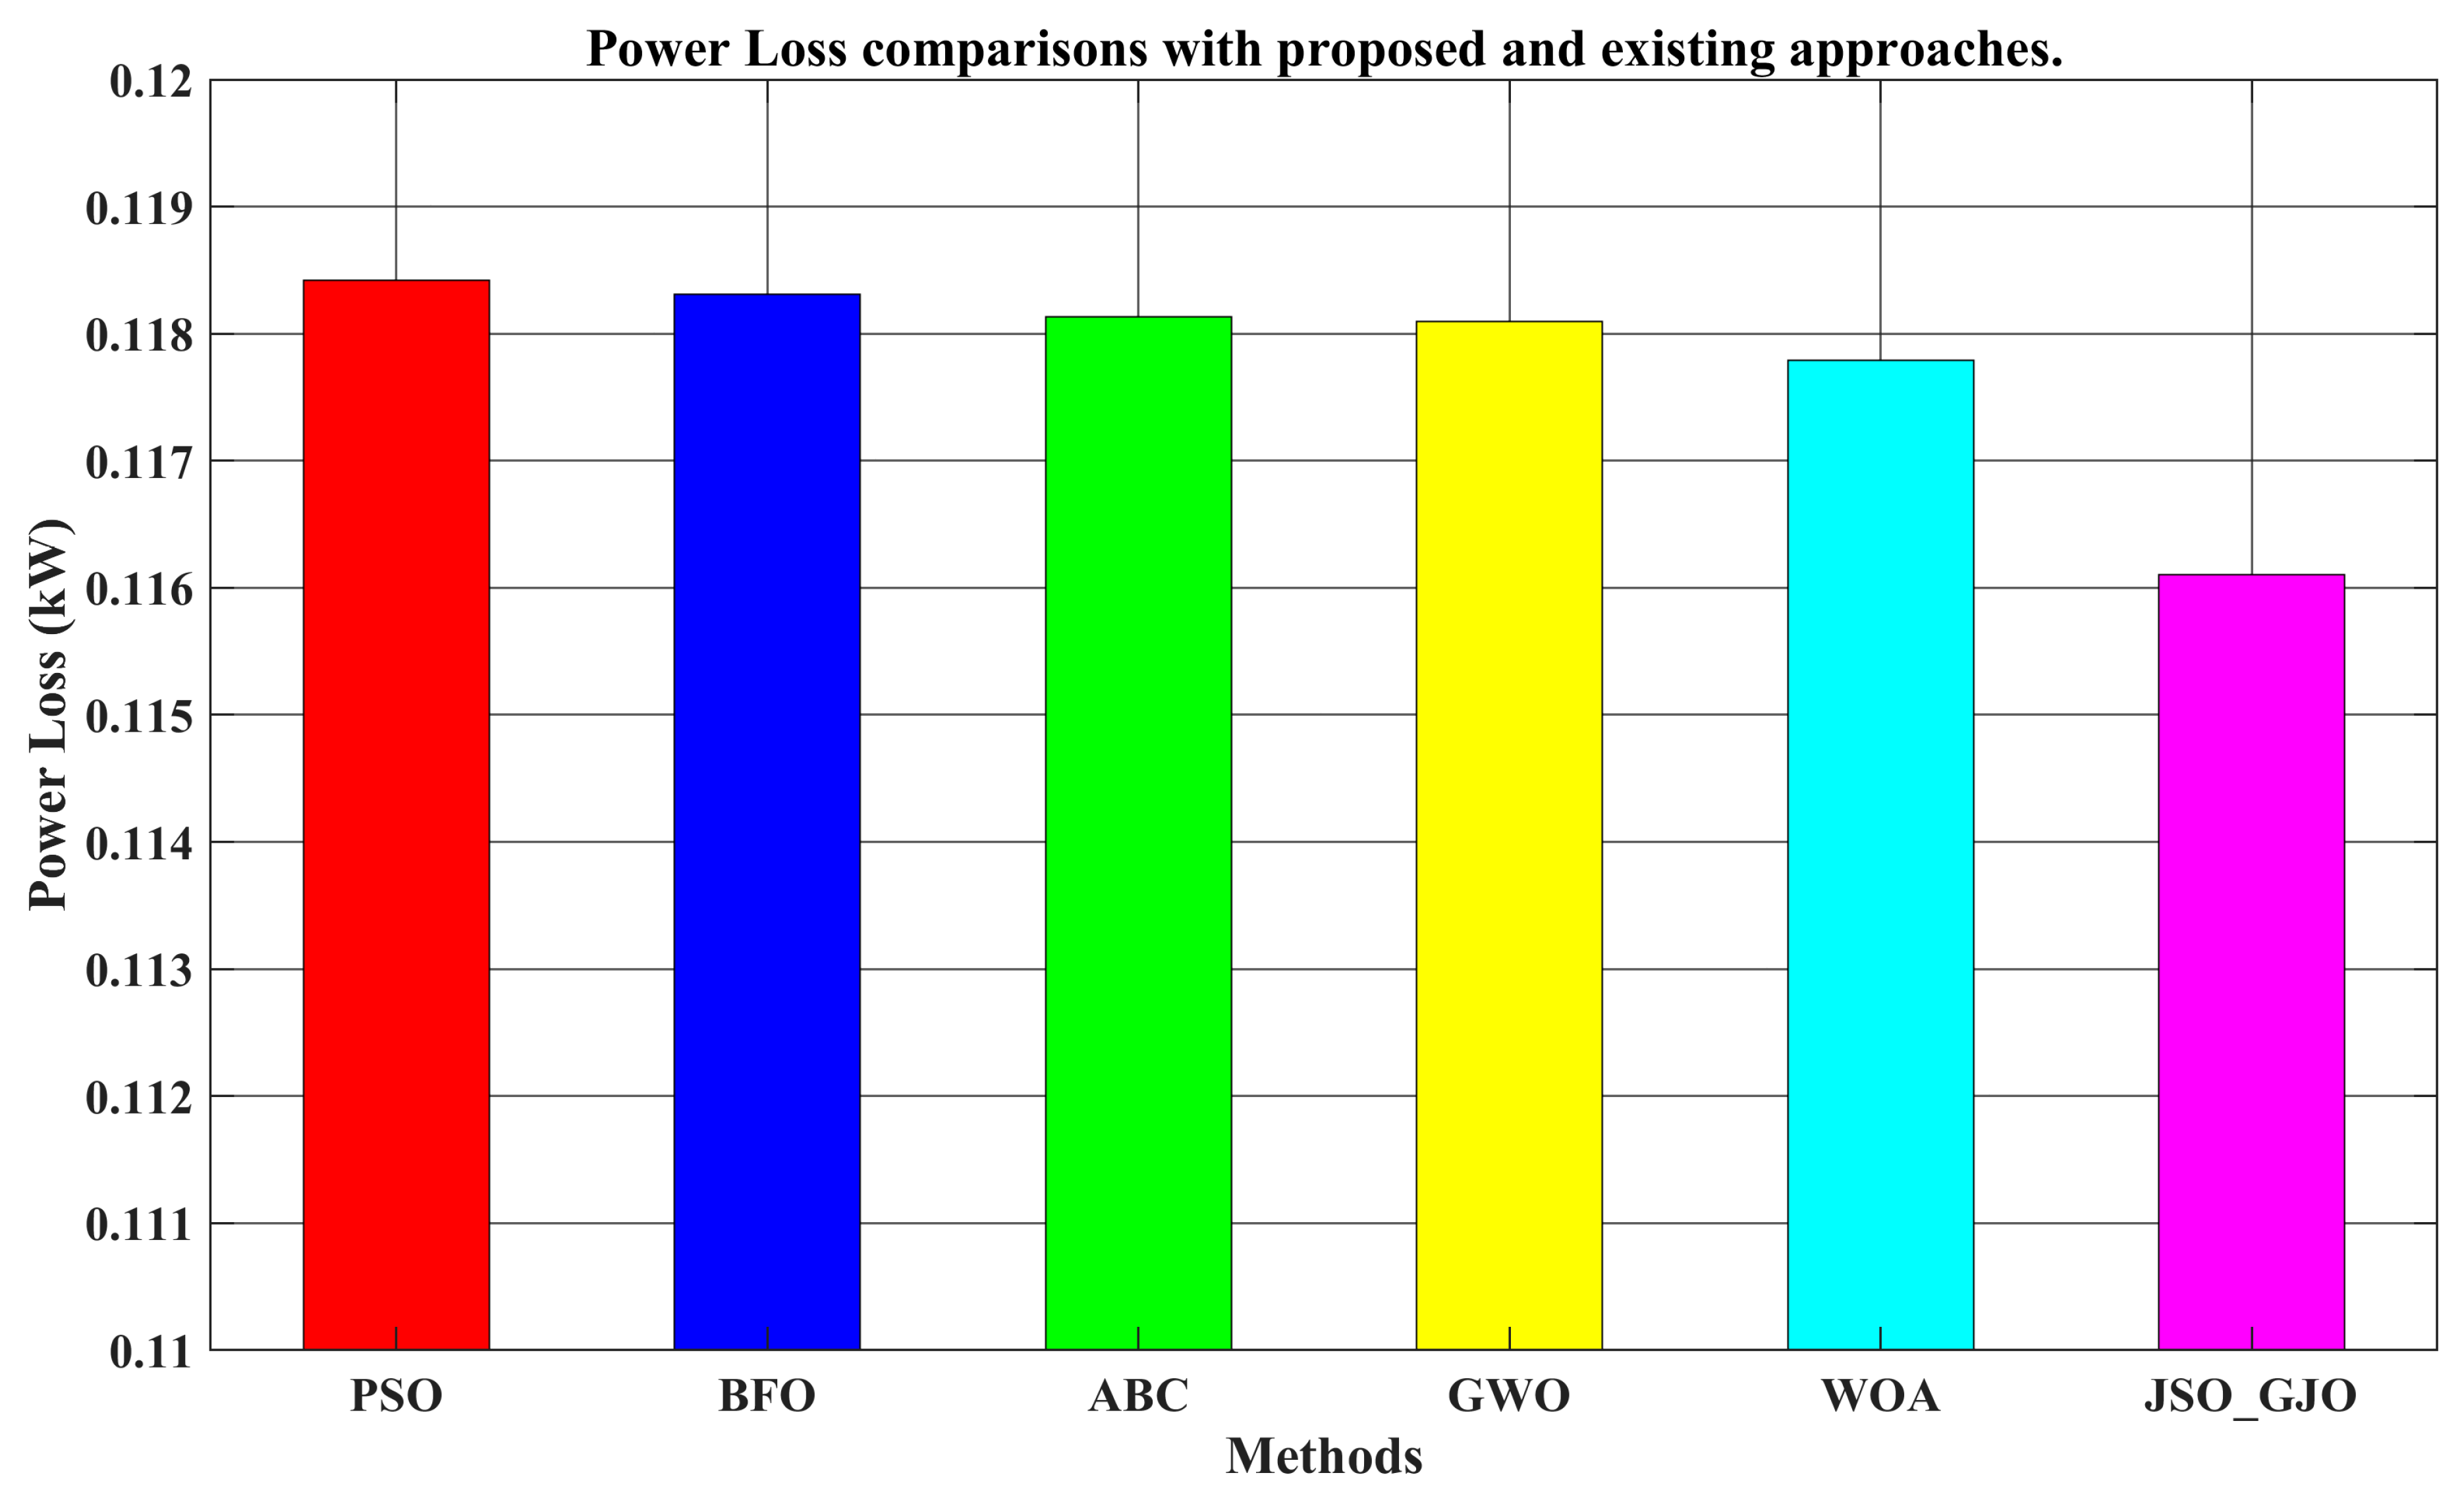
  • Energy generation from the PSO algorithm produced 421,804.63 kWh throughout the year while power loss reached 0.11842 kW, leading to operational expenses of USD 50,617,479.94 per year. The results of the BFO and ABC algorithms led to slightly better outputs but only yielded an energy total of 421,812.64 kWh and 421,818.67 kWh while showing power loss at 0.11831 kW (BFO) and 0.11813 kW (ABC).
  • The employment of GWO alongside WOA produced higher energy outcomes, reaching 421,822.00 kWh for GWO and 421,828.49 kWh for WOA. The power losses reached 0.11779 kW under WOA while its annual cost amounted to USD 50,617,479.28.
  • Energy production at 421,847.82 kWh along with minimized power losses at 0.11611 kW and lowered annual operational costs to USD 50,617,477.51 were achieved by the hybrid JSO-GJO algorithm. The system delivered the maximum energy generation of 421,847.82 kWh along with the minimum power dissipation at 0.11611 kW and presented the best annual operational expenditure at USD 50,617,477.51. The superior ability of the JSO-GJO algorithm to boost power generation and minimize costs positions this algorithm as an effective and financially beneficial solution for standalone EMS applications.
The JSO-GJO algorithm delivers improved results compared to traditional solutions by producing a 99.20% efficient output system that reduces power losses to 0.116 kW and demonstrates annual cost-effectiveness totaling USD 50,617,477.51. Over time, these seemingly minimal differences from each simulation demonstrate practical importance for microgrid applications of the algorithm. The system generates 1014 kWh extra annual energy output from a 15 kW system because of the 0.014% efficiency gain, and power waste reduction makes components less stressed. The stability achieved by the algorithm as shown through standard deviation measurements minimizes maintenance needs to enhance system reliability.
This study demonstrates that hybrid optimization approaches prove useful for raising energy efficiency levels and cost reduction in renewable energy-integrated emergency management systems. While this study establishes the theoretical superiority of hybrid algorithms, future research willcompare JSO-GJO against other hybrid approaches (e.g., PSO-GWO) to further refine optimization strategies, implement real-time testing on embedded hardware (e.g., OPAL-RT) to evaluate computational demands and scalability for larger microgrids, and conduct detailed cost-benefit analyses incorporating battery degradation, regional subsidies, and hardware implementation costs. These steps will bridge the gap between algorithmic innovation and practical deployment, ensuring robust, real-world applicability. This work lays a foundation for adaptive EMS design, with hybrid optimization serving as a critical tool for advancing sustainable energy management in isolated systems.

Author Contributions

Conceptualization, D.K., Y.K.C., A.S.P., R.R.V., R.M.E. and G.M.S.; methodology, D.K., Y.K.C., A.S.P., R.R.V., R.M.E. and G.M.S.; software, D.K. and A.K.S.; validation, D.K., Y.K.C. and A.S.P.; formal analysis, D.K. and A.K.S.; investigation, D.K., Y.K.C. and A.S.P.; writing—original draft preparation, D.K.; writing—review and editing, D.K., Y.K.C., A.S.P., A.K.S., R.R.V., R.M.E. and G.M.S. All authors have read and agreed to the published version of the manuscript.

Funding

This research did not receive any funding.

Institutional Review Board Statement

Not applicable.

Informed Consent Statement

Not applicable.

Data Availability Statement

No new data were created or analyzed in this study.

Conflicts of Interest

Author Raghavendra Rajan Vijayaraghavan was employed by the company Harman Connected Services India Pvt. Ltd. The remaining authors declare that the research was conducted in the absence of any commercial or financial relationships that could be construed as a potential conflict of interest.

List of Abbreviations

KeywordDescription
SPVSSolar Photovoltaic System
WTWind Turbine
WECSWind Energy Conversion System
EMSEnergy Management System
PVPhotovoltaic
BSBattery Systems
BESSBattery Energy Storage System
BMSBattery Management System
SoCState of Charge
MTMicroturbine
MPPTMaximum Power Point Tracking
GBDT-JSGradient Boosted Decision Trees—Jellyfish Search
PSOParticle Swarm Optimization
BFOBacterial Foraging Optimization
ABCArtificial Bee Colony
GWOGrey Wolf Optimization
WOAWhale Optimization Algorithm
ANNArtificial Neural Network
PMSGPermanent Magnet Synchronous Generator
DCDirect Current
HESHybrid Energy Systems
ESSEnergy Storage System
JSOJellyfish Search Optimization
GJOGolden Jackal Optimization
JSO-GJOJellyfish Search Optimization—Golden Jackal hybrid Optimization
QNNQuantum Neural Network
DSPDigital Signal Processing
IoTInternet of Things
TSTakagi-Sugeno
OPAL RTOnline Parameterized Adaptive Linearization—Real Time
MIWO-P&OModified Invasive Weed Optimization—Perturb and Observe
TSTakagi-Sugeno
ELElectrolyzer
SCSupercapacitor
SMCSliding Mode Control
GAGenetic Algorithm
LFSSALevy flight-salp swarm algorithm
MRACModel reference adaptive controller
MIESMicrogrid Islanded Energy Systems
VSCVariable Speed Control
ERMEnergy Reservoir Model
CRMCharge Reservoir Model
PSO-ML-FSSOParticle-Swarm-Optimization-Trained Machine Learning and Flying Squirrel Search hybrid Optimization
PI ControlProportional Integral Control
TSRTip speed Ratio
LSTMLong short-term memory
MOSFETmetal-oxide-semiconductor field-effect transistor
TCOtotal cost of ownership
R LoadResistive Load

List of Symbols

SymbolDescription
PPVOutput power of the solar PV system
VPVVoltage of the solar cell or PV system
IPVCurrent generated by the solar cell
VOCOpen-circuit voltage of the solar cell
nDiode ideality factor (dimensionless)
VtThermal voltage
IphPhotogenerated current in the solar cell
IdDiode current in the solar cell
RsSeries resistance of the PV cell
CPPower coefficient of the wind turbine
λTip Speed Ratio (TSR)
βBlade pitch angle
PWindKinetic power available in the wind
ρAir density
ASwept area of the wind turbine blades
VωWind speed
ωrAngular velocity of the wind turbine generator
PTurbinePower extracted by the wind turbine
RRadius of the wind turbine blade
C1, C2, …, C6Constants used in the calculation of CP
λiIntermediate term for calculating the Tip Speed Ratio
PoutOutput power of the battery
VBattBattery voltage
IBattBattery current
SoCState of charge of the battery
RLoadLoad resistance connected to the battery
RBattInternal resistance of the battery
EBattOpen-circuit voltage of the battery
EstoredEnergy stored in the battery
SoCmaxMaximum state of charge of the battery (percentage)
SoCminMinimum state of charge of the battery (percentage)
ηchargeCharging efficiency of the battery
ηdischargeDischarging efficiency of the battery
PchargeCharging power of the battery (kW)
PdischargeDischarging power of the battery (kW)
CBattTotal capacity of the battery (kWh)
ΔtTime step (hours)
ΔEstoredChange in stored energy over a time step
∆SoCChange in state of charge over a time step
SoCnewNew state of charge after a time step
SoColdOld state of charge
ηMTGEfficiency of the microturbine
mairMass flow rate of air through the turbine (kg/s)
ΔHEnthalpy change during combustion (J/kg)
ρairDensity of air (kg/m³)
AinletInlet area of the microturbine (m2)
VairInlet velocity of air (m/s)
PatmAtmospheric pressure (Pa)
RairSpecific gas constant for air, 287 J/(kg·K)
TairTemperature of the air (K)
hcombustionEnthalpy of combustion of fuel (J/kg)
ηcombustionCombustion efficiency
QfuelHeating value of the fuel (J/kg)
PMTGPower output of the microturbine generator (W)
XhybridHybrid value of control variables (e.g., JSO and GJO contributions)
αWeighting factor for JSO and GJO contributions
VLVoltage across the inductor
VinpInput voltage
VoutOutput voltage
ILInductor current
LInductance of the inductor
TONOn time period of the switch
TOFFOff time period of the switch
VCVoltage across the capacitor
DDuty cycle of the switching converter
ICCapacitor current
VBSBattery system voltage
IBSCurrent flowing in or out of the battery system
PBSPower output of the battery system
u(t)Control signal for the PI controller
KpProportional gain in the PI controller
KiIntegral gain in the PI controller
TSRrefReference tip speed ratio
TSRactualActual tip speed ratio
xiInput variables (e.g., wind speed, generator speed)
wijWeight connecting neuron i in the input layer to neuron j in the hidden layer
bjBias term for neuron j in the hidden layer
σxActivation function applied to each neuron in the hidden layer
vjkWeight connecting neuron j in the hidden layer to neuron k in the output layer
ckBias term for neuron k in the output layer
f(x)Predicted optimal pitch angle
zjOutput of neuron j in the hidden layer
PinpInput power of the converter
PoutOutput power of the converter
XJSOCurrent solution in the JSO algorithm
XGJOCurrent solution in the GJO algorithm
R.M.Random motion of the fish in the JSO algorithm
SbetterAttraction towards better solutions in the JSO algorithm
R.E.Random exploration in the GJO algorithm
EExploitation of promising regions in the GJO algorithm
f(x)Objective function to maximize efficiency and minimize cost
E(x)Efficiency function
C(x)Cost function
ΘSet of parameters
Θ*Optimized set of parameters that minimize the objective function
SnewNew solution at iteration
SoldPrevious solution at iteration
γIteration factor controlling convergence rate
PMPerformance matrices
ηEfficiency
RReliability
PtchargeCharging power at time t
PtdischargeDischarging power at time t
SoCtState of charge of the battery at time t
Xhybrid (PV)Hybrid solution for solar PV-based parameters
Xhybrid (WT)Hybrid solution for wind turbine-based parameters
Xhybrid (PV + BS)Hybrid solution for combined solar PV and battery storage
Xhybrid (PV + WT)Hybrid solution for combined solar PV and wind turbine parameters
Xhybrid (PV + WT + BS)Hybrid solution for combined solar PV, wind turbine, and battery storage
CintInitial cost
CCptComponent cost (purchase price)
CInstInstallation cost (installation expenses)
NTotal number of system components
COpOperational cost
CMaintMaintenance cost
CMonMonitoring cost
CSoftSoftware maintenance cost
CNetNet initial cost
CFIFinancial incentives (e.g., government incentives, tax credits, and rebates)
TCOTotal cost of ownership
TCOPVTotal cost of ownership for solar PV components
TCOWTTotal cost of ownership for wind turbine components
TCOBSTotal cost of ownership for battery storage components
TCOMTTotal cost of ownership for microturbine components
TCOEMSTotal cost of ownership for the energy management system (EMS)

References

  1. Thang, T.; Ahmed, A.; Kim, C.; Park, J. Flexible System Architecture of Stand-Alone PV Power Generation with Energy Storage Device. IEEE Trans. Energy Convers. 2015, 30, 1386–1396. [Google Scholar] [CrossRef]
  2. Pradhan, C.; Senapati, M.; Malla, S.; Nayak, P.; Gjengedal, T. Coordinated Power Management and Control of Standalone PV-Hybrid System with Modified IWO-Based MPPT. IEEE Syst. J. 2021, 15, 3585–3596. [Google Scholar] [CrossRef]
  3. Al-Turjman, F.; Qadir, Z.; Abujubbeh, M.; Batunlu, C. Feasibility analysis of solar photovoltaic-wind hybrid energy system for household applications. Comput. Electr. Eng. 2020, 86, 106743. [Google Scholar] [CrossRef]
  4. Ali, Z.; Abbas, S.Z.; Mahmood, A.; Ali, S.W.; Javed, S.B.; Su, C.-L. A Study of a Generalized Photovoltaic System with MPPT Using Perturb and Observer Algorithms under Varying Conditions. Energies 2023, 16, 3638. [Google Scholar] [CrossRef]
  5. Kumar, D.; Chauhan, Y.; Pandey, A.; Srivastava, A.; Kumar, V.; Alsaif, F.; Elavarasan, R.; Islam, M.; Kannadasan, R.; Alsharif, M. A Novel Hybrid MPPT Approach for Solar PV Systems Using Particle-Swarm-Optimization-Trained Machine Learning and Flying Squirrel Search Optimization. Sustainability 2023, 15, 5575. [Google Scholar] [CrossRef]
  6. Rayaguru, N.K.; Lindsay, N.M.; Crespo, R.G.; Raja, S.P. Hybrid bat–grasshopper and bat–modified multiverse optimization for solar photovoltaics maximum power generation. Comput. Electr. Eng. 2023, 106, 108596. [Google Scholar] [CrossRef]
  7. Rashmi, G.; Linda, M.M. A novel MPPT design for a wind energy conversion system using grey wolf optimization. Automatika 2023, 64, 798–806. [Google Scholar] [CrossRef]
  8. Khurshid, A.; Mughal, M.A.; Othman, A.; Al-Hadhrami, T.; Kumar, H.; Khurshid, I.; Arshad, A.; Ahmad, J. Optimal Pitch Angle Controller for DFIG-Based Wind Turbine System Using Computational Optimization Techniques. Electronics 2022, 11, 1290. [Google Scholar] [CrossRef]
  9. Ganjefar, S.; Ghassemi, A.A.; Ahmadi, M.M. Improving efficiency of two-type maximum power point tracking methods of tip-speed ratio and optimum torque in wind turbine system using a quantum neural network. Energy 2014, 67, 634–643. [Google Scholar] [CrossRef]
  10. Rosewater, D.; Ferreira, S.; Schoenwald, D.; Hawkins, J.; Santoso, S. Battery Energy Storage State-of-Charge Forecasting: Models, Optimization, and Accuracy. IEEE Trans. Smart Grid 2018, 9, 6059–6067. [Google Scholar] [CrossRef]
  11. Mahjoub, S.; Chrifi-Alaoui, L.; Drid, S.; Derbel, N. Control and Implementation of an Energy Management Strategy for a PV–Wind–Battery Microgrid Based on an Intelligent Prediction Algorithm of Energy Production. Energies 2023, 16, 1883. [Google Scholar] [CrossRef]
  12. Wu, H. Coordinated Control of an Islanded Microintegrated Energy System with an Electrolyzer and Micro-Gas Turbine. Int. J. Photoenergy 2022, 26, 1–10. [Google Scholar] [CrossRef]
  13. Gilev, B.; Andreev, M.; Hinov, N.; Angelov, G. Modeling and Simulation of a Low-Cost Fast Charging Station Based on a Micro Gas Turbine and a Supercapacitor. Energies 2022, 15, 8020. [Google Scholar] [CrossRef]
  14. Boutasseta, N.; Bouakkaz, M.S.; Fergani, N.; Attoui, I.; Bouraiou, A.; Neçaibia, A. Solar Energy Conversion Systems Optimization using Novel Jellyfish based Maximum Power Tracking Strategy. Procedia Comput. Sci. 2021, 192, 78–85. [Google Scholar] [CrossRef]
  15. Kumar, R.P.; Karthikeyan, G. A multi-objective optimization solution for distributed generation energy management in microgrids with hybrid energy sources and battery storage system. Energies 2023, 16, 109702. [Google Scholar] [CrossRef]
  16. Modu, B.; Abdullah, M.P.; Bukar, A.L.; Hamza, M.F.; Adewolu, M.S. Operational strategy and capacity optimization of standalone solar-wind-biomass-fuel cell energy system using hybrid LF-SSA algorithms. Int. J. Hydrogen Energy 2024, 50, 92–106. [Google Scholar] [CrossRef]
  17. Govindasamy, S.; Balapattabi, S.R.; Kaliappan, B.; Badrinarayanan, V. Energy management in microgrids using IoT considering uncertainties of renewable energy sources and electric demands: GBDT-JS approach. Energies 2023, 16, 1947. [Google Scholar] [CrossRef]
  18. Chou, J.-S.; Molla, A. Recent advances in use of bio-inspired jellyfish search algorithm for solving optimization problems. Nat. Commun. 2022, 13, 5628. [Google Scholar] [CrossRef]
  19. Yadav, D.; Singh, N.; Bhadoria, V.S.; Giri, N.C.; Cherukuri, M. A Novel Metaheuristic Jellyfish Optimization Algorithm for Parameter Extraction of Solar Module. Int. Trans. Electr. Energy Syst. 2023, 2023, 5589859. [Google Scholar] [CrossRef]
  20. Trong, H.C.; Nguyen, T.T.; Nguyen, T.T. Jellyfish Search Algorithm for Economic Load Dispatch under the Considerations of Prohibited Operation Zones, Load Demand Variations, and Renewable Energy Sources. Int. J. Artif. Intell. 2020, 13, 74–81. [Google Scholar] [CrossRef]
  21. Chopra, N.; Ansari, M.M. Golden jackal optimization: A novel nature-inspired optimizer for engineering applications. Expert Syst. Appl. 2022, 182, 116924. [Google Scholar] [CrossRef]
  22. Ismaeel, A.A.K. Performance of Golden Jackal Optimization Algorithm for Estimating Parameters of PV Solar Cells Models. Int. J. Intell. Syst. Appl. Eng. 2023, 12, 365–383. [Google Scholar]
  23. Nayyef, H.M.; Ibrahim, A.A.; Zainuri, M.A.A.M.; Zulkifley, M.A.; Shareef, H. A Novel Hybrid Algorithm Based on Jellyfish Search and Particle Swarm Optimization. Mathematics 2023, 11, 3210. [Google Scholar] [CrossRef]
  24. Ramachandran, R.; Kannan, S.; Ganesan, S.K.; Annamalai, B. Optimal economic-emission load dispatch in microgrid incorporating renewable energy sources by golden jackal optimization (GJO) and Mexican Axolotl optimization (MAO). Energy Environ. 2023. [Google Scholar] [CrossRef]
  25. Khan, S.A.; Tao, Z.; Agyekum, E.B.; Fahad, S.; Tahir, M.; Salman, M. Sustainable rural electrification: Energy-economic feasibility analysis of autonomous hydrogen-based hybrid energy system. Int. J. Hydrogen Energy 2024, 182, 116924. [Google Scholar] [CrossRef]
  26. Erario, M.L.; De Giorgi, M.G.; Przysowa, R. Model-based dynamic performance simulation of a microturbine. IOP Conf. Ser. Mater. Sci. Eng. 2022, 1226, 012032. [Google Scholar] [CrossRef]
  27. Khan, A.; Javaid, N. Optimal sizing of a stand-alone photovoltaic, wind turbine and fuel cell systems. Comput. Electr. Eng. 2020, 85, 106682. [Google Scholar] [CrossRef]
  28. Ibrahim, A.L.-W.; Xu, J. Intelligent adaptive PSO and linear active disturbance rejection control: A novel reinitialization strategy for partially shaded photovoltaic-powered battery charging. Comput. Electr. Eng. 2025, 123 Pt A, 110037. [Google Scholar] [CrossRef]
  29. Hernández-Ocaña, B.; Hernández-Torruco, J.; Chávez-Bosquez, O.; Calva-Yáñez, M.B.; Portilla-Flores, E.A. Bacterial Foraging-Based Algorithm for Optimizing the Power Generation of an Isolated Microgrid. Appl. Sci. 2019, 9, 1261. [Google Scholar] [CrossRef]
  30. Passino, K.M. Biomimicry of Bacterial Foraging for Distributed Optimization and Control. IEEE Control Syst. Mag. 2002, 22, 52–67. [Google Scholar] [CrossRef]
  31. Karaboga, D.; Basturk, B. On the Performance of Artificial Bee Colony (ABC) Algorithm. Appl. Soft Comput. 2008, 8, 687–697. [Google Scholar] [CrossRef]
  32. Zhang, Y.; Zeng, P.; Zang, C. Optimization algorithm for home energy management system based on artificial bee colony in smart grid. In Proceedings of the 2015 IEEE International Conference on Cyber Technology in Automation, Control, and Intelligent Systems (CYBER), Shenyang, China, 8–12 June 2015; pp. 734–740. [Google Scholar] [CrossRef]
  33. Dagal, I.; Ibrahim, A.L.-W.; Harrison, A. Leveraging a novel grey wolf algorithm for optimization of photovoltaic-battery energy storage system under partial shading conditions. Comput. Electr. Eng. 2025, 122, 109991. [Google Scholar] [CrossRef]
  34. Mohanty, S.; Subudhi, B.; Ray, P.K. A New MPPT Design Using Grey Wolf Optimization Technique for Photovoltaic System Under Partial Shading Conditions. IEEE Trans. Sustain. Energy 2016, 7, 181–188. [Google Scholar] [CrossRef]
  35. Medani, K.B.O.; Sayah, S.; Bekrar, A. Whale Optimization Algorithm Based Optimal Reactive Power Dispatch: A Case Study of the Algerian Power System. Electr. Power Syst. Res. 2018, 163 Pt B, 696–705. [Google Scholar] [CrossRef]
  36. Rafi, A.M.; Ali, M.; Hossain, M.I.; Al-Sulaiman, F.A.; Shafiullah, M. Whale Optimization Algorithm for Community Microgrid Energy Scheduling. In Proceedings of the 2022 Saudi Arabia Smart Grid (SASG), Riyadh, Saudi Arabia, 12–14 December 2022; pp. 1–7. [Google Scholar] [CrossRef]
Figure 1. Configuration for PV System.
Sustainability 17 04801 g001
Figure 2. Configuration of WECS System.
Sustainability 17 04801 g002
Figure 3. Equivalent Circuit for MT System.
Sustainability 17 04801 g003
Figure 4. Basic operation of the hybrid and standalone system.
Sustainability 17 04801 g004
Figure 5. Flowchart for charging of battery in energy management system.
Sustainability 17 04801 g005
Figure 6. Flowchart for working of EMS Switch controller design.
Sustainability 17 04801 g006
Figure 7. Diagram illustrating the integration of solar, wind, battery, and microturbine systems within an energy management framework.
Sustainability 17 04801 g007
Figure 8. Flowchart of energy management system.
Sustainability 17 04801 g008
Figure 9. Investigation of the Energy Management of Power of Demand under Case 1. (a) PSO; (b) BFO; (c) ABC; (d) GWO; (e) WOA; (f) JSO-GJO.
Sustainability 17 04801 g009aSustainability 17 04801 g009b
Figure 10. Comparative Analysis of proposed and existing Approaches. (a) Efficiency; (b) Power loss.
Sustainability 17 04801 g010
Figure 11. Variation in the input parameters of the solar and wind. (a) Irradiance; (b) Temperature; (c) Wind Speed.
Sustainability 17 04801 g011aSustainability 17 04801 g011b
Figure 12. Investigation of the Energy Management of Power of Demand under Case 2. (a) PSO; (b) BFO; (c) ABC; (d) GWO; (e) WOA; (f) JSO-GJO.
Sustainability 17 04801 g012aSustainability 17 04801 g012b
Figure 13. SOC of battery.
Sustainability 17 04801 g013
Figure 14. Comparative Analysis of Total Energy (kWh) per year of proposed and existing Approaches.
Sustainability 17 04801 g014
Figure 15. Comparative Analysis of total cost (USD) per year of proposed and existing Approaches.
Sustainability 17 04801 g015
Table 1. Summary of the recent works in the existing literature.
Ref. NoSystem ConfigurationObjective FunctionResearch GapTechniqueDisadvantageContribution
PVWTBSMTFCELSCDGBM
[1]-------Maximize SPVS flexibility, efficiency, and compatibility, ensuring fast, accurate control of converters and inverter voltage.Addressing efficient control strategies for flexible solar PV systems with lead-acid batteries under variable conditions.SMCHigh dependency on battery performance; may degrade under frequent cycling.Developed advanced control strategies for flexible SPVS.
[2]-------Maximize PV efficiency, MPPT effectiveness, and smooth power management in standalone microgrids.Improve MPPT efficiency and speed for standalone PV systems, especially in partial shading conditionsMIWO-P&O, Takagi-Sugeno (TS)-fuzzy logic, OPAL RTComplex implementation; requires high computational resources.Proposed an improved MPPT approach for enhanced PV efficiency.
[4]------Enhance PV system efficiency, stability via adaptive MPPT, advanced controls, and energy management with storage integration.Enhance P&O MPPT algorithm in PV systems by exploring advanced control techniques and variable step sizes.pulse width of the space vector; perturb and observe (P&O);
modulation
Limited scalability for large-scale systems.Integrated adaptive MPPT with advanced control for higher efficiency.
[5]--------Optimize solar PV system efficiency and reduce settling time with a hybrid MPPT algorithm.Develop hybrid MPPT algorithm for solar PV systems to improve efficiency and reduce settling time.PSO_ML-FSSO,Sensitive to initial conditions; may require fine-tuning.Developed a hybrid MPPT algorithm to enhance efficiency and reduce response time.
[7]--------Maximize wind energy system efficiency with GWO-MPPT, optimizing MOSFET duty cycle for enhanced power extraction.GWO-MPPT controller enhances integrated wind energy system efficiency, addressing previous inefficiencies.GWOPerformance drops under rapidly changing wind conditions.Implemented GWO-MPPT for enhanced wind energy extraction.
[8]--------Optimize pitch angle controller with PSO and GA for enhanced system response and efficiency.Methodology lacks adaptability for real-time adaptive control due to manual selections and analysis requirements.PSO optimized PI, GA optimized PIHigh computational cost; may not be suitable for real-time applications.Enhanced pitch angle control with PSO and GA for real-time adaptability.
[9]--------Optimize wind turbine power extraction with Quantum Neural Networks for MPPT in battery-charging windmills.Current wind MPPT strategies insufficiently adapt to non-linearities, hindering efficiency and power extraction.QNNRequires extensive training data; complex implementation.Implemented QNN for optimized wind energy extraction in battery-charging systems.
[10]--------Develop precise SoC forecasting models, evaluate performance, and enhance utility via model adaptation.Addressing battery model uncertainty for enhanced State of Charge forecasting accuracy is crucial.ERM, CRMLimited generalization across different battery chemistries.Enhanced SoC forecasting accuracy through model adaptation.
[11]------Enhancing accuracy in SoC forecasting models, addressing battery model uncertainty.lack of surplus power management investigation; suggests future integration for comprehensive hybrid power system analysis.LSTM Neural NetworkHigh computational demand; may not be suitable for edge devices.Improved battery SoC prediction accuracy with LSTM models.
[12]-----Coordinate islanded MIES for stable power distribution among electrolyzer, MTG, and supercapacitor, prioritizing renewable energy use.Scarcity in research on coordinated control for islanded MIES, especially enhancing AC bus fault management.(MRAC), current control loops using a PI controlComplex coordination; may introduce stability issues.Developed coordinated control strategies for islanded MIES.
[14]--------Optimize PV system efficiency under partial shading using DSP-implemented Jellyfish algorithm for optimal energy generation.Enhance PV system performance under partial shading with novel algorithms like Jellyfish Optimization in disturbed conditions.DSP-implemented Jellyfish algorithmRequires specialized hardware (DSP); not easily deployable.Applied Jellyfish algorithm to improve PV performance under partial shading.
[15]---Minimize system cost, optimize energy management for distributed generation, achieving lower costs and higher efficiency.Validate multi-objective optimization in real microgrid, integrating with existing systems.GJOHigh complexity; may not be cost-effective for small-scale systems.Proposed a cost-effective, energy-efficient optimization using GJO.
[16]-----Optimize hybrid renewable system for reliability, cost-effectiveness with LFSSA, minimizing annualized system costEvaluate hybrid LFSSA performance and cost-effectiveness versus existing methods in microgrid design.LFSSAConvergence speed may vary with problem complexity.Improved hybrid system reliability and cost-effectiveness with LFSSA.
[17]------Enhance microgrid management using IoT, addressing renewable uncertainties, comparing GBDT-JS with existing methods.Enhance predictability in multi-energy microgrids with machine learning for operational dynamics.GBDT-JSDependent on data quality; IoT integration may introduce cybersecurity risks.Developed IoT-integrated machine learning for enhanced microgrid management.
Table 2. Voltage and Current Equations in ON and OFF Modes of inductor and capacitor in Boost Converter.
Equations in ON ModeEquations in OFF Mode
Voltage across the inductor V L = V i n p V L = V o u t
Inductor current: I L = V i n p × T O N L I L = V o u t × T O F F L
Voltage across the capacitor: V c = V i n p × V L = V i n p 1 + D V c = V i n p 1 + D
Capacitor current: I c = V C × T O N T O F F I c = V C × T O N T O F F
Table 3. Voltage, Current, and Power Equations in Charging and Discharging of Battery System in bidirectional DC-DC converter.
In Charging ModeIn Discharging Mode
Voltage relation: V o u t = V i n p 1 + D V i n p = V o u t 1 + D
Current relation: I o u t = V i n p V o u t × I i n p I i n p = V i n p V o u t × I o u t
Power relation: P i n p = V i n p × I i n p
P o u t = V o u t × I o u t
P i n p = V i n p × I i n p
P o u t = V o u t × I o u t
Table 4. Truth table of EMS operation.
S.NOInputOutput
Primary SourceBackup Source
PVWECSBESSMT
1.10001
2.01001
3.11001
4.11101
5.00011
Table 5. Analysis of the simulation’s performance under constant temperature of 25 °C and wind speed of 12 m/s, with an irradiance of 1000 W/m2.
S.NOAlgorithmLoad Demand (W)PV (W)WT (W)BS (W)MT (W)Load (W)Efficiency (%)
1.PSO [27,28]15,00014,557.8414,691.9214,212.814,393.8814,345.6999.181
2.BFO [29,30]15,00014,558.6314,692.57114,212.814,393.88 14,346.1699.182
3.ABC [31,32]15,00014,559.58114,692.94314,212.814,393.88 14,346.6799.183
4.GWO [33,34]15,00014,559.8314,693.2414,212.814,393.88 14,346.8499.184
5.WOA [35,36]15,00014,560.4314,693.7814,212.814,393.88 14,347.4399.186
6.JSO-GJO (Present)15,00014,561.7614,695.54414,212.814,393.88 14,349.8999.20
Table 6. Analyzing the performance of the simulation results at different temperatures (30 °C, 20 °C, and 15 °C), wind speeds (10 m/s, 7 m/s, and 9 m/s), and irradiance levels (1000 W/m2, 800 W/m2, and 600 W/m2).
S.NOAlgorithmParametersLoad Demand
(W)
PV (W)WECS (W)BESS (W)MTG (W)Load (W)
1.PSO [27,28]Solar: Irradiance—1000
Temperature—30
Wind:
Wind Speed −10 m/s
15,00014,231.2712,181.20614,212.8014,393.8814,391.131
Solar: Irradiance—800
Temperature—20
Wind:
Wind Speed −7 m/s
15,0008906.236577.11314,212.8014,393.888242.772
Solar: Irradiance—600
Temperature—15
Wind:
Wind Speed −9 m/s
15,0005672.3487579.48214,212.8014,393.885965.228
2.BFO [29,30]Solar: Irradiance—1000
Temperature—30
Wind:
Wind Speed −10 m/s
15,00014,232.64612,181.89514,212.8014,393.8814,391.742
Solar: Irradiance—800
Temperature—20
Wind:
Wind Speed −7 m/s
15,0008912.456577.37314,212.8014,393.888243.006
Solar: Irradiance—600
Temperature—15
Wind:
Wind Speed −9 m/s
15,0005678.1067579.72014,212.8014,393.885965.570
3.ABC [31,32]Solar: Irradiance—1000
Temperature—30
Wind:
Wind Speed −10 m/s
15,00014,233.24912,182.36614,212.8014393.8814,392.375
Solar: Irradiance—800
Temperature—20
Wind:
Wind Speed −7 m/s
15,0008916.8456577.60214,212.8014,393.888243.438
Solar: Irradiance—600
Temperature—15
Wind:
Wind Speed −9 m/s
15,0005685.257579.99114,212.8014,393.885965.881
4.GWO [33,34]Solar: Irradiance—1000
Temperature—30
Wind:
Wind Speed −10 m/s
15,00014,233.4712,182.58614,212.8014,393.8814,392.537
Solar: Irradiance—800
Temperature—20
Wind:
Wind Speed −7 m/s
15,0008923.9986577.8214,212.8014,393.888243.847
Solar: Irradiance—600
Temperature—15
Wind:
Wind Speed −9 m/s
15,0005688.0047580.20214,212.8014,393.885966.018
5.WOA [35,36]Solar: Irradiance—1000
Temperature—30
Wind:
Wind Speed −10 m/s
15,00014,233.9812,182.7114,212.8014,393.8814,392.739
Solar: Irradiance—800
Temperature—20
Wind:
Wind Speed −7 m/s
15,0008927.656578.13314,212.8014,393.888244.120
Solar: Irradiance—600
Temperature—15
Wind:
Wind Speed −9 m/s
15,0005696.8097580.6314,212.8014,393.885966.333
6.JSO-GJO [Proposed]Solar: Irradiance—1000
Temperature—30
Wind:
Wind Speed −10 m/s
15,00014,235.6812,184.46914,212.8014,393.8814,393.987
Solar: Irradiance—800
Temperature—20
Wind:
Wind Speed −7 m/s
15,0008930.7846578.60914,212.8014,393.888244.703
Solar: Irradiance—600
Temperature—15
Wind:
Wind Speed −9 m/s
15,0005701.807581.9114,212.8014,393.885967.53
Disclaimer/Publisher’s Note: The statements, opinions and data contained in all publications are solely those of the individual author(s) and contributor(s) and not of MDPI and/or the editor(s). MDPI and/or the editor(s) disclaim responsibility for any injury to people or property resulting from any ideas, methods, instructions or products referred to in the content.

