Article

Uncertainty Analysis of Provincial Carbon Emission Inventories: A Comparative Assessment of Emission Factors Sources

1
School of Earth Sciences and Spatial Information Engineering, Hunan University of Science and Technology, Xiangtan 411201, China
2
School of Economics, Guangxi University for Nationalities, Nanning 530006, China
*
Author to whom correspondence should be addressed.
Sustainability 2025, 17(11), 4787; https://doi.org/10.3390/su17114787
Submission received: 12 April 2025 / Revised: 16 May 2025 / Accepted: 19 May 2025 / Published: 23 May 2025

Abstract

:
Enhancing the precision of carbon accounting not only improves climate policy design, but also contributes directly to sustainability goals by enabling more targeted and accountable emission reduction strategies. Therefore, accurate carbon inventories are foundational to evidence-based climate action and sustainable development planning. This study estimates the carbon emissions of Hunan Province from 2016 to 2020 using the sectoral approach and energy activity data across four major sectors—industrial production, thermal power generation, transportation, and residential life. Emission factors (EFs) were drawn from three different sources: direct measurements, IPCC (Intergovernmental Panel on Climate Change) default values, and published literature. An improved Monte Carlo simulation method was employed to assess the uncertainty of carbon emission accounting associated with different EF sources. The experimental results indicated that carbon emissions calculated based on the literature and default EFs were systematically higher than those derived from empirical measurements, primarily due to discrepancies in the industrial and power generation sectors. In a representative year (2017), the carbon emission estimated based on measured EFs produced the narrowest confidence intervals, reflecting lower uncertainty (−5.31–8.17%), while the uncertainties of carbon emissions calculated using the literature and default EFs were −6.88–9.03% and −5.77–9.94%, respectively. The industrial carbon emissions were the dominant source of overall uncertainty, while the transportation carbon emission had a comparatively minor impact. Importantly, across all departments, the use of measured EFs significantly reduced the uncertainty of carbon inventories, reinforcing the value of locally calibrated data. These findings underscore the urgent need for improved EF measurement systems and standardized accounting practices to support the reliability of subnational carbon inventories.

1. Introduction

Climate change is one of the most serious challenges faced by the world today. Among them, the continuously rising CO2 emissions (referred to as carbon emissions, the same below) have attracted widespread attention worldwide [1,2,3,4,5]. As the world’s largest carbon emitter, China’s carbon emissions have a profound impact on global climate change. Due to differences in accounting boundaries, accounting methods, data sources, and emission factors (EFs), there are significant differences in China’s carbon emission data provided by domestic and foreign databases, which puts enormous pressure for the formulation of China’s carbon reduction policies and international climate negotiations. Therefore, building a comprehensive and standardized carbon emission accounting system to scientifically calculate carbon emissions is a prerequisite for accurately grasping the carbon emission situation and formulating carbon reduction policies. In 2006 and 2018, the International Organization for Standardization (ISO) respectively released the Greenhouse Gas Inventory Verification Standard (i.e., ISO14064) and the Greenhouse Gas Product Carbon Footprint Quantification Requirements and Guidelines (i.e., ISO14067 standard), providing a unified standard for evaluating a country or region’s carbon emissions [6,7]. However, due to differences in activity levels, carbon EF values, and accounting method, there is significant uncertainty in the greenhouse gas emission inventories provided by different countries or regions. Each province in China plays an important role in carbon reduction and is the main responsible party for controlling the total amount of carbon emissions. The quality of their carbon emission inventories is the foundation for supporting the achievement of the “dual carbon” goals [8]. Therefore, how to minimize the uncertainty of provincial carbon inventories and accurately quantify the impact of uncertainty sources on carbon accounting is of great significance for formulating regional carbon reduction policies and achieving national carbon reduction targets.
The domestic carbon accounting started relatively late compared with foreign research. The preliminary work mainly involved a few domestic institutions and scholars conducting research on the accounting boundaries, measurement methods, and inventory compilation of carbon emission in conjunction with relevant national research projects [9,10,11,12]. For example, the Electronic Industry Standardization Research Institute of the Ministry of Industry and Information Technology has conducted research on the methodology of carbon footprint on electronic information products and is responsible for standardization work in the fields of environment and greenhouse gases [13]. In 2006, China successively compiled a series of documents to guide carbon emission accounting, including the “Guidelines for National Greenhouse Gas Inventories” and the “Guidelines for Provincial Greenhouse Gas Inventory Compilation”, providing corresponding and comprehensive carbon accounting standards for the national and provincial scales. Subsequently, in 2010, the Chinese Academy of Sciences released China’s first industry-classified emission inventory derived from carbon estimations across 42 industrial sectors [14]. From 2013 to 2015, the National Development and Reform Commission (NDRC) issued carbon accounting methods and reporting guidelines for 24 industries, including power, chemical, steel, cement, etc., based on the enterprise standards of Greenhouse Gas Protocol (GHG Protocol), thus establishing the basic system of carbon emission accounting in China [15]. In 2021, on the basis of combing the accounting methods of greenhouse gas emissions at home and abroad, the Chinese Academy of Information and Communication and the Chinese Academy of Sciences respectively released the first domestic carbon emission accounting model in cloud computing and the carbon emission model of power big data, providing innovative support and industry standards for carbon emission accounting. In 2022, the Ministry of Ecology and Environment (MEE) and the National Standardization Management Committee (NSMC) jointly issued 12 industry standards for calculating greenhouse gas emissions according to the fuel end. Additionally, in 2024, the Ministry of Natural Resources (MNR) and Nanjing University developed a national spatial carbon emission accounting system based on remote sensing and socio-economic data, which realized the automatic accounting of carbon emissions from land-use types in maintenance and change. In addition, some scholars used the IPCC (Intergovernmental Panel on Climate Change) method to compile greenhouse gas emission inventories for cities such as Beijing, Shanghai, and Tianjin [16], and estimated the greenhouse gas emissions of fixed pollution sources, including coal chemical industry, coal-fired power plants, and cement and steel enterprises. By comparing the EFs of different types of coal with the default values recommended by the IPCC, it was found that the carbon EFs of burning bituminous coal and lignite are both within the 95% confidence interval of the default EFs. Among them, the EF of bituminous coal was 4% higher than the IPCC default value, while the difference between the EF of lignite and the IPCC default value was relatively small [17]. However, the uncertainty analysis of carbon accounting in different industries and accuracy requirements for data sources were rarely involved in the carbon inventories. Although some scholars have analyzed the uncertainty of carbon emission inventories in the coal industry based on the life cycle approach, most of them have not quantified the impacts of uncertainty sources on estimating carbon emission [18,19].
Foreign scholars’ research on carbon accounting uncertainty mainly focused on accounting methods and emission inventory compilation standards. In terms of methods, macro-level carbon accounting largely adheres to the IPCC National Greenhouse Gas Inventory Guidelines, employing a top–down approach that estimates emissions through primary energy activity data (AD) and default values following sectoral classifications and subsector disaggregation. It was found that the carbon emissions calculated using IPCC default values were higher than those calculated based on the measured EF values [20,21]. For instance, Brazil used the IPCC method to account for the greenhouse gas emissions of 47 cities and found that 16 cities in the carbon inventory report had incomplete accounting sources and incomplete accounting data due to only considering carbon emissions from fixed energy, transportation, and waste [22]; Tokyo in Japan, New York in the United States, and London in the United Kingdom have all used IPCC models to construct greenhouse gas emission inventories and calculate carbon emissions, providing a standard framework for estimating carbon emissions in cities [23]. At the micro level, the emission coefficient method, lifecycle method, and carbon balance method are used in a bottom–up manner to account for the carbon emissions and product carbon footprints generated by micro entities such as enterprises and consumers [24]. However, the above methods ignored the impact of differences in EFs among different regions, products, and enterprises on carbon accounting. In terms of inventory preparation, international specialized organizations such as the International Council for Local Environment (ICLEI), World Resources Institute (WRI), and World Business Council for Sustainable Development (WBCSD) have jointly released the GHG Protocol, which provides a detailed study on the carbon emission inventory of thermal power enterprises and forms a standard system for greenhouse gas accounting of thermal power enterprises, providing reference guidelines for carbon accounting methods of key industries (enterprises) [25,26]. However, there is less consideration of the potential impact of measurement methods, energy activities, and EFs on carbon accounting uncertainty in inventory [27]. To help EU member states fulfill their emission reduction commitments, the European Union Emissions Trading System (EU ETS) adopts a decentralized governance model and uses a total trading mechanism to reduce greenhouse gas emissions. This means setting an emission cap for each country, determining the industries and enterprises included in the emission trading system, and allocating a certain amount of emission permits to these enterprises, in order to limit greenhouse gas emissions to the socially desired level in the most economical way. However, quantitative analysis of carbon inventory uncertainty is rarely involved.
In summary, existing research on the uncertainty of carbon emission accounting mainly focuses on the carbon emissions of cities and enterprises [28,29,30,31,32,33], while there is relatively little quantitative analysis of the uncertainty in provincial carbon accounting. Although some scholars have explored the impact of different measurement methods on the uncertainty of provincial carbon accounting [34], the influence of EFs and AD on the uncertainty of provincial carbon emission accounting has not yet been addressed. In fact, it is very important to strengthen uncertainty research on provincial carbon emission accounting. First, the achievement of the national carbon neutrality target has raised higher requirements for the accuracy and reliability of provincial carbon emission inventories, and how to effectively reduce the uncertainty of carbon inventories has become a focus of attention in carbon reduction. Second, when compiling provincial carbon inventories using AD and EF, AD mainly comes from statistical data from national and regulatory agencies, while EF mainly comes from default values or empirical constants obtained from limited experiments. Thus, the reliability of data sources, the absence of historical data, and regional differences in EFs can all lead to certain uncertainties in carbon inventories. Third, uncertainty analysis is one of the components of a complete inventory, and it is also a guarantee for the correctness and reliability of carbon emission data. Additionally, most existing research on analyzing the uncertainty of carbon emission inventories is based on expert judgment and the traditional Monte Carlo method (MCM). However, the subjective evaluation of the expert judgment method is easily influenced by personal biases and experiential limitations, thereby reducing the accuracy and reliability of the uncertainty analysis [35]. Although the traditional MCM can fully overcome the influence of subjective biases of experts on uncertainty estimation, there are also problems with the generation of random numbers and the determination of joint distributions relying too much on pre-assumed distributions, resulting in biased results in uncertainty analysis. Based on energy AD from provincial sectors, an improved MCM with Latin hypercube sampling (LHS) [36] in our study was used to analyze the impact of different EFs (default value, measured EF value, and literature EF value) on the uncertainty of carbon emission accounting, providing a scientific basis for achieving the “dual carbon” goal, formulating targeted emission reduction policies, and fair carbon trading.

2. Materials and Methods

2.1. Research Method

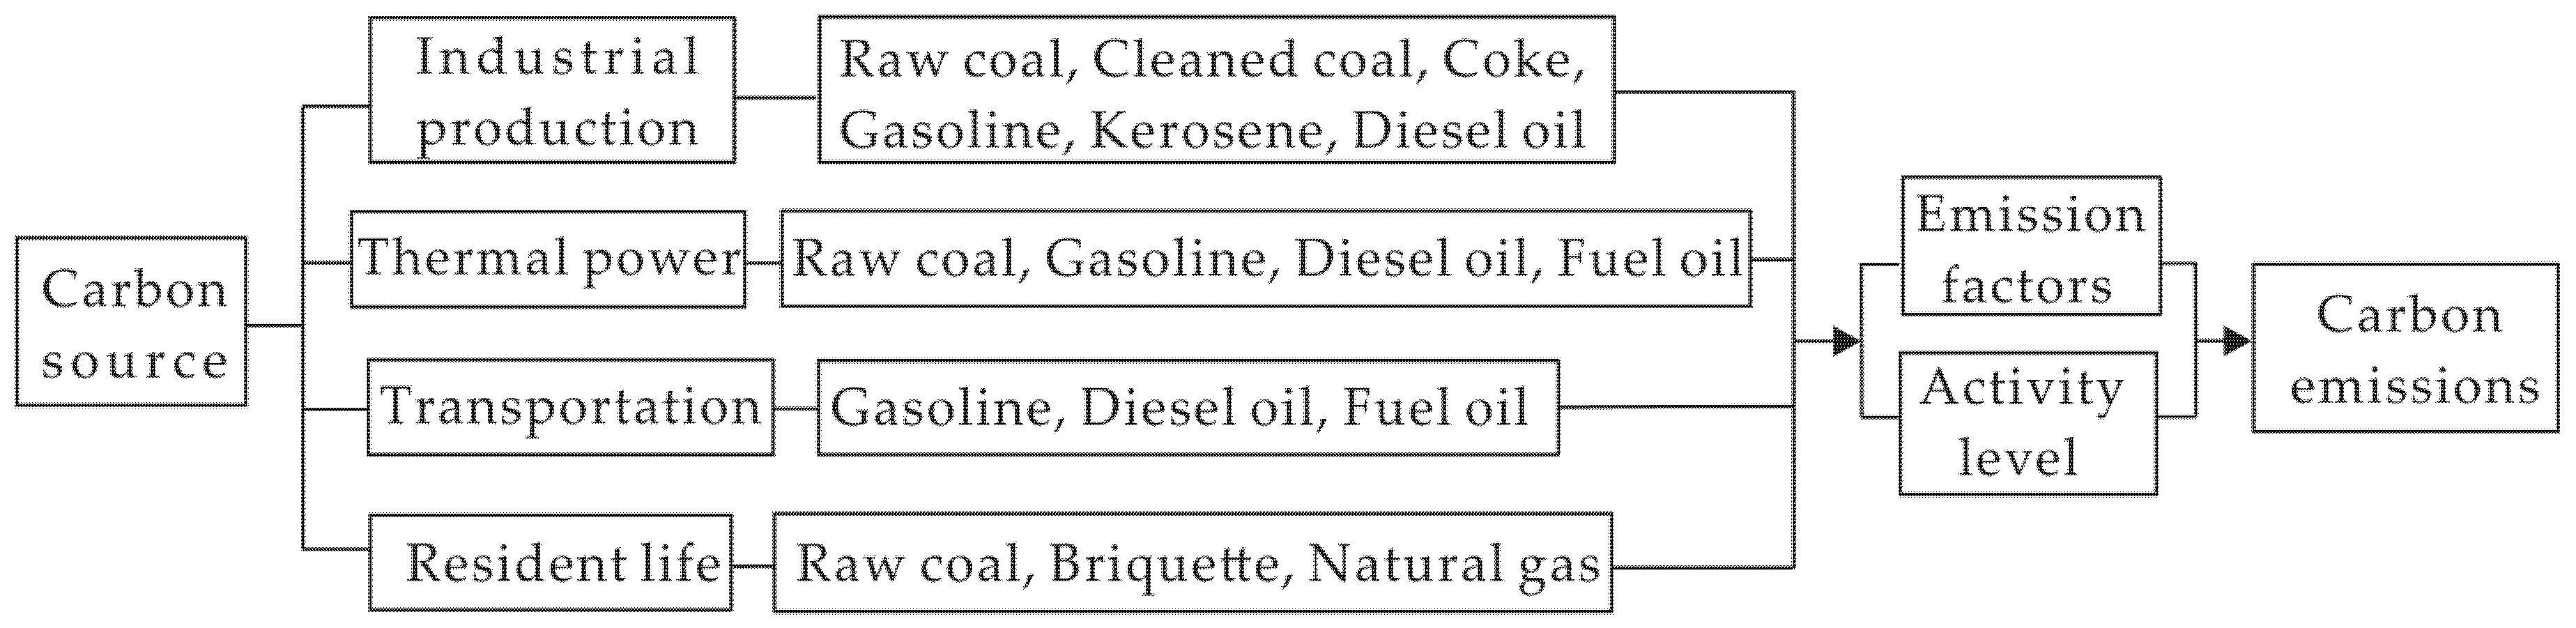
2.1.1. Carbon Emission Accounting

Carbon emissions caused by human activities can be classified into multiple categories based on their sources, including fossil fuel combustion, non-energy use (such as emissions from raw materials and materials), fossil energy extraction, industrial production processes, waste management, biofuel combustion, and land-use change. By comparing the accounting boundaries of carbon emission databases at home and abroad [37,38], this study does not consider carbon emissions generated by non-energy use, biomass burning, and land-use changes when estimating provincial carbon emissions, but only considers carbon emissions caused by human activities consuming fossil fuels. Referring to the research results of Yang [39] and Li et al. [40], the carbon emission sources generated by provincial fossil energy consumption are divided into four aspects according to industry sectors: industrial production processes, thermal power generation, transportation (excluding aviation and water transportation), and residential life. The types of energy consumed by each sector are shown in Figure 1. Considering the differences and applicability between the departmental method and the reference method, this study adopts the sector method to estimate the carbon emissions of each sector based on AD (energy consumption) and EF. Finally, the total provincial carbon emissions are calculated by adding them up. The specific calculation formula is as follows:
E = i k ( A D i k × E F i k ) × 44 12
In the formula, E is the provincial carbon emissions, i is the type of carbon emission source (i.e., thermal power generation, industrial production, transportation, and residential life), and k represents the type of energy. AD and EF respectively represent the energy activity data and corresponding carbon emission factors of the department; 44/12 is the ratio of the relative molecular weight of CO2 to carbon.

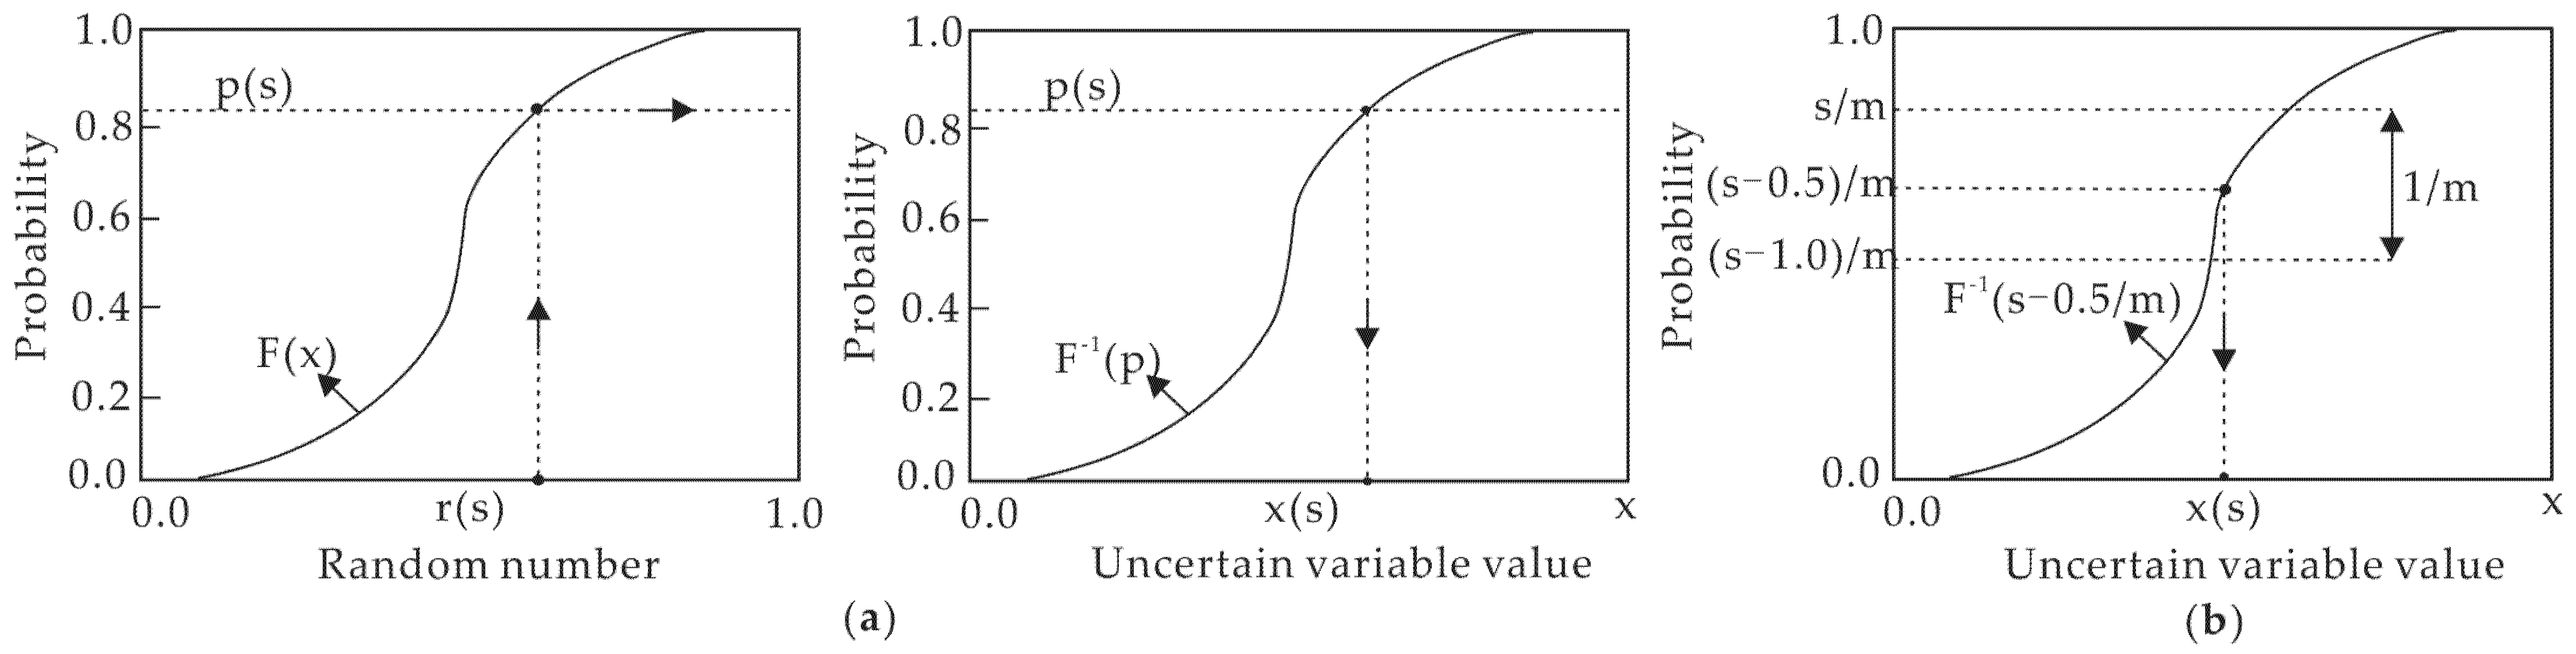
2.1.2. Improved Monte Carlo Simulation

At present, the commonly used method for analyzing uncertainty in carbon emission estimation is MCM simulation. This method is based on probability distribution and quantifies uncertainty through random sampling and statistical simulation. Namely, within the probability interval [0, 1] of each variable, the sampling value r(s) and the corresponding probability value p(s) are obtained by sampling the normal probability distribution function F(x), followed by the uncertain variable x through a uniformly distributed random number sequence r. Then, the random variable x(s) corresponding to the sampled value r(s) is calculated using the inverse function F 1 ( x ) , and all generated random variable x(s) values are counted to form a dataset for simulating carbon emissions (Figure 2a). However, traditional MCM suffers from problems such as excessive dependence of random numbers on pre-assumed distributions due to the complex integral form of probability distributions. This study improved MCM by using the LHS instead of random sampling [41], and quantified the impact of EFs on the uncertainty of carbon emission accounting. The specific steps of the improved MCM simulation are as follows: First, analyze the sources of uncertainty in carbon emission accounting and establish a model for estimating carbon emissions. Second, calculate the characteristic values of EF (such as mean, standard deviation, and maximum and minimum values), and use the “Define Assumptions” in Crystal Ball V11.1.2.4 software to set corresponding probability distributions for the EF of different energy sources. Third, based on LHS, each input variable (carbon emission factor) is divided into non-overlapping equal probability intervals. That is, according to the required number of samples, the probability interval [0, 1] of each variable (i.e., the vertical axis of the probability distribution curve F(x)) is divided into m different sub-intervals. For example, the s-th interval can be represented as [(s − 1)/m, s/m] (s = 1, 2, 3, …, m). Then, a midpoint from each sub-interval is selected as a sampling point. The sampling value of the s-th interval is (s − 0.5)/m, and the random variable x(s) corresponding to the s-th interval sampling point is calculated using the inverse function F 1 ( x ) of the normal distribution function. The LHS sampling process is shown in Figure 2b. Finally, the samples extracted from each random variable are mixed to form a sample set for estimating carbon emissions, and uncertainty analysis is performed using the Bootstrap method based on the estimated provincial carbon emissions. That is to say, carbon emission data are repeatedly extracted from the estimated provincial carbon emission dataset with replacement to create multiple new Bootstrap samples. Then, the mean of each Bootstrap sample is calculated, and the distribution of these means is determined. Uncertainty analysis and confidence interval estimation are conducted according to the distribution of the Bootstrap sample means, with the basic steps referenced in the literature [42]. The upper limit of uncertainty is expressed as (97.5% quantile-mean)/mean × 100%, and the lower limit is expressed as (2.5% quantile-mean)/mean × 100%.

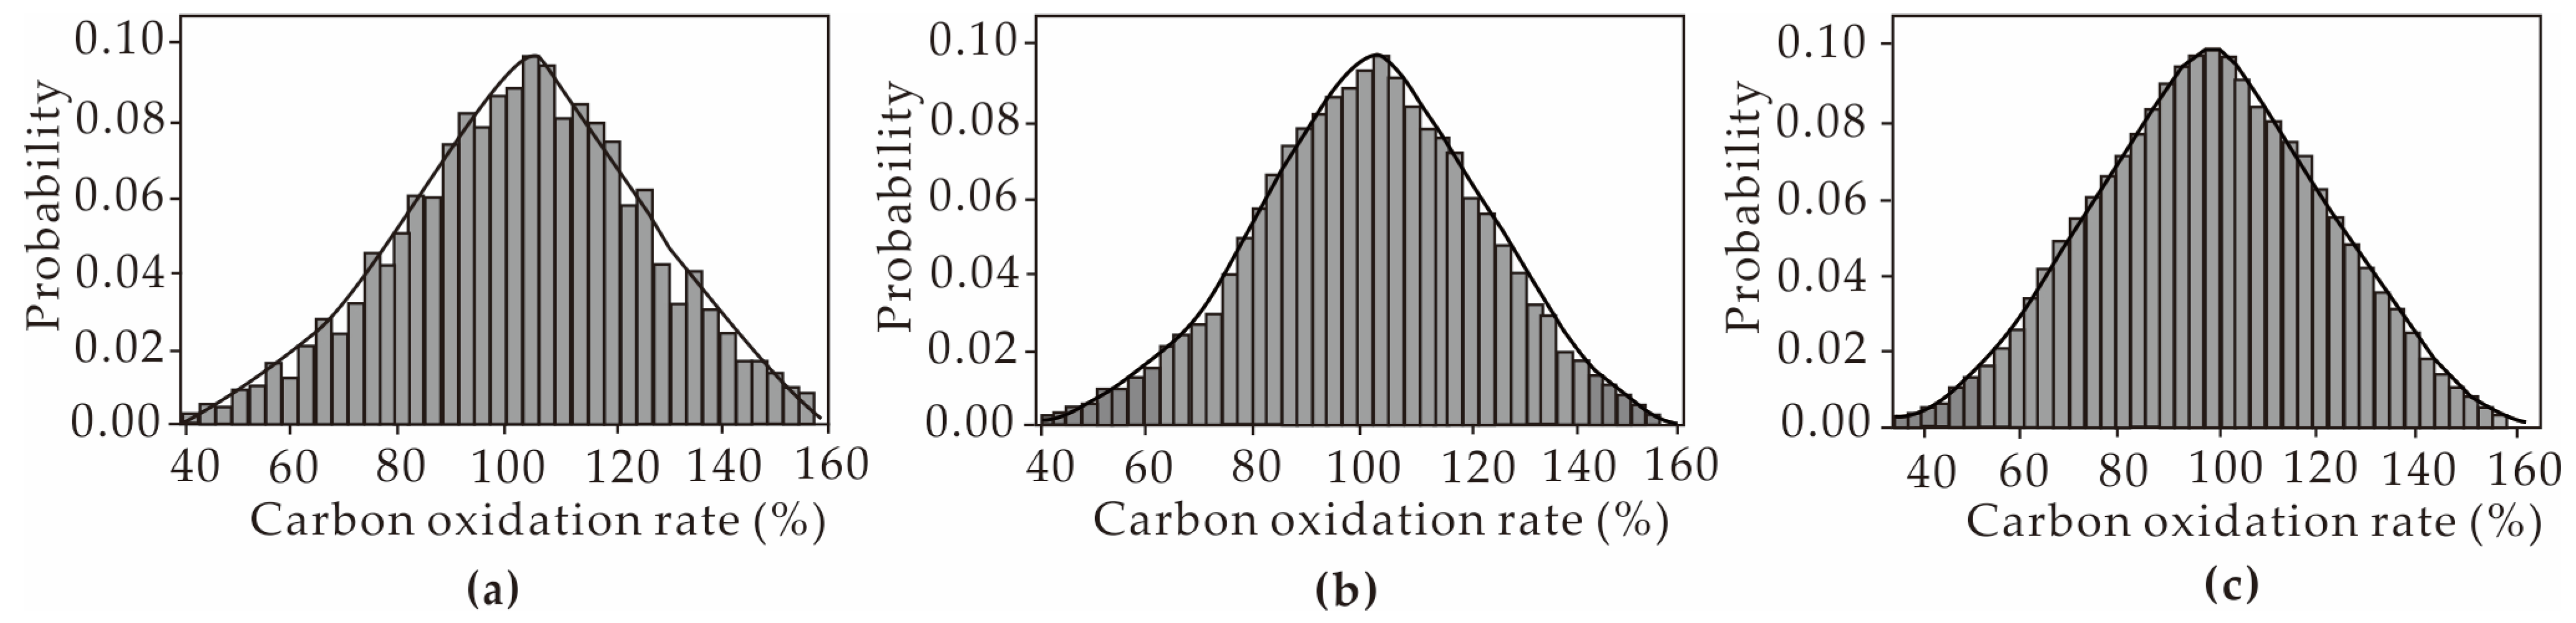
2.1.3. Testing the Effectiveness of the Improved Monte Carlo Simulation

To test the simulation effect of the improved MCM, we use both the traditional MCM and the improved MCM (namely, LHS) to simulate the measured carbon oxidation rate, and obtain their probability density relationship. As shown in Figure 3, when the traditional MCM performs 2000 simulations, a large amount of uncertain information will be lost; only when the sampling simulation reaches more than 3000 times, it basically can approach the real curve. However, using the improved MCM to simulate the measured carbon oxidation rate 1000 times can fully reflect its probability distribution characteristics and approach the real curve. This indicates that using improved MCM is significantly superior to traditional MCM, meaning that it is feasible to evaluate the uncertainty of carbon emission accounting using the improved MCM.

2.2. Data Sources

Due to the fact that the energy balance sheet in the “China Energy Statistical Yearbook” takes into account the energy consumption during energy processing and conversion, and also avoids duplicate calculations for thermal power generation and heating, the energy consumption data used to estimate departmental carbon emissions in this study adopt the Hunan energy balance sheet from the “China Energy Statistical Yearbook” from 2017 to 2021. The EF values used for carbon emission estimation mainly come from published literature, IPCC [34,43,44,45,46], and measured values. Among them, the measured EF values were obtained based on the GB/T213-2008 and CB/T476-2008 standards by measuring the low calorific value, carbon content per unit calorific value, and carbon oxidation rate of fossil fuels [47,48]. According to Wei’s method [49], the calculation formula for EF of fossil fuels is as follows:
E F = H V × C C × O R × 10 6
In the above equation, HV is the average low calorific value of energy (kJ/kg), CC is the carbon content per unit calorific value of energy (measured in C and expressed in t/TJ), OR is the energy carbon oxidation rate (%), and 10−6 represents the conversion factor between grams and tons.
After cleaning the data (such as removing duplicate data or supplementing missing data), referring to the results of Kennedy et al. [50] (i.e., using normal distribution and mean to describe the probability distribution of EFs’ uncertainty), the probability distribution of carbon EFs used in this study is listed in Table 1.

3. Results and Analysis

3.1. Comparison of Provincial Carbon Emissions Calculated by Different EFs

Table 2 shows that, with unchanged AD and estimation methods, there were significant differences in the carbon emissions estimated using different EF values in Hunan Province. Between 2016 and 2020, the carbon emissions calculated using the literature and IPCC default EF values were higher than those calculated using measured EF values (i.e., baseline carbon emissions). Among them, the carbon emissions calculated based on literature EF values were 6.71% to 14.91% higher than the baseline carbon emissions, and the carbon emissions estimated using default values exceeded the baseline emissions by 6.03% to 14.27%. This means that using literature EF and default values will overestimate the provincial carbon emissions. From the composition of carbon emissions, during the study period, industrial carbon emissions accounted for the highest proportion of total carbon emissions in Hunan Province, while residential carbon emissions accounted for the lowest proportion (Table 2). Therefore, industrial carbon emission accounting has a greater impact on the provincial carbon inventory, while residential carbon emissions contribute less to the carbon inventory. Taking 2017 as an example, the carbon emission calculated based on default values for industrial production was 167.31 million tons, while the one calculated using measured EF values was 143.60 million tons. The absolute difference between the two accounted for 95.29% of the total carbon emission difference for that year. However, the difference in residential carbon emissions calculated based on default and measured EF values only accounted for 4.52% of the total difference in carbon emissions during the same period, indicating that the impact of residential carbon emissions calculated with different EF values on the estimation of total carbon emissions in the province is relatively small.
There are three main reasons for the differences in provincial carbon emission inventories. The first is the energy AD used for compiling the inventory, the second is the calculation methods of the inventory data, and the third is the EF values. Comparing the sources of energy AD, calculation methods, and EF values, the method for calculating provincial carbon emissions and the source of energy consumption data in this study are completely consistent. Therefore, the selection of EF values is the main reason for the differences in the estimation results of carbon emissions in Hunan Province. According to Table 1, the measured EF values of raw coal, washed coal, and coke were much lower than the EF values from the literature and IPCC, while the measured EF values of gasoline, kerosene, diesel, and fuel oil were much higher than the EF values from the literature and IPCC. In addition, the main energy consumed by each sector was different (Figure 1), resulting in carbon emissions calculated based on the literature and IPCC default values for industrial production, thermal power generation, and residential life being much higher than the carbon emissions estimated using measured EF values. However, the estimating carbon emissions from transportation using different EF values are exactly the opposite to those of other sectors (Table 2). The main reason for the above differences is related to the different sources of EF values. In Table 1, the literature EF values were mainly derived from domestic research institutions or provincial inventory guidelines. Due to the varying quality of the same fossil energy consumed by different provinces, the corresponding HV, CC, and OR of the same energy may also differ, resulting in significant differences in EF values and ultimately affecting the results of provincial carbon emission accounting. According to reports, fluctuations in CC and OR can cause a change of approximately 5% in estimated carbon emissions [43]. The default values were derived from the IPCC-recommended guidelines for national greenhouse gas inventories. Because of the fact that the data in the IPCC guidelines mainly come from developed countries, their energy quality and energy measurement systems are significantly different from those in China, resulting in significant differences between the default values given and the EF values of China’s energy. For example, the calorific value range of natural gas given by IPCC is 46.5 TJ/Gg to 50.4 TJ/Gg, with the maximum value being 1.08 times the minimum value. However, in the application, IPCC did not use the maximum value as the default value, but chose the median as the default value. By multiplying it with carbon content and carbon oxidation rate, the default value of natural gas is 0.4483, while the EF value of natural gas in the relevant domestic literature is 0.6082 (Table 1).

3.2. Uncertainty Analysis of Carbon Emission Accounting

After conducting 1000 LHS simulations using an improved MCM, a series of carbon emissions and their probability distributions were obtained for various departments in Hunan Province. Then, the uncertainty of provincial carbon emission accounting was evaluated based on the aforementioned uncertainty analysis method. Table 3 shows that there are significant differences in carbon emission uncertainty simulated with different EF values. Taking 2017 as an example, with a 95% confidence interval, the carbon emissions in Hunan Province simulated using measured EF values ranged from 2.17 × 10⁸ t to 2.48 × 10⁸ t, with an uncertainty of −5.31% to 8.17%; the provincial carbon emissions simulated using literature EF values and default values were 2.25 × 10⁸ t–2.64 × 10⁸ t and 2.24 × 10⁸ t–2.64 × 10⁸ t, respectively, with corresponding uncertainties of −6.88–9.03% and −5.77–9.94%. In terms of departments, whether using literature EF values, default values, or measured EF values, the uncertainty of carbon emission accounting, in descending order, was industrial production, thermal power generation, residential life, and transportation (Table 3). At a 95% confidence interval, the uncertainties of industrial carbon emissions estimated based on literature EF values, default values, and measured EF values were −7.51–9.85%, −8.51–11.04%, and −7.38–8.71%, respectively. This indicates that the uncertainty of industrial carbon emission accounting is the main contributor to the total uncertainty of carbon emissions in Hunan Province, while the impact of transportation carbon emissions on provincial carbon emission uncertainty is relatively small. The main reason may be that the proportion of carbon emissions from industrial production in the total provincial carbon emissions is much higher than that of other sectors (Table 2). In addition, industrial production consumes more types of energy, and the boundaries of carbon emission accounting are different from other sectors (Figure 1). Therefore, the uncertainty of industrial carbon emission accounting has a significant impact on the uncertainty of provincial carbon emissions.
Considering the various values of EF, when compared with the results obtained using literature EF and default values, the uncertainty in carbon emissions of each sector based on measured EF values has decreased by varying degrees (Table 3). In the context of transportation, the uncertainties in carbon emissions simulated using literature-based EF values and default values ranged from −5.92% to 7.44% and −5.39% to 6.65%, respectively. In contrast, when measured EF values were employed for simulation, the uncertainties in carbon emissions narrowed down to −4.12% to 4.08%, representing a decrease of 1.80% to 3.36% and 1.27% to 2.57% compared with the former two scenarios, respectively. Regarding carbon emissions from residents’ daily lives, the uncertainty obtained by using measured EF values was reduced by a range of 1.52% to 2.11% and 1.60% to 2.17%, respectively, compared with that derived from literature EF values and default values. This suggests that utilizing measured EF values to estimate carbon emissions can diminish the uncertainty associated with provincial carbon inventories.

4. Discussions

At present, the consensus is that the differences in carbon emission data within the same region are mainly due to differences in accounting boundaries. These accounting boundaries cover multiple aspects, but when it comes to carbon emissions related to fossil fuels, the differences between carbon emission data are mainly reflected in three aspects: accounting methods, sources of AD, and EF values [4]. The results of this study indicate that the provincial carbon emissions calculated using default values and literature EF values were significantly higher than those estimated using measured EF values. This was similar to the results obtained by Li et al. [37] based on a comparative analysis of typical carbon databases at home and abroad. They found that China’s carbon emissions estimated by international institutions using IPCC default values were significantly higher, while the carbon emissions estimated by China’s CEADs (Carbon Emission Accounts and Datasets) using the sector method based on measured EF values were closer to China’s actual situation. The reason behind this is that, although differences in energy AD play an important role in carbon emission accounting and have a significant impact on carbon emission data, the provincial carbon emission accounting in this study is based on keeping the source of activity level data and accounting methods unchanged. Therefore, the different EF values in this study undoubtedly directly determine the differences in carbon emission estimation, which means that a correct understanding and analysis of the differences in carbon emission factors is very important for accurately evaluating carbon emission data.
In terms of the uncertainty of carbon emission estimation, the uncertainty of provincial carbon emission accounting, as derived in this study, differs from that of the Yangtze River Delta region obtained by Li et al. [10] through the traditional MCM to quantify the difference in EF values. Specifically, the uncertainty range for carbon emission accounting in the Yangtze River Delta spanned from −33.50% to 35.11% within a 95% confidence interval, which was significantly larger than the scope of this study. In our study, the carbon emission uncertainties calculated based on different EF values in Hunan Province in 2017 were −5.31% to 8.17% (measured EF values), −6.88% to 9.03% (literature EF values), and −5.77% to 9.94% (default EF values). The reasons for the uncertainty differences in carbon inventories can be attributed to three main aspects. First is the spatial scale of the study area. The area studied in this research is smaller than the Yangtze River Delta region, and larger spatial scales often result in greater uncertainty in the carbon emission accounting [51]. Second, there are differences in the methods adopted and EF values used in uncertainty analysis. This study employed an improved MCM to simulate the uncertainty in carbon emission accounting in Hunan Province, overcoming the problem of uneven sample distribution caused by traditional Monte Carlo random sampling. Coupled with the use of actual EF values, this approach makes it possible for the simulated carbon emissions to be closer to the actual values, thereby reducing the uncertainty in carbon emission accounting. Although the default values and literature EF values used by previous researchers have undergone extensive academic verification, the default values are mainly obtained from developed countries based on limited experimental data, and their energy quality, carbon content, and calculation system are significantly different from those in China. Even for the same energy source, there are often significant spatial differences in EF values. Therefore, directly using the IPCC default values in the National Greenhouse Gas Inventory Guidelines will bring significant uncertainty to carbon emission estimation. As for the literature EF values, they are primarily derived from provincial greenhouse gas inventory guidelines. However, the energy quality consumed varies across different provinces, leading to differences in the carbon content and oxidation rates of the corresponding energy sources. Consequently, using EF values from related literature to calculate provincial carbon emissions introduces significant uncertainty. Third, different methods for calculating carbon emissions and sources of AD can lead to significant differences in the uncertainty of carbon emissions [52]. In this study, the methods for estimating carbon emissions and the sources of activity levels remain unchanged, so differences in EF values are the main source of uncertainty in carbon emission calculation, while the impacts of energy activities and calculation methods on carbon emission uncertainty can be ignored.
In summary, for the research on provincial carbon emission estimation, due to the differences in inventory compilation institutions and reference guidelines, as well as the division of carbon emission departments and the lack of localized carbon emission factors, there is inevitably significant uncertainty in provincial carbon emissions.

5. Conclusions and Future Research Directions

This paper evaluated carbon emissions in Hunan Province from 2016 to 2020 by integrating sector-specific energy activity data from four major sectors—industrial production, thermal power generation, transportation, and residential life—and employing EFs from three distinct sources: direct measurements, IPCC default values, and estimates from the academic literature. To assess the reliability of the resulting carbon inventories, an improved MCM was applied to quantify uncertainty under each EF scenario.
The analysis revealed consistent overestimation of the provincial carbon emissions when literature-based and IPCC default values were used, compared with estimates generated from empirically measured EFs. These discrepancies were primarily attributed to the variations in EF values associated with industrial production and thermal power generation—the two sectors most sensitive to EF choice. Moreover, substantial differences were observed in the uncertainty ranges associated with the three EF sources. Taking 2017 as a reference point, the uncertainty range for carbon emission estimates based on literature EFs was −6.88–9.03%, while that based on IPCC default values was−5.77–9.94%. In contrast, the carbon emissions estimated using measured EFs exhibited a narrower uncertainty range of −5.31% to 8.17%. Sectoral analysis further showed that the uncertainty in industrial carbon emissions was the principal driver of the overall uncertainty in the provincial carbon inventory, whereas the transportation sector contributed relatively little. Notably, across all departments, the use of measured EF values consistently led to reduced uncertainty, emphasizing the value of empirical EF data for enhancing the precision and credibility of carbon accounting.
The above findings have direct implications for sustainability-oriented policy and governance. Accurate, transparent, and low-uncertainty carbon inventories form the empirical foundation for evidence-based climate policy, emission mitigation planning, and progress toward China’s dual carbon goals and broader Sustainable Development Goals (SDGs). In this context, improving carbon accounting accuracy is not merely a technical endeavor but a critical component of sustainable development and environmental accountability. To build on the insights from this study, future research should focus on three interrelated areas that can help support more sustainable and resilient carbon accounting systems at the provincial level.
First, the development of a standardized national carbon accounting framework is essential. Although significant progress has been made in China’s carbon accounting efforts, challenges such as ambiguous system boundaries, incomplete carbon inventory datasets, and lack of methodological consistency remain. Therefore, a unified, sector-sensitive accounting standard system tailored to China’s industrial and regional diversity would enhance data comparability, promote methodological coherence, and strengthen alignment with international climate reporting norms.
Second, priority should be given to constructing a localized emission factor database grounded in direct empirical measurement. This requires improving the quality and granularity of energy activity statistics, refining the classification of energy-consuming sectors, and systematically collecting EF data across diverse contexts. A scientifically robust and regionally tailored EF database would reduce dependence on generalized or external values and significantly increase the reliability and policy relevance of carbon emission estimates.
Third, further attention should be paid to carbon accounting in industrial processes, which continue to represent the largest source of uncertainty. Advanced technologies such as satellite remote sensing, digital monitoring platforms, and carbon footprint tracking tools should be leveraged to improve the monitoring and estimation of carbon emission from a complex industrial system. Enhancing real-time emission tracking in this sector would provide high-resolution data, enabling more targeted emission reduction strategies and supporting sustainability-oriented planning at both the local and national levels.
Taken together, these recommendations underscore the importance of empirically rigorous, regionally specific, and technologically integrated carbon accounting systems in supporting effective climate governance. Strengthening the scientific basis of carbon inventories will not only reduce uncertainty but also reinforce China’s capacity to meet its climate targets and contribute meaningfully to global sustainability efforts. By enhancing the accuracy, consistency, and transparency of subnational carbon accounting, this study offers a practical pathway for aligning data-driven climate action with broader goals of sustainable development.

Author Contributions

Conceptualization, X.L., J.L., and C.D.; methodology, J.L.; software, X.L.; validation, X.L. and J.L.; formal analysis, X.L. and C.D.; investigation, J.L.; data curation, J.L. and C.D.; writing—original draft preparation, X.L.; writing—review and editing, J.L. and C.D.; funding acquisition, X.L.; investigation, J.L. and C.D.; resources, C.D.; visualization, C.D. All authors have read and agreed to the published version of the manuscript.

Funding

This research was funded by Hunan Provincial Social Science Fund Project (No. 23YBA141).

Institutional Review Board Statement

Not applicable.

Informed Consent Statement

Not applicable.

Data Availability Statement

No new data were created or analyzed in this study. Data sharing is not applicable to this article.

Conflicts of Interest

The authors declare no conflicts of interest.

References

  1. Zhu, L.; Zhu, D.; Steve, D.; Ciais, P. Monitoring global carbon emissions in 2022. Nat. Rev. Earth Environ. 2023, 4, 205–206. [Google Scholar] [CrossRef]
  2. Steininger, W.K.; Lininger, C.; Meyer, H.L.; Muñoz, P.; Schinko, T. Multiple carbon accounting to support just and effective climate policies. Nat. Clim. Change 2016, 6, 35–41. [Google Scholar] [CrossRef]
  3. Keith, H.; Vardon, M.; Obst, C.; Young, V.; Houghton, R.A.; Mackey, B. Evaluating nature-based solutions for climate mitigation and conservation requires comprehensive carbon accounting. Sci. Total Environ. 2021, 769, 144341. [Google Scholar] [CrossRef] [PubMed]
  4. Liang, J.Y.; Wang, S.J.; Liao, Y.T.; Feng, K.S. Carbon emissions embodied in investment: Assessing emissions reduction responsibility through multi-regional input-output analysis. Appl. Energy 2024, 358, 122558. [Google Scholar] [CrossRef]
  5. Wisdom, O.; Apollos, N.; Samuel, O. Carbon accounting and economic development in sub–Saharan Africa. Asian J. Econ. Bus. Account. 2022, 6, 81–89. [Google Scholar] [CrossRef]
  6. ISO 14064–3:2006; Greenhouse Gases—Part 3: Specification with Guidance for the Validation and Verification of Greenhouse Gas Assertions. International Organization for Standardization: Geneva, Switzerland, 2006.
  7. ISO 14067:2018; Greenhouse Gases—Carbon Footprint of Products–Requirements and Guidelines for Quantification. International Organization for Standardization: Geneva, Switzerland, 2018.
  8. Li, J.F.; Guo, J.F.; Gao, S.J.; Gu, A.L. The current situation, problems and challenges of national carbon emission accounting work. Dev. Res. 2020, 37, 9–14. [Google Scholar] [CrossRef]
  9. Liu, Z.; Guan, D.; Wei, W.; Davis, S.J.; Ciais, P.; Bai, J.; Peng, S.; Zhang, Q.; Hubacek, K.; Marland, G.; et al. Reduced carbon emission estimates from fossil fuel combustion and cement production in China. Nature 2015, 524, 335–338. [Google Scholar] [CrossRef]
  10. Li, S.H.; Cao, S.S.; Yang, Y.; Cheng, D.Y.; Fan, L.P.; Liu, M. Accounting and uncertainty analysis of black carbon emissions in the Yangtze River Delta from 2000 to 2019. J. Earth Environ. 2023, 14, 86–97, 109. [Google Scholar] [CrossRef]
  11. Li, Y.N. Statistical categories, measurement methods, and indicator selection for Carbon Accounting. Financ. J. 2021, 11, 29–34. [Google Scholar]
  12. Liu, Z. Near-real-time methodology for assessing global carbon emissions. Chin. Sci. Bull. 2023, 68, 830–840. [Google Scholar] [CrossRef]
  13. Guo, J.J.; Liao, Q.H.; Bai, K.M.; Ming, W.; Feng, J.S. A brief analysis of the carbon accounting data model and the construction of carbon accounting standardization system. Stand. Sci. 2024, 11, 92–100. [Google Scholar] [CrossRef]
  14. Cai, B.F. Research on greenhouse gas emissions inventory in the cities of China. China Popul. Resour. Environ. 2012, 22, 21–27. [Google Scholar] [CrossRef]
  15. Ren, X.G. Accelerate the establishment of a unified and standardized carbon emission statistical accounting system, and steadily consolidate the data foundation for carbon peak and carbon neutrality—Interpretation 1 of “implementation plan for accelerating the establishment of a unified and standardized carbon emission statistical accounting system”. Ind. China 2022, 16, 16–19. [Google Scholar]
  16. Li, J.; Zhou, J.; Li, Q.Y.; Li, S.Z.; Ming, Z.J.; Yu, X.T. Evolution and application analysis of carbon accounting methods in urban ecosystem. J. Environ. Eng. Technol. 2025, 15, 474–485. [Google Scholar] [CrossRef]
  17. Wu, X.W.; Zhu, F.H.; Yang, J.T.; Zhou, D.B.; Yan, L.; Teng, N.; Yi, Y.P. Measurements of emission factors of greenhouse gas (CO2, N2O) from thermal power plants in China. Res. Environ. Sci. 2010, 23, 170–176. [Google Scholar] [CrossRef]
  18. Gao, J.L.; Xu, X.Y.; Zheng, F.Q.; Huo, R. Calculation and uncertainty analysis of coal carbon emissions inventory based on the whole life cycle. China Coal 2017, 43, 22–26. [Google Scholar] [CrossRef]
  19. Guo, Z.; Wang, X.L.; Ren, J.; Tu, G.P.; Zheng, X.M.; Deng, C.Y. Simulation and uncertainty assessment of continuous online monitoring process of carbon dioxide emissions. J. Metrol. 2022, 43, 120–126. [Google Scholar] [CrossRef]
  20. Evans, M.; Kholod, N.; Kuklinski, T.; Denysenko, A.; Smith, S.J.; Staniszewski, A.; Hao, W.M.; Liu, L.; Bond, T.C. Black carbon emissions in Russia: A critical review. Atmos. Environ. 2017, 163, 9–21. [Google Scholar] [CrossRef]
  21. Nie, S.; Zhou, J.; Xu, M.F.; Li, H. Research progress of low-carbon binders. Mater. Rep. 2024, 38, 22050304–22050309. [Google Scholar] [CrossRef]
  22. Leao, B.D.; do Nascimento, L.F.M.; de Andrade, J.C.S.; de Oliveira, J.A.P. Carbon accounting approaches and reporting gaps in urban emissions: An analysis of the greenhouse gas inventories and climate action plans in Brazilian cities. J. Clean. Prod. 2020, 245, 118930. [Google Scholar] [CrossRef]
  23. Leng, H.; Zhao, Y.R.; Yuan, Q. Research on the application path of carbon accounting method in spatial planning under the goal of “Carbon Emissions Peak and Carbon Neutrality”. Urban Plan. Int. 2023, 7, 9–16. [Google Scholar] [CrossRef]
  24. Izumi, Y.; Lizuka, A.; Ho, H.-J. Calculation of greenhouse gas emissions for a carbon recycling system using mineral carbon capture and utilization technology in the cement industry. J. Clean. Prod. 2021, 312, 127618. [Google Scholar] [CrossRef]
  25. Hickmann, T. Voluntary global business initiatives and the international climate negotiations: A case study of the Greenhouse Gas Protocol. J. Clean. Prod. 2017, 169, 94–104. [Google Scholar] [CrossRef]
  26. Li, Y.; Jin, X.Y.; Wang, G.L.; Ren, Y.Q.; Tan, H.Q.; Li, N. Construction and application of a carbon emission model for China’s coal production enterprises and result analysis. Front. Energy Res. 2022, 10, 889877. [Google Scholar] [CrossRef]
  27. Daskalakis, G.; Psychoyios, D.; Markellos, R.N. Modeling CO2 emission allowance prices and derivatives: Evidence from the European trading scheme. J. Bank. Financ. 2009, 7, 1230–1241. [Google Scholar] [CrossRef]
  28. Zhang, H.X.; Sun, W.Q.; Li, W.D.; Ma, G.Y. A carbon flow tracing and carbon accounting method for exploring CO2 emissions of the iron and steel industry: An integrated material-energy-carbon hub. Appl. Energy 2022, 309, 118485. [Google Scholar] [CrossRef]
  29. Xu, D.; Liu, G.Y.; Meng, F.X.; Yan, N.Y.; Li, H.; Agostinho, F.; Almeida, C.M.V.B.; Giannetti, B.F. Sector aggregation effect on embodied carbon emission based on city-centric global multiregion input-output (CCG-MRIO) model. Ecol. Model. 2023, 484, 110487. [Google Scholar] [CrossRef]
  30. Zhao, Z.; Liu, C.; Xie, H.; Li, Y.; Zhu, C.; Liu, M.J. Carbon accounting and carbon emission reduction potential analysis of sponge cities based on life cycle assessment. Water 2023, 15, 3565. [Google Scholar] [CrossRef]
  31. Wu, Y.N.; Li, D.; Zhao, F.; Tang, W.; Meng, C. Research on greenhouse gas emissions accounting methods in environmental impact assessment of construction projects: A case of thermal power project. J. Environ. Eng. Technol. 2022, 12, 1890–1897. [Google Scholar] [CrossRef]
  32. Chen, P.; Wang, H.; Guo, M.; Wang, J.J.; Cai, S.N.; Li, M.; Sun, K.N.; Wang, Y.K. Decomposition analysis of regional embodied carbon flow and driving factors: Taking Shanghai as an example. Sustainability 2022, 14, 11109. [Google Scholar] [CrossRef]
  33. Jiang, Z.; Zhang, L.; Wang, H.F.; Zhao, J.S.; Zhao, B.H.; Wang, C. Uncertainty assessment of industry plant accounting carbon emissions. J. Metrol. 2022, 43, 420–428. [Google Scholar] [CrossRef]
  34. Wang, X.H.; Chen, B.Z.; Zhang, H.F. Analysis of the provincial carbon list uncertainty. J. Arid. Land Resour. Environ. 2015, 29, 7–11. [Google Scholar] [CrossRef]
  35. Sheikholeslami, R.; Razavi, S. Progressive Latin hypercube sampling: An efficient approach for robust sampling-based analysis of environmental models. Environ. Model. Softw. 2017, 93, 109–126. [Google Scholar] [CrossRef]
  36. Zhang, W.J.; Shang, Z.Y.; Zhang, J.; Yan, S.J.; Deng, A.X.; Zhang, X.; Zheng, C.Y.; Song, Z.W. Standardization construction of statistical accounting system for agricultural greenhouse gas emission. Sci. Agric. Sin. 2023, 56, 4467–4477. [Google Scholar] [CrossRef]
  37. Li, Q.Q.; Su, Y.; Shang, L.; Wei, W.; Wang, M.H. Comparison analysis of China’s emissions accounting by typical international carbon databases. Clim. Change Res. 2018, 14, 275–280. [Google Scholar] [CrossRef]
  38. Cao, Z.; Shen, L.; Zhao, J.; Liu, L.; Zhong, S.; Sun, Y.; Yang, Y. Toward abetter practice for estimating the CO2 emission factors of cement production: An experience from China. J. Clean. Prod. 2016, 139, 527–539. [Google Scholar] [CrossRef]
  39. Yang, S.S. Accounting of total carbon emissions and analysis of carbon source structure in Hunan Province. Coop. Econ. Technol. 2022, 5, 4–6. [Google Scholar] [CrossRef]
  40. Li, N.; Liu, W.W.; Zhu, S.H.; Xing, X.W.; Tang, K.Q.; Wang, S.W.; Bai, L. Coordinated control of carbon emission reduction and air quality improvement in the industrial sector in Hunan province. Environ. Sci. 2024, 45, 1274–1283. [Google Scholar] [CrossRef]
  41. Ma, X.L.; Wang, Y.X.; Sun, J.W.; Li, J.X.; Cao, S.Y. Research on the uncertainty of carbon emission inventories in the application of natural gas stations. Energy Conserv. Meas. Pet. Petrochem. Ind. 2024, 14, 120–125. [Google Scholar] [CrossRef]
  42. Al Luhayb, A.S. The bootstrap method for Monte Carlo integration inference. J. King Saud Univ. Sci. 2023, 35, 102768. [Google Scholar] [CrossRef]
  43. Sun, Z.Q.; Wang, G.J.; Chen, Y.N. Analysis on the uncertainty of carbon emission accounting based on energy balance sheet. Ecol. Econ. 2015, 31, 31–38. [Google Scholar]
  44. Zhou, Y.K.; Wu, J.G. Analysis of factors affecting China’s carbon emissions and exploration of carbon neutrality paths. China Land Resour. Econ. 2025, 38, 12–24. [Google Scholar] [CrossRef]
  45. Wang, M.Z.; Gao, G.K. Research on the influencing factors of carbon emissions from terminal energy consumption in six central provinces and their decoupling relationship with economic growth. J. Jiangxi Univ. Sci. Technol. 2023, 44, 55–64. [Google Scholar] [CrossRef]
  46. Intergovernmental Panel on Climate Change. 2006 IPCC Guidelines for National Greenhouse Gas Inventories. 2008. Available online: https://www.ipcc-nggip.iges.or.jp/public/2006gl/index.html (accessed on 18 May 2025).
  47. GB/T 213-2008; Determination of Calorific Value of Coal. Standards Press of China: Beijing, China, 2018.
  48. GB/T 476-2008; Determination of Carbon and Hydrogen in Coal. Standards Press of China: Beijing, China, 2018.
  49. Wei, C. Historical trend and drivers of China’s CO2 emissions from 2000 to 2020. Environ. Dev. Sustain. 2024, 26, 2225–2244. [Google Scholar] [CrossRef] [PubMed]
  50. Kennedy, C.; Steinberger, J.; Gasson, B.; Hansen, Y.; Hillman, T.; Havranek, M.; Pataki, D.; Phdungsilp, A.; Ramaswami, A.; Mendez, G.V. Methodology for inventorying greenhouse gas emissions from global cities. Energy Policy 2010, 38, 4828–4837. [Google Scholar] [CrossRef]
  51. Zhao, Q.; Li, Y.Y.; Liu, S.; Yi, M.J.; Fang, Q.S. Spatiotemporal evolution and influencing factors of CO2 emissions in the Yangtze River Delta region based on MElC data. Res. Environ. Sci. 2024, 37, 1666–1679. [Google Scholar] [CrossRef]
  52. Yang, B.; Qin, G.P.; Wu, Q. Analysis of carbon emission accounting in Chinese provinces under the “Dual Carbon” Target. Environ. Sci. 2022, 43, 5840–5849. [Google Scholar] [CrossRef]
Figure 1. Classification of provincial carbon emission sources and carbon emission accounting.
Sustainability 17 04787 g001
Figure 2. Different sampling simulations: (a) traditional Monte Carlo sampling simulation; (b) Latin hypercube sampling simulation.
Sustainability 17 04787 g002
Figure 3. Probability density distribution of traditional Monte Carlo simulation and improved Monte Carlo simulation: (a) traditional Monte Carlo simulation 2000 times, (b) traditional Monte Carlo simulation 3000 times, and (c) improved Monte Carlo simulation 1000 times.
Sustainability 17 04787 g003
Table 1. Probability distribution of carbon emission factors.
Energy
Name
IPCC Default ValuesMeasured EF ValuesLiterature EF Values
Distribution TypeMeanSDDistribution TypeMeanSDDistribution TypeMeanSD
Raw coalA0.75590.0189A0.51380.0380A0.76020.0285
Cleaned coalB0.75590.0576B0.64250.0496B0.71320.0536
CokeA0.85500.0416A0.77840.0547A0.81710.0482
GasolineA0.55380.0679A0.78010.0525A0.61610.0602
KeroseneB0.57140.0372B0.82730.0304B0.60870.0338
Diesel oilB0.59210.0236B0.84430.0421B0.60610.0329
Fuel oilA0.61850.0607A0.85110.0496A0.69890.0552
BriquetteB0.67840.0386B0.65260.0564B0.69680.0475
Natural gasB0.44830.0742B0.49050.0465B0.60820.0604
Note: A represents lognormal distribution, B represents normal distribution, and SD is standard deviation. The unit of emission factor for all energy sources is kg C/kg, except for natural gas, which is measured in kg C/m3.
Table 2. Carbon emissions in Hunan Province calculated based on different EF values.
YearSource
of EF
Carbon Emissions (104 tons)RD(%)
Industrial ProductionThermal PowerTransportationResident LifeTotal
2016Measured EF12,925.843653.493234.39913.8820,727.60
Literature EF15,695.624396.412400.591326.4723,819.0814.91
Default values15,754.494364.882281.221284.7823,685.3714.27
2017Measured EF14,359.633864.333333.20779.1022,336.25
Literature EF16,666.194704.092477.731120.9724,968.9811.79
Default values16,731.484670.222351.241072.3624,825.3011.14
2018Measured EF12,517.604583.173452.66757.6721,311.10
Literature EF13,983.095769.822582.921086.2423,422.069.91
Default values14,066.085730.212437.491033.7823,267.569.18
2019Measured EF12,089.034471.913574.69660.5420,796.18
Literature EF13,382.865613.922673.68940.8122,611.278.73
Default values13,448.375576.332523.59886.8922,435.187.88
2020Measured EF11,627.133990.883483.73624.0619,726.06
Literature EF12,638.674902.282605.94902.4221,049.326.71
Default values12,717.404868.742459.61869.4720,915.226.03
Note: RD in the table represents the relative difference, which refers to the percentage difference between the carbon emissions calculated based on literature and IPCC default values and the carbon emissions calculated based on measured EF values.
Table 3. The uncertainty of carbon emission estimation in Hunan Province in 2017.
Emission DepartmentMeasured EF ValueLiterature EF ValueDefault EF Value
Mean (104 t)2.5% Tantile (104 t)97.5% Tantile (104 t)Uncertainty Range (%)Mean (104 t)2.5% Tantile (104 t)97.5% Tantile (104 t)Uncertainty Range (%)Mean (104 t)2.5% Tantile (104 t)97.5% Tantile (104 t)Uncertainty Range (%)
Industrial Production17,109.5315,846.5918,599.80−7.38–8.7121,367.6819,762.8423,471.70−7.51–9.8521,274.1519,462.8423,623.52−8.51–11.04
Thermal Power2696.782512.322916.30−6.84–8.143965.543626.724363.46−8.54–10.033896.013547.174312.27−8.95–10.68
Transportation2287.012192.872380.27−4.12–4.082082.641959.282237.52−5.92–7.442079.341967.182217.57−5.39–6.65
Resident Life1005.33954.251067.21−5.08–6.161183.291098.271274.21−7.19–7.681186.301100.241278.39−7.25–7.76
Total Emissions22,958.4221,739.8624,834.54−5.31–8.1724,199.1522,534.4326,384.75−6.88–9.0323,789.2022,416.5126,415.25−5.77–9.94
Disclaimer/Publisher’s Note: The statements, opinions and data contained in all publications are solely those of the individual author(s) and contributor(s) and not of MDPI and/or the editor(s). MDPI and/or the editor(s) disclaim responsibility for any injury to people or property resulting from any ideas, methods, instructions or products referred to in the content.

