
Quality of Life and Energy Efficiency in Europe—A Multi-Criteria Classification of Countries and Analysis of Regional Disproportions


Abstract
1. Introduction
- Are the distinguished classes of EU countries unambiguous in terms of QoL and EE?
- Do EU countries belong to similar classes in terms of QoL and EE?
2. Literature Review
2.1. Energy Efficiency as an Aspect of Sustainability and Quality of Life
2.2. The ELECTRE Tri Method in EE and QoL Assessment
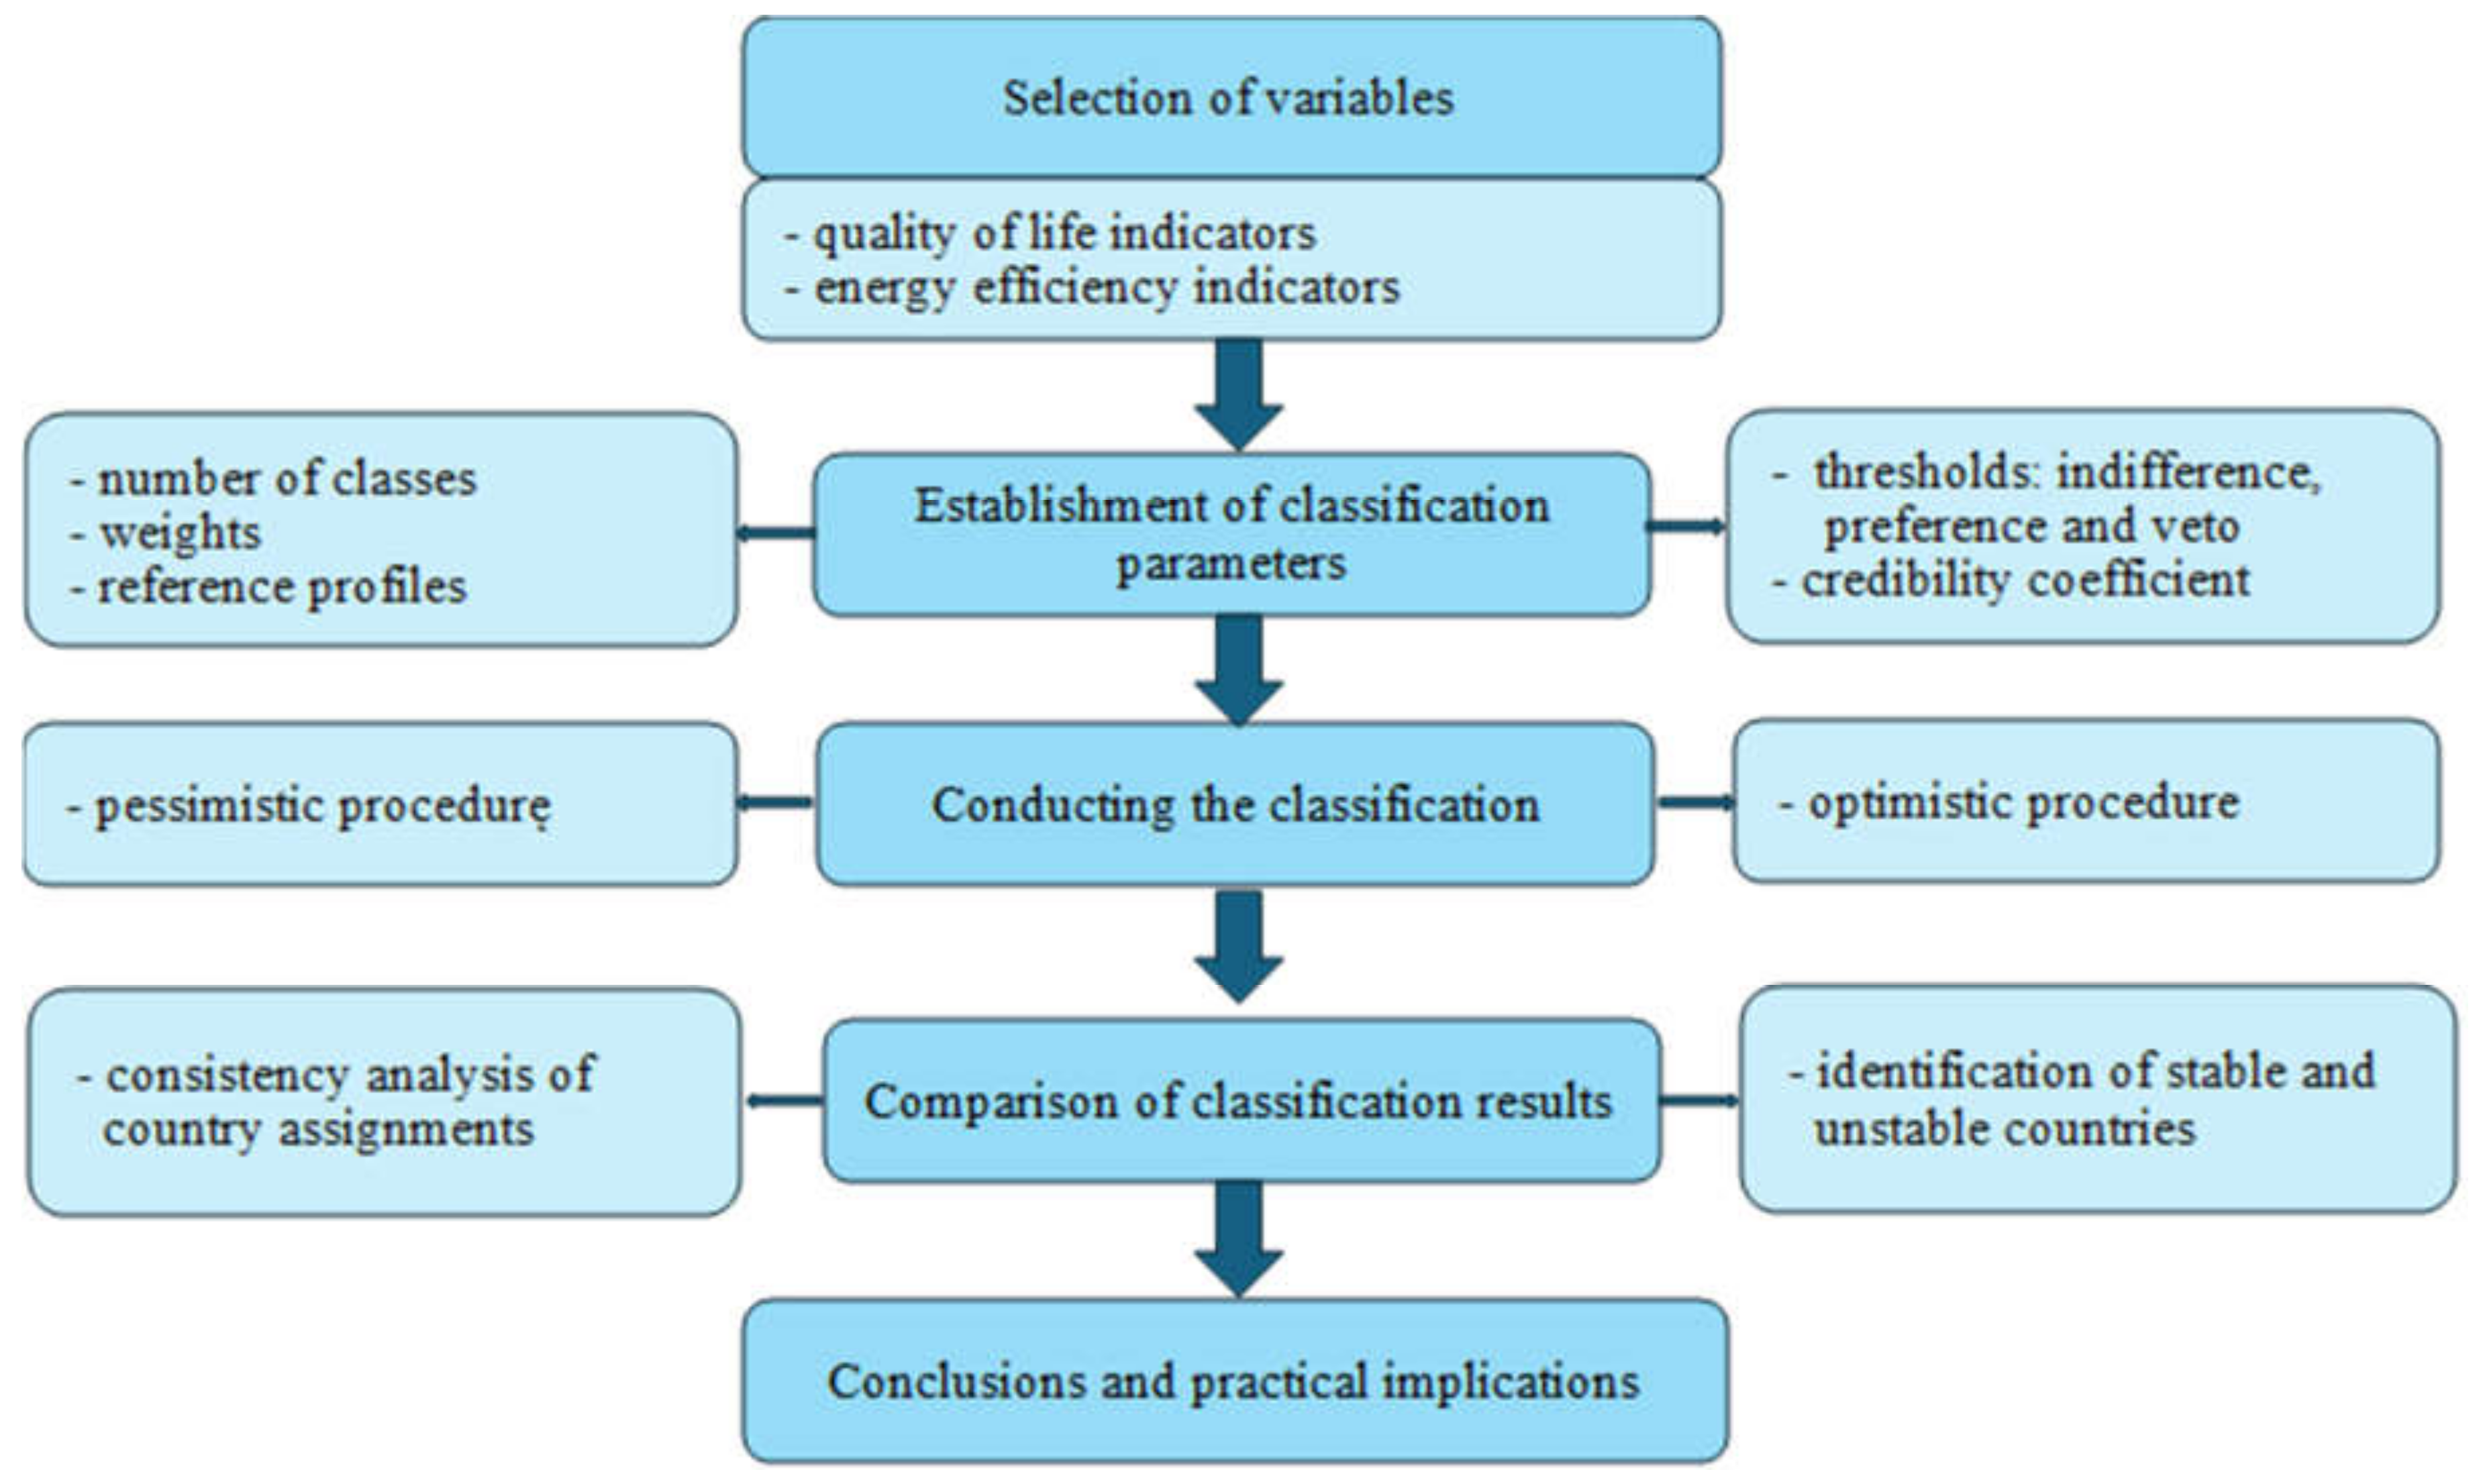
3. Materials and Methods
- (1)
- Indifference threshold qj—the maximum acceptable difference between the evaluation values of the alternative a and profile bh, within which the decision maker considers both as equivalent from the perspective of a given criterion gj; according to the formulation, if
- (2)
- Preference threshold pj defines the minimum difference in evaluations above which the alternative a is clearly preferred over profile bh with respect to criterion gj, when
- (3)
- Veto threshold vj is used to model situations in which even strong support from the majority of the criteria is not sufficient if there is a strong opposition on one of the criteria, when
- (1)
- Concordance for the outranking relation—the concordance test involves examining the strength of the so-called concordant coalition, meaning the set of criteria that support the assertion that a ≥ bh; the majority of the criteria, taking into account their assigned weights, should support this claim.
- (2)
- Absence of strong discordance—the discordance test verifies whether there exists any criterion for which the advantage of profile bh over alternative a is so significant (exceeding the veto threshold) that it can block the outranking relation, regardless of the support from the remaining criteria.
- (1)
- Optimistic procedure (ascending)—begins with the comparison of the alternative with the lowest profile; the alternative is assigned to the first class Ch+1, for which the relation aSbh holds, but the profile does not outrank the alternative;
- (2)
- Pessimistic procedure (descending)—the analysis starts with the highest profile; the alternative is assigned to class Ch if the first encountered profile satisfies the condition [83].
4. Results
4.1. Analysis of the Structure of EU Countries in Terms of QoL and EE Indicators
4.2. Classification Study Results
4.3. Methodological Assumptions of the Classification of EU Countries Using the ELECTRE Tri Method
- Class 1—countries with the weakest results, characterized by an unfavorable situation in the analyzed area.
- Class 2—countries with average results, achieving values within the mid-range for the analyzed indicators.
- Class 3—countries achieving the best results, distinguished by high QoL and a high level of EE.
- Profile 1 (P1)—represented the boundary between Class 1 and Class 2. Its value corresponded to the 33rd percentile level. This means that countries with results not exceeding the specified value were assigned to the weakest group (Class 1). In contrast, the results above this threshold indicated at least an average level of performance, qualifying a given country for Class 2 or 3.
- Profile 2 (P2)—defined the boundary between Class 2 and Class 3 and was set at the 66th percentile level. This means that countries with results above this value were assigned to the group achieving the best outcomes (Class 3).
- Indifference threshold—set at 4.8% of the range for profile P1 and 5.4% for profile P2. The variation in these values resulted from the analysis of data distribution and the characteristics of variables with strong asymmetry.
- Preference threshold—set at 40% of the range in both cases. This value defines a significant difference between objects, sufficient to recognize the superiority of one country over another.
- Veto threshold—not applied. Tests showed that even at a high level (90% of the range), this threshold was overly restrictive, leading to the unjustified assignment of many countries to the lowest class. Omitting this parameter was justified, as the ELECTRE Tri method allows for effective classification even without it, especially since the remaining thresholds were appropriately selected.
- Pessimistic procedure—assigned a country to the lowest class for which it met the thresholds. It was characterized by greater restrictiveness, which reduced the risk of misclassifying countries with uncertain characteristics into higher groups. Assignment to a higher class was more difficult and required meeting stricter criteria.
- Optimistic procedure—assigned a country to the highest class for which it met the thresholds. It focused on the country’s development potential and capabilities, adopting a more liberal approach. It allowed for the classification of countries that partially met the requirements of a higher class, thus highlighting their strengths and positive outlooks.
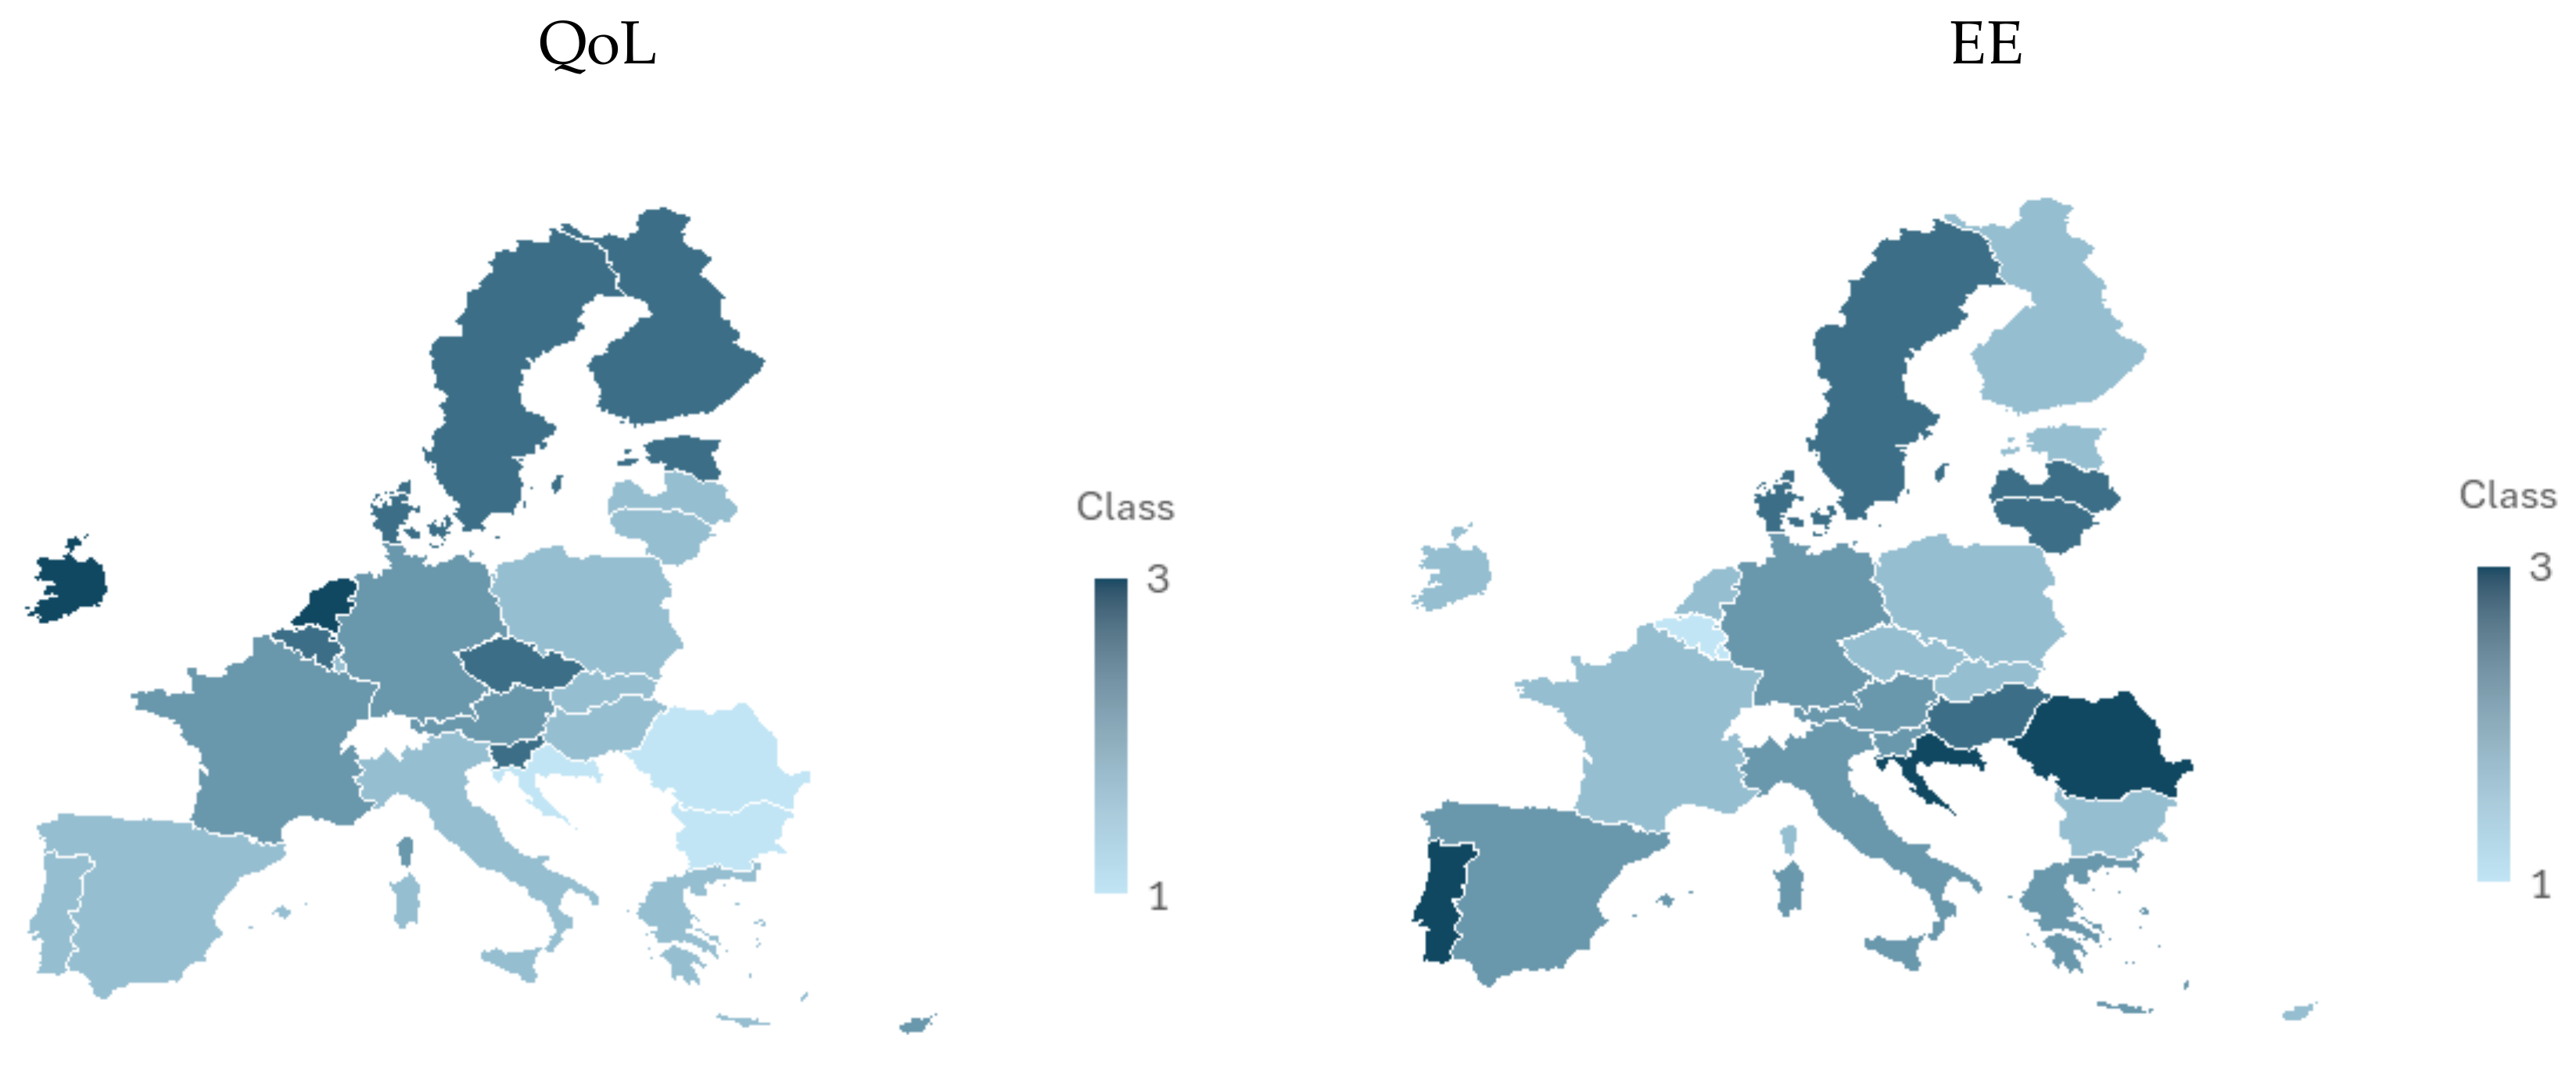
4.4. Classification of EU Countries Based on QoL Indicators
- Class 1 (lowest level) was characterized by significantly lower average values in gain-type variables: GDP per capita, average life expectancy, expected years of schooling, access to safe drinking water, and road density. Additionally, this group showed noticeably higher average values in cost-type variables: the Gini index, infant mortality rate, Air Quality Index based on PM2.5, and exposure to noise.
- Class 2 (average level) was characterized by higher average values compared to the overall mean in terms of GDP per capita, average life expectancy, and access to safe drinking water. It also showed lower average levels for cost-type variables, such as the infant mortality rate, access to safe drinking water, and exposure to noise.
- Class 3 (highest level) stood out with favorable values for all gain-type variables and the lowest indicators for cost-type variables.
- Intermediate classes (1/2 and 2/3) were characterized by intermediate results—closer to the values of Class 1 or Class 3, respectively—which confirms the rationale for their introduction.
- Finland achieved favorable results in terms of the Gini index, expected years of schooling, infant mortality rate, and air quality based on PM2.5. At the same time, the country showed unfavorable values in unemployment rate, length of national roads, and levels of household noise exposure. The combination of strong and weak results in key areas influenced the assignment of Finland to the intermediate class.
- Malta achieved good results in terms of unemployment rate, access to safe drinking water, average life expectancy, and the length of the road network. At the same time, it recorded unfavorable results in the Gini index, infant mortality rate, and noise exposure. This complex performance profile led to its assignment, similarly to Finland, to Class 2/3.
4.5. Classification of EU Countries Based on EE Indicators
- Class 1 (lowest level) was characterized by significantly lower average values in gain-type variables describing energy productivity and the share of renewable energy in final energy consumption. For cost-type variables, markedly higher average values were recorded for final energy consumption, energy intensity of GDP, CO2 emissions, electricity demand, the share of fossil fuels in primary energy consumption, and energy import dependency.
- Class 2 (average level) was characterized by higher average values compared to the overall mean in terms of energy productivity and lower average levels of cost-type variables, particularly those describing final energy consumption per capita, energy intensity of GDP, electricity demand, and the share of fossil fuels in primary energy consumption.
- Class 3 (highest level) stood out with favorable values for most gain-type variables and the lowest indicators for cost-type variables. An exception was the variable concerning the percentage of the population unable to keep their home adequately warm due to poverty status. In this case, the cost-type average was higher than the overall mean.
- Intermediate classes (1/2 and 2/3) were characterized by intermediate results—closer to the values of Class 1 or Class 3, respectively—which confirms the rationale for their introduction.
4.6. Comparison of Classification Results and Analysis of Group Consistency
5. Discussion
- In the classification of countries in terms of QoL, the most numerous group was made up of countries with a moderately poor level of this phenomenon, while the least numerous groups were countries belonging to the two extreme classes, with poor and high QoL.
- In the case of the classification of EU countries in terms of EE, the extreme classes showing weak and good levels of EE were also the least numerous.
- Some countries represent a very similar level, that is, they are consistent in terms of QoL and EE. These countries include Poland and Slovakia, included in the classes with moderately poor levels of both categories; Austria and Germany, assigned to the class with a mediocre level; and Denmark and Sweden, placed in the class with a moderately good position. The consistency of these countries’ positions is indicative of an even level of QoL and EE.
- The identification of QoL in EU countries in the context of EE on the basis of a set of indicators, making it possible to cover EU countries in a comprehensive manner;
- The use of the ELECTRE Tri method, through which one can obtain a classification of objects into predefined categories, taking into account both measurable indicators and the subjective preferences of decision-makers.
6. Conclusions
- Class 1—countries with the weakest results, characterized by an unfavourable situation in the analysed area.
- Class 2—countries with average results, achieving values within the average range for the analysed indicators.
- Class 3—countries achieving the best results, i.e., distinguished by high QoL and high EE.
Author Contributions
Funding
Institutional Review Board Statement
Informed Consent Statement
Data Availability Statement
Conflicts of Interest
References
- United Nations. Our Common Future. 1987: Brundtland Report. Available online: https://www.are.admin.ch/are/en/home/media/publications/sustainable-development/brundtland-report.html (accessed on 10 February 2025).
- Roszko-Wójtowicz, E.; Grzelak, M.M. Wielowymiarowe ujęcie zróżnicowania poziomu QoL w województwach w Polsce. Polityki Eur. Finans. Mark. 2018, 20, 197–214. [Google Scholar] [CrossRef]
- Coppola, G. The Easterlin Paradox: An Interpretation. Available online: https://www.researchgate.net/publication/272226634_The_Easterlin_Paradox_An_Interpretation (accessed on 13 March 2025).
- Zapf, W. Individual Wohlfarth: Living Conditions and Perceived Quality of Life. In Quality of Life in the Federal Republic of Germany. Objective Refreshment Conditions and Subjective Well-Being; Glatzer, W., Zapf, W., Eds.; Campus Verlag: Frankfurt am Main, Germany; New York, NY, USA, 1984. [Google Scholar]
- Stiglitz, J.E.; Sen, A.; Fitoussi, J.P. Report by the Commission on the Measurement of Economic Performance and Social Progress. Available online: https://ec.europa.eu/eurostat/documents/8131721/8131772/Stiglitz-Sen-Fitoussi-Commission-report.pdf (accessed on 13 March 2025).
- World Health Organization. WHOQOL: Measuring Quality of Life. Available online: https://www.who.int/tools/whoqol/whoqol-bref (accessed on 13 March 2025).
- Cai, T.; Verze, P.; Bjerklund Johansen, T.E. The Quality of Life Definition: Where Are We Going? Uro 2021, 1, 14–22. [Google Scholar] [CrossRef]
- Szaja, M.; Ziemba, P. Stochastic Modelling in Multi-Criteria Evaluation of Quality of Life—The Case of the West Pomeranian Voivodeship in Poland. Sustainability 2025, 17, 1966. [Google Scholar] [CrossRef]
- Oleńczuk-Paszel, A.; Sompolska-Rzechuła, A. Housing Conditions and the Quality of Life of the Populations of the European Union Countries. Sustainability 2025, 17, 1550. [Google Scholar] [CrossRef]
- Wnuk, M.; Zielonka, D.; Purandare, B.; Kaniewski, A.; Klimberg, A.; Ulatowska-Szostak, E.; Palicka, E.; Zarzycki, A.; Kaminiarz, E. Przegląd Koncepcji QoL w Naukach Społecznych. Hygeia Public Health 2013, 48, 10–16. [Google Scholar]
- Maggino, F.; Zumbo, B.D. Measuring the Quality of Life and the Construction of Social Indicators. In Handbook of Social Indicators and Quality of Life Research; Land, K., Michalos, A., Sirgy, M., Eds.; Springer: Dordrecht, The Netherlands, 2011. [Google Scholar]
- Upton, D.; Upton, P. Quality of life and well-being. In Psychology of Wounds and Wound Care in Clinical Practice; Springer: Dordrecht, The Netherlands, 2015; pp. 85–111. [Google Scholar]
- Fuchs, D.; Schlipphak, B.; Treib, O.; Long, L.A.N.; Lederer, M. Which Way Forward in Measuring the Quality of Life? A Critical Analysis of Sustainability and Well-Being Indicator Sets. Glob. Environ. Politics 2020, 20, 12–36. [Google Scholar] [CrossRef]
- Arora, N.K.; Mishra, I. Progress of Sustainable Development Goal 7: Clean and Green Energy for All as the Biggest Challenge to Combat Climate Crisis. Environ. Sustain. 2022, 5, 395–399. [Google Scholar] [CrossRef]
- Łukaszczyk, Z.; Burda, K. Transformacja energetyczna przedsiębiorstwa komunalnego—Studium przypadku. Syst. Wspomagania W Inżynierii Produkcji 2024, 13/2, 204–213. [Google Scholar]
- United Nations. The 2030 Agenda for Sustainable Development. 2015. Available online: https://sustainabledevelopment.un.org/content/documents/21252030%20Agenda%20for%20Sustainable%20Development%20web.pdf?_gl=1*1l4ih06*_ga*MzI3NzM0NTE1LjE3NDI4Mzc2NTQ.*_ga_TK9BQL5X7Z*MTc0Mjk4MDQ5NS4yLjAuMTc0Mjk4MDQ5NS4wLjAuMA (accessed on 13 March 2025).
- Dyrektywa Parlamentu Europejskiego i Rady 2012/27/UE z Dnia 25 Października 2012 r. w Sprawie Efektywności Energetycznej, Zmiany Dyrektyw 2009/125/WE i 2010/30/UE Oraz Uchylenia Dyrektyw 2004/8/WE i 2006/32/WE. Available online: https://eur-lex.europa.eu/legal-content/EN/TXT/?uri=CELEX%3A02012L0027-20230504 (accessed on 13 March 2025).
- Ustawa z Dnia 20 Maja 2016 r. o Efektywności Energetycznej (Dz.U. z 2024 r. poz. 1047, 1946). Available online: https://isap.sejm.gov.pl/isap.nsf/download.xsp/WDU20160000831/U/D20160831Lj.pdf (accessed on 12 March 2025).
- Komunikat Komisji Europejskiej z Dnia 11 Grudnia 2019 r. Europejski Zielony Ład, COM(2019) 640 Final. Available online: https://eur-lex.europa.eu/legal-content/EN/TXT/HTML/?uri=CELEX:52019DC0640 (accessed on 12 March 2025).
- Zalecenie Komisji (UE) 2021/1749 z Dnia 28 Września 2021 r. w Sprawie Zasady „Efektywność Energetyczna przede wszystkim: Od Zasad do Praktyki”—Wytyczne i Przykłady Wdrażania w Procesie Podejmowania Decyzji w Sektorze Energetycznym i w Innych Sektorach. Available online: https://eur-lex.europa.eu/legal-content/EN/ALL/?uri=CELEX%3A32021H1749 (accessed on 12 March 2025).
- Rozporządzenie Parlamentu Europejskiego i Rady (UE) 2018/1999 z Dnia 11 Grudnia 2018 r. w Sprawie Zarządzania Unią Energetyczną i Działaniami w Dziedzinie Klimatu. Available online: https://eur-lex.europa.eu/legal-content/EN/TXT/?uri=CELEX%3A32018R1999 (accessed on 12 March 2025).
- Szczerbowski, R. Bezpieczeństwo Energetyczne Polski—Mix Energetyczny i Efektywność Energetyczna. Polityka Energetyczna 2013, 16, 35–47. [Google Scholar]
- Włodarski, M. Efektywność Energetyczna Budownictwa w Dokumentach Europejskich i Krajowych. Available online: https://mostwiedzy.pl/pl/publication/efektywnosc-energetyczna-budownictwa-w-dokumentach-europejskich-i-krajowych,142399-1 (accessed on 13 March 2025).
- Dyrektywa Parlamentu Europejskiego i Rady (UE) 2018/2002 z Dnia 11 Grudnia 2018 r. Zmieniająca Dyrektywę 2012/27/UE w Sprawie Efektywności Energetycznej. Available online: https://eur-lex.europa.eu/legal-content/PL/TXT/?uri=uriserv%3AOJ.L_.2018.328.01.0210.01.POL&toc=OJ%3AL%3A2018%3A328%3AFULL (accessed on 13 March 2025).
- Drelich-Skulska, B.; Brusiło, P. Transformacja Energetyczna w Unii Europejskiej w Latach 1990–2021. In Droga do Zrównoważonej Gospodarki Światowej; Cabańska, J., Czyżewska-Misztal, D., Mazur, G., Eds.; Wydawnictwo Uniwersytetu Ekonomicznego w Poznaniu: Poznań, Poland, 2024; pp. 53–68. [Google Scholar] [CrossRef]
- Demirbas, A. Energy Issues and Energy Priorities. Energy Sources Part B Econ. Plan. Policy 2008, 3, 41–49. [Google Scholar] [CrossRef]
- Fridleifsson, I.B. Geothermal energy for the benefit of the people. Renew. Sustain. Energy Rev. 2001, 5, 299–312. [Google Scholar] [CrossRef]
- Kostowski, W.; Barzantny, M. Efektywność energetyczna i środowiskowa wybranych metod wykorzystania wodoru. Energetyka 2022, 22, 445–450. [Google Scholar]
- Klare, M.T. Energy Security. In Security Studies: An Introduction; Williams, P.D., Ed.; Routledge: London, UK; New York, NY, USA, 2008; pp. 483–496. [Google Scholar]
- Paska, J. Ekonomiczny wymiar bezpieczeństwa elektroenergetycznego i niezawodności zasilania. Rynek Energii 2013, 2, 17–22. [Google Scholar]
- Stachowiak, Z. Ekonomiczny wymiar bezpieczeństwa narodowego. In Bezpieczeństwo Narodowe Polski w XXI Wieku; Jakubczak, R., Marczak, J., Eds.; Bellona: Warszawa, Poland, 2011; pp. 545–555. [Google Scholar]
- Haliżak, E. Ekonomiczny wymiar bezpieczeństwa narodowego i międzynarodowego. In Bezpieczeństwo Narodowe i Międzynarodowe u Schyłku XX Wieku; Zięba, R., Ed.; Scholar: Warszaw, Poland, 1997; pp. 78–82. [Google Scholar]
- Gradziuk, A.; Lach, W.; Posel-Czescik, E.; Sochacka, K. Co to jest bezpieczeństwo energetyczne państwa? In Kryteria Bezpieczeństwa Międzynarodowego Państwa; Debski, S., Górka–Winter, B., Eds.; PISM: Warszaw, Poland, 2003; p. 76. [Google Scholar]
- Misiągiewicz, J. Bezpieczeństwo Energetyczne Unii Europejskiej. Available online: https://ptsm.edu.pl/wp-content/uploads/publikacje/poziomy-analizy-stosunkow-miedzynarodowych/Misiagiewicz.pdf (accessed on 13 March 2025).
- Luft, G.; Korin, A. Energy Security: In the Eyes of the Beholder. In Energy Security Challenges for 21st Century; Luft, G., Korin, A., Eds.; ABC-CLIO, LLC: Santa Barbara, CA, USA, 2009; pp. 1–17. [Google Scholar]
- Dołęga, W. Efektywność energetyczna gospodarki krajowej—Wybrane aspekty. Przegląd Elektrotechniczny 2022, 8, 118–122. [Google Scholar] [CrossRef]
- Taliotis, K.; Giannakis, E.; Karmellos, M.; Fylaktos, N.; Zachariadis, T. Estimating the economy-wide impacts of energy policies in Cyprus. Energy Strategy Rev. 2020, 29, 100495. [Google Scholar] [CrossRef]
- Roy, B. The outranking approach and the foundations of electre methods. Theor. Decis. 1991, 31, 49–73. [Google Scholar] [CrossRef]
- Cinelli, M.; Kadziński, M.; Gonzalez, M.; Słowiński, R. How to support the application of multiple criteria decision analysis? Let us start with a comprehensive taxonomy. Omega 2020, 96, 102261. [Google Scholar] [CrossRef]
- Ehrgott, M.; Figueira, J.R.; Greco, S. Trends in Multiple Criteria Decision Analysis. In International Series in Operations Research & Management Science; Springer: Boston, MA, USA, 2010; p. 142. [Google Scholar] [CrossRef]
- Kartsonakis, S.; Grigoroudis, E.; Zopounidis, C. An ELECTRE-TRI Model for National Energy Sustainability Assessment. In Multiple Criteria Decision Making for Sustainable Development: Pursuing Economic Growth, Environmental Protection and Social Cohesion; Doumpos, M., Ferreira, F.A.F., Zopounidis, C., Eds.; Springer: Cham, Switzerland, 2021; pp. 17–37. [Google Scholar] [CrossRef]
- Cabeça, A.S.; Henriques, C.O.; Figueira, J.R.; Silva, C.S. A multicriteria classification approach for assessing the current governance capacities on energy efficiency in the European Union. Energy Policy 2021, 148, 111946. [Google Scholar] [CrossRef]
- Baseer, M.; Ghiaus, C.; Viala, R.; Gauthier, N.; Daniel, S. pELECTRE-Tri: Probabilistyczna metoda ELECTRE-Tri—Zastosowanie w renowacji energetycznej budynków. Energies 2023, 16, 5296. [Google Scholar] [CrossRef]
- Dell’Anna, F. An ELECTRE TRI B-Based Decision Framework to Support the Energy Project Manager in Dealing with Retrofit Processes at District Scale. Sustainability 2023, 15, 1250. [Google Scholar] [CrossRef]
- Martins, H.; Henriques, C.O.; Figueira, J.R.; Silva, C.S.; Costa, A.S. Assessing Policy Interventions to Stimulate the Transition of Electric Vehicle Technology in the European Union. Socio-Econ. Plan. Sci. 2023, 87, 101505. [Google Scholar] [CrossRef]
- Neves, L.P.; Martins, A.G.; Antunes, C.H.; Dias, L.C. A Multi-Criteria Decision Approach to Sorting Actions for Promoting Energy Efficiency. Energy Policy 2008, 36, 2351–2363. [Google Scholar] [CrossRef]
- Antolinez, A.H. Using Multi-Criteria Decision Analysis to Support Local Energy Policymaking. Available online: https://upcommons.upc.edu/bitstream/handle/2117/398024/master-thesis-alex-harillo.pdf?sequence=2 (accessed on 13 March 2025).
- Jovanović, I.; Jelić, M.; Tomašević, N. Integrated Multi-criteria Decision Analysis, Sizing Optimization, and Demand Side Management for Defining Optimal System Configuration While Reducing Costs and CO2 Emissions. In Disruptive Information Technologies for a Smart Society. Proceedings of the 14th International Conference on Information Society and Technology (ICIST); Trajanović, M., Filipović, N., Zdravković, M., Eds.; Springer: Cham, Switzerland, 2024; pp. 35–48. [Google Scholar] [CrossRef]
- Bohra, S.S.; Anvari-Moghaddam, A. A comprehensive review on applications of multicriteria decision-making methods in power and energy systems. Int. J. Energy Res. 2022, 46, 4088–4118. [Google Scholar] [CrossRef]
- Martins, F.; Patrão, C.; Moura, P.; de Almeida, A.T. A Review of Energy Modeling Tools for Energy Efficiency in Smart Cities. Smart Cities 2021, 4, 1420–1436. [Google Scholar] [CrossRef]
- Hajduk, S.; Jelonek, D. A Decision-Making Approach Based on TOPSIS Method for Ranking Smart Cities in the Context of Urban Energy. Energies 2021, 14, 2691. [Google Scholar] [CrossRef]
- Rane, N.L.; Achari, A.; Choudhary, S.P. Multi-criteria decision-making (MCDM) as a powerful tool for sustainable development: Effective applications of AHP, FAHP, TOPSIS, ELECTRE, and VIKOR in sustainability. Int. Res. J. Mod. Eng. Technol. Sci. 2023, 5, 2654–2670. [Google Scholar] [CrossRef]
- Chen Jong, F.; Mohamud Ahmed, M. Multi-Criteria Decision-Making Solutions for Optimal Solar Energy Sites Identification: A Systematic Review and Analysis. IEEE Access 2024, 12, 143458–143484. [Google Scholar] [CrossRef]
- Azhar, N.A.; Radzi, N.A.M.; Ahmad, W.S.H.M.W. Multi-criteria Decision Making: A Systematic Review. Recent Adv. Electr. Electron. Eng. 2021, 14, 779–801. [Google Scholar] [CrossRef]
- Mexis, F.D.; Papapostolou, A.; Karakosta, C.; Sarmas, E.; Koutsandreas, D.; Doukas, H. Leveraging Energy Efficiency Investments: An Innovative Web-based Benchmarking Tool. Adv. Sci. Technol. Eng. Syst. J. 2021, 6, 237–248. [Google Scholar] [CrossRef]
- Karakas, F.; Grassie, D.; Schwartz, Y.; Dong, J.; Bagkeris, E.; Mumovic, D.; Milner, J.; Chalabi, Z.; Mavrogianni, A. A Multi-Criteria Decision Analysis Framework to Determine the Optimal Combination of Energy Efficiency and Indoor Air Quality Schemes for English School Classrooms. Energy Build. 2023, 295, 113293. [Google Scholar] [CrossRef]
- Rocha, A.; Costa, A.S.; Figueira, J.R.; Ferreira, D.C.; Marques, R.C. Quality assessment of the Portuguese public hospitals: A multiple criteria approach. Omega 2021, 105, 102505. [Google Scholar] [CrossRef]
- Gregório, B.C.; Pereira, M.A.; Costa, A.S. Multi-criteria decision-aiding for public hospitals: The role of interactions among pairs of access and quality criteria. Omega 2024, 126, 103046. [Google Scholar] [CrossRef]
- Telles, L.B.; Macedo, L.M.; Bittencourt, J.V.M. ELECTRE-TRI Multicriteria Approach for Measuring Performance of Rural Co-Operatives in Southwest Paraná, Brazil. Economies 2024, 12, 233. [Google Scholar] [CrossRef]
- Dias, L.C. Chapter 12—Sustainability Assessment Using the ELECTRE TRI Multicriteria Sorting Method. In Methods in Sustainability Science; Ren, J., Ed.; Elsevier: Amsterdam, The Netherlands, 2021; pp. 197–214. [Google Scholar] [CrossRef]
- Madhooshiarzanagh, P.; Abi-Zeid, I. A disaggregation approach for indirect preference elicitation in ELECTRE Tri-nC: Application and validation. J. Multi-Criteria Decis. Anal. 2021, 28, 144–159. [Google Scholar] [CrossRef]
- Barbaro, S.; Napoli, G.; Trovato, M.R. Circular Economy and Social Circularity. Diffuse Social Housing and Adaptive Reuse of Real Estate in Internal Areas. In Urban Regeneration Through Valuation Systems for Innovation; Abastante, F., Bottero, M., D’Alpaos, C., Ingaramo, L., Oppio, A., Rosato, P., Salvo, F., Eds.; Springer: Cham, Switzerland, 2022; pp. 229–244. [Google Scholar] [CrossRef]
- Thebault, M.; Desthieux, G.; Castello, R.; Berrah, L. Large-scale evaluation of the suitability of buildings for photovoltaic integration: Case study in Greater Geneva. Appl. Energy 2022, 316, 119127. [Google Scholar] [CrossRef]
- Parra, P.L.; Alvarez, P.A.; Bernal, M.; Castro, E.L. A robust ranking model for analysing marginality of regions of Mexico. Int. J. Innov. Sustain. Dev. 2023, 17, 104. [Google Scholar] [CrossRef]
- Górecka, D.; Roszkowska, E. Enhancing Spatial Analysis through Reference Multi-Criteria Methods: A Study Evaluating EU Countries in terms of Sustainable Cities and Communities. Netw. Spat. Econ. 2024, 24, 1–43. [Google Scholar] [CrossRef]
- Clean Water—Our World in Data. Available online: https://ourworldindata.org/clean-water-sanitation (accessed on 13 March 2025).
- Eurostat. Sustainable Development Goals. Clean Water and Sanitation. Available online: https://ec.europa.eu/eurostat/web/sdi/database/clean-water-and-sanitation (accessed on 13 March 2025).
- The World Happiness Report. Available online: https://worldhappiness.report/ (accessed on 13 March 2025).
- Fogden, J.; Wood, G. Access to Safe Drinking Water and Its Impact on Global Economic Growth; HaloSource, Inc.: Bothell, WA, USA, 2009; pp. 1–76. Available online: https://www.scribd.com/document/397047756/Access-to-Safe-Drinking-Water (accessed on 13 March 2025).
- Dias, L.C.; Mousseau, V. IRIS: A DSS for multiple criteria sorting problems. J. Multi-Criteria Decis. Anal. 2003, 4–5, 285–298. [Google Scholar] [CrossRef]
- Merad, M.M.; Verdel, T.; Roy, B.; Kouniali, S. Use of multi-criteria decision-aids for risk zoning and management of large area subjected to mining-induced hazards. Tunn. Undergr. Space Technol. 2004, 2, 125–138. [Google Scholar] [CrossRef]
- Belahcène, K.; Mousseau, V.; Ouerdane, W.; Pirlot, M.; Sobrie, O. Multiple criteria sorting models and methods—Part I: Survey of the literature. 4OR A Q. J. Oper. Res. 2023, 1, 1–46. [Google Scholar] [CrossRef]
- Almeida-Dias, J.; Figueira, J.R.; Roy, B. ELECTRE Tri-C: A multiple criteria sorting method based on characteristic reference actions. Eur. J. Oper. Res. 2010, 3, 565–580. [Google Scholar] [CrossRef]
- Almeida-Dias, J.; Figueira, J.R.; Roy, B. A multiple criteria sorting method where each category is characterized by several reference actions: The ELECTRE Tri-nC method. Eur. J. Oper. Res. 2012, 3, 567–579. [Google Scholar] [CrossRef]
- Le Gauffre, P.; Haidar, H.; Poinard, D.; Laffréchine, K.; Baur, R.; Schiatti, M. A Multicriteria Decision Support Methodology for Annual Rehabilitation Programs of Water Networks. Comput. Aided Civ. Infrastruct. Eng. 2007, 7, 478–488. [Google Scholar] [CrossRef]
- Roy, B.; Słowiński, R. Handling effects of reinforced preference and counter-veto in credibility of outranking. Eur. J. Oper. Res. 2008, 1, 185–190. [Google Scholar] [CrossRef]
- Figueira, J.R.; Greco, S.; Roy, B. ELECTRE methods with interaction between criteria: An extension of the concordance index. Eur. J. Oper. Res. 2009, 2, 478–495. [Google Scholar] [CrossRef]
- Doumpos, M.; Zopounidis, C. Multi–criteria Classification Methods in Financial and Banking Decisions. Int. Trans. Oper. Res. 2002, 5, 567–581. [Google Scholar] [CrossRef]
- Corrente, S.; Greco, S.; Słowiński, R. Multiple Criteria Hierarchy Process for ELECTRE Tri methods. Eur. J. Oper. Res. 2016, 1, 191–203. [Google Scholar] [CrossRef]
- Emamat, M.S.M.M.; de Mota, C.M.; Mehregan, M.R.; Sadeghi Moghadam, M.R.; Nemery, P. Using ELECTRE-TRI and FlowSort methods in a stock portfolio selection context. Financ. Innov. 2022, 8, 11. [Google Scholar] [CrossRef]
- Mousseau, V.; Slowinski, R.; Zielniewicz, P. A user-oriented implementation of the ELECTRE-TRI method integrating preference elicitation support. Comput. Oper. Res. 2000, 7-8, 757–777. [Google Scholar] [CrossRef]
- Bouyssou, D.; Marchant, T.; Pirlot, M. A theoretical look at ELECTRE TRI-nB and related sorting models. arXiv 2021, arXiv:2008.09484. [Google Scholar] [CrossRef]
- Belahcène, K.; Mousseau, V.; Ouerdane, W.; Pirlot, M.; Sobrie, O. A guided tour of multiple criteria sorting models and methods. Ann. Oper. Res. 2024, 2, 785–845. [Google Scholar] [CrossRef]
- Bouyssou, D.; Marchant, T.; Pirlot, M. ELECTRE TRI-nB, pseudo-disjunctive: Axiomatic and combinatorial results. arXiv 2024, arXiv:2410.18443. [Google Scholar] [CrossRef]
- De Barros, G.M.; Pereira, V. Electre Tree A Machine Learning Approach to Infer ELECTRE Tri B Parameters. Data Technol. Appl. 2021, 4, 586–608. [Google Scholar] [CrossRef]
- Sinha, B.R.K. (Ed.) Introduction: An Overview of the Concept of Quality of Life. In Multidimensional Approach to Quality of Life Issues; Springer: Singapore, 2019; pp. 3–23. [Google Scholar] [CrossRef]
- Dudek, H.; Wojewódzka-Wiewiórska, A. Dimensions of Housing Deprivation in Poland: A Rural-Urban Perspective. SAGE Open 2024, 14. [Google Scholar] [CrossRef]
- Pedro, E.d.M.; Leitão, J.; Alves, H. Bridging Intellectual Capital, Sustainable Development and Quality of Life in Higher Education Institutions. Sustainability 2020, 12, 479. [Google Scholar] [CrossRef]
- Sompolska-Rzechuła, A.; Kurdyś-Kujawska, A. Assessment of the Development of Poverty in EU Countries. Int. J. Environ. Res. Public Health 2022, 19, 3950. [Google Scholar] [CrossRef]
- Sompolska-Rzechuła, A.; Kurdyś-Kujawska, A. Towards Understanding Interactions between Sustainable Development Goals: The Role of Climate-Well-Being Linkages. Experiences of EU Countries. Energies 2021, 14, 2025. [Google Scholar] [CrossRef]
- Łukaniszyn-Domaszewska, K.; Mazur-Włodarczyk, K.; Łukaniszyn, M. Unveiling the Interrelations Between Migration, Climate Change, and Energy Transitions in the Context of Socioeconomic Disparities. Energies 2025, 18, 1625. [Google Scholar] [CrossRef]
- Zabielaitė-Skirmantė, M.; Burinskienė, M.; Maliene, V. Influence of Revitalization on the Social and Economic Well-Being of Residents: Case Study of Lithuania. Sustainability 2023, 15, 7304. [Google Scholar] [CrossRef]
- Kuc-Czarnecka, M.; Markowicz, I.; Sompolska-Rzechuła, A. SDGs implementation, their synergies, and trade-offs in EU countries—Sensitivity analysis-based approach. Ecol. Indic. 2023, 146, 109888. [Google Scholar] [CrossRef]
- Jachimowski, A. SD w kontekście nowych zmian w ciepłownictwie systemowym. Pol. J. Sustain. Dev. 2024, 28, 99–106. [Google Scholar] [CrossRef]
- Smurzyńska-Łukasik, A. Straty energii w budownictwie. Energ. Recykling Gospod. Obiegu Zamkniętego 2024, 10, 10–14. [Google Scholar]
- Gołębiewski, M.; Pietruszka, B. Efektywność energetyczna budynków wykonanych w technologii kompozytów wapienno-konopnych. Mater. Bud. 2023, 1, 38–41. [Google Scholar] [CrossRef]
- Borkowski, A.S.; Osińska, N.; Szymańska, N. Analizy energetyczne w modelach BIM 6D. Mater. Bud. 2022, 1, 54–58. [Google Scholar] [CrossRef]
- Gunasekaran, R.; Priya, R.S. Simulating the Thermal Efficiency of Courtyard Houses: New Architectural Insights from the Warm and Humid Climate of Tiruchirappalli City, India. Architecture 2025, 5, 21. [Google Scholar] [CrossRef]
- Bąk, I.; Sompolska-Rzechuła, A. Urban Development and Sustainable Energy in EU Countries. Sustainability 2024, 16, 6107. [Google Scholar] [CrossRef]
- Piekut, M.; Piekut, K.; Kolemba, A. Energia w transporcie-Polska na tle krajów europejskich. Współczesna Gospod. 2023, 16, 55–68. [Google Scholar] [CrossRef]
- Migała-Warchoł, A.; Ziółkowski, B.; Lew, A.; Stec-Rusiecka, J.; Warmińska, A. Czynniki umożliwiające dostęp do niedrogiej, niezawodnej, zrównoważonej i nowoczesnej energii w Unii Europejskiej. Energies 2025, 18, 722. [Google Scholar] [CrossRef]
- Markaki, M.; Belegri-Roboli, A.; Michaelides, P.; Mirasgedis, S.; Lalas, D.P. The impact of clean energy investments on the Greek economy: An input–output analysis (2010–2020). Energy Policy 2013, 57, 263–275. [Google Scholar] [CrossRef]
- Kucharska, A. Efektywność energetyczna Austrii w kontekście zmiany struktury produkcji. PISM Pol. Inst. Spraw. Międzynarodowych 2017, 3, 55–67. [Google Scholar]
- Yushchenko, A.; Patel, M.K. Contributing to a green energy economy? A macroeconomic analysis of an energy efficiency program operated by a Swiss utility. Appl. Energy 2016, 179, 1304–1320. [Google Scholar] [CrossRef]
- Kamidelivand, M.; Cahill, C.; Llop, M.; Rogan, F.; O’Gallachoir, B. A comparative analysis of substituting imported gas and coal for electricity with renewables—An input-output simulation. Sustain. Energy Technol. Assess. 2018, 30, 1–10. [Google Scholar] [CrossRef]
- Andini, C.; Cabral, R.; Santos, J.E. The macroeconomic impact of renewable electricity power generation projects. Renew. Energy 2019, 131, 1047–1059. [Google Scholar] [CrossRef]
- Frondel, M.; Ritter, N.; Schmidt, C.M.; Vance, C. Economic impacts from the promotion of renewable energy technologies: The German experience. Energy Policy 2010, 38, 4048–4056. [Google Scholar] [CrossRef]
- Pach-Gurgul, A.; Ulbrych, M. Efektywność energetyczna Polski i polskiego sektora przemysłowego w kontekście koncepcji rozwoju. Pract. Kom. Geogr. Przemysłu Pol. Tow. Geogr. 2019, 4, 95–113. [Google Scholar] [CrossRef]


| Variable | Variable Name | Unit of Measure | Characteristics |
|---|---|---|---|
| Y1 | GDP per capita [sdg_08_10] | USD | Gross domestic product (GDP) is a measure of economic activity. It refers to the value of the total output of goods and services produced by an economy, less intermediate consumption, plus net taxes on products and imports. GDP per capita is calculated as the ratio of GDP to the average population in a specific year. |
| Y2 | Gini income inequality index | from 0 to 100 | The Gini coefficient is defined as the relationship between the cumulative shares of the population arranged according to the level of equivalized disposable income and the cumulative share of the equivalized total disposable income received by them. |
| Y3 | Unemployment rate [med_ps421] | % | The unemployment rate is the number of people unemployed as a percentage of the labor force. The labor force is the total number of people employed and unemployed. |
| Y4 | Life expectancy [demo_mlexpec] | years | Life expectancy at a certain age is the mean additional number of years that a person of that age can expect to live, if subjected throughout the rest of his or her life to current mortality conditions. |
| Y5 | Expected years of schooling | years | Expected years of schooling is the number of years a child of school entrance age is expected to spend at school, or university, including years spent on repetition. |
| Y6 | Infant mortality rate [tps00027] | per 1000 live births | The infant mortality rate is defined as the ratio of the number of deaths of children under one year of age to the number of live births in the reference year. |
| Y7 | Share of people having access to safe drinking water | % | Safe drinking water is defined as water from an improved water source, which includes household connections, public standpipes, boreholes, protected dug wells, protected springs, and rainwater collections [69]. |
| Y8 | Air Quality Index according to PM2.5 | µg/m3 | The Air Quality Index (AQI) for PM2.5 is a standardized measure used to indicate the level of fine particulate matter (PM2.5) in the air and its potential health effects. PM2.5 refers to airborne particles smaller than 2.5 μm, which can penetrate deep into the lungs and even enter the bloodstream. |
| Y9 | Length of state, provincial, and municipal roads | km per 1 km2 of the country’s area | The length of state, provincial, and municipal roads per 1 km2 of a country’s area is a measure of road density, often expressed in kilometers of road per square kilometer of land area. |
| Y10 | Population living in households, considering that they suffer from noise [sdg_11_20] | % | The indicator measures the proportion of the population who declare that they are affected either by noise from neighbors or from the street. Because the assessment of noise pollution is subjective, it should be noted that the indicator accounts for both the levels of noise pollution as well as people’s standards of what level they consider to be acceptable. |
| Y11 | Happiness Index | 0 (unhappy)–10 (happy) | The Happiness Index is a comprehensive survey instrument that assesses happiness, well-being, and aspects of sustainability and resilience. Zero points means unhappy, ten means happy [68]. |
| Variable | Variable Name | Unit of Measure | Characteristics |
|---|---|---|---|
| X1 | Final energy consumption per capita [sdg_07_11] | TOE per capita | This indicator measures a country’s energy end use, excluding all non-energy use of energy carriers (e.g., natural gas used not for combustion but for producing chemicals). Final energy consumption only covers the energy consumed by end users, such as industry, transport, households, services, and agriculture; it excludes energy consumption of the energy sector itself and losses occurring during the transformation and distribution of energy. |
| X2 | Energy intensity [nrg_ind_ei] | kgOE/PPS | Energy intensity is one of the indicators that measure an economy’s demand for energy. It measures the amount of energy consumed per unit of Gross Domestic Product (GDP) adjusted for differences in price levels between countries (using purchasing power standards, or PPS). It is a measure of an economy’s EE that shows how much energy (usually in physical units) is needed to produce a unit of value in the economy, converted to purchasing power standards. |
| X3 | Energy productivity [sdg_07_30] | PPS/kgOE | This indicator measures the amount of economic output that is produced per unit of gross available energy. Gross available energy represents the amount of energy products required to meet all the demands of entities in the geographic area under consideration. It shows how much value the economy can produce (in PPS) per unit of energy consumed (in KGOE). It is an indicator of EE, which shows how effectively a country uses its energy resources to generate economic value. |
| X4 | Share of renewable energy in gross final energy consumption [sdg_07_40] | % | This indicator measures the share of renewable energy consumption in gross final energy consumption according to the Renewable Energy Directive. The gross final energy consumption is the energy used by end consumers plus grid losses and the self-consumption of power plants. |
| X5 | CO2 emissions | t/person | This indicator illustrates how many tons of carbon dioxide are emitted per capita in a country in a year. Fossil fuel emissions measure the amount of carbon dioxide (CO2) emitted from the combustion of fossil fuels and directly from industrial processes, such as cement and steel production. Fossil CO2 includes emissions from coal, oil, gas, combustion, cement, steel, and other industrial processes. Fossil fuel emissions do not include land use change, deforestation, soils, or vegetation. |
| X6 | Electricity demand | kWh/person | Annual average electricity demand per person, measured in kilowatt hours. This is electricity generation, adjusted for imports and exports. |
| X7 | Electricity generation | kWh/person | Annual average electricity generation per person. |
| X8 | Share of primary energy consumption from fossil fuels | % | Share of fossil fuels (coal, oil, and natural gas) measured as a percentage of primary energy. |
| X9 | Energy import dependency [sdg_07_50] | % | The indicator shows the share of total energy needs of a country met by imports from other countries. It is calculated as net imports divided by the gross available energy. |
| X10 | Population unable to keep their homes adequately warm [sdg_07_60] | % | This indicator measures the share of the population who are unable to keep their homes adequately warm. Data for this indicator are being collected as part of the European Union Statistics on Income and Living Conditions (EU-SILC) to monitor the development of poverty and social inclusion in the EU. It illustrates what proportion of the population has difficulty heating their homes due to financial problems. It is an important measure of energy poverty, which is caused by low income, high energy prices, and poor-quality housing. |
| Variable | Mean | Median | Min | Max | Standard Deviation | Coefficient of Variation | Skewness |
|---|---|---|---|---|---|---|---|
| Y1 | 42,720.86 | 33,509.01 | 15,885.54 | 128,678.19 | 25,600.29 | 59.92 | 1.89 |
| Y2 | 29.49 | 29.60 | 21.60 | 37.20 | 3.63 | 12.31 | −0.10 |
| Y3 | 5.75 | 5.59 | 2.59 | 12.14 | 2.21 | 38.46 | 1.10 |
| Y4 | 80.75 | 81.70 | 75.80 | 84.00 | 2.59 | 3.21 | −0.64 |
| Y5 | 16.78 | 16.40 | 13.90 | 20.00 | 1.65 | 9.85 | 0.18 |
| Y6 | 3.28 | 3.10 | 2.00 | 5.70 | 1.01 | 30.86 | 1.03 |
| Y7 | 96.89 | 98.90 | 82.10 | 100.00 | 4.49 | 4.63 | −2.09 |
| Y8 | 10.59 | 9.90 | 4.70 | 17.40 | 3.46 | 32.66 | 0.03 |
| Y9 | 1.54 | 1.28 | 0.12 | 8.99 | 1.71 | 110.89 | 3.27 |
| Y10 | 16.94 | 15.50 | 6.70 | 31.30 | 7.35 | 43.42 | 0.50 |
| Y11 | 6.59 | 6.49 | 5.46 | 7.74 | 0.53 | 8.10 | 0.24 |
| X1 | 2.16 | 1.91 | 1.22 | 5.27 | 0.82 | 37.77 | 2.48 |
| X2 | 86.25 | 84.13 | 34.19 | 150.12 | 24.25 | 28.11 | 0.62 |
| X3 | 12.65 | 11.89 | 6.66 | 29.25 | 4.28 | 33.81 | 2.19 |
| X4 | 27.22 | 22.55 | 14.36 | 66.39 | 12.77 | 46.92 | 1.40 |
| X5 | 5.55 | 5.30 | 3.40 | 10.50 | 1.65 | 30.04 | 0.99 |
| X6 | 6.44 | 5.82 | 2.67 | 14.74 | 2.68 | 41.56 | 1.78 |
| X7 | 5.86 | 5.01 | 1.74 | 15.68 | 3.11 | 52.98 | 1.88 |
| X8 | 69.11 | 71.81 | 25.90 | 88.25 | 14.88 | 21.54 | −1.15 |
| X9 | 57.18 | 61.05 | 3.47 | 97.55 | 22.18 | 38.79 | −0.30 |
| X10 | 9.47 | 7.10 | 2.10 | 20.80 | 5.98 | 63.15 | 0.96 |
| Pessimistic Approach | Optimistic Approach | ||||
|---|---|---|---|---|---|
| Class 1 | Class 2 | Class 3 | Class 1 | Class 2 | Class 3 |
| Bulgaria | Austria | Ireland | Bulgaria | Austria | Belgium |
| Croatia | Belgium | Netherlands | Croatia | Cyprus | Czechia |
| Finland | Cyprus | Romania | France | Denmark | |
| Greece | Czechia | Germany | Estonia | ||
| Hungary | Denmark | Greece | Finland | ||
| Italy | Estonia | Hungary | Ireland | ||
| Latvia | France | Italy | Malta | ||
| Lithuania | Germany | Latvia | Netherlands | ||
| Luxembourg | Slovenia | Lithuania | Slovenia | ||
| Malta | Sweden | Luxembourg | Sweden | ||
| Poland | Poland | ||||
| Portugal | Portugal | ||||
| Romania | Slovakia | ||||
| Slovakia | Spain | ||||
| Spain | |||||
| Classification Results Using the ELECTRE Tri Method (Including Intermediate Classes) | ||||
|---|---|---|---|---|
| Class 1 | Class 1/2 | Class 2 | Class 2/3 | Class 3 |
| Bulgaria | Greece | Austria | Belgium | Ireland |
| Croatia | Hungary | Cyprus | Czechia | Netherlands |
| Romania | Italy | France | Denmark | Finland |
| Finland | Latvia | Germany | Estonia | Malta |
| Malta | Lithuania | Slovenia | ||
| Luxembourg | Sweden | |||
| Poland | ||||
| Portugal | ||||
| Slovakia | ||||
| Spain | ||||
| Classification Results Using the ELECTRE Tri Method | ||||
|---|---|---|---|---|
| Class 1 | Class 1/2 | Class 2 | Class 2/3 | Class 3 |
| Bulgaria | Greece | Austria | Belgium | Ireland |
| Croatia | Hungary | Cyprus | Czechia | Netherlands |
| Romania | Italy | France | Denmark | |
| Latvia | Germany | Estonia | ||
| Lithuania | Finlandia | |||
| Luxembourg | Malta | |||
| Poland | Slovenia | |||
| Portugal | Sweden | |||
| Slovakia | ||||
| Spain | ||||
| Pessimistic Approach | Optimistic Approach | ||||
|---|---|---|---|---|---|
| Class 1 | Class 2 | Class 3 | Class 1 | Class 1 | Class 3 |
| Austria | Denmark | Croatia | Belgium | Bulgaria | Austria |
| Belgium | Germany | Portugal | Cyprus | Croatia | |
| Bulgaria | Greece | Romania | Czechia | Denmark | |
| Cyprus | Hungary | France | Estonia | ||
| Czechia | Italy | Germany | Finland | ||
| Estonia | Latvia | Greece | Hungary | ||
| Finland | Lithuania | Ireland | Latvia | ||
| France | Slovenia | Italy | Lithuania | ||
| Ireland | Spain | Malta | Luxembourg | ||
| Luxembourg | Netherlands | Portugal | |||
| Malta | Poland | Romania | |||
| Netherlands | Slovakia | Sweden | |||
| Poland | Slovenia | ||||
| Slovakia | Spain | ||||
| Sweden | |||||
| Classification Results Using the ELECTRE Tri Method (Including Intermediate Classes) | ||||
|---|---|---|---|---|
| Class 1 | Class 1/2 | Class 2 | Class 2/3 | Class 3 |
| Belgium | Bulgaria | Germany | Denmark | Croatia |
| Austria | Cyprus | Greece | Hungary | Portugal |
| Estonia | Czechia | Italy | Latvia | Romania |
| Finland | France | Slovenia | Lithuania | Austria |
| Luxembourg | Ireland | Spain | Estonia | |
| Sweden | Malta | Finland | ||
| Netherlands | Luxembourg | |||
| Poland | Sweden | |||
| Slovakia | ||||
| Classification Results Using the ELECTRE Tri Method | ||||
|---|---|---|---|---|
| Class 1 | Class 1/2 | Class 2 | Class 2/3 | Class 3 |
| Belgium | Bulgaria | Austria | Denmark | Croatia |
| Luxembourg | Cyprus | Germany | Hungary | Portugal |
| Czechia | Greece | Latvia | Romania | |
| Estonia | Italy | Lithuania | ||
| Finland | Slovenia | Sweden | ||
| France | Spain | |||
| Ireland | ||||
| Malta | ||||
| Netherlands | ||||
| Poland | ||||
| Slovakia | ||||
Disclaimer/Publisher’s Note: The statements, opinions and data contained in all publications are solely those of the individual author(s) and contributor(s) and not of MDPI and/or the editor(s). MDPI and/or the editor(s) disclaim responsibility for any injury to people or property resulting from any ideas, methods, instructions or products referred to in the content. |
© 2025 by the authors. Licensee MDPI, Basel, Switzerland. This article is an open access article distributed under the terms and conditions of the Creative Commons Attribution (CC BY) license (https://creativecommons.org/licenses/by/4.0/).
Share and Cite
Becker, A.; Oleńczuk-Paszel, A.; Sompolska-Rzechuła, A. Quality of Life and Energy Efficiency in Europe—A Multi-Criteria Classification of Countries and Analysis of Regional Disproportions. Sustainability 2025, 17, 4768. https://doi.org/10.3390/su17114768
Becker A, Oleńczuk-Paszel A, Sompolska-Rzechuła A. Quality of Life and Energy Efficiency in Europe—A Multi-Criteria Classification of Countries and Analysis of Regional Disproportions. Sustainability. 2025; 17(11):4768. https://doi.org/10.3390/su17114768
Chicago/Turabian StyleBecker, Aneta, Anna Oleńczuk-Paszel, and Agnieszka Sompolska-Rzechuła. 2025. "Quality of Life and Energy Efficiency in Europe—A Multi-Criteria Classification of Countries and Analysis of Regional Disproportions" Sustainability 17, no. 11: 4768. https://doi.org/10.3390/su17114768
APA StyleBecker, A., Oleńczuk-Paszel, A., & Sompolska-Rzechuła, A. (2025). Quality of Life and Energy Efficiency in Europe—A Multi-Criteria Classification of Countries and Analysis of Regional Disproportions. Sustainability, 17(11), 4768. https://doi.org/10.3390/su17114768