Abstract
The sphere of leisure time fulfils important roles in human life, translating into the quality of life of the individual and society. Hence, comprehensive research is being conducted on the ways in which different age groups, including older people, use leisure time. However, few of them take into account factors related to the place of residence, which are important for respondents’ leisure time activities. This study aims to fill the gap in this regard. The aim of the article is to identify socio-demographic variables determining the way adults spend their leisure time, with a particular focus on older people in selected border municipalities in Poland. The study included 1068 individual questionnaire questionnaires completed in 2021 by respondents of border municipalities. One of the non-probability techniques was chosen as the method for selecting elements for the sample, namely, the quota method, which took into account the following characteristics of the population: age, gender, and place of residence. The analyses used selected methods of descriptive statistics and multivariate comparative analysis. The results confirmed that leisure use varied by gender, age, and education. The research also showed that, in the case of older people, leisure time use is influenced by elements relating to their place of residence. Particularly important were the development of green areas in the municipality, safety in the municipality, and the cleanliness of recreational sites.
1. Introduction
Leisure time is an integral part of everyone’s life and is regarded as a highly valued asset. Adequate amounts and proper management of leisure time can improve the functioning of modern man, whereby it is not so much the amount of leisure time but how it is spent that determines the quality of life. In leisure time, one can regenerate one’s strength, develop interests, deepen knowledge, or form proper interpersonal relations with other people. It can contribute not only to improving the quality of life in terms of individuals but also to the occurrence of many positive phenomena within entire communities.
An individual’s leisure time changes depending on the lifecycle phase. One particularly interesting aspect of increasing leisure time is the end of working life (retirement). Freeing oneself from the obligation to work and having pension security are conducive to a satisfying experience of leisure time. Therefore, there is a trend towards more active senior citizens. As evidenced by various studies, if seniors spend their leisure time actively, it significantly improves their health, fitness, and sense of being happy [1,2,3,4]. According to Netuveli and Blane [5], two main factors regarding quality of life in old age should be considered: dementia and depression. Active ageing can counteract these disadvantages. Indeed, the time older people spend on various daily activities is crucial to their health and well-being. New generations of the elderly are increasingly expected to participate in ‘active’ pastimes, as conditions for ageing and retirement have improved significantly in recent decades. Overall, these new seniors are healthier, better off, and more able to live actively and engage positively with the world than previous generations [6,7]. In a broad sense, active ageing refers to activities that are of value to society—both economically (e.g., paid work, unpaid care work and volunteering), socially (e.g., social networking and support)—as well as for individual health, well-being, and active leisure [8].
Documenting inequalities in time use across different socio-demographic groups can help address broader societal issues such as wage inequality, physical and mental health, life expectancy, and happiness.
The aim of the article is to identify socio-demographic variables determining the way in which adults spend their leisure time, with a particular focus on older people in selected border municipalities in Poland. The paper poses two research questions:
- To what extent do gender, age, and education differentiate leisure time use?
- How can regularities in the use of leisure time by adult Poles be interpreted, with particular reference to older people (60+) (according to WHO terminology, the elderly are conventionally defined as people aged 60+)?
The study included 1068 individual questionnaires on the use of leisure time completed in 2021 by respondents of border municipalities in the Zachodniopomorskie, Lubuskie, and Dolnośląskie voivodeships. The border location of the study areas provides the opportunity for their inhabitants to enjoy a diverse range of cultural, tourist, etc., activities on both sides of the border. Simple statistical methods of structure analysis, correlation analysis, and multivariate correspondence analysis were used as research tools. The Correspondence Analysis module in the Statistica 13.0 package was used for calculations and the graphical presentation of the results.
The layout of this article includes an introduction, which outlines the main purpose of the paper and explains the authors’ main motivations for conducting research on leisure use. Following the introduction, a synthesis of the pertinent literature on leisure time and the factors impacting its satisfactory utilisation is provided. The paper continues with a presentation of the statistical data used in the study and a description of the research procedure used in the study. Ultimately, the article concludes with a presentation of the study’s empirical findings, followed by an in-depth discussion that delves into the implications of the research outcomes.
2. Literature Review
Leisure time is a category that is the subject of research and deliberation by scholars representing various research disciplines, which emphasises the interdisciplinary nature of the concept and its connection to many aspects of human life.
In most definitions, leisure time is characterised as the temporal domain existing beyond one’s professional obligations, encompassing various responsibilities such as those associated with indirect professional engagements, educational commitments, household chores, and similar duties. During this temporal segment, individuals engage in activities of their own volition, primarily oriented towards leisure, pleasure, and personal development [9].
The conventional perspective on leisure time pertains to the time available for leisure pursuits after deducting hours allocated to essential daily activities, including paid employment, unpaid household work, and personal care activities such as eating, sleeping, and grooming [10]. However, contemporary discourse has seen some scholars challenge this perspective, positing that activities like sleeping, eating, and personal care may not be categorised as leisure but could instead result from deliberate choices made by individuals [11].
From the point of view of the considerations undertaken, particular emphasis should be directed toward definitions that highlight leisure as a temporal domain wherein “specific human behaviour” manifests. For instance, J. Dimazedier’s characterisation delineates leisure time as an interval separate from work, familial, and societal responsibilities, wherein individuals autonomously and voluntarily engage in activities aimed at relaxation, amusement, knowledge enhancement, and spontaneous participation in social life [12]. Correspondingly, numerous scholars have provided similar definitions of leisure time, all concurring that it pertains to periods external to work [13] and domestic commitments and is instead devoted to recreational activities encompassing cultural, social, or sporting pursuits [14,15].
In the scholarly discourse concerning factors influencing the acquisition and utilisation of leisure time, considerable attention has been directed towards identifying impediments to its availability. Thus, J. Charmes [16] underscores the significance of constraints that demarcate leisure time available for recreational and social pursuits. Such constraints encompass activities like sleep, personal obligations, household responsibilities, educational commitments, gainful employment, and caregiving responsibilities for children and other family members. The conventional definition of “leisure time” thus emerges as the residual temporal domain remaining once individuals allocate time to “paid work”, “unpaid domestic work”, and “personal” care [10].
Individual characteristics, values, and personal preferences also play a pivotal role in delineating the constraints on leisure utilisation. Disparities in the deployment of leisure depend on whether leisure activities transpire during working hours or encompass weekends and holidays. Nevertheless, this distinction is of lesser consequence for individuals who are inactive, engaged in educational pursuits, or have retired from the workforce. The views of the French sociologist J. Dumazedier, cited in the articles, indicate the benefits a person can achieve by using his or her leisure time appropriately. According to Dumazedier (1988), engagement in sports, participation in family, cultural, and artistic endeavours, as well as social interactions with friends, exert a positive influence on personality development by fostering the accumulation of human, social, and cultural capital. These accumulations, in turn, augment the overall quality of life [17].
Leisure time and its utilisation profoundly influence the functioning of the individual (human being) and society as a whole. Insufficient leisure time or allocating leisure hours to activities detrimental to an individual’s health, development, and overall welfare can give rise to a spectrum of social issues. The literature even emphasises the need for interventionism (support) for leisure activities [18]. Understanding leisure patterns and the determinants or constraints shaping these activities constitutes vital information for policymakers and stakeholders involved in shaping social policies within a given domain.
In the existing literature, leisure time is infrequently examined from a theoretical standpoint, with the predominant focus being quantitative or qualitative research paradigms. Regardless of the chosen approach, scholarly investigations typically delve into specific determinants governing the leisure activities of particular demographic segments, such as seniors, young individuals, or students. In the realm of qualitative research, considerable attention is directed towards evaluating the impact of these activities on an individual’s quality of life and overall health. Classic determinants of leisure-time pursuits, often entailing interrelated factors, encompass parameters such as the quantum of available leisure time, gender, age, and place of residence. In alignment with this perspective, Chen et al. [19] surveyed the Netherlands and observed a similar framework. Their findings underscore the substantial impact of socio-demographic factors on sports participation, with subsequent prominence observed in activities like walking, cycling, outdoor recreation, and dog walking. They assert that neighbourhood characteristics are pivotal in influencing participation in leisure activities such as recreational walking, cycling, outdoor play, and dog walking.
When analysing the development of leisure time resources in different periods of life, several turning points can be found, such as starting education, moving on to higher education, starting work, starting a family, having children, children leaving the family home, and ending work and retiring. Studies on leisure activities of different age groups provide valuable information on their quality of life.
According to Veledo et al. [20], factors such as social change and increasing urbanisation processes at the beginning of the 21st century have reduced the amount of time children devote to outdoor leisure activities, resulting in a more sedentary lifestyle than children in previous decades. Working adults, on the other hand, tend to prefer passive leisure activities (e.g., watching TV), which can adversely affect their well-being. Admittedly, intense physical activity can be tiring; however, it provides a break from work-related problems and generates increased subjective well-being and high levels of satisfaction [21].
Retirement stands out as a crucial determinant influencing leisure activities in the context of ageing. De Paula Couto et al. [22] define retirement as the normative release of an individual from external employment commitments as a catalyst for engagement in leisure activities. The authors posit that an individual’s motivations for leisure activities in the post-retirement phase may be contingent upon their future self-perceptions, encompassing views regarding the ageing process and their level of preparedness for age-related transitions. The authors, therefore, conducted a study in which participants were divided into three age-matched groups: those who had recently retired (between baseline and follow-up), those already retired (baseline), and those who were still working (follow-up). The empirical findings revealed discernible variations in leisure time allocation across these groups. Notably, recently retired participants exhibited a notable upsurge in their engagement in leisure activities compared to their already retired counterparts and those who remained in the workforce. It confirms the assumption that the senior group is internally diverse.
Often, older people claim to have more time for their leisure activities; however, the variety of activities performed is lower, showing a negative gradient according to age [23]. Their leisure use patterns show a predominance of passive leisure, little cultural leisure, and moderate levels of social and physical leisure activities.
In light of prevailing demographic concerns associated with an ageing population, there has been an escalating research focus on the engagement of older individuals in leisure activities. A key impetus driving efforts to encourage physical activity among seniors emanates from concerns for their overall health and well-being [24,25]. In this context, it is noteworthy that leisure-time activities undertaken by older individuals exhibit a positive correlation with their income levels [26]. Those with lower incomes tend to gravitate towards voluntary engagements, while their higher-income counterparts exhibit a preference for cultural pursuits such as attending cinema screenings, concerts, or museums. Conversely, moderate-income individuals prefer home-based hobby activities like painting, reading, or playing musical instruments. This perspective aligns with the assertions of Kim et al. [27], who posit that the Time Travel Budget (TTB) of older individuals is significantly influenced by economic conditions, in contrast to younger individuals, whose TTB is primarily shaped by individual characteristics.
In addition, older people’s leisure time is often influenced by age-related stereotypes. Positive stereotypes portray older people as warm-hearted, loyal, and trustworthy. However, there are more negative stereotypes, which include health problems, loneliness, lack of attractiveness, and competence [28,29]. Negative images of old age can damage the cognitive and physical functioning and health of older people. Therefore, encouraging active lifestyles among older people can not only improve their image in society but, above all, have a positive impact on their health. Rocio’s research confirms that people who frequently engage in recreational and/or leisure-time physical activities have a 19% lower mortality risk than those who rarely or never engage in these activities [30].
According to Bone et al. [31], engagement in leisure has the potential to slow the decline in health and functional capacity in older age.
Furthermore, the literature underscores the significant role of education and occupation as economic determinants that influence both the allocation and quality of leisure time. This influence is depicted as a reciprocal relationship, wherein education shapes individual needs while one’s profession dictates income, consequently facilitating the fulfilment of these needs [32]. Additionally, it is highlighted that the quantity of available leisure time is contingent upon an individual’s occupational status. Notably, children, non-working young adults, and retirees generally enjoy greater amounts of leisure time. Paradoxically, these groups are simultaneously characterised by lower income levels, and yet the effective management of leisure time often entails various consumer expenditures [33].
Another pivotal determinant shaping leisure activities is the network of connections and relationships among participants. As Luong and Maness [34] note, a given activity is often motivated by and performed within the social network of individuals. Similar assumptions were made by Artenze [35], who emphasised that when considering leisure activities conducted outside the home, it is crucial to recognise that these endeavours are typically undertaken within social groups. Moreover, the selection of activity venues and the associated travel arrangements often emerge as outcomes of group interactions and deliberations. In turn, Fang et al. [36] point out that seniors can not only engage in decisions about their own health through exercise but also engage peers in paid exercise classes, thus causing the risk of developing commercial offers.
Dong et al. [37] conducted a study that delved into the relationship between individuals’ choices of leisure activities and the resultant well-being they experienced from engaging in these pursuits. Their findings indicated that participation in activities outside the home positively influenced overall satisfaction compared to activities conducted within the home environment. This perspective is consistent with the conclusions drawn by Zins and Ponocny [38], whose research in Taiwan corroborated the notion that outdoor activities offer greater well-being benefits than indoor alternatives. It is also important to emphasise that, in the social sciences, determinants do not solely pertain to activity levels but frequently extend to the consequential outcome of these activities, namely, the impact on individuals’ quality of life [2,15,39].
Conducting research in regions characterised by varying potentials for leisure utilisation but united by their border location offers the opportunity to unveil differentiation in sociogeographical attributes and other determinants influencing the leisure activities of border area inhabitants. In conclusion, it is imperative to acknowledge that comprehending the intricate interplay of these factors can be instrumental in formulating measures aimed at bolstering leisure activities, ultimately enhancing the overall quality of life for the residents of such areas.
3. Materials and Methods
3.1. Stages of the Applied Research Procedure
This article employs a 3-stage research methodology to investigate leisure time utilisation, as depicted in Figure 1. The initial stage involves defining variables and their respective categories based on the questionnaire survey.
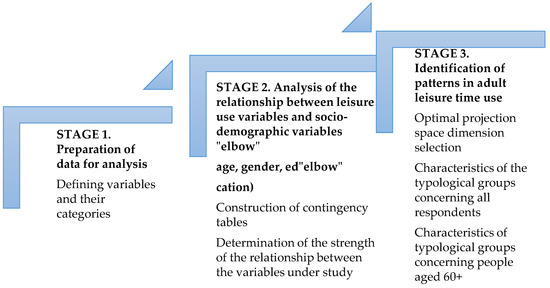
Figure 1.
Research procedure chart. Source: own elaboration.
The relationships between leisure time utilisation and socio-demographic variables are examined in the subsequent stage. For that purpose, contingency tables are constructed, and the strength of these relationships is quantified using Cramer’s V coefficient.
Subsequently, multivariate correspondence analysis in conjunction with Ward’s method was employed to discern interrelationships among variables characterising the leisure time of the respondents. This analytical approach was applied twice: firstly, to uncover patterns in leisure time utilisation across all respondents 18+, and, secondly, to delineate typological groups characterising the leisure time habits of individuals aged 60 and above. Calculations were performed in the Statistica 13.0 package.
3.2. Statistical Material
The statistical data on the leisure time allocation of residents in the border municipalities of the Zachodniopomorskie, Lubuskie, and Dolnośląskie voivodeships were sourced from a survey conducted by the Institute of Spatial Management and Social and Economic Geography at the University of Szczecin in 2021. At the beginning of the study, the minimum sample size was determined. Taking into account the size of the population (the number of residents of border communes) and the error rate of 3%, the minimum sample size was 1068 people, and that is how many respondents were included in the study. It should be added that the actual study on a sample of 1068 people was preceded by a pilot study on a sample of 100 people, which allowed for the final construction of the survey questionnaire. One of the non-probability techniques was chosen as the method of selecting elements for the sample—the quota method. This method consists of imposing a population structure known due to specific characteristics (features) on the sample and selecting quotas of units representing individual subpopulations in proportions such as the share of these subpopulations in the entire population. In this way, a sample is obtained that can be said to be representative of the entire population only due to specific characteristics. The following characteristics were taken into account in this study:
- age (in age ranges),
- gender (women, men),
- place of residence (voivodeship, district, commune).
Respondents selected using the quota method answered questions about factors influencing their leisure time activity and provided the types of physical and non-physical activities they engaged in.
The categories of the above variables and the symbols assigned to them are presented below. The first question concerned factors that are important for respondents to engage in leisure time activity. Respondents used a 5-point Likert scale, from a value of 1 for a very important response to a value of 5 for an unimportant response:
- presence of outdoor gyms, parks, pedestrian areas, squares, playgrounds, etc., in the vicinity of the residence (from P1.1:1—very important to P1.1:5—not important);
- opportunity to participate in free workshops, meetings, and courses in the municipality (from P1.2:1—very important to P1.2:5—not important);
- good transport accessibility (short travel time, parking): from P1.3:1—very important to P1.3:5 not important;
- provision of transport by the municipality: from P1.4:1—very important to P1.4:5—not important;
- development of green areas in the municipality (benches, shelters, walking paths, cycle routes): from P1.5:1—very important to P1.5:5—not important;
- events organised in the municipality (e.g., picnics, concerts, harvest festivals): from P1.6:1—very important to P1.6:5—not important;
- safety in the municipality: from P1.7:1—very important to P1.7:5—not important;
- cleanliness of recreational sites: from P1.8:1—very important to P1.8:5—not important;
- cost of attending events: from P1.9:1—very important to P1.9:5—not important;
- opportunity to meet with others: from P1.10:1—very important to P1.10:5—not important.
The second question asked respondents whether they practised the following types of physical activity listed in the survey questionnaire (dichotomous scale):
- walking: P.2.1:0—no, P2.1:1—yes;
- Nordic walking: P.2.2:0—no, P2.2:1—yes;
- running: P.2.3:0—no, P2.3:1—yes;
- swimming (pool): P.2.4:0—no, P2.4:1—yes;
- swimming (aquatic environment, canoes, sailboats, lakes, etc.): P.2.5:0—no, P2.5:1—yes;
- exercise in leisure and sports facilities (aerobics, fitness, gym, dance, treadmill): P.2.6:0—no, P2.6:1—yes;
- physical exercise at home P.2.7:0—no, P2.7:1—yes;
- cycling P.2.8:0—no, P2.8:1—yes;
- horse riding: P.2.9:0—no, P2.9:1—yes;
- indoor team games (e.g., football, volleyball): P.2.10:0—no, P2.1:10—yes;
- outdoor team games (e.g., football, volleyball): P.2.11:0—no, P2.1:11—yes;
- allotment (garden) work: P.2.12:0—no, P2.12:1—yes.
The third question related to activities undertaken or not undertaken other than exercise (dichotomous scale):
- book reading: P.3.1:0—no, P3.1:1—yes;
- watching television: P.3.2:0—no, P3.2:1—yes;
- board games: P.3.3:0—no, P3.3:1—yes;
- computer games: P.3.4:0—no, P3.4:1—yes;
- crosswords: P.3.5:0—no, P3.5:1—yes;
- sunbathing on the beach: P.3.6:0—no, P3.6:1—yes;
- playing with children: P.3.7:0—no, P3.7:1—yes;
- helping children to learn: P.3.8:0—no, P3.8:1—yes;
- housework (cleaning, cooking, etc.): P.3.9:0—no, P3.9:1—yes;
- meeting/conversing with friends/family via Internet/telephone: P.3.10:0—no, P3.10:1—yes;
- handiwork (crocheting, DIY, painting pictures): P.3.11:0—no, P3.11:1—yes;
- browsing the Internet, social networking sites, etc.: P.3.12:0—no, P3.12:1—yes.
Respondents were also asked whether they were interested in spending their leisure time in neighbouring/German municipalities. Two categories of responses were received: G1—yes, G2—no.
Demographic and social questions were also included in the survey questionnaire:
- gender: F—female, M—male;
- age: AG1—18–29 years, AG2—30–44 years, AG3—45–59 years, AG4—60 years and over;
- education: ED1—primary, ED2—vocational, ED3—secondary, ED4—tertiary;
- number of persons in the family: P1—one person, P2—two people, P3—three people, P4—four people, P5—five people and more.
3.3. Statistical Methods
Contingency tables were constructed to examine the correlation between the leisure use variables and the socio-demographic variables: gender, age, and education of the respondents. The strength of the correlation was assessed using Cramer’s V coefficient [40], determined by the following Formula (1) [41]:
where:
χ2—statistics, based on a comparison of empirical and theoretical counts, n—the number of observations, r—the number of rows in the array, and k—the number of columns in the array.
The coefficient takes values in the range [0–1]. The strength of correlation among the considered characteristics intensifies as V approaches unity.
Correspondence analysis was employed to explore associations among variables characterising respondents’ leisure time. This method is well-suited for qualitative data analysis and aims to unveil relationships between variables and subjects (respondents) without making prior assumptions about them. When dealing with multiple characteristics, multivariate analysis is applied, employing one of four approaches to record the observed counts of feature categories: composite marker matrix, Burt’s matrix, multivariate contingency analysis, and combined contingency table. In this study, the data were recorded using the second approach, i.e., the Burt matrix, which is the most commonly utilised foundation for conducting correspondence analysis [42,43,44,45,46]. The dimension of the genuine co-occurrence space (K) was subsequently ascertained based on the following Formula (2):
According to Greenacre’s criterion, the most suitable dimension for projecting variable categories is determined by selecting the dimension in which the eigenvalues meet the following condition .
In addition to the established criterion for selecting significant eigenvalues .
Greenacre provides a method to enhance the outcomes of the analysis for variables expressed in the form of Burt’s matrix [42,43,44]:
Q—the number of variables,
—k-th eigenvalue.
3.4. Study Results
The survey sample primarily consisted of individuals aged 60 and older, comprising 38.1% of the total respondents. The gender distribution indicated that slightly less than half (approximately 53%) of the respondents were women (Table 1), with the majority (87.2%) of them possessing at least a secondary level of education. Conversely, about 76% of the male respondents held a similar educational qualification. Regarding employment status, the largest segment of respondents was actively engaged in economic activities (44%), followed by those in retirement (28.2%). Among individuals aged 30 to 59, households typically comprised four members (62.4%), whereas among older individuals aged 60 and above, two-person households were predominant (45.2%).

Table 1.
Characteristics of the study sample.
Contingency tables were constructed to analyse the relationships between leisure use variables and socio-demographic variables (Appendix A, Table A1, Table A2, Table A3, Table A4, Table A5, Table A6, Table A7, Table A8, Table A9, Table A10, Table A11, Table A12, Table A13, Table A14, Table A15 and Table A16). The strength of the relationships was determined using Cramer’s V coefficient, with the coefficient values provided in the table titles. Initially, we explored the connections between gender and leisure time utilisation variables (Table A1, Table A2, Table A3, Table A4, Table A5 and Table A6). The findings revealed a pronounced association between gender and housework, while moderate relationships were observed with walking, crossword puzzles, computer games, and meetings/chatting with friends/family via the Internet/phone. Notably, the first three activities were predominantly favoured by women, while the latter two were more popular among men.
Age emerged as a significant determinant influencing the leisure activities of adults (Table A6, Table A7, Table A8, Table A9, Table A10, Table A11, Table A12 and Table A13). Activities such as walking, working in the allotment, reading books, watching TV, and housework held greater appeal for older individuals (aged 60+). These same activities also garnered interest among respondents aged 30–44, who also preferred cycling. Conversely, running was primarily an activity that respondents aged 30–44 embraced.
Moreover, a preference for reading books and watching TV was observed among respondents with at least a secondary level of education (Table A13, Table A14 and Table A15). Furthermore, those with such an educational background tended to spend their leisure time in neighbouring/German municipalities (Table A16).
Correspondence analysis was used to search for associations between variables characterising respondents’ leisure time by constructing Burt’s matrix, 78 × 78 in dimension. This matrix was derived from thirty-six variables, each categorised in alignment with the characteristics of the research material. The dimension of the actual co-occurrence space of responses to the analysed questions was determined to be 42, based on Formula (2).
Subsequently, we evaluated how eigenvalues in a lower-dimensional space accounted for the total inertia (λ = 11,667) (The total inertia is the sum of K eigenvalues, where K is the dimension of the real co-occurrence space). To ascertain their relevance for the study, we applied Greenacre’s criterion, which considers principal inertias greater than to be significant. Table 2 illustrates that these relevant inertias (Table 2 omits the results for K > 15, as for these dimensions the main inertias were no higher than 0.0278, so these dimensions were not significant in the study) are associated with K values up to 15. To enhance the quality of the mapping, we performed a modification of the eigenvalues following Greenacre’s proposal (Formula (3)). Table 2 presents the eigenvalues (squares of the singular values ), the contribution of the principal inertia to the total inertia (percentage inertia ) and the contribution of the eigenvalues from the K dimension to the total inertia (cumulative percentage ) before and after modification. In addition, a plot of the eigenvalues was drawn (Figure 2). The trend observed in the curve connecting the eigenvalues suggests that the presentation space depicting the co-occurrence of variable categories should not exceed six dimensions. These six dimensions collectively capture over 60% of the inertia associated with the analysed data array.
Table 2.
Singular values and eigenvalues with the degree of explanation of total inertia in the original and modified versions.
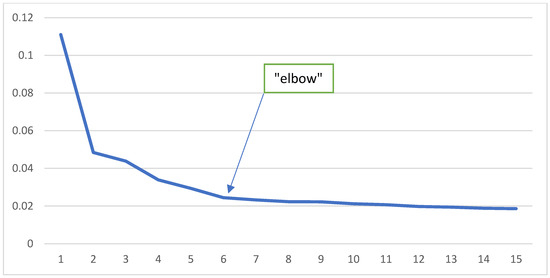
Figure 2.
Graph of eigenvalues. Source: own elaboration.
The new coordinate values in the six-dimensional space for the variable categories were determined using the formula:
where: —the matrix of new coordinate values for categories of variables (dimension 42 × 6),
F*—the matrix of original coordinate values for categories of variables (dimension 42 × 6),
—the diagonal inverse matrix of singular values (dimension 6 × 6), —the diagonal matrix of modified eigenvalues (dimension 6 × 6).
Interpreting results within a six-dimensional space can be challenging. Hence, we employed Ward’s method [47,48,49,50], which facilitated identifying connections between variable variants (Figure 3). The critical distance value at which the merging of clusters ceased was determined using the metric proposed by T. Grabiński [51]:
—the length of the i-th bond (i-th branch of the tree).

Figure 3.
Diagram of hierarchical classification of categories of variables made using Ward’s method (all respondents). Source: own elaboration.
Based on the derived clusters, we can elucidate associations among the categories of the analysed variables, thereby unveiling patterns in respondents’ leisure time utilisation. These patterns can be summarised as follows (the categories of variables given in the 3.2 Statistical Material section are given in brackets):
Group I (M, AG1, AG2, ED1, ED4, P1, P4, P5, P2.3:1, P2.4:1, P2.6:1, P2.7:1, P2.8:1, P2.1:10, P2.1:11, P3.1:1, P3.3:1, P3.4:1, P3.7:1, P3.8:1, P3.10:1, P3.12:1, G2) primarily comprises men aged up to 44 years, with a mix of primary and tertiary education attainment (16%). They predominantly reside in single-person households and households with four or more occupants. This cluster exhibits a penchant for active leisure time pursuits, including activities such as running, swimming, engaging in physical exercise at home, cycling, participating in indoor and outdoor team games, as well as utilising leisure and sports facilities. Additionally, they are inclined to read books, indulge in board and computer games, and devote their free time to interacting with their children through play and educational support. Social gatherings with family and friends appeal to this group, as does browsing the Internet and engaging in social networks. Notably, individuals in this cluster tend to eschew spending their leisure time in neighbouring or German municipalities.
Group II (K, AG3, AG4, ED3, ED4, P2, P2.1:1, P2.2:1, P2.12:1, P3.2:1, P3.5:1, P3.11:1, P1.5:3, P1.5:4, P1.5:5, P1.7:3, P1.7:4, P1.7:5, P1.8:3, P1.8:4, P1.8:5, P1.10:3, P1.10:4, P1.10:5, G1) comprises women aged 45 and over with vocational and secondary education (32%), most often living with another person (spouse, partner). They prefer leisure activities such as Nordic walking, engaging in the allotment and manual work, watching TV, and solving crossword puzzles. Notably, they do not express a strong interest in developing green areas within their own municipality, the overall safety of their municipality, the cleanliness of recreational spaces, or the opportunity to socialise with others. Interestingly, individuals in this cluster are inclined to spend their leisure time in neighbouring and German municipalities.
Group III (variables from P1:1, P1:2 to P10:1, P10:2) pertains to individuals for whom the elements influencing leisure activities within the municipality hold significance (exceeding 50%), yet they do not prefer any leisure activity.
Employing correspondence analysis to uncover associations between variables enabled the identification of three distinct groups of respondents characterised by their leisure time utilisation. Considering the study’s objectives, the focus was on respondents aged 60 and above. From the initial sample of 1068 participants, 407 individuals within this age bracket were selected. Subsequent application of correspondence analysis in conjunction with Ward’s method (Figure 4) facilitated the identification of patterns related to the leisure time habits of seniors. The following three groups of respondents emerged (the categories of variables given in the 3.2 Statistical Material section are given in brackets):
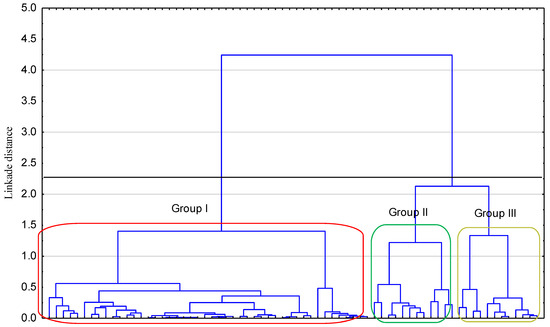
Figure 4.
Diagram of a hierarchical classification of categories of variables made using Ward’s method (respondents aged 60+). Source: own elaboration.
Group I (ED2, ED3, ED4, P2.2:1, P2.12:1, P2.8:1, P3.1:1, P3.9:1, P3.10:1, P1.5:3, P1.5:4, P1.5:5, P1.7:3, P1.7:4, P1.7:5, P1.8:3, P1.8:4, P1.8:5, P1.10:3, P1.10:4, P1.10:5, G1) encompasses respondents with a minimum level of vocational education. In their leisure time, they undertake the following activities: reading books (39%), working on the allotment (32.2%), cycling (27%), Nordic walking (9.3%), and housework and meeting with friends and family. As for their preferences, they do not attach significant importance to factors such as the development of green areas within the municipality, the overall safety of the municipality, the cleanliness of recreational spaces, or the opportunity to interact with others. Instead, they prefer to spend their leisure time in neighbouring or German municipalities.
Group II comprises individuals with a primary education background (2.2%) who do not specify any particular leisure activities.
Group III (P2.1:1, P2.1:10, P2.3:1, P2.5:1, P2.6:1, P2.7:1, P3.3:1, P3.4:1, P3.6:1, P3.7:1, P3.8:1) includes individuals with varying levels of education who express a keen interest in a diverse range of activities, with a predominant focus on physical pursuits. These activities include walking (60%), engaging in play with children (10%), running (9%), assisting children with their studies (6%), and swimming (5%). In contrast, other activities like exercising in leisure and sports facilities, working out at home, participating in indoor team games, board games, sunbathing, and computer games are of less interest, each garnering participation from less than 5% of older respondents. Notably, respondents in this group attribute significance to elements (variables from P1:1, P1:2 to P10:1, P10:2) that influence leisure time management within the municipality.
4. Discussion
When delving into the discourse on active leisure engagement among adults, particularly those in retirement, it is essential to acknowledge the potential evolution of interest in active leisure activities over time. As highlighted in [52], retirement in the long term may entail a deceleration, if not an interruption, of cognitive stimulation, social interactions, and physical activity. As posited by the authors mentioned above, this transformative process could endanger the perception of the elderly, diminish their sense of purpose, and erode their self-esteem, with subsequent adverse implications for both mental and physical well-being. Therefore, it appears prudent for stakeholders in social policy to institute measures that ensure seniors sustain ongoing engagement in recreational activities. These endeavours should extend beyond short-term projects or isolated initiatives and be designed to operate cyclically.
Furthermore, aside from local policy stakeholders, workplaces (corporations) where individuals have been employed until retirement can significantly influence retirees’ leisure pursuits. Companies have the potential to offer support by facilitating opportunities for retirees to maintain social connections with former colleagues and by assisting in the development of retirement plans, as proposed by Principi et al. [6]. Additionally, it is worth noting that other scholars emphasise the need for comprehensive, multilevel interventions that address attitudes, skills related to physical activity, and factors within the social and physical environment. Such interventions are essential for promoting increased physical activity, particularly among more disadvantaged population segments, as Cerin et al. indicated [53].
In light of the global trend of ageing populations, it is pertinent to contextualise the research within the framework of the well-established theory of active ageing and the body of research dedicated to the factors influencing this phenomenon [54]. Health, participation, and safety are key elements of active ageing [54,55,56]. Furthermore, researchers have emphasised that community capacity significantly influences active ageing at the individual and collective levels. Additionally, spatial location and the relevance of local resources within the place of residence have been identified as critical components of social support systems for older individuals seeking to age actively [55].
The reduced mobility experienced by older individuals as they age underscores the growing importance of their surrounding environment. An accommodating physical environment not only provides access to natural settings but also a diverse range of recreational opportunities, including exercise and social interactions. This, in turn, promotes physical fitness [57], enhances overall physical and mental well-being [53,58,59], and fosters a sense of community belonging [60]. Wu et al.’s [61] and Zhai et al. [62] research reinforces this perspective, demonstrating that environmental support, place safety, spatial comfort, scenic beauty, and access to various amenities influence outdoor physical activity among older individuals. Our study aligns with these findings.
In our investigation, the elements pertaining to the place of residence (variables P1 to P10) did not hold universal significance for all distinct groups of respondents aged 60 and above. Group 1, predominantly inclined toward activities in their immediate surroundings (such as reading and tending to allotments), may suggest that landscaping in their local neighbourhoods is less important. However, Group III, who display enthusiasm for various activities, particularly physical ones, regard these elements as vital and influential factors in their leisure choices. They place significant importance on the development of green areas within the municipality, the safety of the municipality, and the cleanliness of recreational sites.
Research into leisure time, a foundation for human recreational activity, is often intertwined with investigations into gender disparities within leisure. Shaw [63] revealed that men possess significantly more leisure time than women during weekends, whereas gender discrepancies on weekdays are relatively minor. Conversely, Mattingly and Blanchi [64] identified variations in leisure time utilisation between men and women based on studies conducted in the United States. They emphasised activities that encroach on leisure time allocation for recreation, such as housework, fragmented leisure periods, or the frequency of childcare responsibilities during leisure hours. These authors contend that changes in marital status, childcare obligations, and working hours have differing impacts on men’s and women’s leisure time, and that, despite strides towards gender equality, disparities in leisure experiences persist.
Similarly, research conducted in the UK found that employed women encounter more substantial constraints on their leisure time, which can impede their engagement in leisure and social activities [65,66]. According to Bittman and Wajcman [11], men and women have comparable amounts of leisure time; however, the nature of this time differs due to the burden of caregiving responsibilities borne by women. Other studies have revealed that mothers and fathers spend leisure time at home in brief, fragmented intervals, with fathers enjoying extended leisure periods [67]. Recent reports further underline that the time devoted to unpaid caregiving activities is a social determinant of gender inequality in terms of leisure utilisation. Data collected across 78 countries indicate that, globally, women account for over 72.3 per cent of total unpaid work (in contrast to men, who contribute 27.7 per cent) [16]. Paz et al. [56] highlight that demographic ageing is not gender-neutral and mainly affects older women.
Our study also substantiates the strong association of gender with housework and its moderate correlation with the following variables: walking, crossword puzzles, computer games, and meeting/chatting with friends/family via the internet/phone. Among these activities, the first three are predominantly favoured by women, while men more commonly embrace the latter two. Hence, it is imperative to delve further into gender-specific research investigating the intricate interplay between leisure activities and gender. Such investigations are especially pertinent in light of phenomena like the feminisation and increased prevalence of single-person households among older adults.
The level of post-retirement satisfaction is intricately linked to the cognitive and emotional resources derived from engaging in leisure activities [68]. Notably, the activities examined in prior studies indicate a pronounced preference among seniors for reading. However, our study did not unveil a discernible relationship between activity choice and satisfaction, which constitutes a limitation of our research.
Additionally, existing literature highlights the pivotal role of family and social connections in facilitating continued engagement in leisure activities during retirement [68]. Spending time with family and interacting with children emerge as vital leisure components for seniors, as our study’s findings have emphasised.
5. Conclusions
The research results presented in this study confirmed that important determinants influencing the activity of adults are socio-demographic variables, such as gender, age and education. This is evidenced by both the values of Cramer’s V coefficient determined based on the study sample, as well as the extensive literature on the subject. Activities such as walking, gardening, reading books, watching television, and housework are of interest primarily to older people (60+).
The application of correspondence analysis, and especially the use of hierarchical classification (Ward’s method) based on it, allowed us to determine the links between the categories of variables adopted for the study. It turned out that among the respondents, active use of free time is mainly the domain of men up to 44 years of age. This applies in particular to team games and exercises in recreational and sports facilities. Women aged 45–59 primarily prefer walking, Nordic walking, gardening and manual work, watching television, and solving crosswords.
On the other hand, people aged 60 and over mainly prefer walking (60% of respondents), reading books (39% of respondents), working in the plot (32.2% of respondents), cycling (27% of respondents), Nordic walking (9.3%), and playing with children (10% of respondents). Older people, regardless of their level of education, were also eager to mark factors that influence their decisions related to taking up activities in their free time. The factors that turned out to be important were the presence of recreational infrastructure (the presence of an outdoor gym, parks, promenades, squares, playgrounds, etc. near the place of residence), transport and participation costs (the possibility of participating in free workshops, meetings, courses in the commune, events organised in the commune and their costs, good communication accessibility and provision of transport by the commune), as well as the condition of recreational places (the development of green areas in the commune and their cleanliness).
The theoretical concepts and empirical findings presented in this study, which endeavour to shed light on utilising leisure time among adults, with a particular focus on older individuals, do not comprehensively cover the entire spectrum of this complex subject. The authors intend to continue their research for several compelling reasons. Foremost among these reasons is the desirability, both from the perspective of senior citizens and state policy, of fostering active engagement in various forms of leisure time pursuits, with an emphasis on those who are physically active. The effective utilisation of leisure time, enabling not only the continual rejuvenation of physical and mental well-being but also the promotion, maintenance, or enhancement of health and physical and social activities, can significantly enhance the quality of life for individuals in this age demographic. The allocation and utilisation of leisure time resources are pivotal in realising health and developmental objectives and promoting sustainable human development. These considerations, among others, have led numerous countries worldwide to recognise that the active utilisation of leisure time is no longer solely an individual concern but also a critical social issue and a component of social policy.
Moreover, the research findings delineated in this study hold potential utility in constructing a model that encapsulates the leisure behaviour of seniors and in guiding entities operating within the leisure time goods and services market. It is imperative to extend the subject and territorial scope of the research to fulfil these objectives. The interdisciplinary approach to studying leisure adopted in this investigation and the research methodologies employed introduce a fresh perspective on leisure time, underscoring its multifaceted nature and individualistic assessment. This contribution by the authors adds valuable insights to the global discourse surrounding the effective utilisation of leisure time within the context of ageing societies.
This study has limitations that are worth considering. The first of them was to focus on selected socio-demographic variables, as well as variables related to the physical and non-physical activity of the respondents. The authors are aware that there are many other factors that can affect the use of free time by adults, especially the elderly. These include health status, financial and family situations, interests and habits from earlier years of life, as well as psychosocial factors, such as personality traits. This important research aspect, including the above variables, will be included in subsequent studies. This will require detailed interdisciplinary research with the participation of specialists in the sociology and psychology of human behaviour. Another important limitation is the use of the quota method to select the sample, which became quasi-representative only due to three characteristics (age, gender, and place of residence). Such sample selection does not allow for generalising the results to the entire population; however, because the structure of the sample obtained using the quota method is similar to the structure of the population, it is possible to look for regularities and draw conclusions about the studied sample.
Author Contributions
Conceptualization, I.B. and A.S.; methodology, I.B. and A.S.; software, I.B. and A.S.; validation, I.B. and A.S.; formal analysis, I.B. and A.S.; investigation, I.B. and A.S.; resources, I.B. and A.S.; data curation, I.B. and A.S.; writing—original draft preparation, I.B. and A.S.; writing—review and editing, I.B. and A.S.; visualisation, I.B. and A.S.; supervision, I.B. and A.S.; project administration, I.B. and A.S.; funding acquisition, I.B. and A.S. All authors have read and agreed to the published version of the manuscript.
Funding
Co-financed by the Minister of Science under the “Regional Excellence Initiative”. Project number RID/SP/0046/2024/01.
Institutional Review Board Statement
Ethical review and approval were waived for this study due to the Regulation of the European Parliament and of the EU Council No. 2016/679 of 27 April 2016 on the protection of natural persons with regard to the processing of personal data and on the free movement of such data and repealing Directive 95/46/EC (Data Protection Directive), hereinafter referred to as the GDPR. The investigation was conducted using an anonymous questionnaire. The subjects were fully informed that no identifying information would be collected and that the results would remain anonymous. The research was conducted by an external company, which was selected under the applicable provisions of Polish law regarding public procurement. The company that carried out the research (Centrum Badań Terenowych Radosław Meissner) specializes in social research (surveys) and maintains ethical standards.
Informed Consent Statement
Informed consent for participation was obtained from all subjects involved in the study.
Data Availability Statement
The original contributions presented in the study are included in the article, further inquiries can be directed to the corresponding author.
Conflicts of Interest
The authors declare no conflicts of interest.
Appendix A
Table A1.
Contingency table for the variables: gender and walks V = 0.216).
Table A1.
Contingency table for the variables: gender and walks V = 0.216).
| Gender | Walks | Total | |
|---|---|---|---|
| No | Yes | ||
| Men | 249 | 254 | 503 |
| Women | 224 | 341 | 565 |
| Total | 473 | 595 | 1068 |
Source: own compilation based on questionnaires.
Table A2.
Contingency table for the variables: gender and computer games (V = 0.268).
Table A2.
Contingency table for the variables: gender and computer games (V = 0.268).
| Gender | Computer Games | Total | |
|---|---|---|---|
| No | Yes | ||
| Men | 453 | 50 | 503 |
| Women | 541 | 24 | 565 |
| Total | 994 | 74 | 1068 |
Source: own compilation based on questionnaires.
Table A3.
Contingency table for the variables: gender and crosswords (V = 0.209).
Table A3.
Contingency table for the variables: gender and crosswords (V = 0.209).
| Gender | Crosswords | Total | |
|---|---|---|---|
| No | Yes | ||
| Men | 457 | 46 | 503 |
| Women | 495 | 70 | 565 |
| Total | 952 | 116 | 1068 |
Source: own compilation based on questionnaires.
Table A4.
Contingency table for the variables: gender and housework (V = 0.441).
Table A4.
Contingency table for the variables: gender and housework (V = 0.441).
| Gender | Housework | Total | |
|---|---|---|---|
| No | Yes | ||
| Men | 406 | 97 | 503 |
| Women | 309 | 256 | 565 |
| Total | 715 | 353 | 1068 |
Source: own compilation based on questionnaires.
Table A5.
Contingency table for variables: gender and meeting/chatting with friends/family via internet/phone (V = 0.220).
Table A5.
Contingency table for variables: gender and meeting/chatting with friends/family via internet/phone (V = 0.220).
| Gender | Meetings/Conversations with Friends/Family via Internet/Telephone | Total | |
|---|---|---|---|
| No | Yes | ||
| Men | 384 | 119 | 503 |
| Women | 485 | 80 | 565 |
| Total | 869 | 199 | 1068 |
Source: own compilation based on questionnaires.
Table A6.
Contingency table for the variables: age and walks (V = 0.218).
Table A6.
Contingency table for the variables: age and walks (V = 0.218).
| Age | Walks | Total | |
|---|---|---|---|
| No | Yes | ||
| 18–29 | 86 | 70 | 156 |
| 30–44 | 132 | 142 | 274 |
| 45–59 | 94 | 137 | 231 |
| 60+ | 161 | 246 | 407 |
| Total | 473 | 595 | 1068 |
Source: own compilation based on questionnaires.
Table A7.
Contingency table for the variables age and running (V = 0.208).
Table A7.
Contingency table for the variables age and running (V = 0.208).
| Age | Running | Total | |
|---|---|---|---|
| No | Yes | ||
| 18–29 | 125 | 31 | 156 |
| 30–44 | 220 | 54 | 274 |
| 45–59 | 200 | 31 | 231 |
| 60+ | 372 | 35 | 407 |
| Total | 917 | 151 | 1068 |
Source: own compilation based on questionnaires.
Table A8.
Contingency table for the variables: age and cycling (V = 0.215).
Table A8.
Contingency table for the variables: age and cycling (V = 0.215).
| Age | Cycling | Total | |
|---|---|---|---|
| No | Yes | ||
| 18–29 | 104 | 52 | 156 |
| 30–44 | 169 | 105 | 274 |
| 45–59 | 151 | 80 | 231 |
| 60+ | 298 | 109 | 407 |
| Total | 722 | 346 | 1068 |
Source: own compilation based on questionnaires.
Table A9.
Contingency table for variables: age and plot/garden work (V = 0.246).
Table A9.
Contingency table for variables: age and plot/garden work (V = 0.246).
| Age | Plot/Garden Work | Total | |
|---|---|---|---|
| No | Yes | ||
| 18–29 | 145 | 11 | 156 |
| 30–44 | 243 | 31 | 274 |
| 45–59 | 175 | 56 | 231 |
| 60+ | 276 | 131 | 407 |
| Total | 839 | 229 | 1068 |
Source: own compilation based on questionnaires.
Table A10.
Contingency table for variables: age and book reading (V = 0.213).
Table A10.
Contingency table for variables: age and book reading (V = 0.213).
| Age | Book Reading | Total | |
|---|---|---|---|
| No | Yes | ||
| 18–29 | 115 | 41 | 156 |
| 30–44 | 196 | 78 | 274 |
| 45–59 | 143 | 88 | 231 |
| 60+ | 249 | 158 | 407 |
| Total | 703 | 365 | 1068 |
Source: own compilation based on questionnaires.
Table A11.
Contingency table for the variables: age and TV watching (V = 0.255).
Table A11.
Contingency table for the variables: age and TV watching (V = 0.255).
| Age | Tv Watching | Total | |
|---|---|---|---|
| No | Yes | ||
| 18–29 | 81 | 75 | 156 |
| 30–44 | 122 | 152 | 274 |
| 45–59 | 92 | 139 | 231 |
| 60+ | 139 | 268 | 407 |
| Total | 434 | 634 | 1068 |
Source: own compilation based on questionnaires.
Table A12.
Contingency table for the variables: age and housework (V = 0.224).
Table A12.
Contingency table for the variables: age and housework (V = 0.224).
| Age | Housework | Total | |
|---|---|---|---|
| No | Yes | ||
| 18–29 | 121 | 35 | 156 |
| 30–44 | 188 | 86 | 274 |
| 45–59 | 163 | 68 | 231 |
| 60+ | 243 | 164 | 407 |
| Ogółem | 715 | 353 | 1068 |
Source: own compilation based on questionnaires.
Table A13.
Contingency table for the variables: education and cycling (V = 0.219).
Table A13.
Contingency table for the variables: education and cycling (V = 0.219).
| Education | Cycling | Total | |
|---|---|---|---|
| No | Yes | ||
| primary | 21 | 4 | 25 |
| vocational | 124 | 44 | 168 |
| secondary | 335 | 159 | 494 |
| higher | 242 | 139 | 381 |
| Total | 722 | 346 | 1068 |
Source: own compilation based on questionnaires.
Table A14.
Contingency table for the variables: education and book reading (V = 0.228).
Table A14.
Contingency table for the variables: education and book reading (V = 0.228).
| Education | Book Reading | Total | |
|---|---|---|---|
| No | Yes | ||
| primary | 21 | 4 | 25 |
| vocational | 124 | 44 | 168 |
| secondary | 334 | 160 | 494 |
| higher | 224 | 157 | 381 |
| Total | 703 | 365 | 1068 |
Source: own compilation based on questionnaires.
Table A15.
Contingency table for the variables: education and TV watching (V = 0.288).
Table A15.
Contingency table for the variables: education and TV watching (V = 0.288).
| Education | TV Watching | Ogółem | |
|---|---|---|---|
| No | Yes | ||
| primary | 6 | 19 | 25 |
| vocational | 54 | 114 | 168 |
| secondary | 204 | 290 | 494 |
| higher | 170 | 211 | 381 |
| Total | 434 | 634 | 1068 |
Source: own compilation based on questionnaires.
Table A16.
Contingency table for the variables: education and leisure in neighbouring/non-neighbouring municipalities (V = 0.254).
Table A16.
Contingency table for the variables: education and leisure in neighbouring/non-neighbouring municipalities (V = 0.254).
| Education | Leisure in Neighbouring/Non-Neighbouring Municipalities | Total | |
|---|---|---|---|
| No | Yes | ||
| primary | 23 | 2 | 25 |
| vocational | 118 | 50 | 168 |
| secondary | 333 | 161 | 494 |
| higher | 213 | 168 | 381 |
| Total | 687 | 381 | 1068 |
Source: own compilation based on questionnaires.
References
- Bąk, I. Tourist activity of pensioners in Poland in 2009: A statistical analysis. Folia Oeconomica Stetin. 2011, 10, 155–168. [Google Scholar] [CrossRef]
- Gau, L.S.; Duong, P.T.; Kim, J.C. Parallel Leisure Sport Activities Diversity with Economic, Social and Human Development Indicators. Soc. Indic. Res. 2022, 164, 1403–1425. [Google Scholar] [CrossRef]
- Ku, P.-W.; Fox, K.R.; Li, C.-J.; Chen, L.-J. Leisure-Time Physical Activity, Sedentary Behaviors and Subjective Well-Being in Older Adults: An Eight-Year Longitudinal Research. Soc. Indic. Res. 2016, 127, 1349–1361. [Google Scholar] [CrossRef]
- Butson, M.; Jeanes, R.; O’Connor, J. Experiences of older adults leisure-time physical activity in aquatic and leisure facilities. World Leis. J. 2024, 1–21. [Google Scholar] [CrossRef]
- Netuveli, G.; Blane, D. Quality of life in older ages. Br. Med Bull. 2008, 85, 113–126. [Google Scholar] [CrossRef] [PubMed]
- Principi, A.; Santini, S.; Socci, M.; Smeaton, D.; Cahill, K.E.; Vegeris, S.; Barnes, H. Retirement plans and active ageing: Perspectives in three countries. Ageing Soc. 2018, 38, 56–82. [Google Scholar] [CrossRef]
- Skoog, I. 70 är det nya 50. Rapport 21; Delegationen för Senior Arbetskraft: Sztokholm, Sweden, 2020. [Google Scholar]
- Vilhelmson, B.; Thulin, E.; Elldér, E. Is ageing becoming more active? Exploring cohort-wise changes in everyday time use among the older population in Sweden. Eur. J. Ageing 2022, 19, 447–461. [Google Scholar] [CrossRef]
- Bąk, I. Statystyczna Analiza Aktywności Turystycznej Seniorów w Polsce; Zachodniopomorski Uniwersytet Technologiczny w Szczecinie: Szczecin, Poland, 2013. [Google Scholar]
- Goodin, R.E.; Rice, J.M.; Bittman, M.; Saunders, P. The Time-Pressure Illusion: Discretionary Time vs. Free Time. Soc. Indic. Res. 2005, 73, 43–70. [Google Scholar] [CrossRef]
- Bittman, M.; Wajcman, J. The Rush Hour: The Character of Leisure Time and Gender Equity. Soc. Forces 2000, 79, 165–189. [Google Scholar] [CrossRef]
- Veal, A.J. Joffre Dumazedier and the definition of leisure. Loisir Soc. Leis. 2019, 42, 187–200. [Google Scholar] [CrossRef]
- Bibik, L.; Markovich, M. Changes Occurring in the Structure of Free Time. Sov. Sociol. 1962, 1, 38–40. [Google Scholar] [CrossRef]
- Aran, S. A Case Study on Defining Leisure Time Motivation of Recreation Students. Procedia-Soc. Behav. Sci. 2014, 152, 734–739. [Google Scholar] [CrossRef][Green Version]
- Ettema, D.; Schwanen, T. A relational approach to analysing leisure travel. J. Transp. Geogr. 2012, 24, 173–181. [Google Scholar] [CrossRef]
- Charmes, J. Variety and change of patterns in the gender balance between unpaid care-work, paid work and free time across the world and over time: A measure of wellbeing? Wellbeing Space Soc. 2022, 3, 100081. [Google Scholar] [CrossRef]
- Iulian-Doru, T.; Vasilica, G.; Maria, T. The Importance of Group Sports Activities in Adult Lifelong Education and in Improving the Quality of Life. Procedia-Soc. Behav. Sci. 2014, 117, 9–15. [Google Scholar] [CrossRef][Green Version]
- Wang, S.; Berbekova, A.; Uysal, M. Pursuing justice and quality of life: Supporting tourism. Tour. Manag. 2022, 89, 104446. [Google Scholar] [CrossRef]
- Chen, X.; Kemperman, A.; Timmermans, H. Socio-demographics, neighborhood characteristics, time use, and leisure-time physical activity engagement patterns over the life course. SSM-Popul. Health 2022, 19, 101244. [Google Scholar] [CrossRef]
- Veledo, M.B.S.P.; Manrique, I.L.; Coto, I.F.; González, Y.D.C.; Martínez, B.S.; González, A.I. Social Sciences, Art and Physical Activity in Leisure Environments. An Inter-Disciplinary Project for Teacher Training. Sustainability 2018, 10, 1786. [Google Scholar] [CrossRef]
- Wiese, C.W.; Kuykendall, L.; Tay, L. Get active? A meta-analysis of leisure-time physical activity and subjective well-being. J. Posit. Psychol. 2017, 13, 57–66. [Google Scholar] [CrossRef]
- de Paula Couto, M.C.P.; Ekerdt, D.J.; Fung, H.H.; Hess, T.M.; Rothermund, K. What will you do with all that time? Changes in leisure activities after retirement are determined by age-related self-views and preparation. Acta Psychol. 2022, 231, 103795. [Google Scholar] [CrossRef] [PubMed]
- Faílde Garrido, J.M.; Dapía Conde, M.D.; Vázquez Vázquez, M.Á.; Vázquez Rodríguez, L. Are Older Adults’ Leisure Patterns Consistent with the Active Ageing Model? The Influence of the Ageist Stereotypes. Soc. Policy Soc. 2022, 21, 575–596. [Google Scholar] [CrossRef]
- Biernat, E.; Tomaszewski, P. Socio-demographic and leisure activity determinants of physical activity of working Warsaw residents aged 60 to 69 years. J. Hum. Kinet. 2011, 30, 173–181. [Google Scholar] [CrossRef]
- Baj-Korpak, J.; Różański, P.; Soroka, A.; Wysokińska, E. Motives and barriers to the participation of older people in recreational activity. Soc. Diss. 2013, 7, 131–136. [Google Scholar]
- Gümüş, H.; Erbaş, Ü. The relationship between leisure activity types selected by older adults and their income. Stud. Perieget. 2020, 29, 87–98. [Google Scholar] [CrossRef]
- Kim, T.; Choo, S.; Shin, Y.; Park, M.; You, S. Identifying differences of travel time budgets between the elderly and the nonelderly groups using PSL structural equation models: A case study for Seoul metropolitan area. Int. J. Sustain. Transp. 2015, 10, 455–465. [Google Scholar] [CrossRef]
- Angus, J.; Reeve, P. Ageism: A Threat to “Aging Well” in the 21st Century. J. Appl. Gerontol. 2006, 25, 137–152. [Google Scholar] [CrossRef]
- Fasel, N.; Vauclair, M.; Lima, M.L.; Abrams, D. The relative importance of personal beliefs, meta-stereotypes and societal stereotypes of age for the wellbeing of older people. Ageing Soc. 2020, 41, 2768–2791. [Google Scholar] [CrossRef]
- Cai, J.; Hu, T.; Zhou, L.; Jiang, H.; Gao, Y. Effects of leisure activities and general health on the survival of older people: A cohort study in China. Front. Public Health 2023, 11, 1273074. [Google Scholar] [CrossRef] [PubMed]
- Bone, J.K.; Bu, F.; Sonke, J.K.; Fancourt, D. Leisure engagement in older age is related to objective and subjective experiences of aging. Nat. Commun. 2024, 15, 1499. [Google Scholar] [CrossRef]
- Grzega, U. Poziom Życia Ludności w Polsce-Determinanty i Zróżnicowania; Wydawnictwo Uniwersytetu Ekonomicznego w Katowicach: Katowice, Poland, 2012. [Google Scholar]
- Miłaszewicz, D.; Węgrzyn, G. Free Time and Its Use Depending on the Professional Status of Respondents–Selected Results of the Research on the Students’ Free Time; Prace Naukowe Uniwersytetu Ekonomicznego we Wrocławiu: Wrocław, Poland, 2020; pp. 104–115. [Google Scholar]
- Luong, T.; Maness, M. Leisure activity variety seeking as an instrumental outcome of social capital. Travel Behav. Soc. 2020, 31, 254–270. [Google Scholar] [CrossRef]
- Arentze, T.A. Individuals’ social preferences in joint activity location choice: A negotiation model and empirical evidence. J. Transp. Geogr. 2015, 48, 76–84. [Google Scholar] [CrossRef]
- Fang, C.-Y.; Chen, P.-Y.; Liao, Y. Factors influencing seniors’ willingness to pay intention for exercise in the civil sports and recreation centers. Front. Public Health 2023, 10, 992500. [Google Scholar] [CrossRef] [PubMed]
- Dong, H.; Zhang, J.; Cirillo, C. Exploring, understanding, and modeling the reciprocal relation between leisure and subjective well-being. Transp. Res. Part A Policy Pract. 2019, 130, 813–824. [Google Scholar] [CrossRef]
- Zins, A.H.; Ponocny, I. On the importance of leisure travel for psychosocial wellbeing. Ann. Tour. Res. 2020, 93, 103378. [Google Scholar] [CrossRef]
- Rodríguez, A.; Látková, P.; Sun, Y.-Y. The relationship between leisure and life satisfaction: Application of activity and need theory. Soc. Indic. Res. 2007, 86, 163–175. [Google Scholar] [CrossRef]
- Bergsma, W. A bias-correction for Cramér’s V and Tschuprow’s T. J. Korean Stat. Soc. 2013, 42, 323–328. [Google Scholar] [CrossRef]
- Ben-Shachar, M.S.; Patil, I.; Thériault, R.; Wiernik, B.M.; Lüdecke, D. Phi, Fei, Fo, Fum: Effect Sizes for Categorical Data That Use the Chi-Squared Statistic. Mathematics 2023, 11, 1982. [Google Scholar] [CrossRef]
- Greenacre, M. Theory Applications of Correspondence Analysis; Academic Press: London, UK, 1984; p. 145. [Google Scholar]
- Greenacre, M. Correspondence Analysis in Practice; Academic Press: London, UK, 1993. [Google Scholar]
- Greenacre, M. Multiple and Joint Correspondence Analysis, In Correspondence Analysis in Social Sciences. Recent Developments and Applications; Greenacre, M., Blasius, J., Eds.; Academic Press: San Diego, CA, USA, 1994; pp. 141–161. [Google Scholar]
- Greenacre, M.; Hastie, T. The Geometric Interpretation of Correspondence Analysis. J. Am. Stat. Assoc. 1987, 82, 437–447. [Google Scholar] [CrossRef]
- Andersen, E.B. The Statistical Analysis of Categorial Data; Springer: Berlin, Germany, 1991; p. 387. [Google Scholar]
- Kuc, M. He Use of Taxonomy Methods for Clustering European Union Countries Due to the Standard of Living. Oeconomia Copernic. 2012, 2, 5–24. [Google Scholar]
- Murtagh, F.; Legendre, P. Ward’s Hierarchical Agglomerative Clustering Method: Which Algorithms Implement Ward’s Criterion? J. Classif. 2014, 31, 274–295. [Google Scholar] [CrossRef]
- Strauss, T.; von Maltitz, M.J. Generalising Ward’s Method for Use with Manhattan Distances. PLoS ONE 2017, 12, e0168288. [Google Scholar] [CrossRef] [PubMed]
- Fernandes, A.A.R.; Solimum, S. Comparison of the Use of Linkage in Cluster Integration with Path Analysis Approach. Front. Appl. Math. Stat. 2022, 8, 790010. [Google Scholar] [CrossRef]
- Grabiński, T. Metody Taksonometrii; Akademia Ekonomiczna w Krakowie: Kraków, Poland, 1992. [Google Scholar]
- Santini, S.; Galassi, F.; Kropf, J.; Stara, V. A Digital Coach Promoting Healthy Aging Among Older Adults in Transition to Retirement: Results from a Qualitative Study in Italy. Sustainability 2020, 12, 7400. [Google Scholar] [CrossRef]
- Cerin, E.; Leslie, E.; Sugiyama, T.; Owen, N. Perceived Barriers to Leisure-Time Physical Activity in Adults: An Ecological Perspective. J. Phys. Act. Health 2010, 7, 451–459. [Google Scholar] [CrossRef] [PubMed]
- Xu, Y.; Liu, H.; Su, S.; Mao, P. Ageing Suitability Evaluation of Residential Districts Based on Active Ageing Theory. Buildings 2023, 13, 1041. [Google Scholar] [CrossRef]
- Illario, M.; Vollenbroek-Hutten, M.M.R.; Molloy, D.W.; Menditto, E.; Iaccarino, G.; Eklund, P. Active and Healthy Ageing and Independent Living. J. Aging Res. 2016, 2016, 8062079. [Google Scholar] [CrossRef]
- Paz, A.; Doron, I.; Tur-Sinai, A. Gender, aging, and the economics of “active aging”: Setting a new research agenda. J. Women Aging 2018, 30, 184–203. [Google Scholar] [CrossRef] [PubMed]
- Rantanen, T.; Portegijs, E.; Viljanen, A.; Eronen, J.; Saajanaho, M.; Tsai, L.-T.; Kauppinen, M.; Palonen, E.-M.; Sipilä, S.; Iwarsson, S.; et al. Individual and environmental factors underlying life space of older people–study protocol and design of a cohort study on life-space mobility in old age (LISPE). BMC Public Health 2012, 12, 1018. [Google Scholar] [CrossRef] [PubMed]
- Gan, D.R.Y. Neighborhood effects for aging in place: A transdisciplinary framework toward health-promoting settings. Hous. Soc. 2017, 44, 79–113. [Google Scholar] [CrossRef]
- McAuley, E.; Konopack, J.F.; Motl, R.W.; Morris, K.S.; Doerksen, S.E.; Rosengren, K.R. Physical activity and quality of life in older adults: Influence of health status and self-efficacy. Ann. Behav. Med. 2006, 31, 99–103. [Google Scholar] [CrossRef]
- Wiles, J.L.; Allen, R.E.S.; Palmer, A.J.; Hayman, K.J.; Keeling, S.; Kerse, N. Older people and their social spaces: A study of well-being and attachment to place in Aotearoa New Zealand. Soc. Sci. Med. 2009, 68, 664–671. [Google Scholar] [CrossRef] [PubMed]
- Wu, S.; Wu, W.; Xia, X.; Zhou, J. Characteristics of Physical Activities and Environmental Factor Preferences of Older Adults in Rural Resettlement Community in Ningbo, China. J. Environ. Public Health 2022, 2022, 5414384. [Google Scholar] [CrossRef] [PubMed]
- Zhai, Y.; Li, D.; Wang, D.; Shi, C. Seniors’ Physical Activity in Neighborhood Parks and Park Design Characteristics. Front. Public Health 2020, 8, 322. [Google Scholar] [CrossRef] [PubMed]
- Shaw, S.M. Gender, Leisure, and Constraint: Towards a Framework for the Analysis of Women’s Leisure. J. Leis. Res. 1994, 26, 8–22. [Google Scholar] [CrossRef]
- Mattingly, M.J.; Blanchi, S.M. Gender Differences in the Quantity and Quality of Free Time: The U.S. Experience. Soc. Forces 2003, 81, 999–1030. [Google Scholar] [CrossRef]
- Chatzitheochari, S.; Arber, S. Class, gender and time poverty: A time-use analysis of British workers’ free time resources. Br. J. Sociol. 2012, 63, 451–471. [Google Scholar] [CrossRef]
- Firestone, J.; Shelton, B.A. A comparison of women’s and men’s leisure time: Subtle effects of the double day. Leis. Sci. 1994, 16, 45–60. [Google Scholar] [CrossRef]
- Beck, M.E.; Arnold, J.E. Gendered time use at home: An ethnographic examination of leisure time in middle-class families. Leis. Stud. 2009, 28, 121–142. [Google Scholar] [CrossRef]
- Hawash, M.; Khalil, M. Factors affecting Post-retirement Satisfaction of Community-Dwelling Older Adults. Alex. Sci. Nurs. J. 2017, 19, 103–118. [Google Scholar] [CrossRef]
Disclaimer/Publisher’s Note: The statements, opinions and data contained in all publications are solely those of the individual author(s) and contributor(s) and not of MDPI and/or the editor(s). MDPI and/or the editor(s) disclaim responsibility for any injury to people or property resulting from any ideas, methods, instructions or products referred to in the content. |
© 2025 by the authors. Licensee MDPI, Basel, Switzerland. This article is an open access article distributed under the terms and conditions of the Creative Commons Attribution (CC BY) license (https://creativecommons.org/licenses/by/4.0/).