
GIS-Based Suitability Assessment for the Ecological Restoration of Oyster Reefs: A Case Study of the Tianjin Coast in Bohai Bay


Abstract
1. Introduction
2. Methods
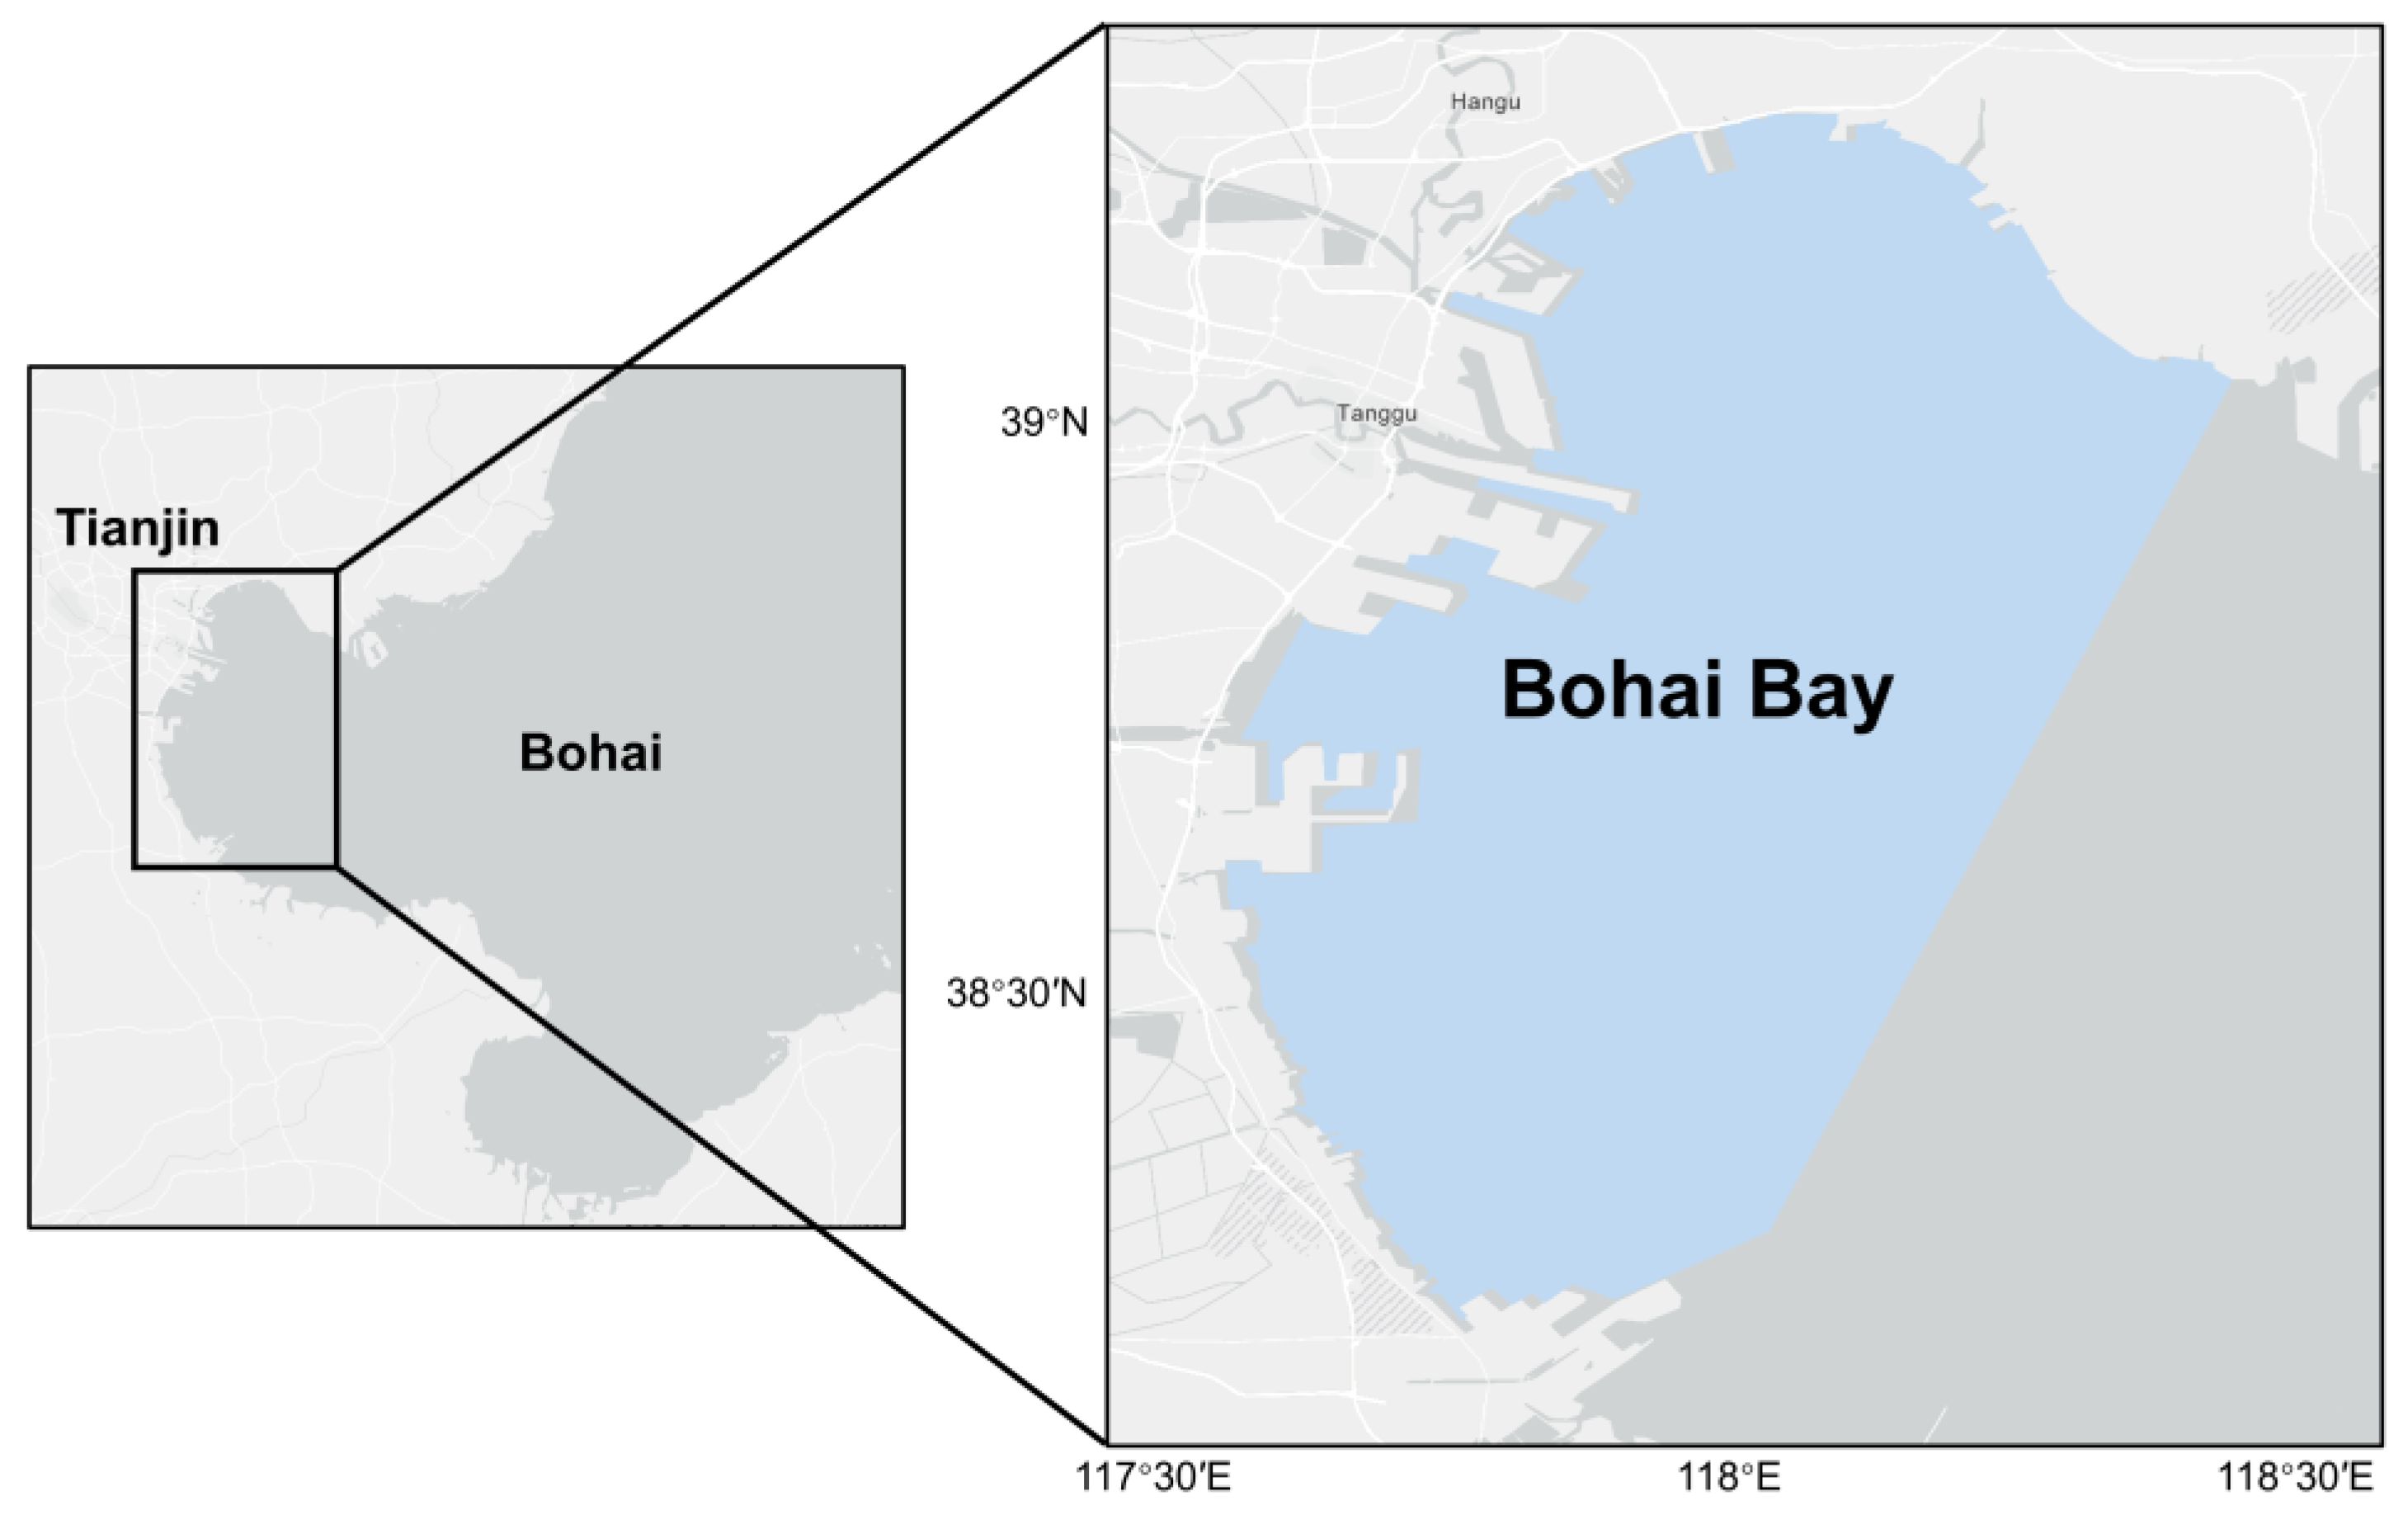
2.1. Study Area
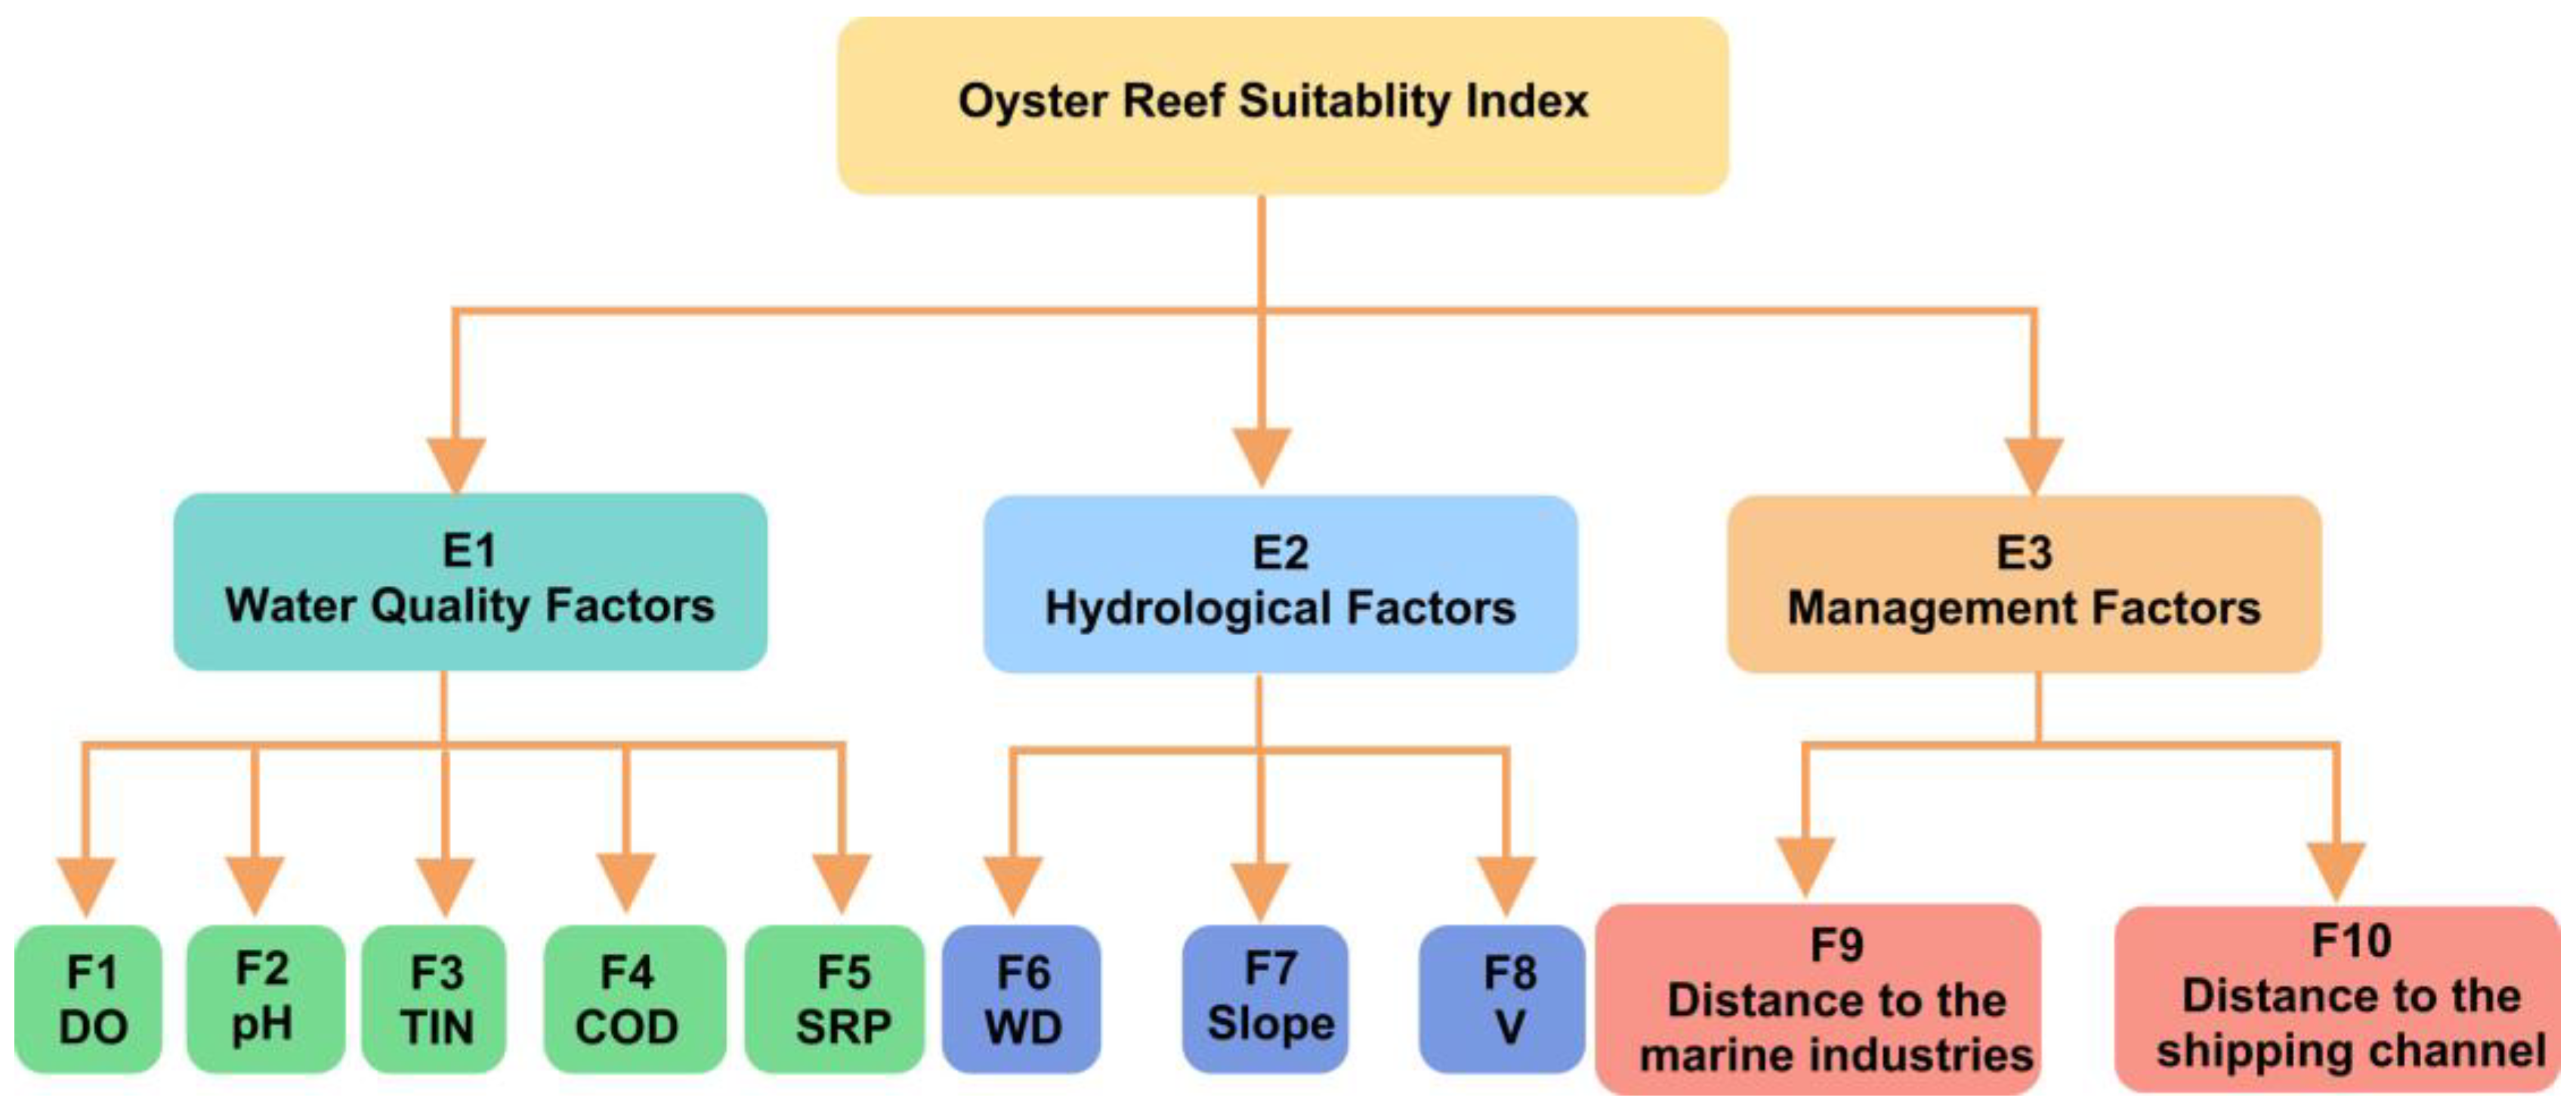
2.2. Evaluation System and Determination of Indicator Weights by Using the AHP Method
2.3. Indicator Suitability Functions
2.4. Data Sources
2.5. GIS Model Construction
2.6. Sensitivity Analysis and Validation of Suitability Index Maps
3. Results and Discussion
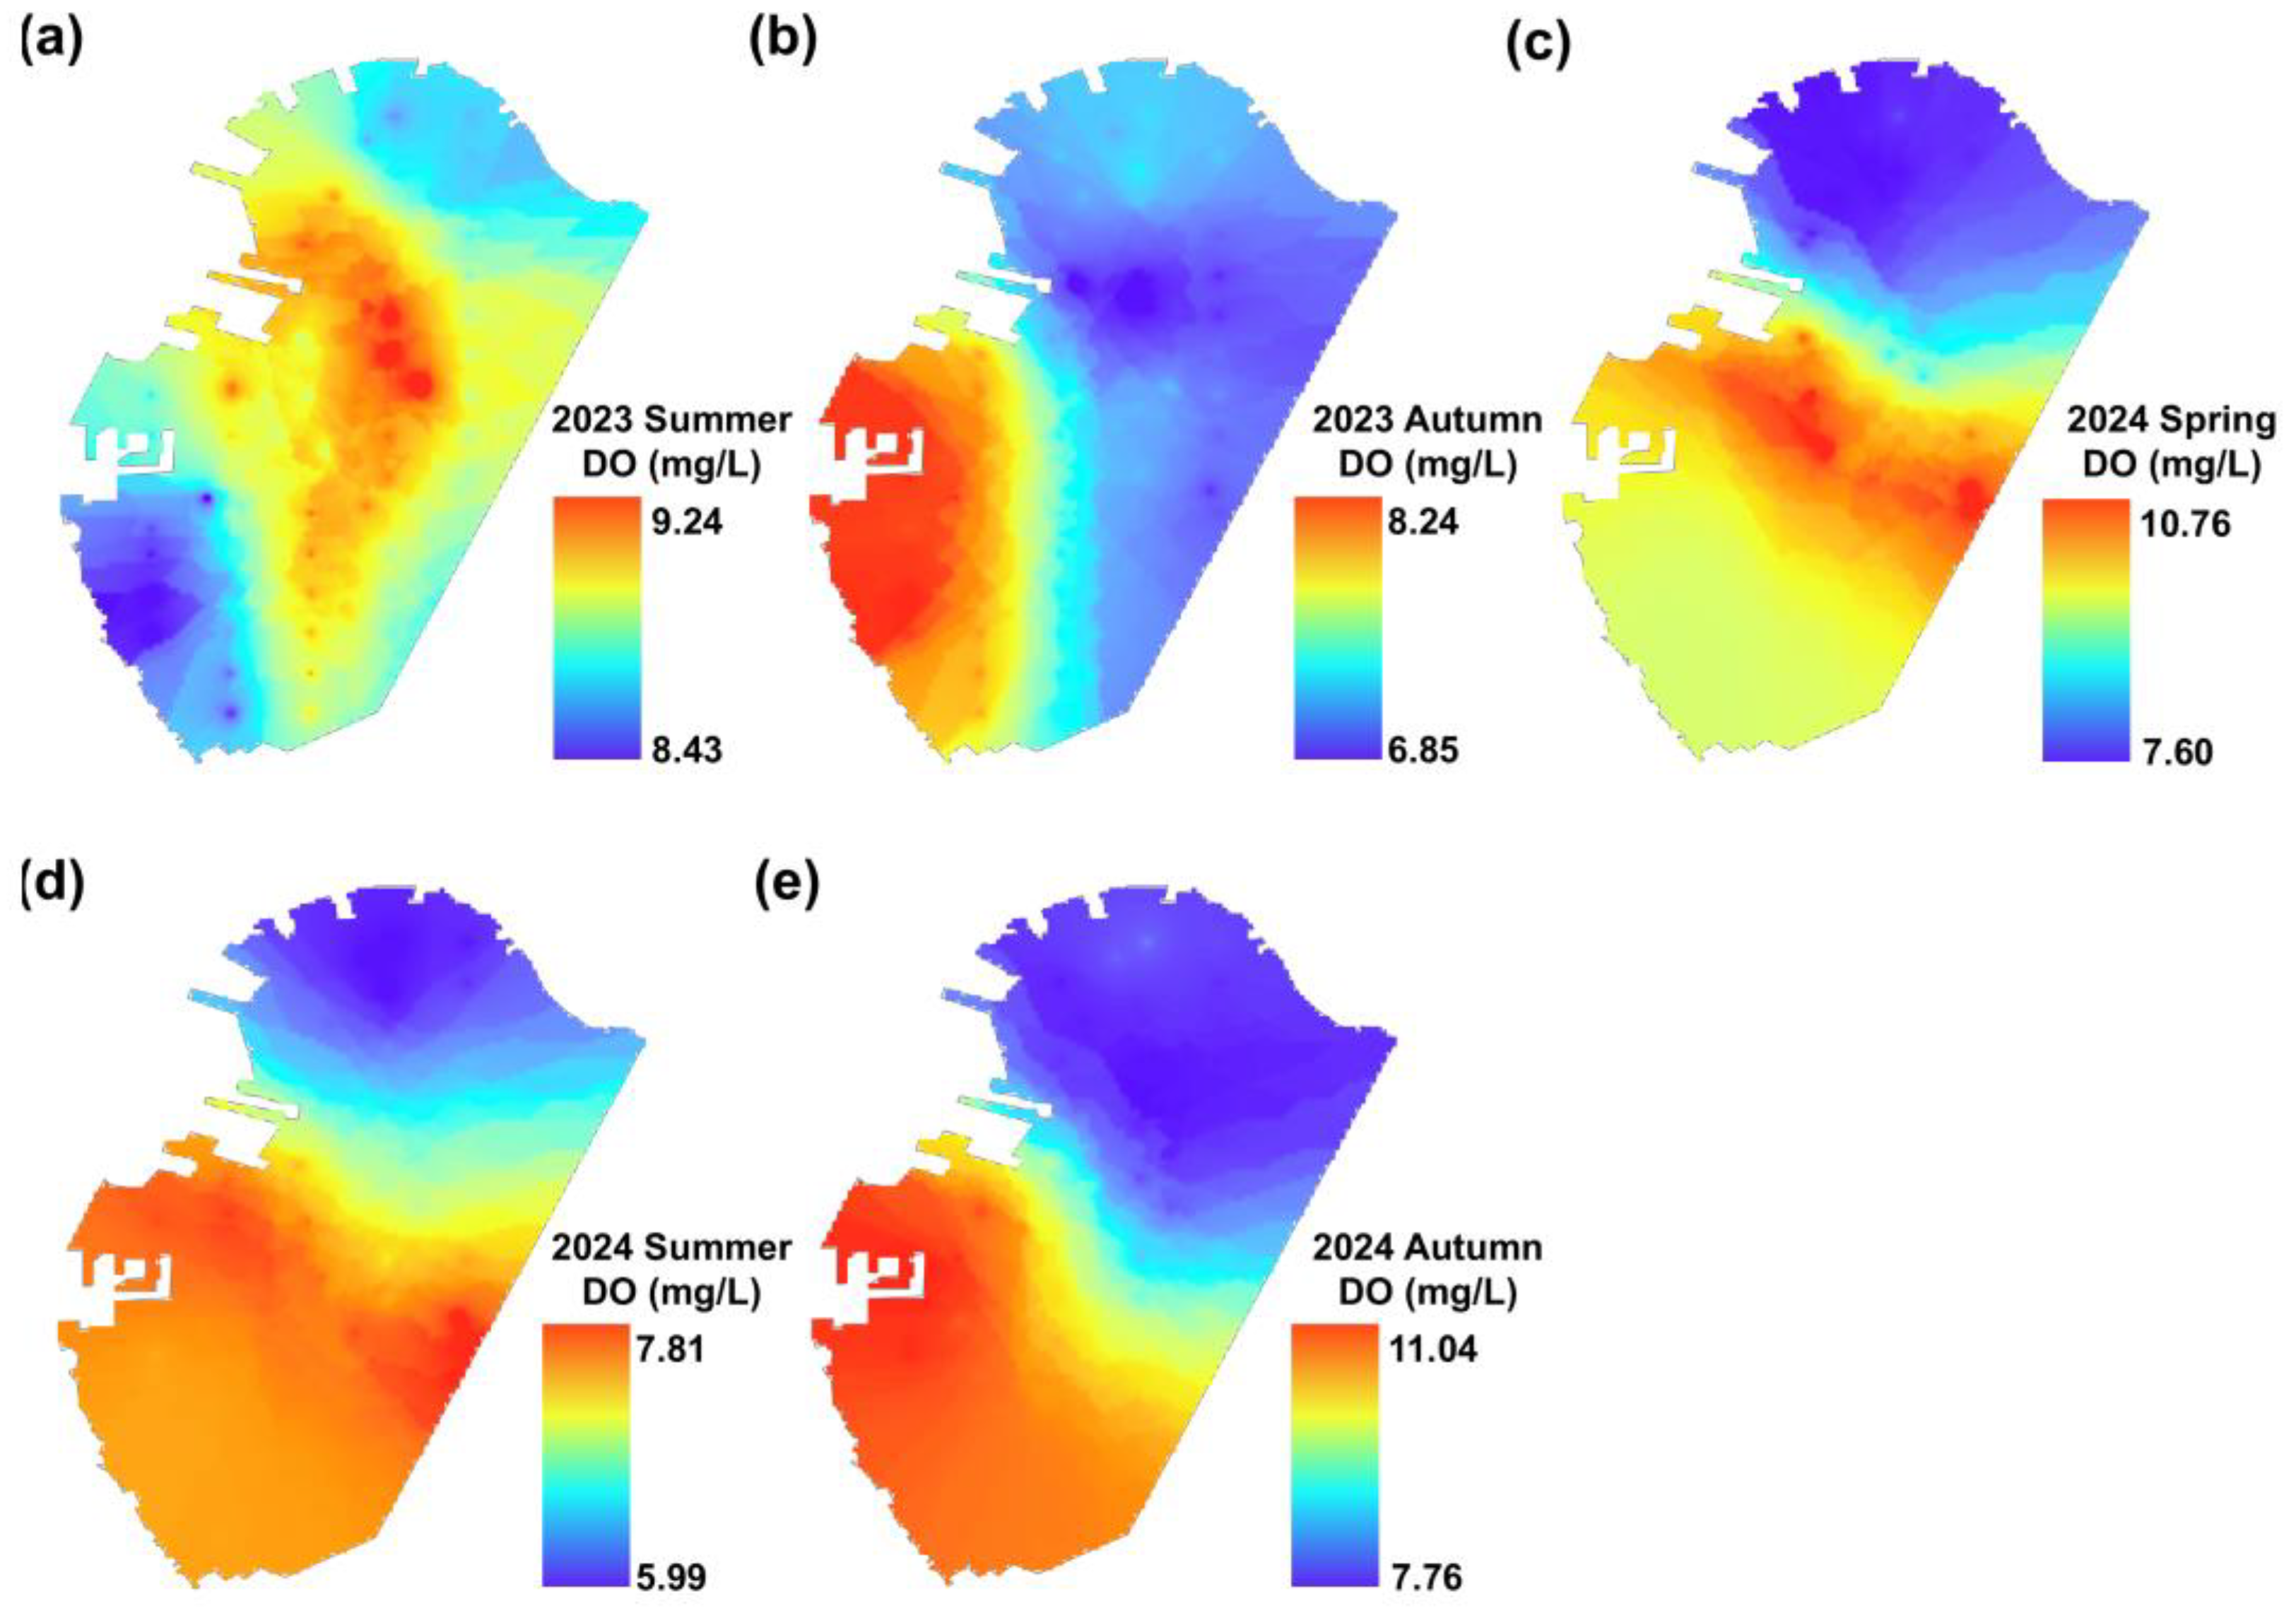
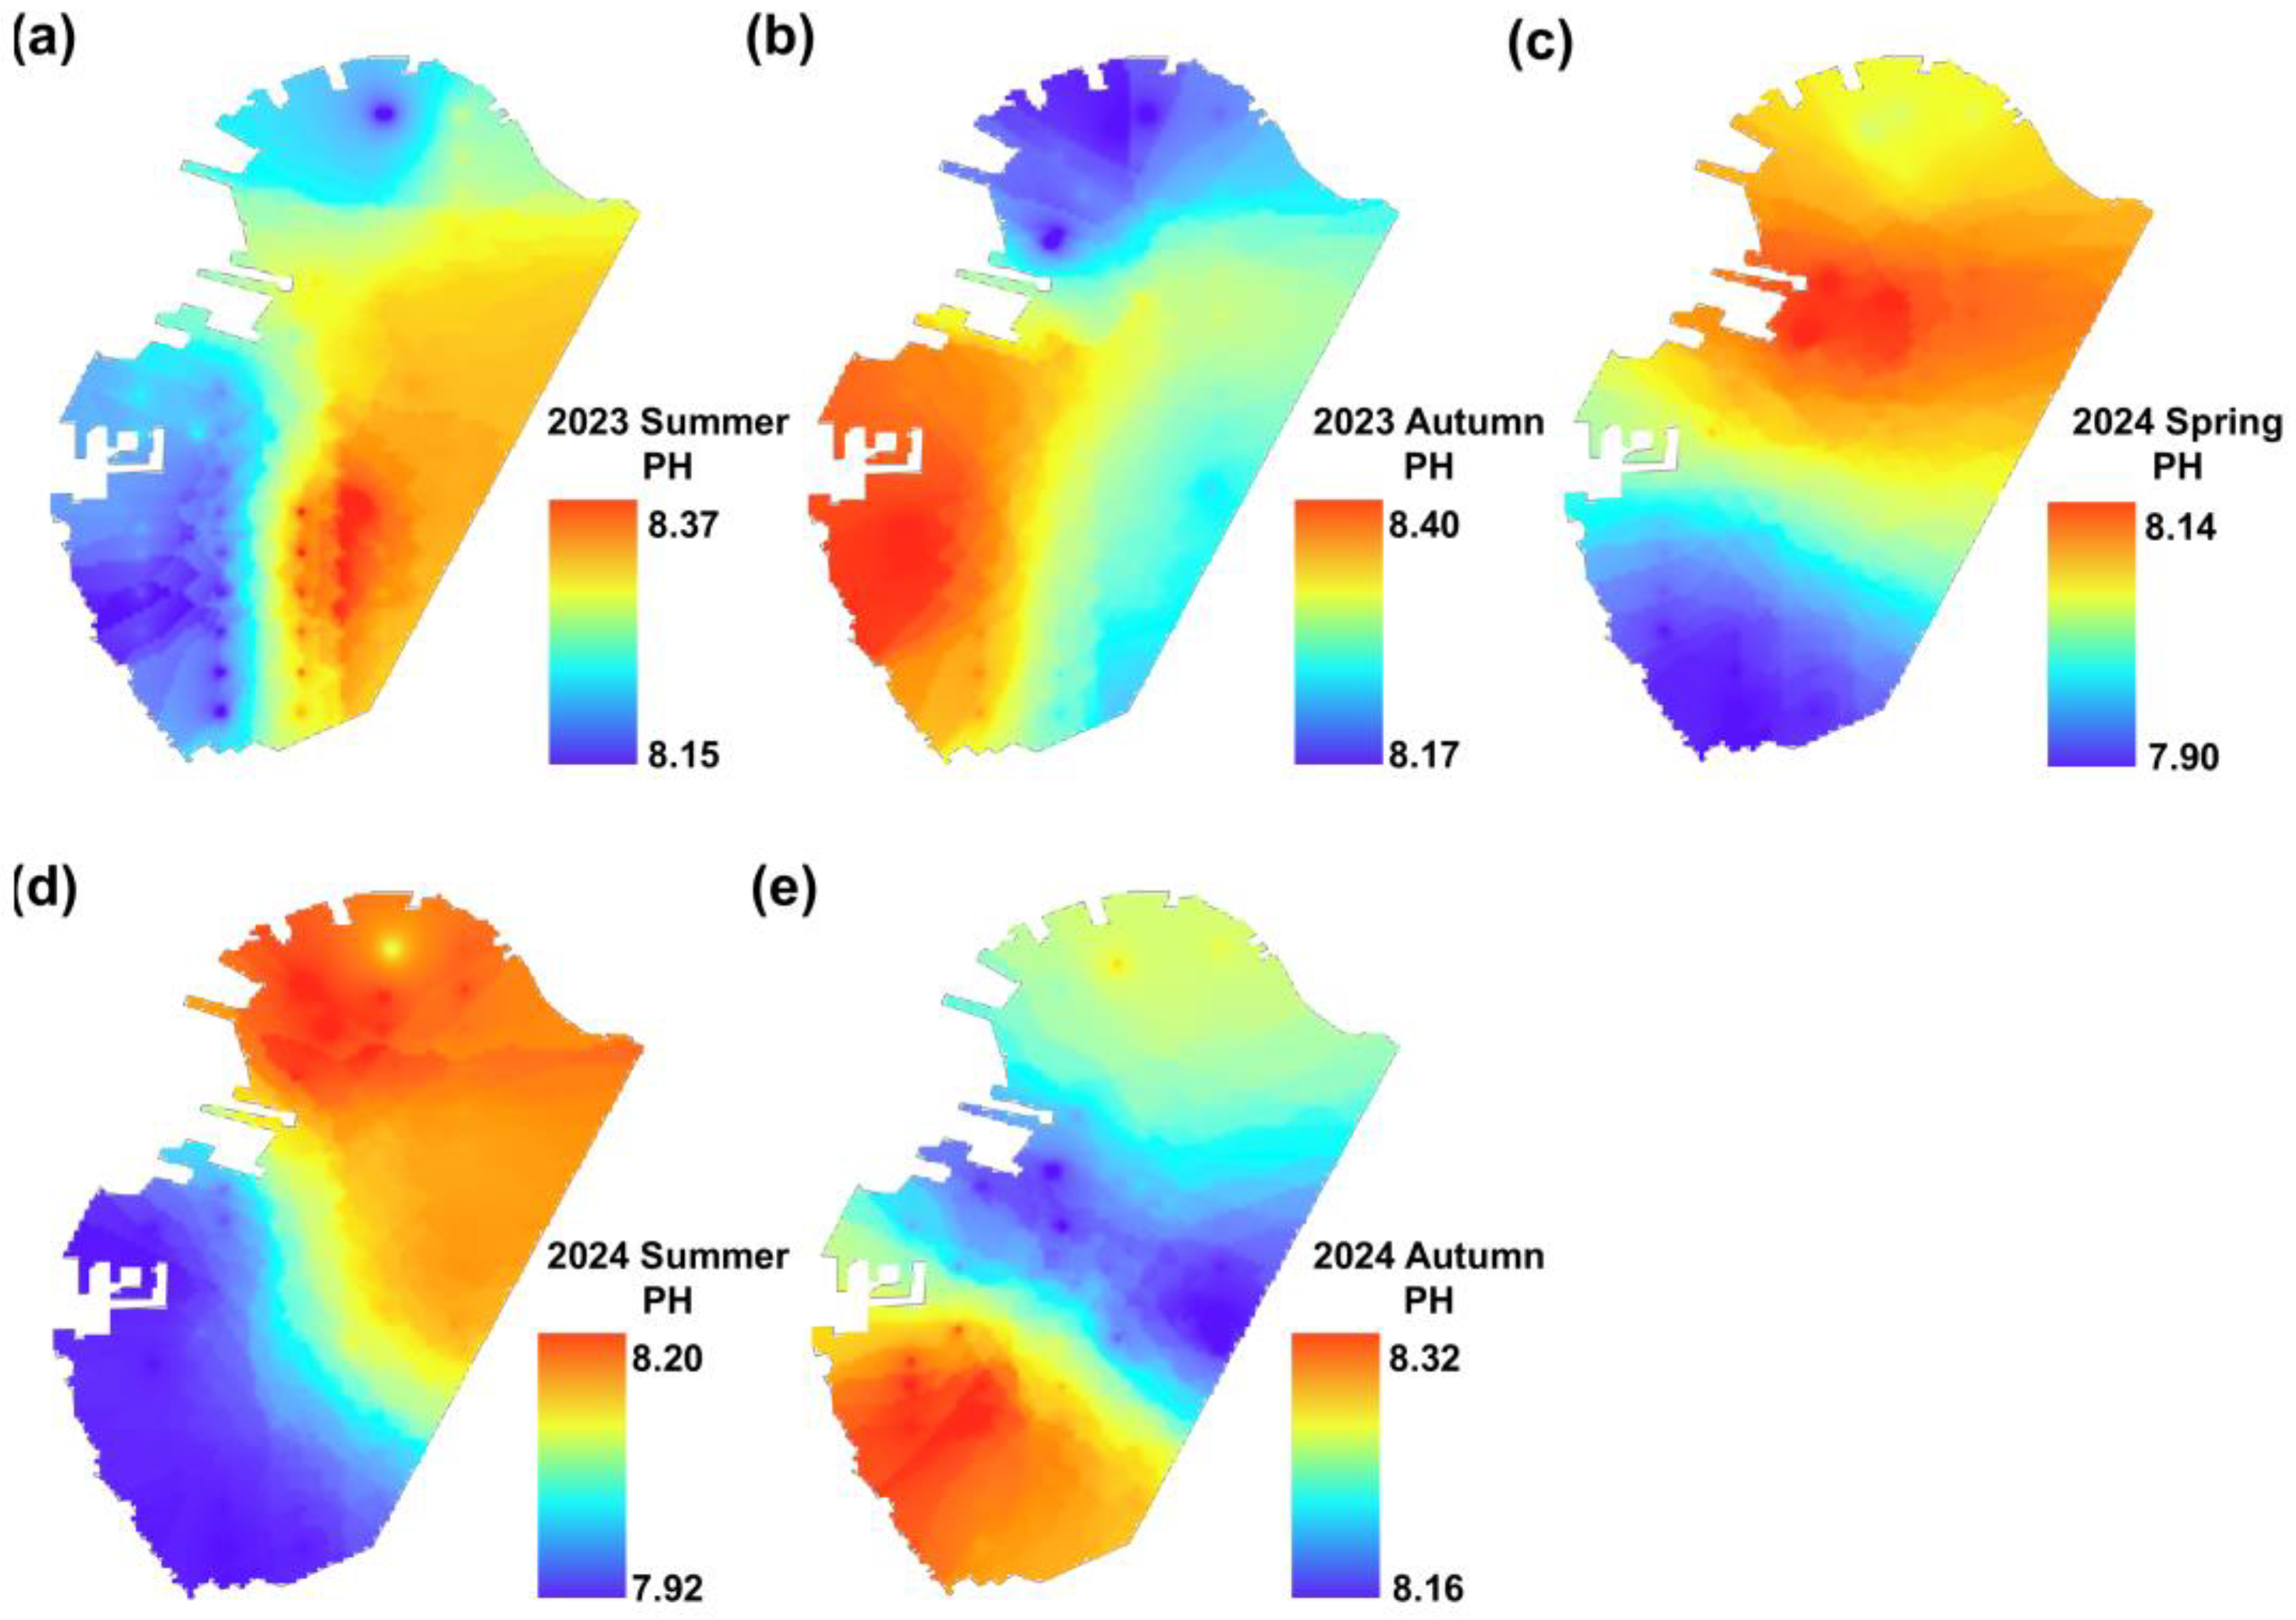
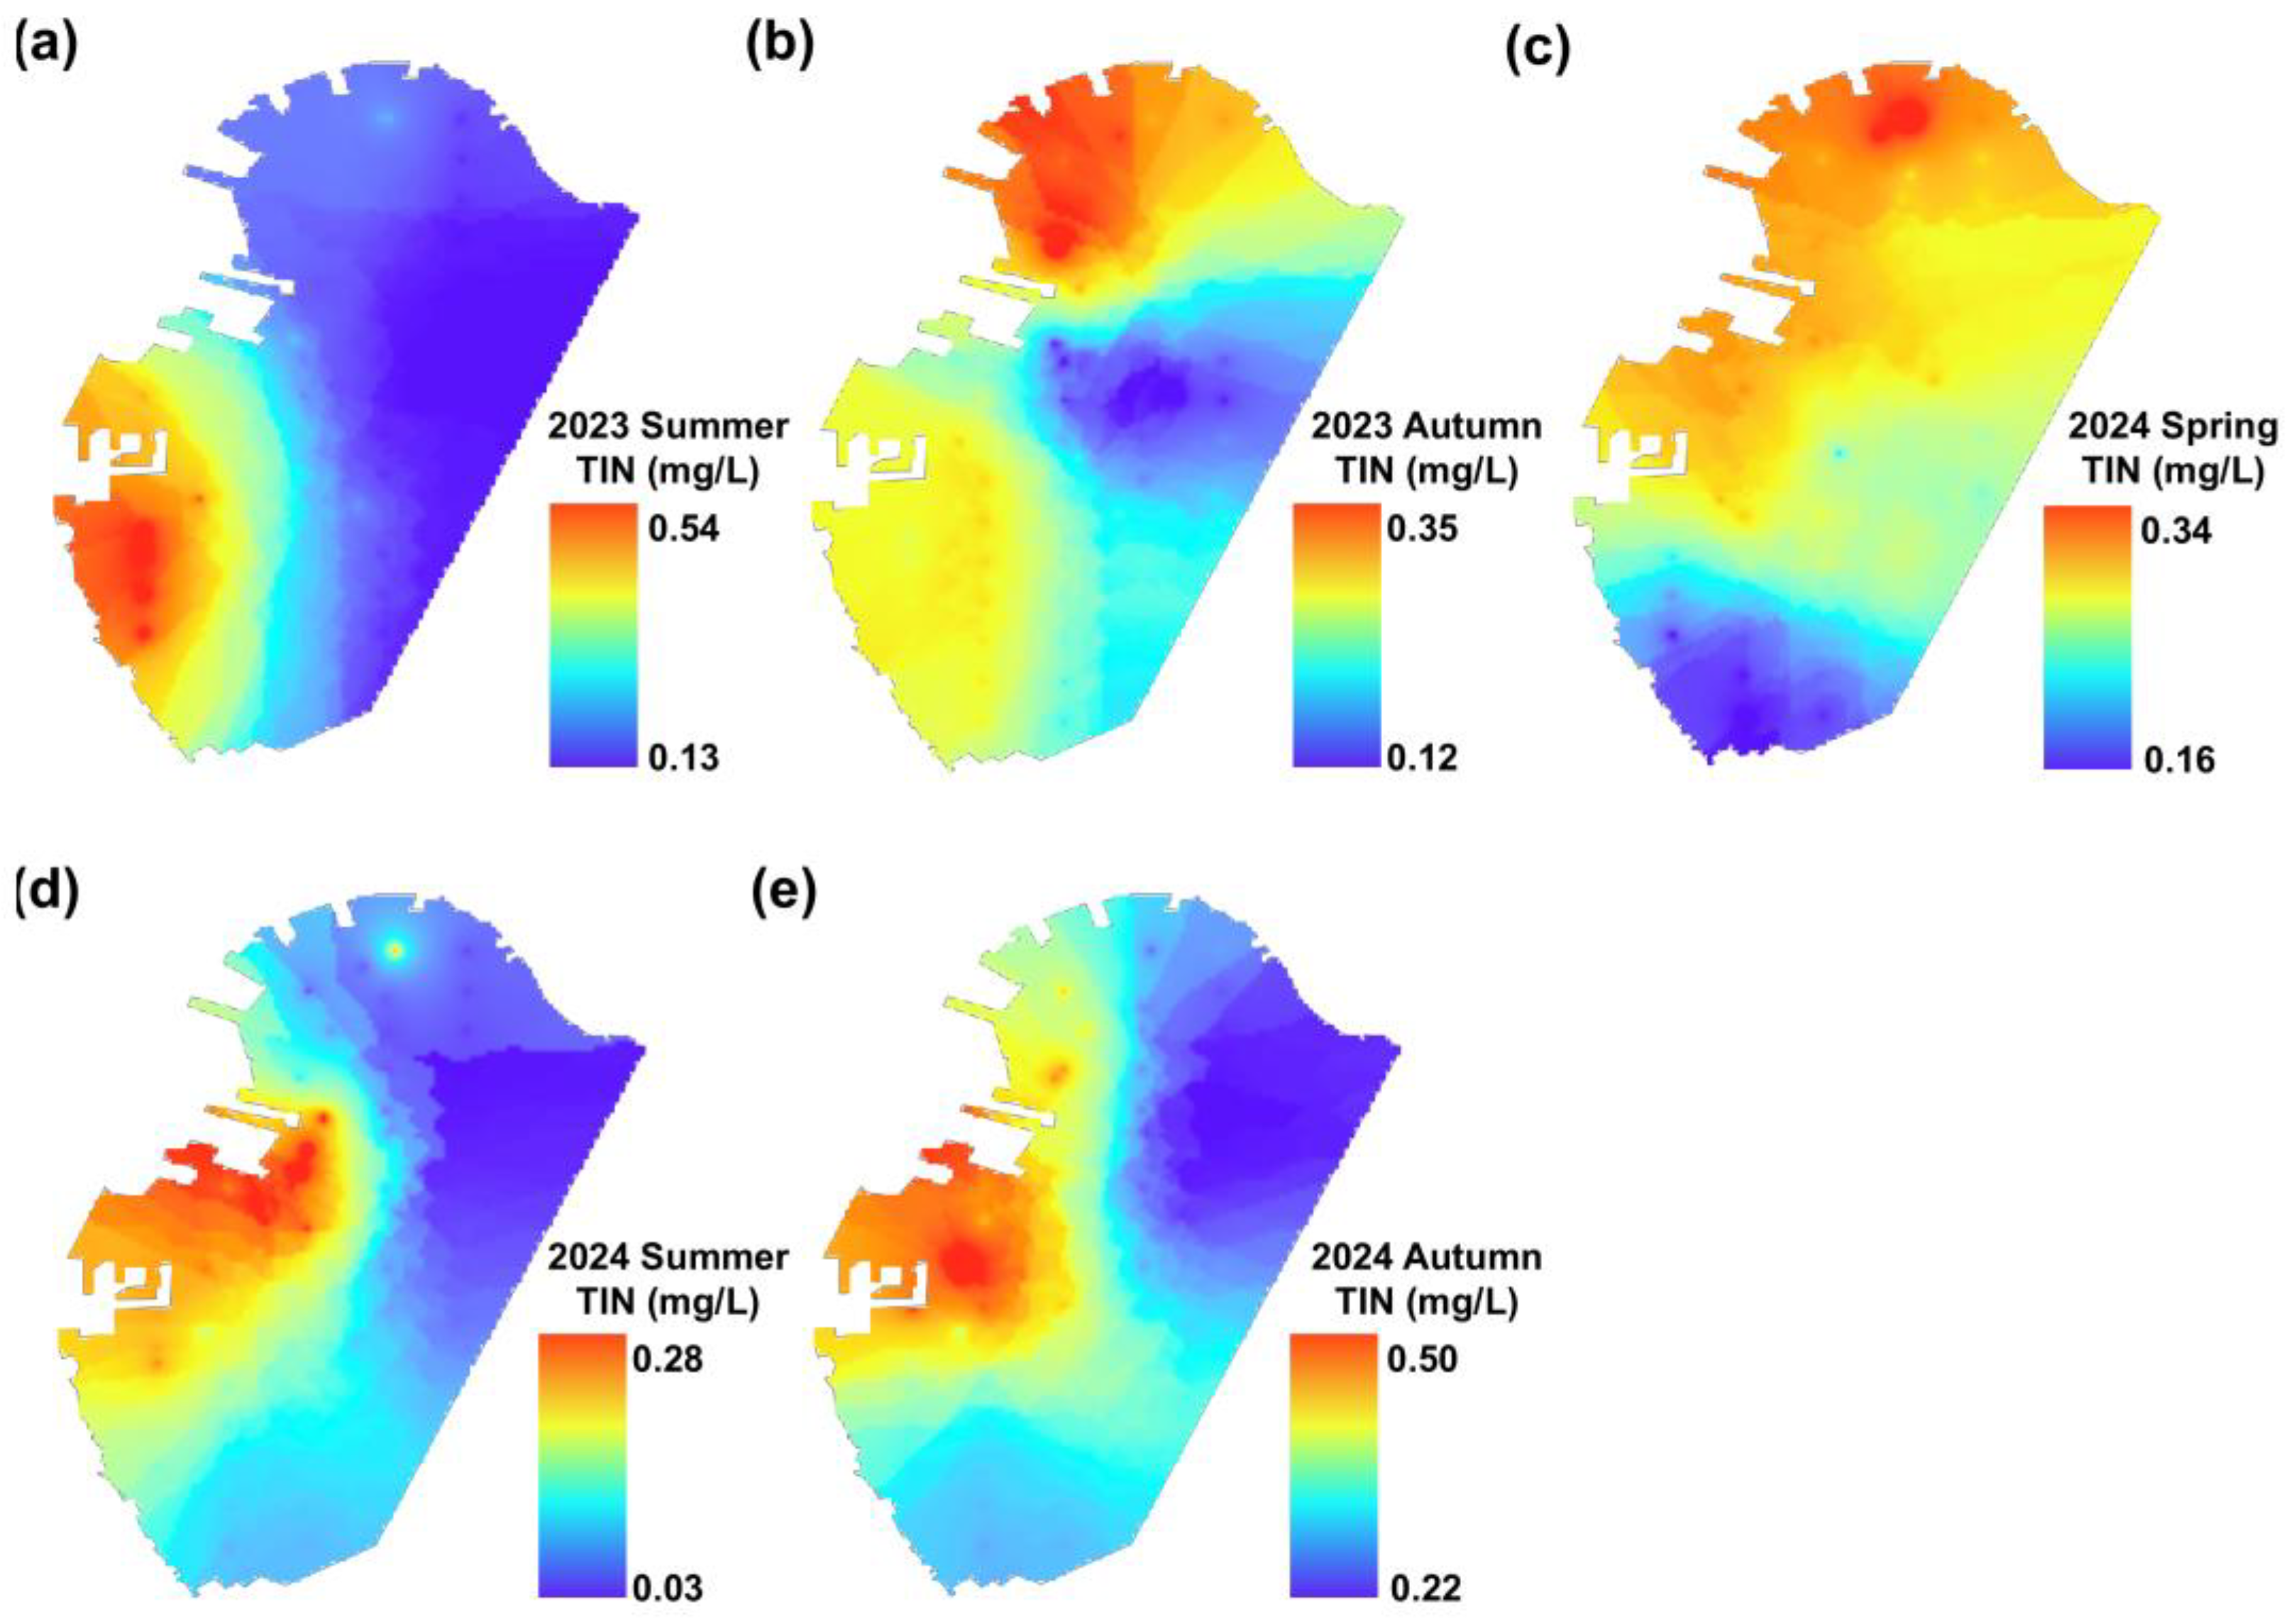
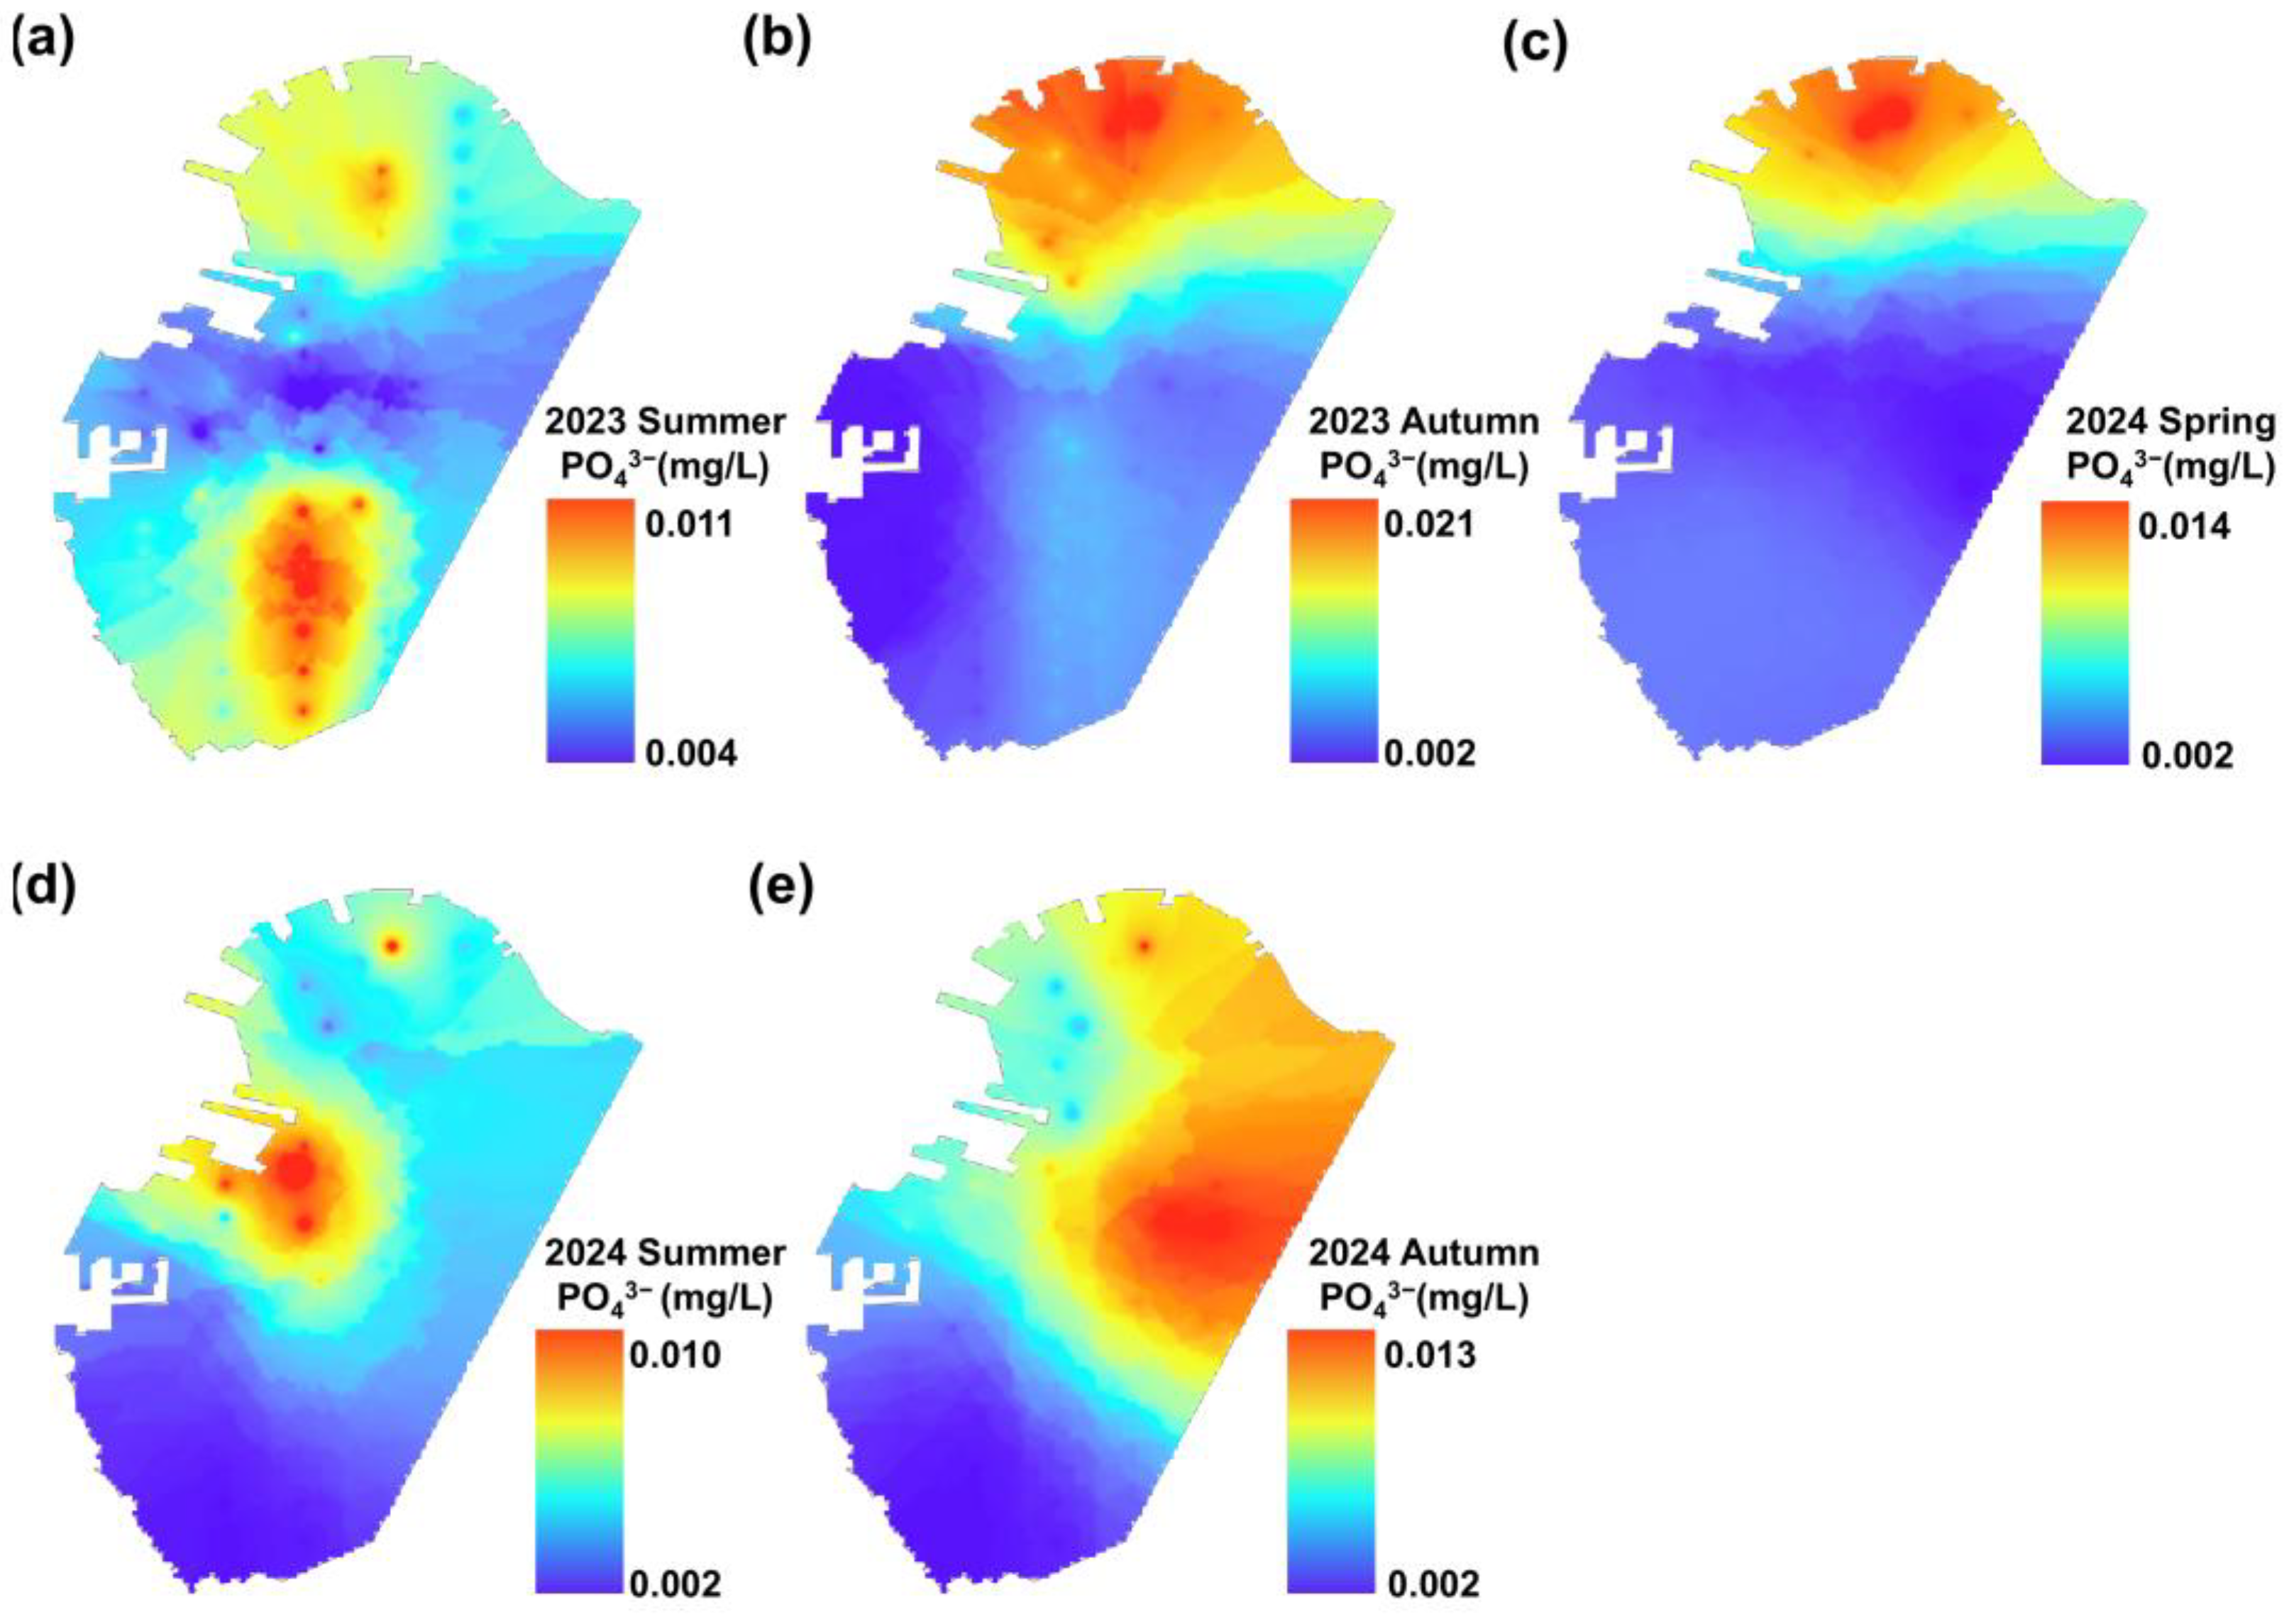
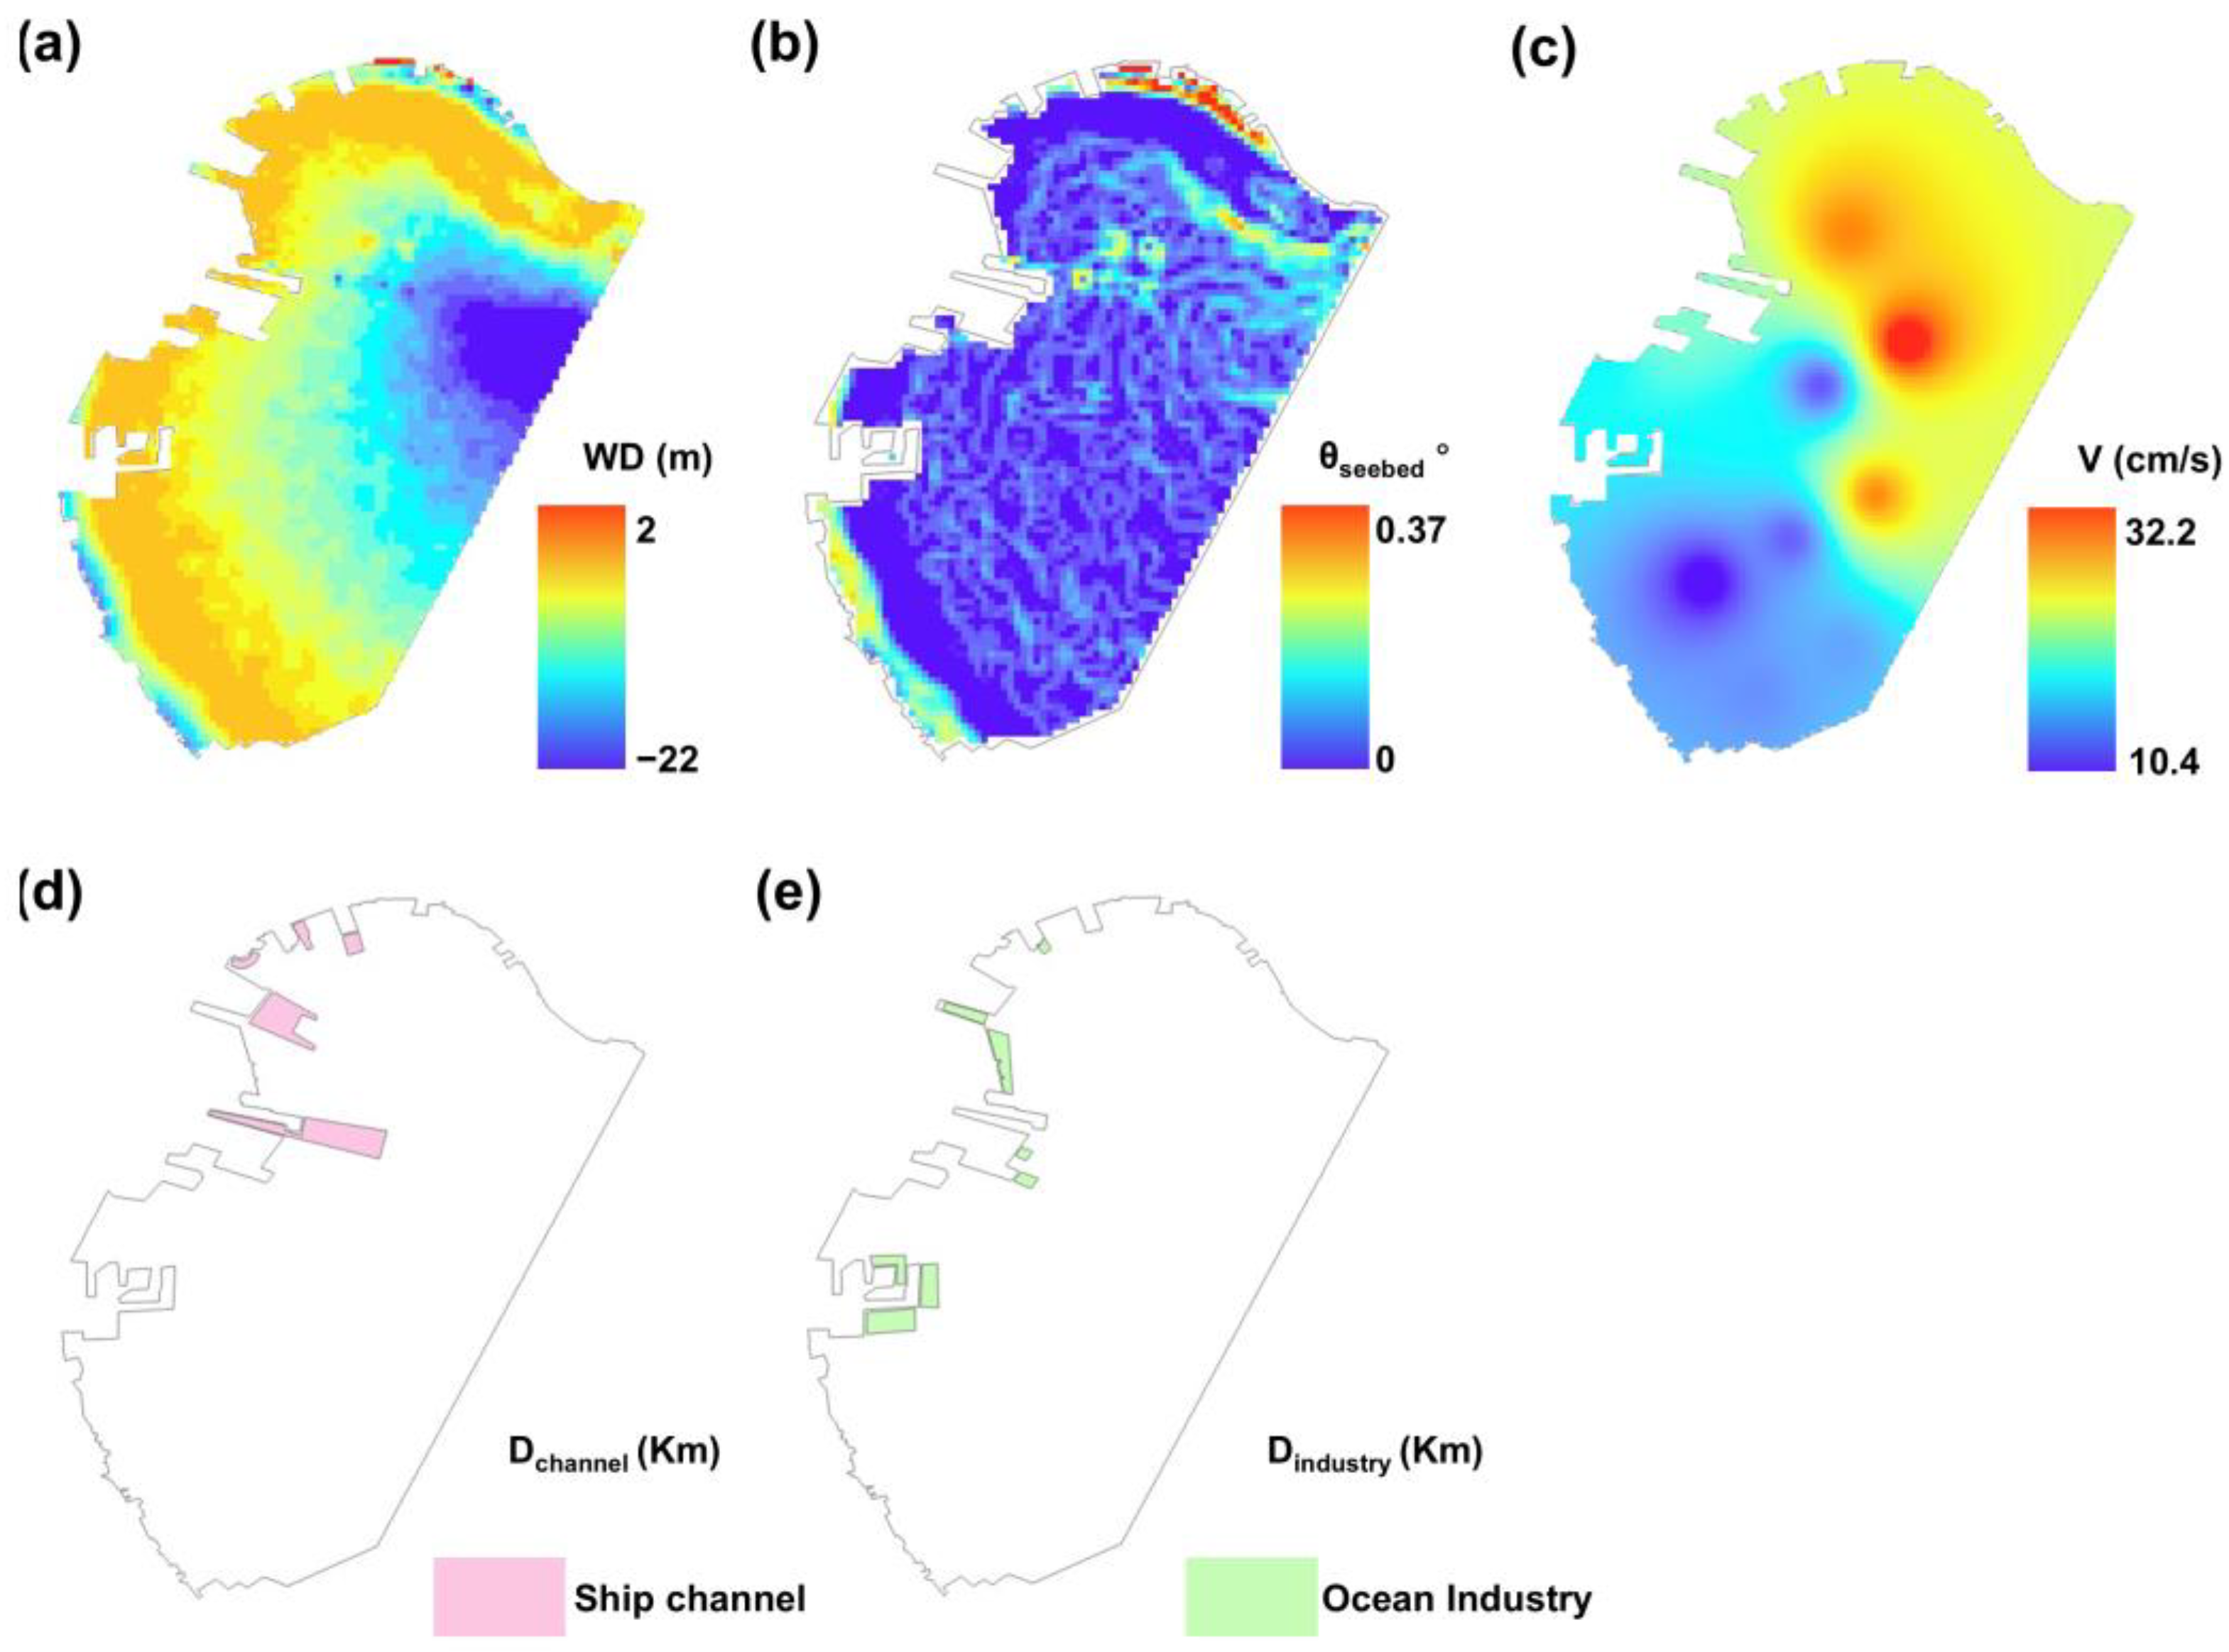
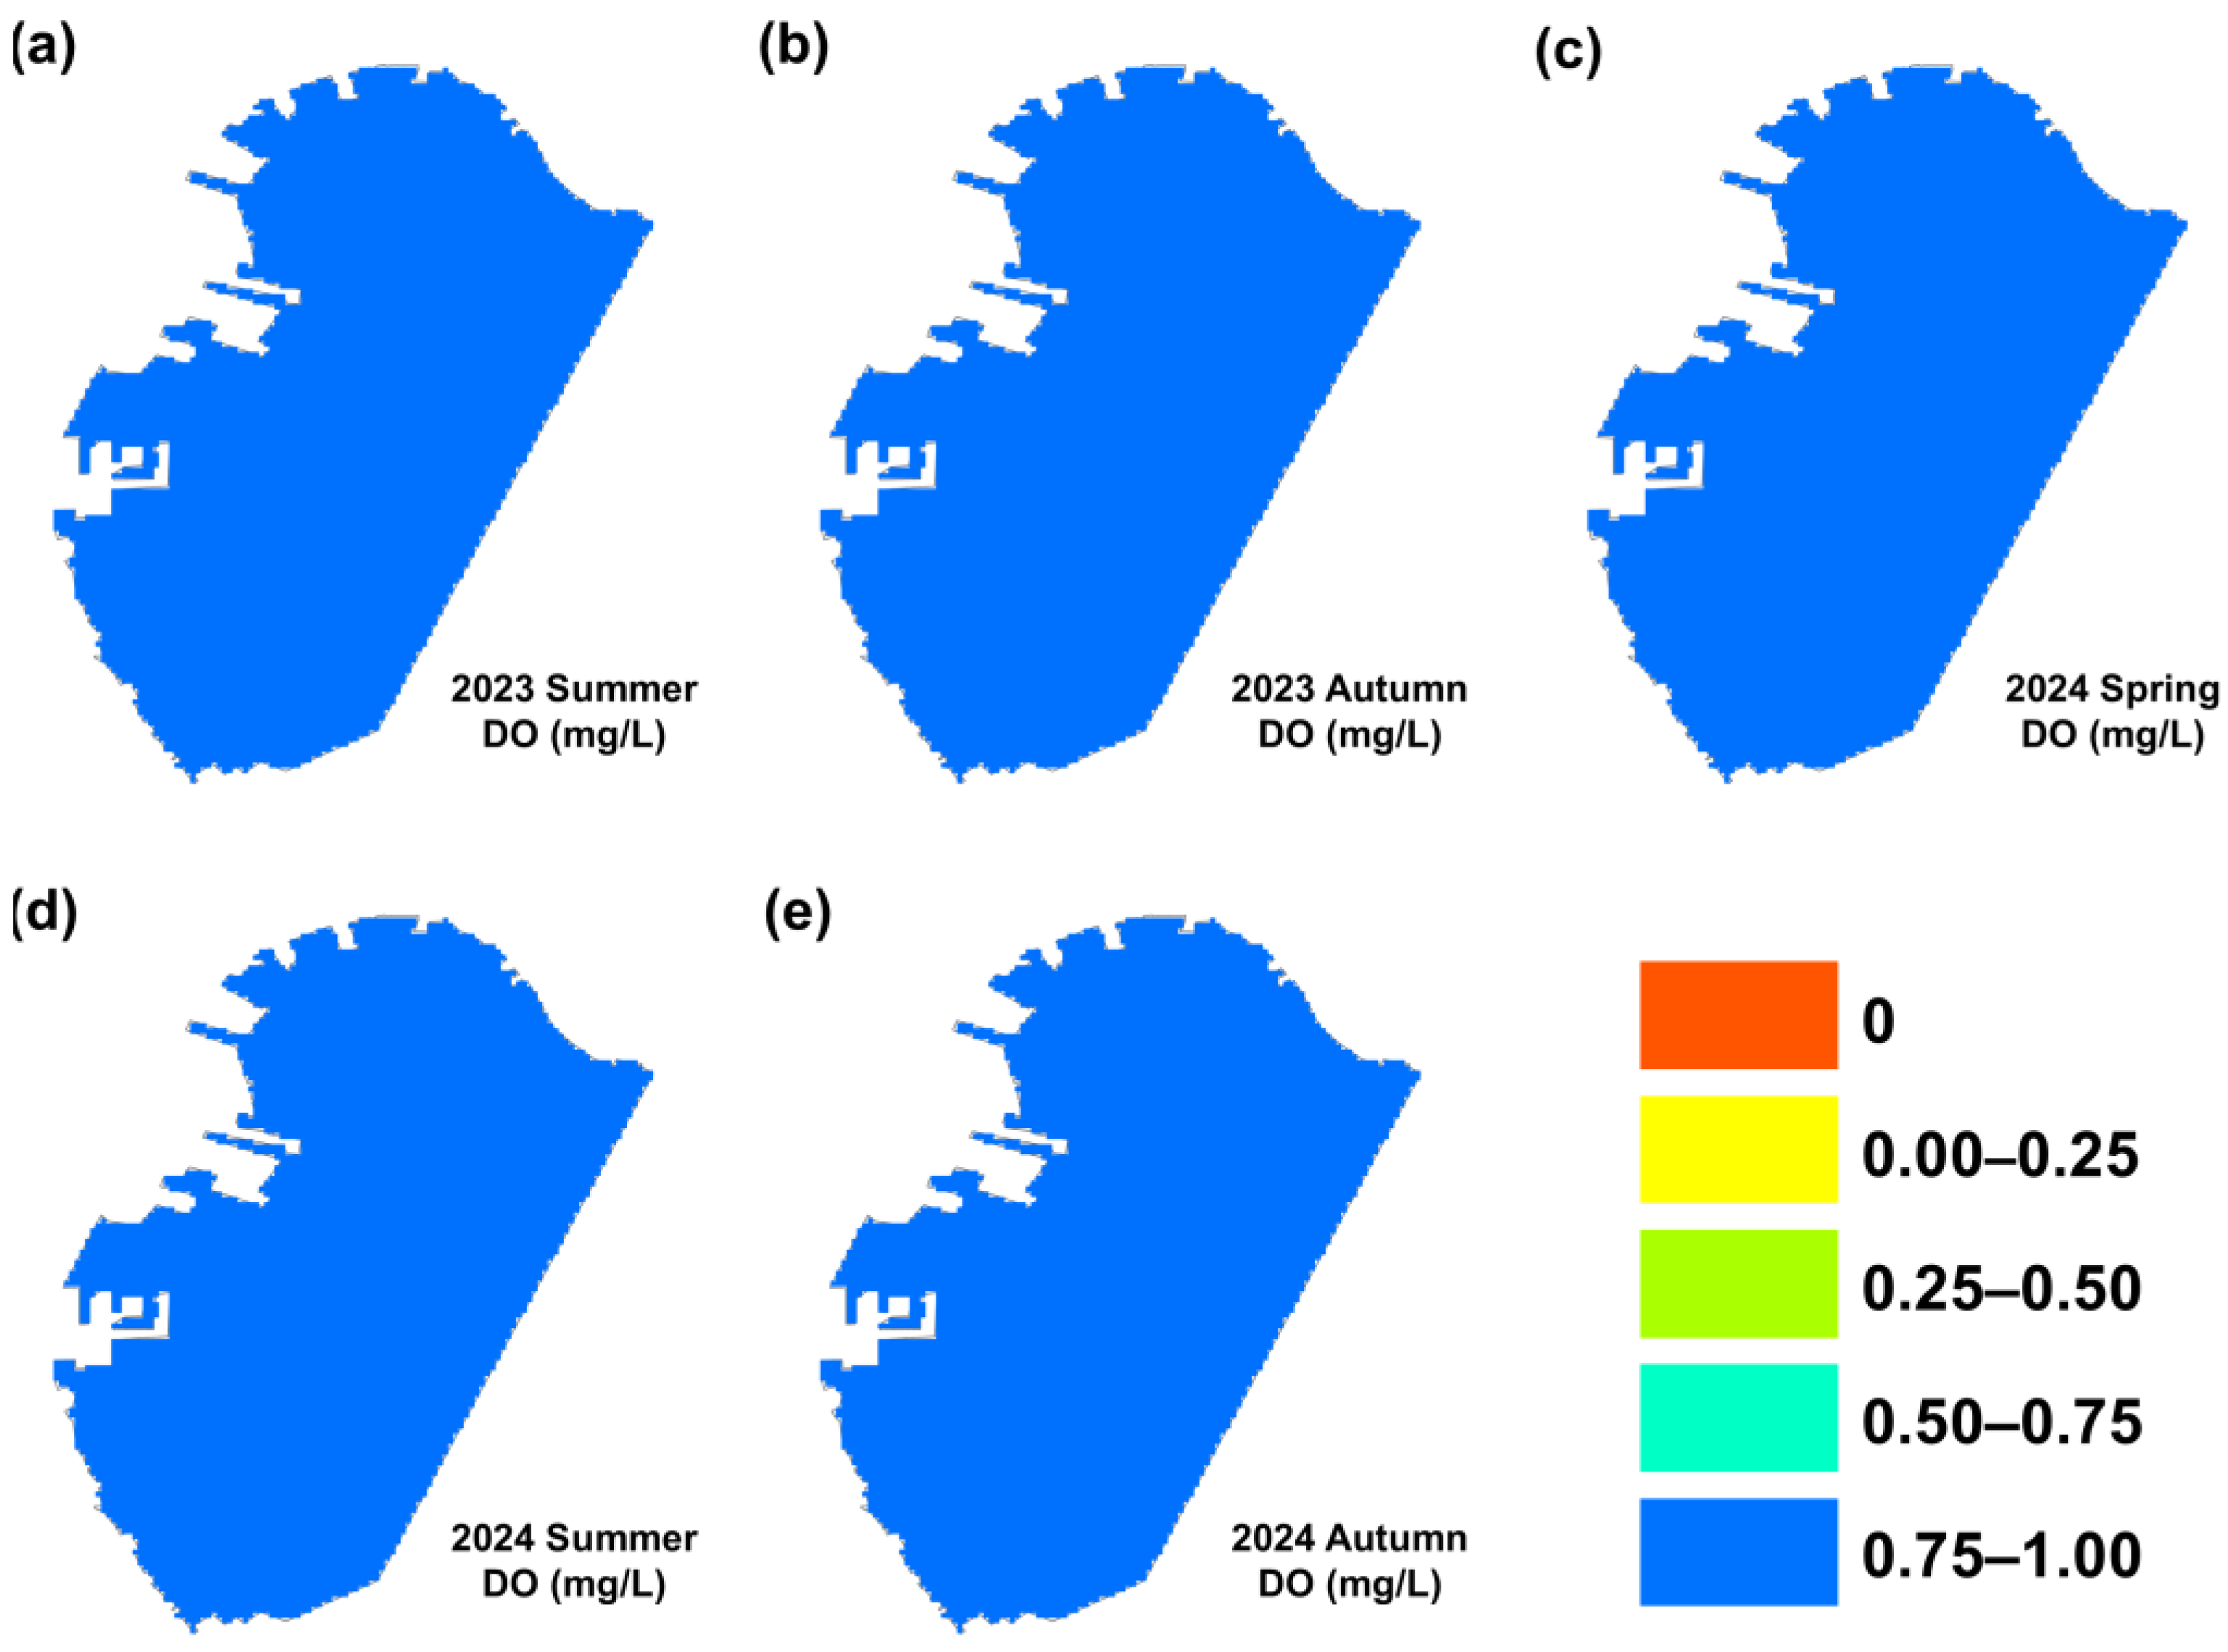
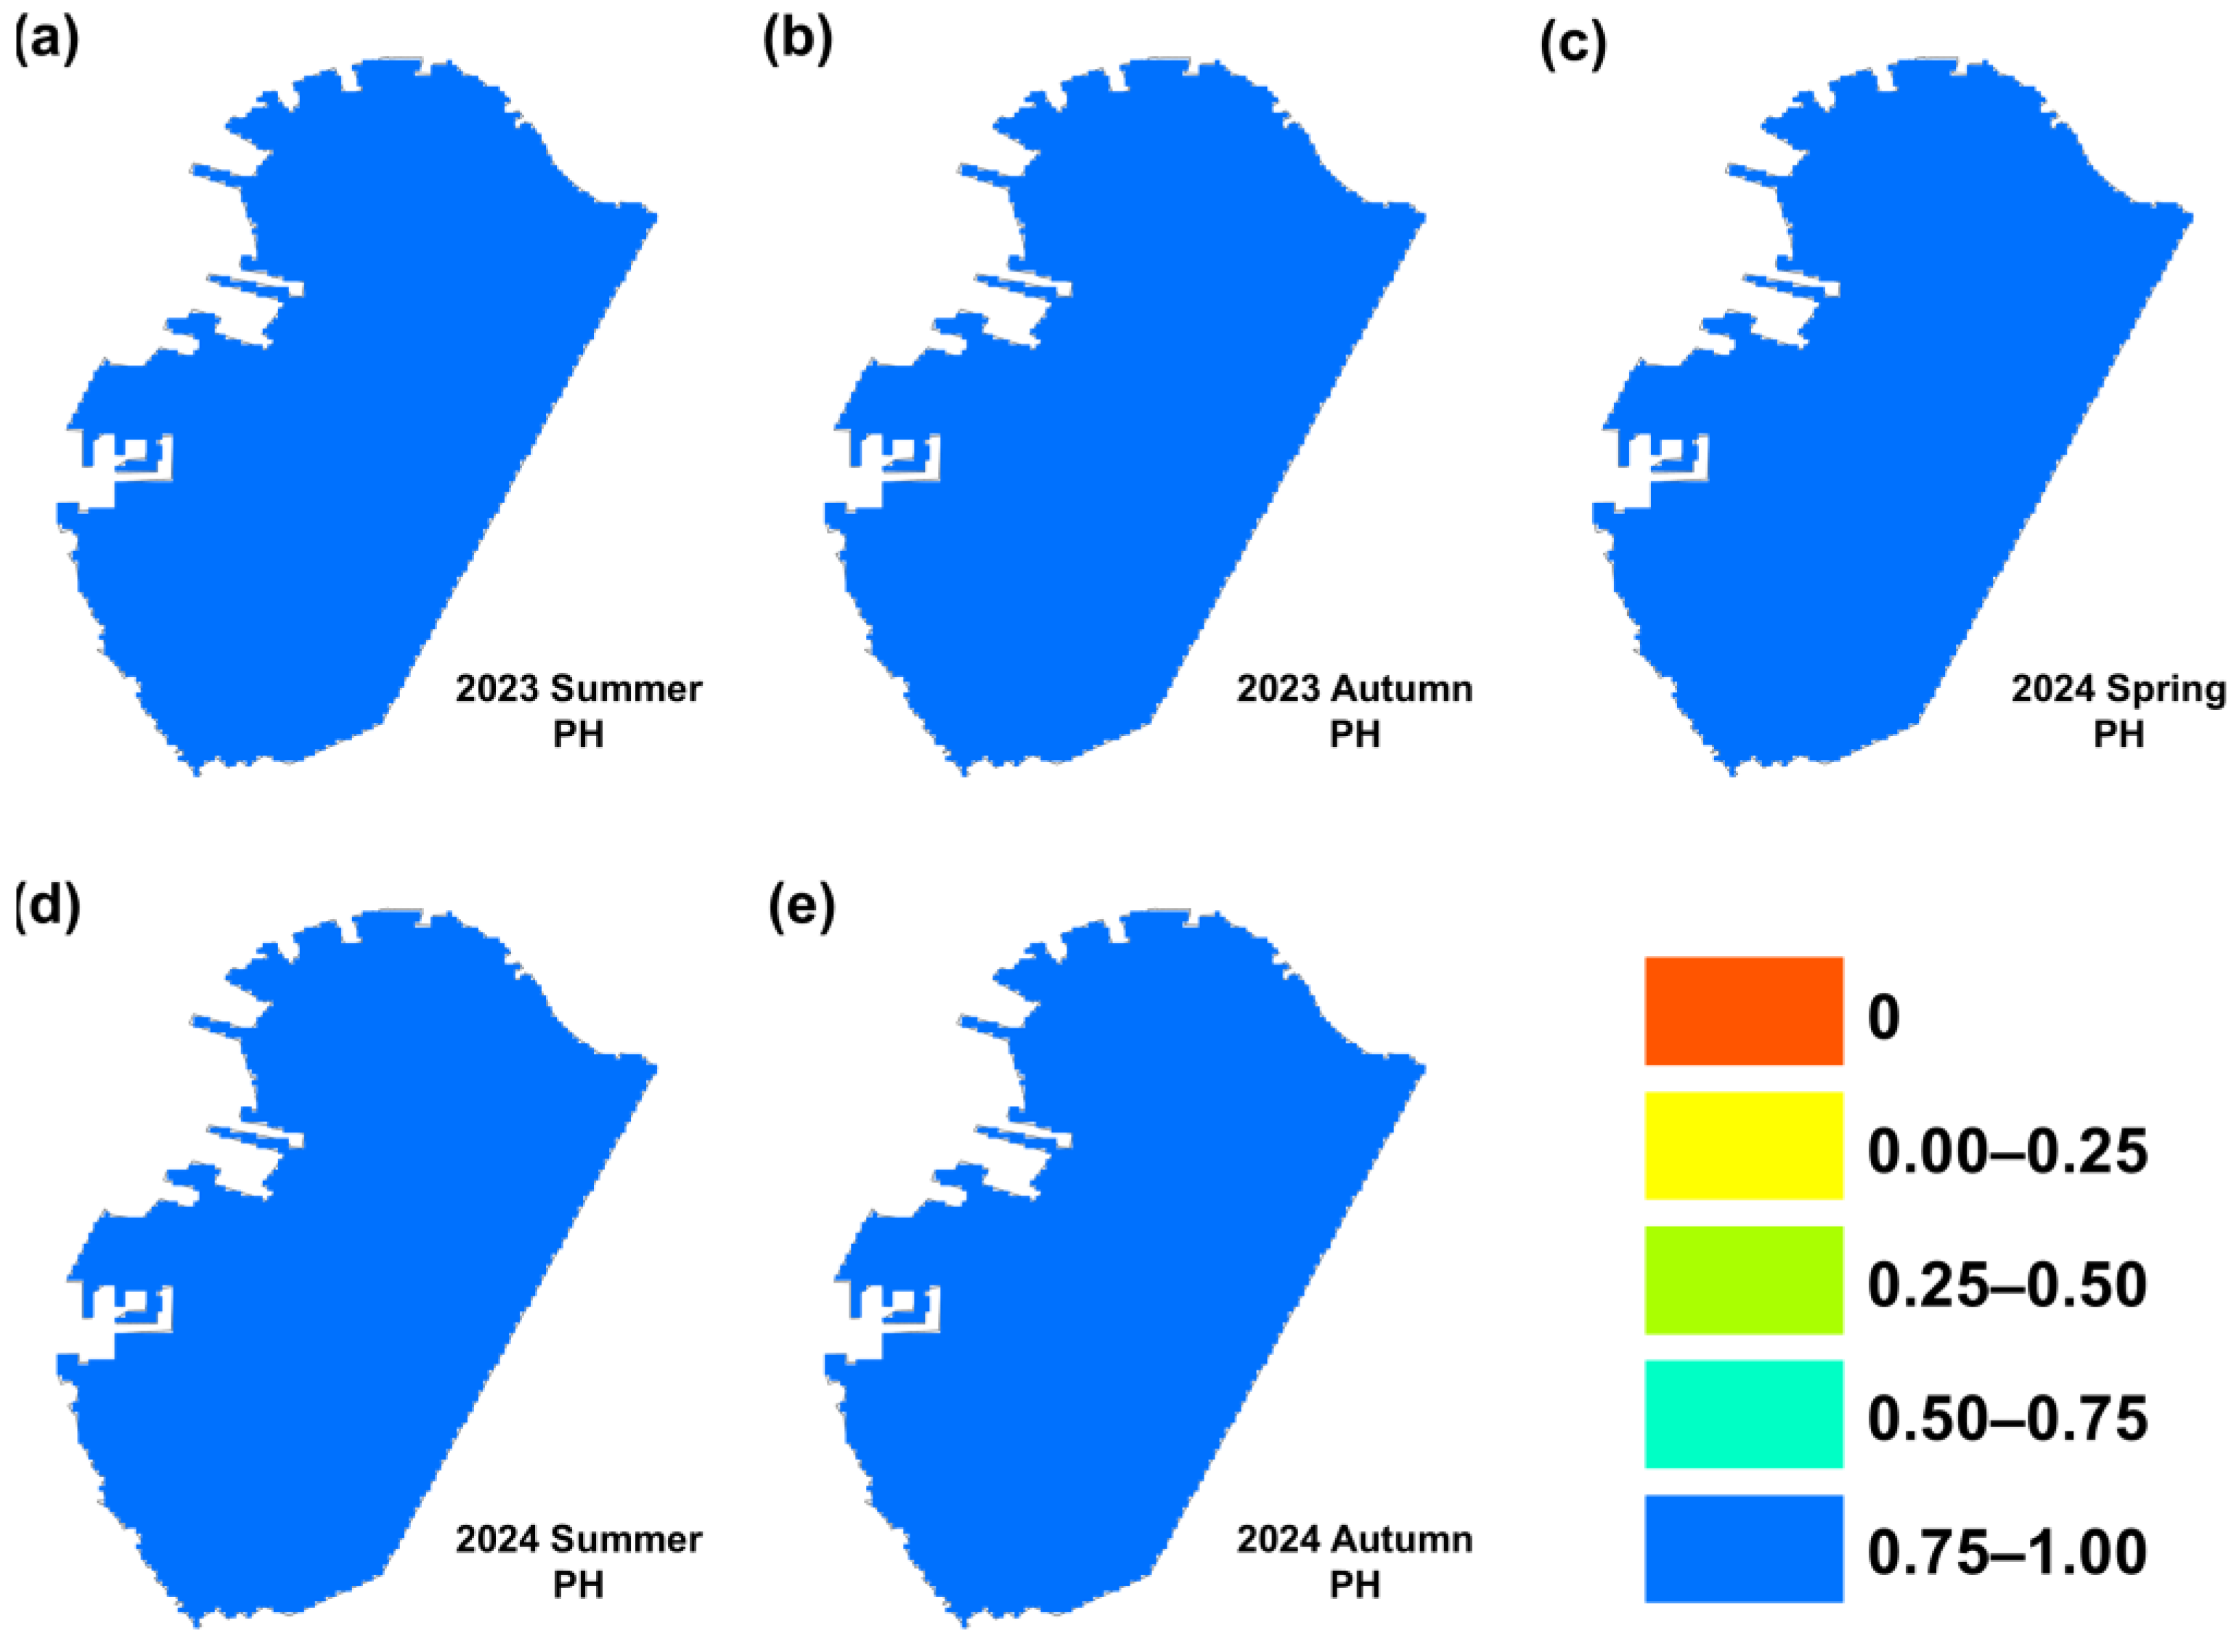
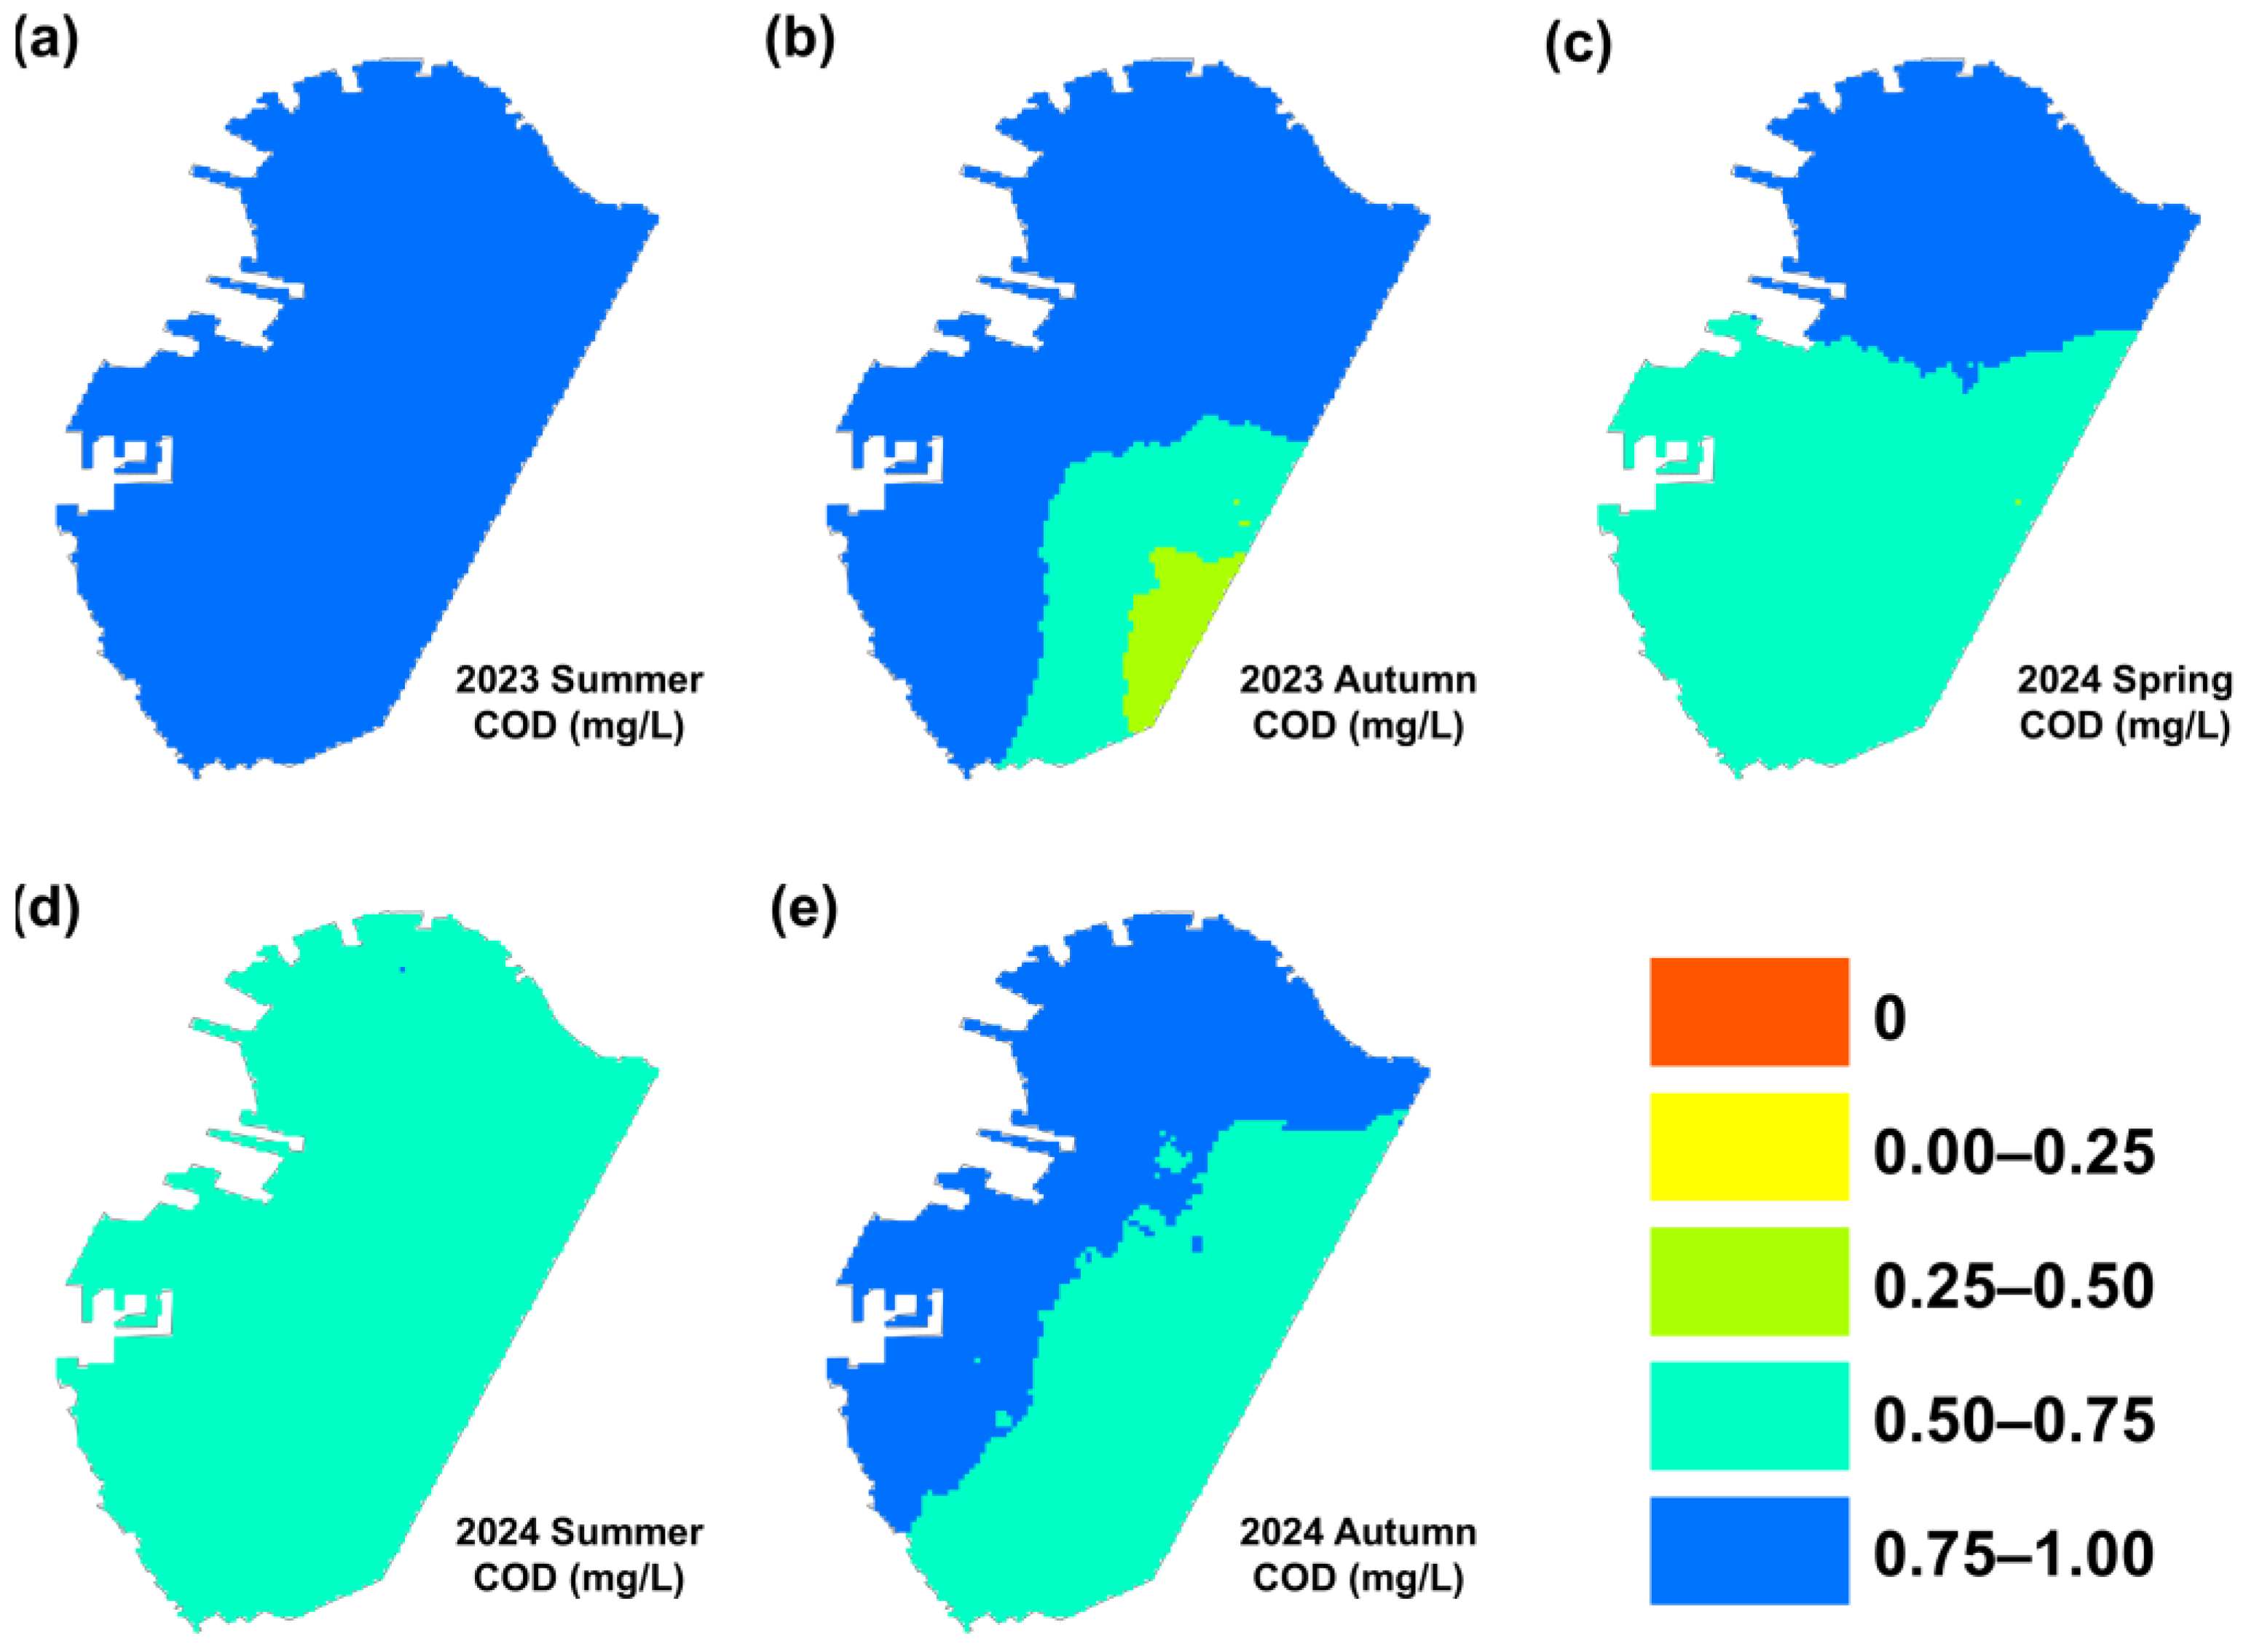
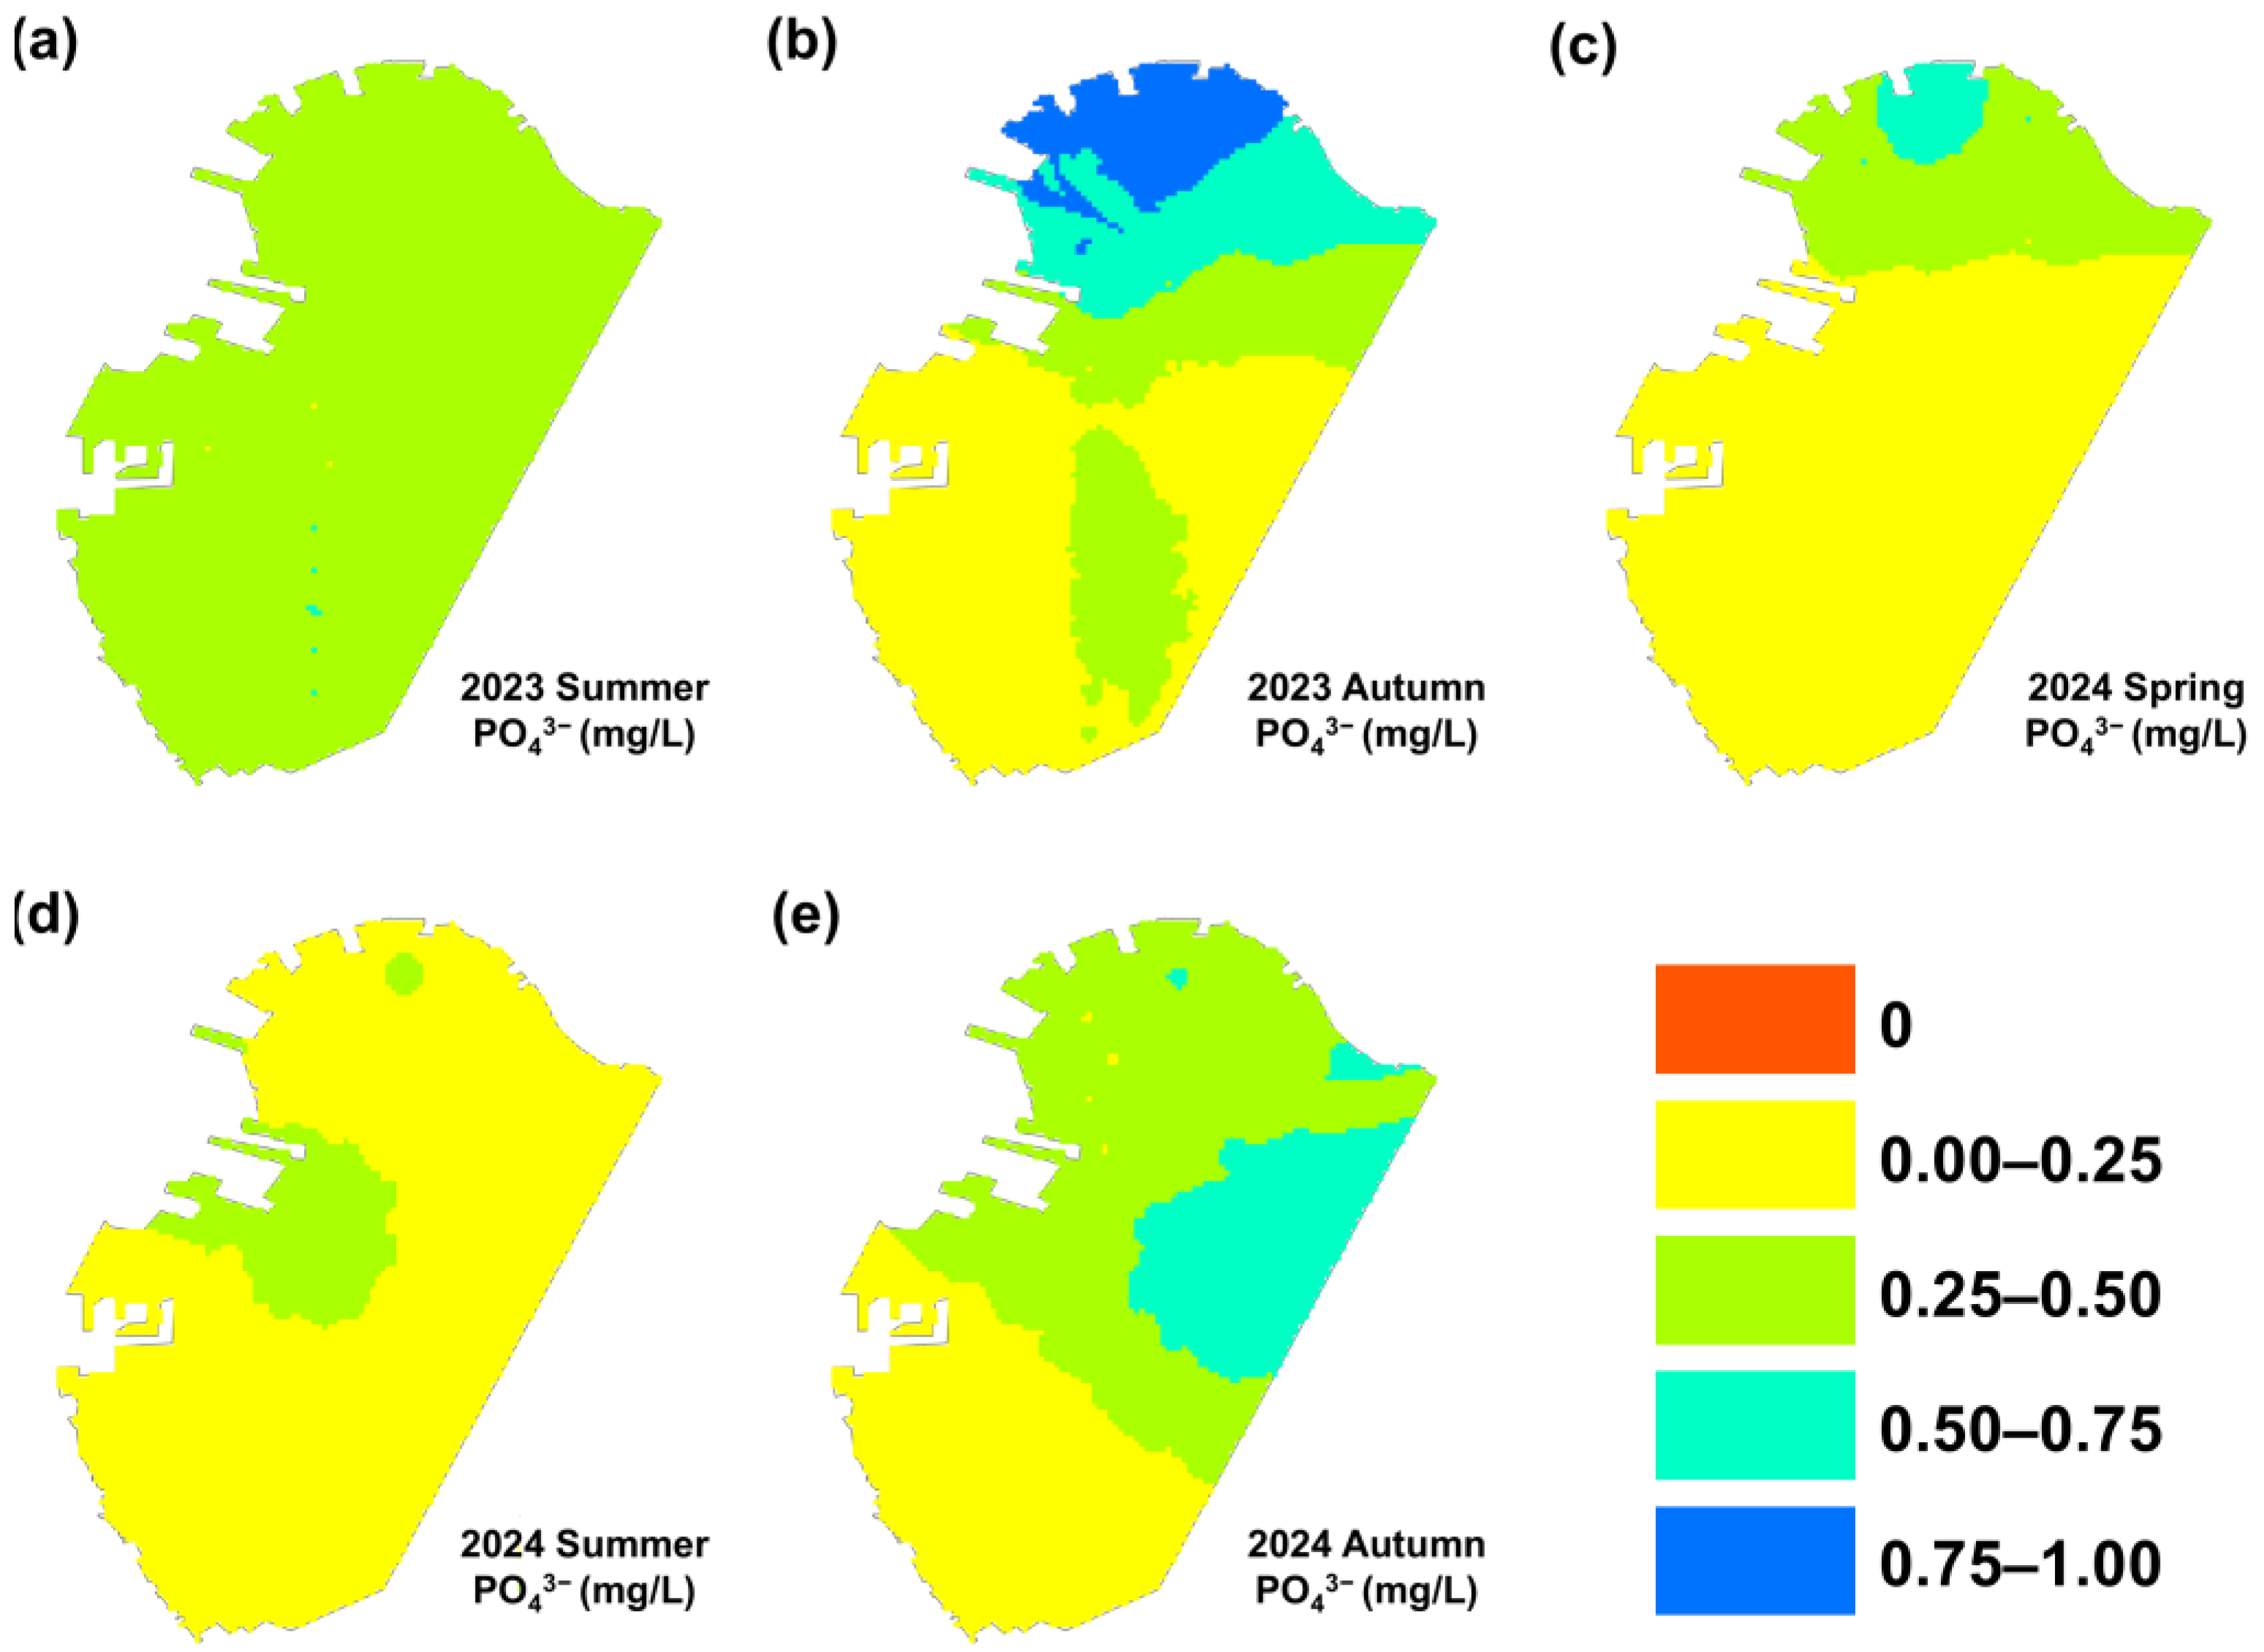
3.1. Single-Factor Suitability Index Analysis for Oyster Reef Restoration
3.2. Oyster Reef Restoration Suitability Evaluation
3.3. Sensitivity Analysis and Verification
4. Conclusions
Supplementary Materials
Author Contributions
Funding
Institutional Review Board Statement
Informed Consent Statement
Data Availability Statement
Conflicts of Interest
References
- Quan, W.; Wang, Y. Comparisons of Benthic Macrofauna Communities in Oyster (Crassostrea sikamea) Aquaculture Gears and Adjacent Natural Oyster Reef in Xiangshan Bay of Zhejiang Province, East China. Chin. J. Ecol. 2013, 32, 2462–2468. [Google Scholar]
- Dame, R.; Libes, S. Oyster Reefs and Nutrient Retention in Tidal Creeks. J. Exp. Mar. Biol. Ecol. 1993, 171, 251–258. [Google Scholar] [CrossRef]
- Cressman, K.A.; Posey, M.H.; Mallin, M.A.; Leonard, L.A.; Alphin, T.D. Effects of Oyster Reefs on Water Quality in a Tidal Creek Estuary. J. Shellfish Res. 2003, 22, 753–762. [Google Scholar]
- Quan, W.; Zhu, J.; Ni, Y.; Shi, L.; Chen, Y. Faunal Utilization of Constructed Intertidal Oyster (Crassostrea Rivularis) Reef in the Yangtze River Estuary, China. Ecol. Eng. 2009, 35, 1466–1475. [Google Scholar] [CrossRef]
- Gerritsen, J.; Holland, A.F.; Irvine, D.E. Suspension-Feeding Bivalves and the Fate of Primary Production: An Estuarine Model Applied to Chesapeake Bay. Estuaries 1994, 17, 403–416. [Google Scholar] [CrossRef]
- Xu, M.; Yang, X.Y.; Song, X.J.; Xu, K.D.; Yang, L.L. Seasonal Analysis of Artificial Oyster Reef Ecosystems: Implications for Sustainable Fisheries Management. Aquac. Int. 2021, 29, 167–192. [Google Scholar] [CrossRef]
- Uddin, M.J.; Smith, K.J.; Hargis, C.W. Development of Pervious Oyster Shell Habitat (POSH) Concrete for Reef Restoration and Living Shorelines. Constr. Build. Mater. 2021, 295, 123685. [Google Scholar] [CrossRef]
- Quan, W.-M.; Fan, R.-L.; Li, N.-N.; Sun, Z.-Y.; Jiang, W.; Wang, T.-N.; Shi, W.-J.; Li, X.-Y. Seasonal and Temporal Changes in the Kumamoto Oyster Crassostrea sikamea Population and Associated Benthic Macrofaunal Communities at an Intertidal Oyster Reef in China. J. Shellfish Res. 2020, 39, 207–214. [Google Scholar] [CrossRef]
- Beck, M.W.; Brumbaugh, R.D.; Airoldi, L.; Carranza, A.; Coen, L.D.; Crawford, C.; Defeo, O.; Edgar, G.J.; Hancock, B.; Kay, M.C.; et al. Oyster Reefs at Risk and Recommendations for Conservation, Restoration, and Management. Bioscience 2011, 61, 107–116. [Google Scholar] [CrossRef]
- Quan, W.; Feng, M.; Zhou, Z.; Wu, Z.; Tang, F.; Wang, Y.; Bao, X.; Shen, H.; Cheng, W. Ecological Assessment of the Oyster Crassostrea sikamea Population and Associated Benthic Communities on Restored Oyster Reefs along Jiangsu Province Coast, China. Acta Ecol. Sin. 2017, 37, 1709–1718. [Google Scholar]
- Walters, L.J.; Roddenberry, A.; Crandall, C.; Wayles, J.; Donnelly, M.; Barry, S.C.; Clark, M.W.; Escandell, O.; Hansen, J.C.; Laakkonen, K.; et al. The Use of Non-Plastic Materials for Oyster Reef and Shoreline Restoration: Understanding What Is Needed and Where the Field Is Headed. Sustainability 2022, 14, 8055. [Google Scholar] [CrossRef]
- Smith, R.S.; Hogan, S.; Tedford, K.N.; Lusk, B.; Reidenbach, M.A.; Castorani, M.C.N. Long-Term Data Reveal Greater Intertidal Oyster Biomass in Predicted Suitable Habitat. Mar. Ecol. Prog. Ser. 2022, 683, 221–226. [Google Scholar] [CrossRef]
- Laubenstein, T.; Smith, T.F.; Hobday, A.J.; Pecl, G.T.; Evans, K.; Fulton, E.A.; O’Donnell, T. Threats to Australia’s Oceans and Coasts: A Systematic Review. Ocean Coast. Manag. 2023, 231, 106331. [Google Scholar] [CrossRef]
- Overton, K.; Dempster, T.; Swearer, S.E.; Morris, R.L.; Barrett, L.T. Aerial Exposure Tolerance of Juvenile Flat Oysters (Ostrea angasi) Depends on Shell Length and Air Temperature. Restor. Ecol. 2024, 32, e14047. [Google Scholar] [CrossRef]
- Black, J. Oyster Reef Restoration in North Carolina: Recommendations for Improvements in Techniques and Monitoring. Master’s Thesis, Nicholas School of the Environment of Duke University, Durham, NC, USA, 2011. [Google Scholar]
- Pollack, J.B.; Cleveland, A.; Palmer, T.A.; Reisinger, A.S.; Montagna, P.A. A Restoration Suitability Index Model for the Eastern Oyster (Crassostrea Virginica) in the Mission-Aransas Estuary, TX, USA. PLoS ONE 2012, 7, e40839. [Google Scholar] [CrossRef]
- Li, J.-F.; Shang, Z.-W.; Chen, Y.-S.; Tian, L.-Z.; Jiang, X.-Y.; Wang, F.; Hu, Y.-Z.; Li, Y.; Yang, P.; Wen, M.-Z.; et al. Research status and protection suggestions on oyster reef in Bohai Bay. N. China Geol. 2020, 43, 317–333. [Google Scholar] [CrossRef]
- Fang, E.; Wang, H.; Zeng, X.; Wang, Y.; Xu, X.; Zhang, X. Preliminary Acoustic Investigation of Artificial Reef Area in Dashentang Marine Ranch, Tianjin. Tianjin Agric. Sci. 2023, 29, 42–47+52. [Google Scholar]
- Sha, W.; Xu, Y.; Kan, W.; Jiang, H.; Zhang, J.; Lu, X.; Li, H.; Zhu, L.; Feng, J. Characteristics analysis of symbiotic community of Spartina alterniflora-Crassostrea gigas in intertidal zone of Bohai Bay. Acta Eco. Sin. 2024, 44, 7738–7747. [Google Scholar] [CrossRef]
- Wang, X.; Feng, J.; Lin, C.; Liu, H.; Chen, M.; Zhang, Y. Structural and Functional Improvements of Coastal Ecosystem Based on Artificial Oyster Reef Construction in the Bohai Sea, China. Front. Mar. Sci. 2022, 9, 829557. [Google Scholar] [CrossRef]
- Quan, W.; Fan, R.; Wang, Y.; Humphries, A.T. Long-Term Oyster Recruitment and Growth Are Not Influenced by Substrate Type in China: Implications for Sustainable Oyster Reef Restoration. J. Shellfish Res. 2017, 36, 79–86. [Google Scholar] [CrossRef]
- Pogoda, B.; Boudry, P.; Bromley, C.; Cameron, T.C.; Colsoul, B.; Donnan, D.; Hancock, B.; Hugh-Jones, T.; Preston, J.; Sanderson, W.G.; et al. NORA Moving Forward: Developing an Oyster Restoration Network in Europe to Support the Berlin Oyster Recommendation. Aquat. Conserv. Mar. Freshw. Ecosyst. 2020, 30, 2031–2037. [Google Scholar] [CrossRef]
- Chung, H.C.; Lee, O.O.; Huang, Y.-L.; Mok, S.Y.; Kolter, R.; Qian, P.-Y. Bacterial Community Succession and Chemical Profiles of Subtidal Biofilms in Relation to Larval Settlement of the Polychaete Hydroides Elegans. ISME J. 2010, 4, 817–828. [Google Scholar] [CrossRef] [PubMed]
- Schulte, D.M.; Burke, R.P.; Lipcius, R.N. Unprecedented Restoration of a Native Oyster Metapopulation. Science 2009, 325, 1124–1128. [Google Scholar] [CrossRef]
- Brown, S.K.; Buja, K.R.; Jury, S.H.; Monaco, M.E.; Banner, A. Habitat Suitability Index Models for Eight Fish and Invertebrate Species in Casco and Sheepscot Bays, Maine. N. Am. J. Fish. Manag. 2000, 20, 408–435. [Google Scholar] [CrossRef]
- Kulakowski, K. Understanding the Analytic Hierarchy Process, 1st ed.; Chapman and Hall/CRC: Boca Raton, FL, USA, 2020; ISBN 978-1-138-03232-3. [Google Scholar]
- Song, D.; Gao, Z.; Zhang, H.; Xu, F.; Zheng, X.; Ai, J.; Hu, X.; Huang, G.; Zhang, H. GIS-Based Health Assessment of the Marine Ecosystem in Laizhou Bay, China. Mar. Pollut. Bull. 2017, 125, 242–249. [Google Scholar] [CrossRef]
- Lao, Y.; Liang, M.; Sheng, X.; Ou, Y. Ecological Function Evaluation of Coastal Wetlands: A Case Study of Guangxi. In Proceedings of the 2013 Fifth International Conference on Measuring Technology and Mechatronics Automation (ICMTMA 2013), Hong Kong, China, 16–17 January 2013; IEEE: New York, NY, USA, 2013; pp. 507–511. [Google Scholar]
- Dindaroglu, T. Determination of Ecological Networks for Vegetation Connectivity Using GIS & AHP Technique in the Mediterranean Degraded Karst Ecosystems. J. Arid. Environ. 2021, 188, 104385. [Google Scholar] [CrossRef]
- Li, T.; Huang, Y.; Gu, C.; Qiu, F. Application of Geodesign Techniques for Ecological Engineered Landscaping of Urban River Wetlands: A Case Study of Yuhangtang River. Sustainability 2022, 14, 15612. [Google Scholar] [CrossRef]
- Wang, Y.; Qin, H.; Wang, Q.; Lv, H.; Ma, H.; Liang, S.; Guo, H. Evaluation of spatial and temporal distribution of water quality and eutrophication in Bohai Bay during 2006–2020. Chin. J. Mar. Environ. Sci. 2023, 42, 693–703. [Google Scholar]
- Yu, Q.; Zhang, X.; Han, X. Elementary Study on the Fishery Resources Conservation and the Ecological Restoration of the Live Oyster Reef in Dashentang, Tianjin. Mar. Econ. 2014, 4, 16–22. [Google Scholar] [CrossRef]
- T/CAOE 21.6-2020; Technical Guideline on Coastal Ecological Rehabilitation for Hazard Mitigation—Part 6: Oyster Reef. CAOE: Beijing, China, 2020.
- Wang, X.; Zhang, J.; Zhong, Y.; Liu, Y.; Wu, W. GIS-Based Spatial Suitability Assessment for Pacific Oyster Crassostrea gigas Reef Restoration: A Case Study of Laizhou Bay, China. Mar. Pollut. Bull. 2023, 186, 114416. [Google Scholar] [CrossRef]
- Xu, C.; Yang, F.; Zheng, S.; Qi, J.; Chen, X.; Wei, S.; Lin, Y.; Xi, Y. Growth and fattening of triploid Crassostrea angulata and their relations with marine environmental factors. J. Shanghai Ocean. Univ. 2024, 33, 670–681. [Google Scholar] [CrossRef]
- Liu, D.; Zhong, D.; Zhou, R.; Li, D. GIS-Based Three-Dimensional Dynamic Visualization of Construction Diversion for Hydroelectric Project. J. Comput. Aided Des. Graph. 2002, 14, 1051–1055. [Google Scholar]
- Salem, B.B. Application of GIS to Biodiversity Monitoring. J. Arid. Environ. 2003, 54, 91–114. [Google Scholar] [CrossRef]
- Cho, Y.; Lee, W.-C.; Hong, S.; Kim, H.-C.; Kim, J.B. GIS-Based Suitable Site Selection Using Habitat Suitability Index for Oyster Farms in Geoje-Hansan Bay, Korea. Ocean. Coast. Manag. 2012, 56, 10–16. [Google Scholar] [CrossRef]
- Wright, J.M.; Parker, L.M.; O’Connor, W.A.; Scanes, E.; Ross, P.M. Ocean Acidification Affects Both the Predator and Prey to Alter Interactions between the Oyster Crassostrea gigas (Thunberg, 1793) and the Whelk Tenguella marginalba (Blainville, 1832). Mar. Biol. 2018, 165, 46. [Google Scholar] [CrossRef]
- Cole, V.J.; Parker, L.M.; O’Connor, S.J.; O’Connor, W.A.; Scanes, E.; Byrne, M.; Ross, P.M. Effects of Multiple Climate Change Stressors: Ocean Acidification Interacts with Warming, Hyposalinity, and Low Food Supply on the Larvae of the Brooding Flat Oyster Ostrea angasi. Mar. Biol. 2016, 163, 125. [Google Scholar] [CrossRef]
- Turpin, V.; Robert, J.-M.; Goulletquer, P. Limiting Nutrients of Oyster Pond Seawaters in the Marennes-Oléron Region for Haslea ostrearia: Applications to the Mass Production of the Diatom in Mesocosm Experiments. Aquat. Living Resour. 1999, 12, 335–342. [Google Scholar] [CrossRef]
- Soletchnik, P.; Faury, N.; Razet, D.; Goulletquer, P. Hydrobiology of the Marennes-Oléron Bay. Seasonal Indices and Analysis of Trends from 1978 to 1995. Hydrobiologia 1998, 386, 131–146. [Google Scholar] [CrossRef]
- Malham, S.K.; Cotter, E.; O’Keeffe, S.; Lynch, S.; Culloty, S.C.; King, J.W.; Latchford, J.W.; Beaumont, A.R. Summer Mortality of the Pacific Oyster, Crassostrea gigas, in the Irish Sea: The Influence of Temperature and Nutrients on Health and Survival. Aquaculture 2009, 287, 128–138. [Google Scholar] [CrossRef]
- Paterson, K.J.; Schreider, M.J.; Zimmerman, K.D. Anthropogenic Effects on Seston Quality and Quantity and the Growth and Survival of Sydney Rock Oyster (Saccostrea glomerata) in Two Estuaries in NSW, Australia. Aquaculture 2003, 221, 407–426. [Google Scholar] [CrossRef]
- Lebata-Ramos, M.J.H.L.; Dionela, C.S.; Solis, E.F.D.; Mediavilla, J.P.; Sibonga, R.C.; Novilla, S.R.M. Settlement of Oyster Magallana bilineata (Roding, 1798) Spat in the Natural Environment: Seasonality and Substrate Texture Preference. Molluscan Res. 2022, 42, 135–145. [Google Scholar] [CrossRef]
- Mori, K. Effects of Artificial Eutrophication on the Metabolism of the Japanese Oyster Crassostrea gigas. Mar. Biol. 1979, 53, 361–369. [Google Scholar] [CrossRef]
- Grizzle, R.E.; Ward, K.M.; Peter, C.R.; Cantwell, M.; Katz, D.; Sullivan, J. Growth, Morphometrics and Nutrient Content of Farmed Eastern Oysters, Crassostrea virginica (Gmelin), in New Hampshire, USA. Aquac. Res. 2017, 48, 1525–1537. [Google Scholar] [CrossRef] [PubMed]
- Mousavi, S.H.; Danehkar, A.; Shokri, M.R.; Poorbagher, H.; Azhdari, D. Site Selection for Artificial Reefs Using a New Combine Multi-Criteria Decision-Making (MCDM) Tools for Coral Reefs in the Kish Island—Persian Gulf. Ocean Coast. Manag. 2015, 111, 92–102. [Google Scholar] [CrossRef]
- Wu, Z.; Yu, Z.; Song, X.; Li, Y.; Cao, X.; Yuan, Y. A Methodology for Assessing and Mapping Pressure of Human Activities on Coastal Region Based on Stepwise Logic Decision Process and GIS Technology. Ocean Coast. Manag. 2016, 120, 80–87. [Google Scholar] [CrossRef]
- National Marine Environmental Monitoring Center. Available online: https://www.nmemc.org.cn/ (accessed on 2 May 2025).
- GEBCO|General Bathymetric Chart of the Oceans. Available online: https://www.gebco.net/ (accessed on 5 May 2025).
- Tianjin Land Use Master Plan (2015–2020). Available online: https://ghhzrzy.tj.gov.cn/ywpd/cxgh_43015/ghgs/202012/t20201231_5278487.html (accessed on 31 December 2020).
- Tianjin Land and Space Master Plan (2021–2035). Available online: https://www.tj.gov.cn/zwgk/szfwj/tjsrmzf/202409/t20240927_6741314.html (accessed on 3 May 2025).
- Xu, X.; Zeng, X.; Li, Y.; Gao, Y. A Preliminary Study on the Influencing Factors of Newborn Oyster in Tianjin Dashentang Marine Ranching. J. Ocean Technol. 2024, 43, 70–77. [Google Scholar]
- Xu, G.; Tan, X.; Tu, J.; Shi, H.; He, R.; Liu, Y. Trend Analysis and Assessment of Water Quality for Dashentang Oyster Reef Marine Special Reserve in Tianjin. Mar. Environ. Sci. 2022, 41, 554–562. [Google Scholar] [CrossRef]


| First Level | Weight | Second Level | Weight |
|---|---|---|---|
| Water quality factors | 66.08% | DO | 27.83% |
| pH | 14.44% | ||
| TIN | 13.75% | ||
| COD | 12.36% | ||
| SRP | 9.83% | ||
| Hydrological factors | 20.81% | WD | 5.97% |
| Slope | 5.19% | ||
| Velocity | 4.09% | ||
| Management factors | 13.11% | Distance to the shipping channel | 3.28% |
| Distance to the marine industries | 3.27% |
| Scenario | Weight | ||
|---|---|---|---|
| Water Quality Factors | Hydrological Factors | Management Factors | |
| Equal importance | 33.30% | 33.30% | 33.30% |
| Water quality priority | 50.00% | 25.00% | 25.00% |
| Hydrological priority | 25.00% | 50.00% | 25.00% |
| Management priority | 25.00% | 25.00% | 50.00% |
Disclaimer/Publisher’s Note: The statements, opinions and data contained in all publications are solely those of the individual author(s) and contributor(s) and not of MDPI and/or the editor(s). MDPI and/or the editor(s) disclaim responsibility for any injury to people or property resulting from any ideas, methods, instructions or products referred to in the content. |
© 2025 by the authors. Licensee MDPI, Basel, Switzerland. This article is an open access article distributed under the terms and conditions of the Creative Commons Attribution (CC BY) license (https://creativecommons.org/licenses/by/4.0/).
Share and Cite
Zhao, Y.; Wang, Z.; Lin, Y.; Jing, R.; Wang, Z.; Liu, X. GIS-Based Suitability Assessment for the Ecological Restoration of Oyster Reefs: A Case Study of the Tianjin Coast in Bohai Bay. Sustainability 2025, 17, 4759. https://doi.org/10.3390/su17114759
Zhao Y, Wang Z, Lin Y, Jing R, Wang Z, Liu X. GIS-Based Suitability Assessment for the Ecological Restoration of Oyster Reefs: A Case Study of the Tianjin Coast in Bohai Bay. Sustainability. 2025; 17(11):4759. https://doi.org/10.3390/su17114759
Chicago/Turabian StyleZhao, Yuxuan, Zifei Wang, Yunan Lin, Ruijia Jing, Zhiyun Wang, and Xianhua Liu. 2025. "GIS-Based Suitability Assessment for the Ecological Restoration of Oyster Reefs: A Case Study of the Tianjin Coast in Bohai Bay" Sustainability 17, no. 11: 4759. https://doi.org/10.3390/su17114759
APA StyleZhao, Y., Wang, Z., Lin, Y., Jing, R., Wang, Z., & Liu, X. (2025). GIS-Based Suitability Assessment for the Ecological Restoration of Oyster Reefs: A Case Study of the Tianjin Coast in Bohai Bay. Sustainability, 17(11), 4759. https://doi.org/10.3390/su17114759