


Using Tree Inventory to Assess Urban Treescape Diversity and Health in Popular Residential Typologies in the Poznań Metropolitan Area (Poland)


Abstract
1. Introduction
- Which of the compared residential districts is characterized by the most diverse tree community?
- Which district has the highest percentage of native trees?
- Which of the Vegetation Indices (VIs) is most reliable in recording the condition of the urban canopy in the compared districts?
- The canopy of which district scores the best in terms of the remotely sensed Vegetation Indices (VIs)?
- Does tree species diversity improve the health of urban greenery in the study area?
- Are there tree species in the study area that perform better in terms of VI values?
- Is the tree species diversity a valid indicator for predicting the urban ecosystem health?
- Does the nativeness of tree species translate into a good condition of the greenery?
2. Materials and Methods
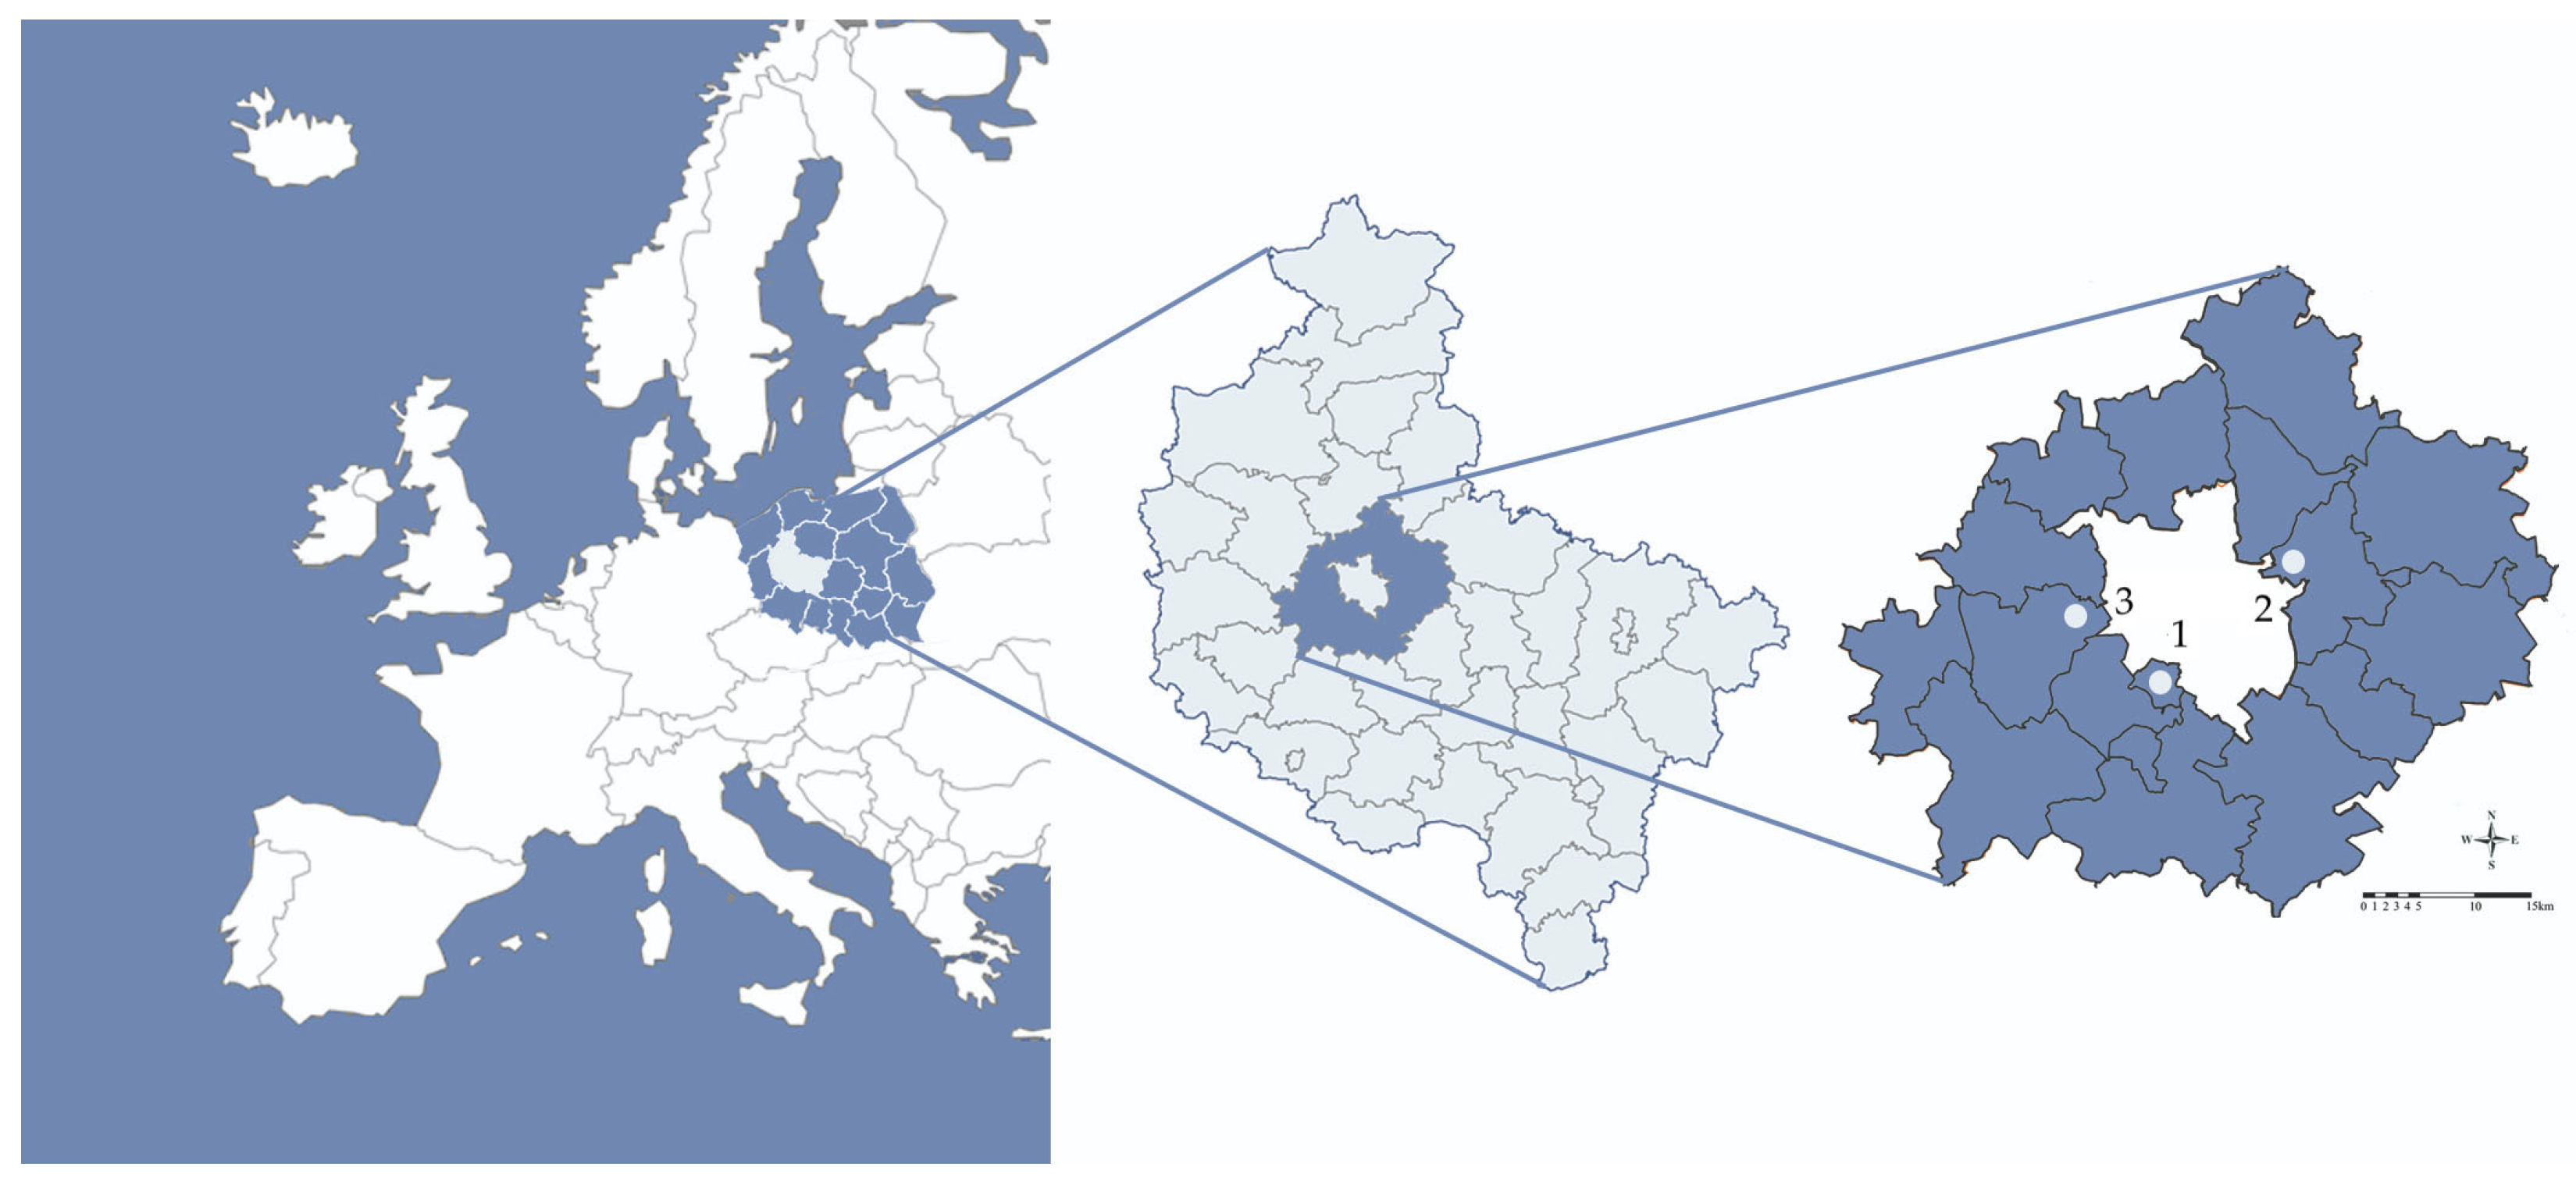
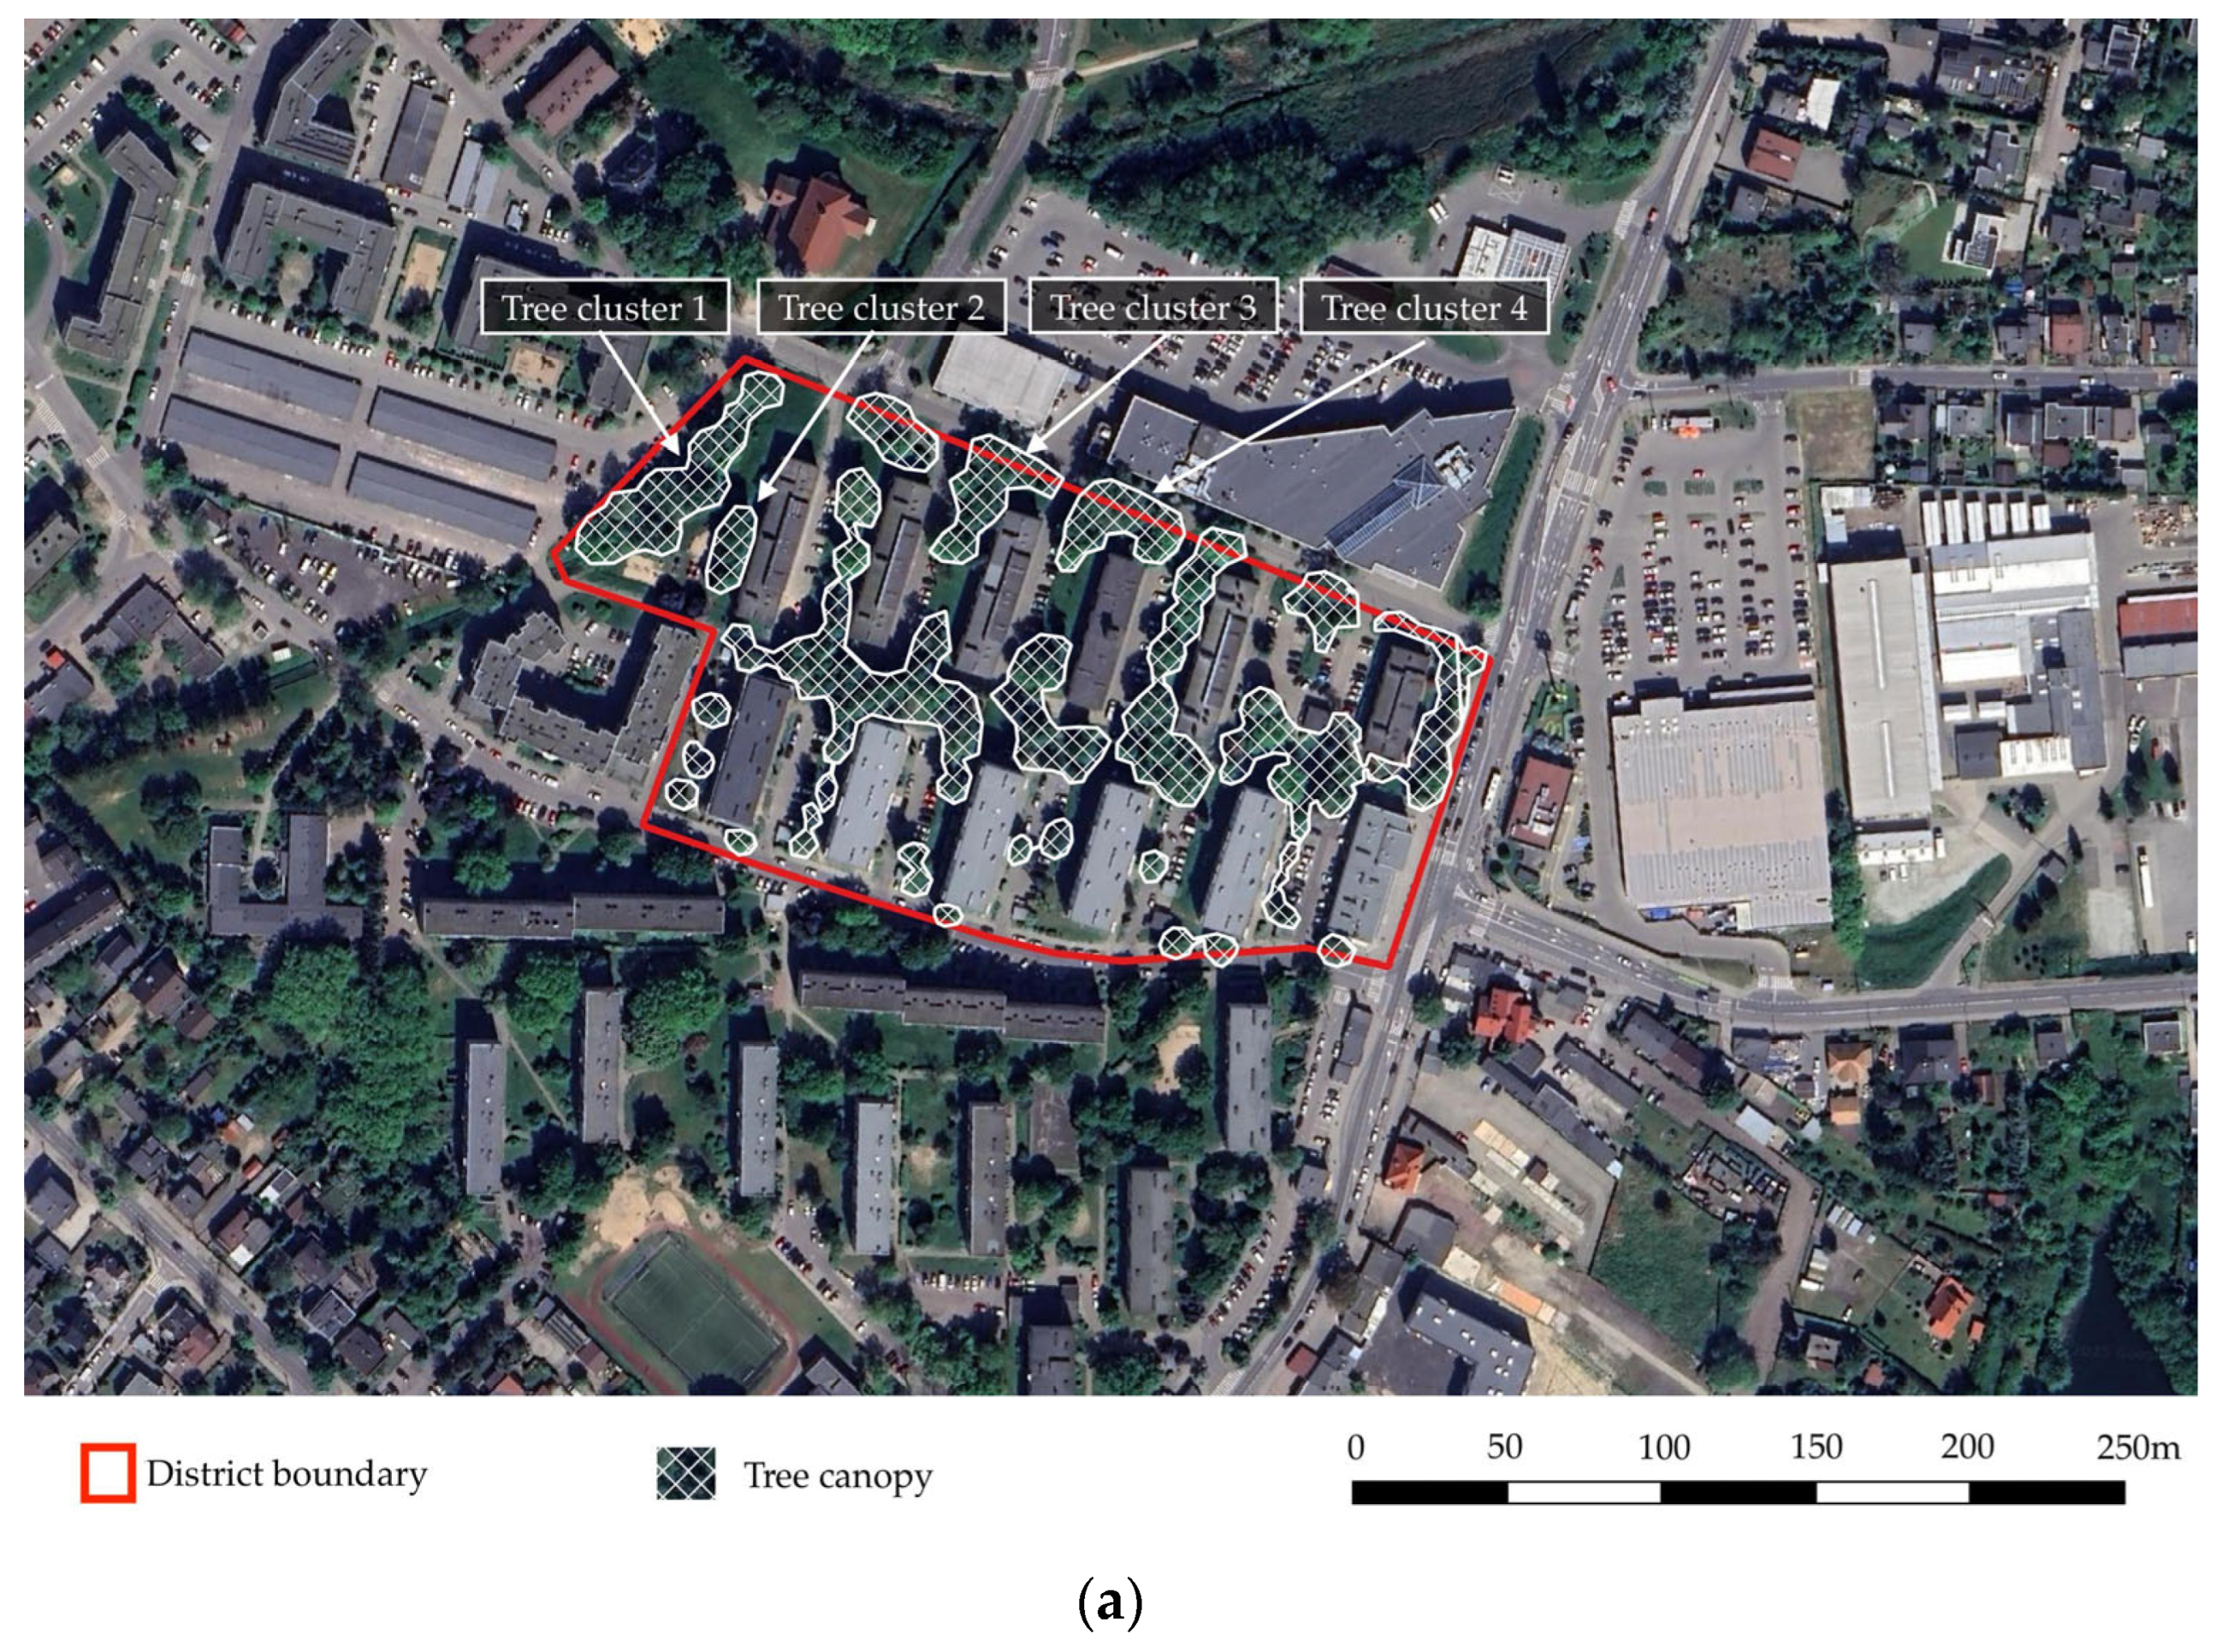
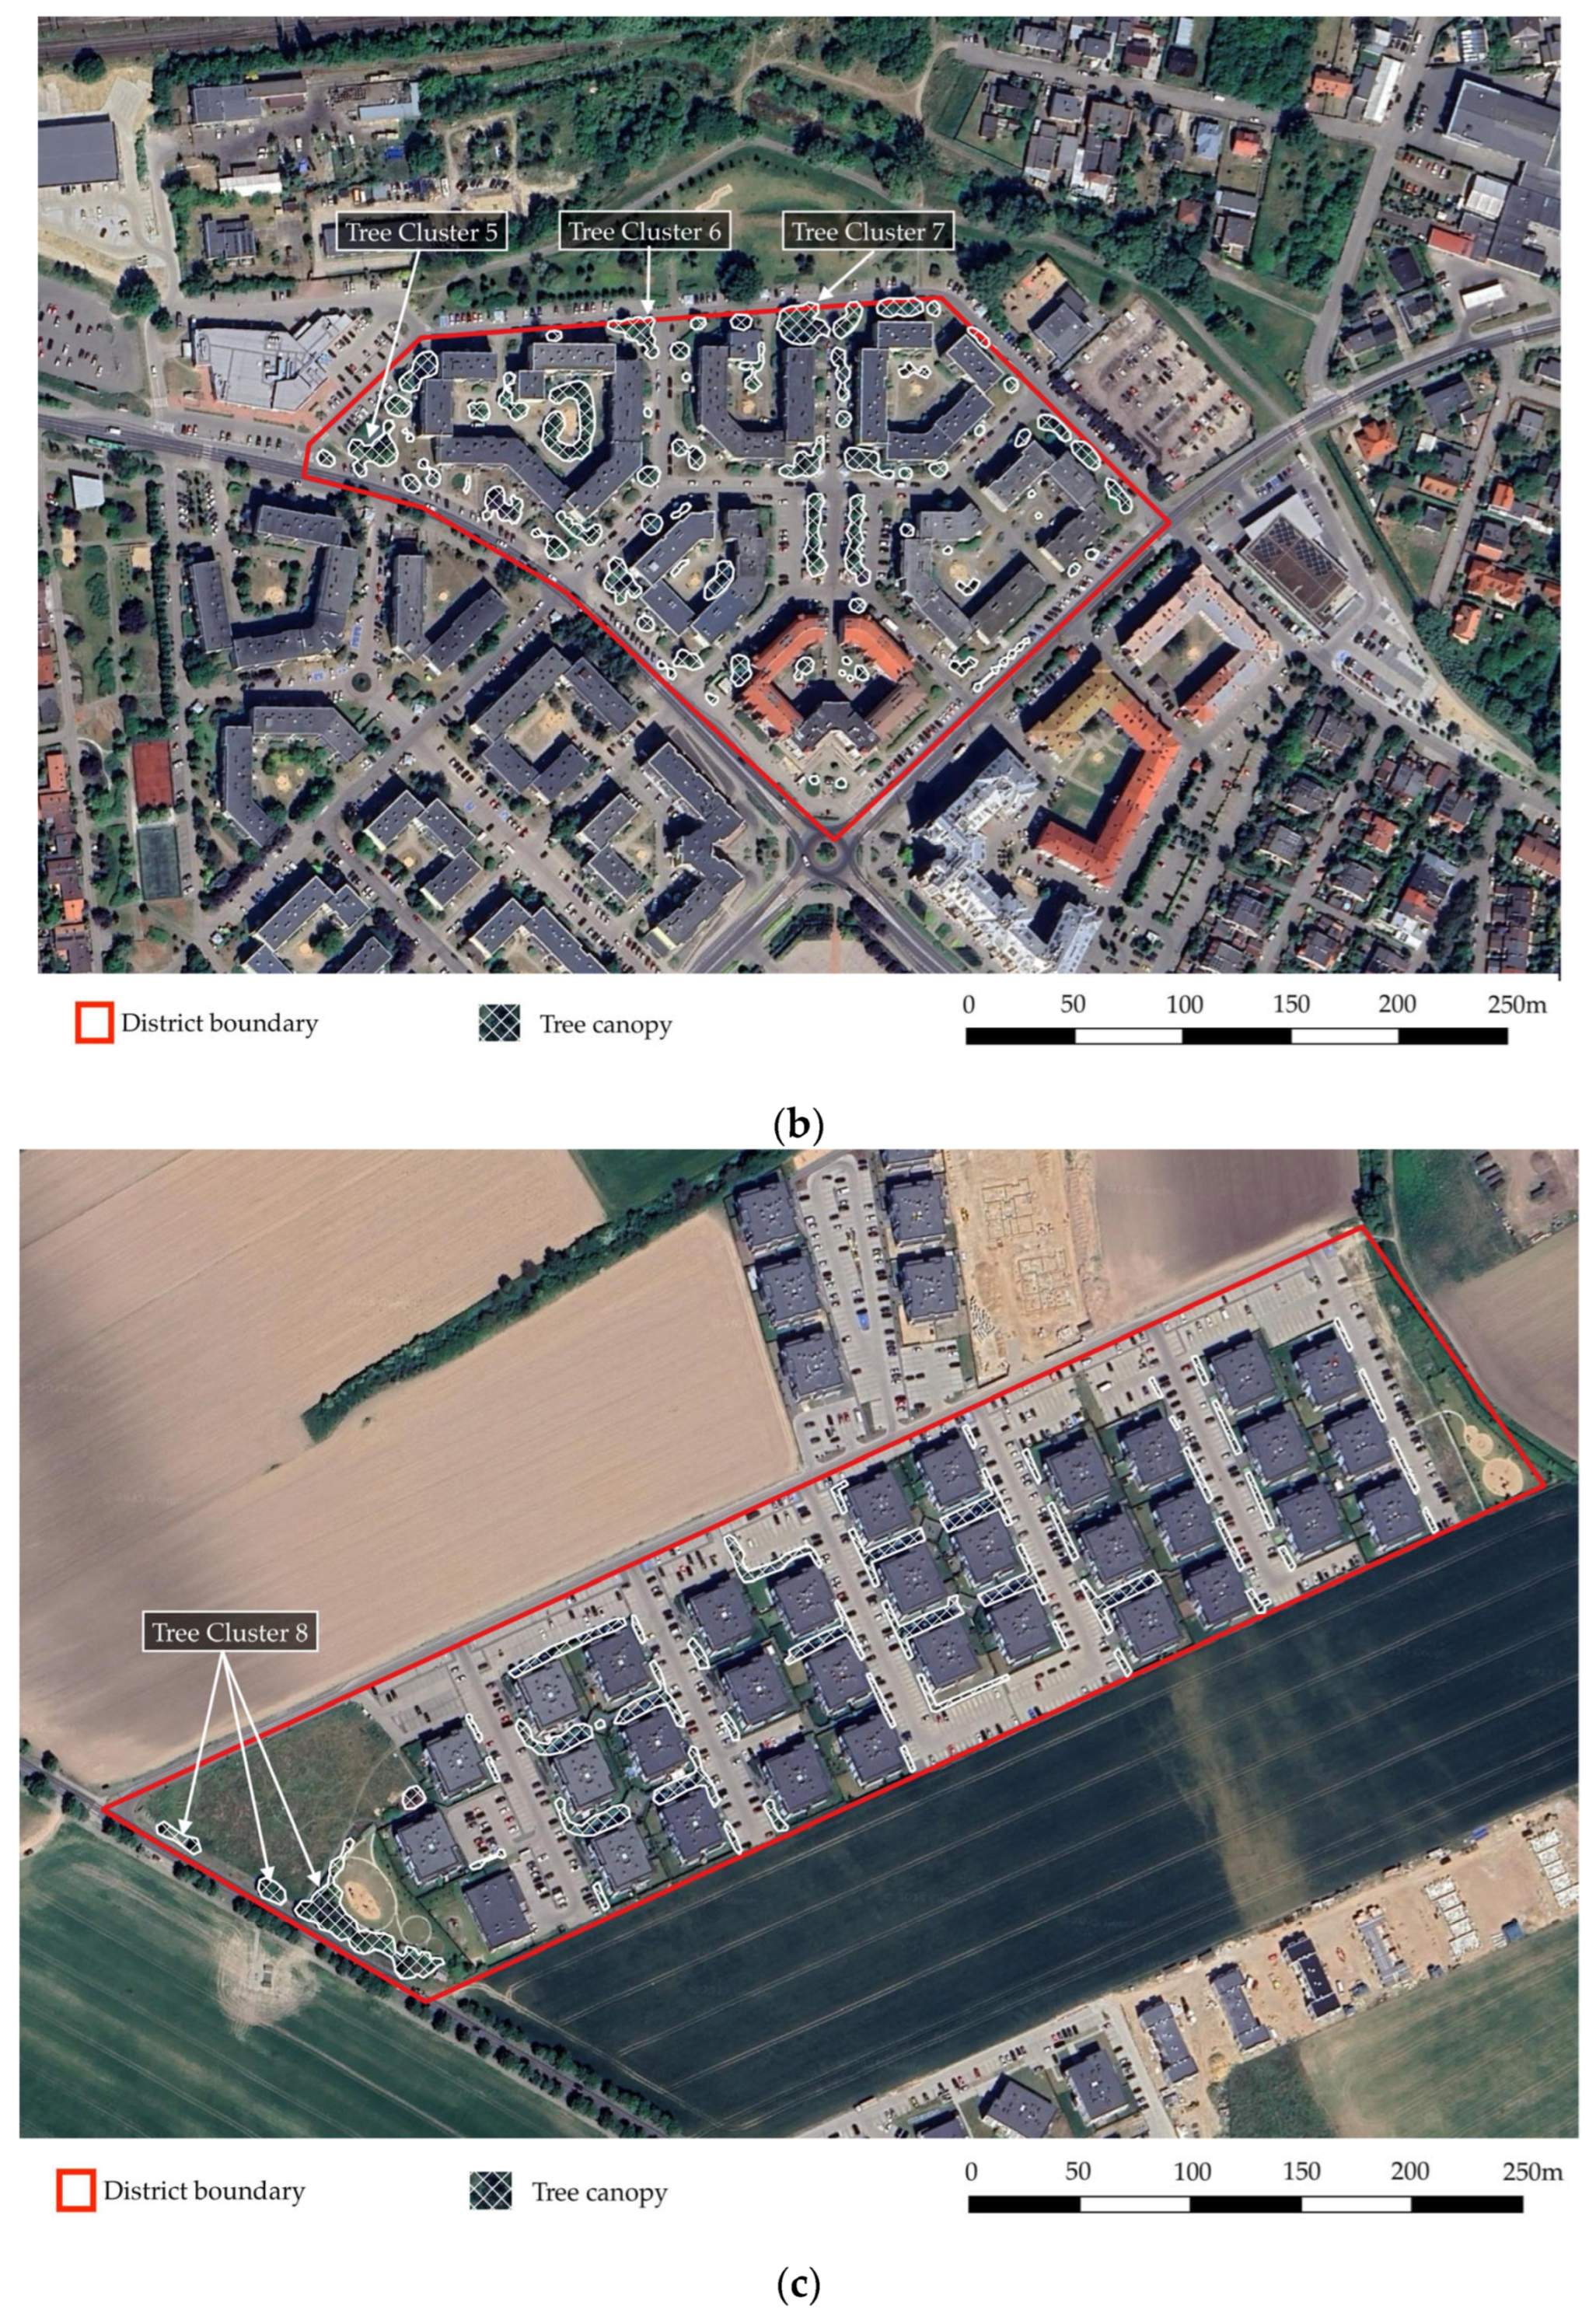
2.1. Study Area
2.2. Materials
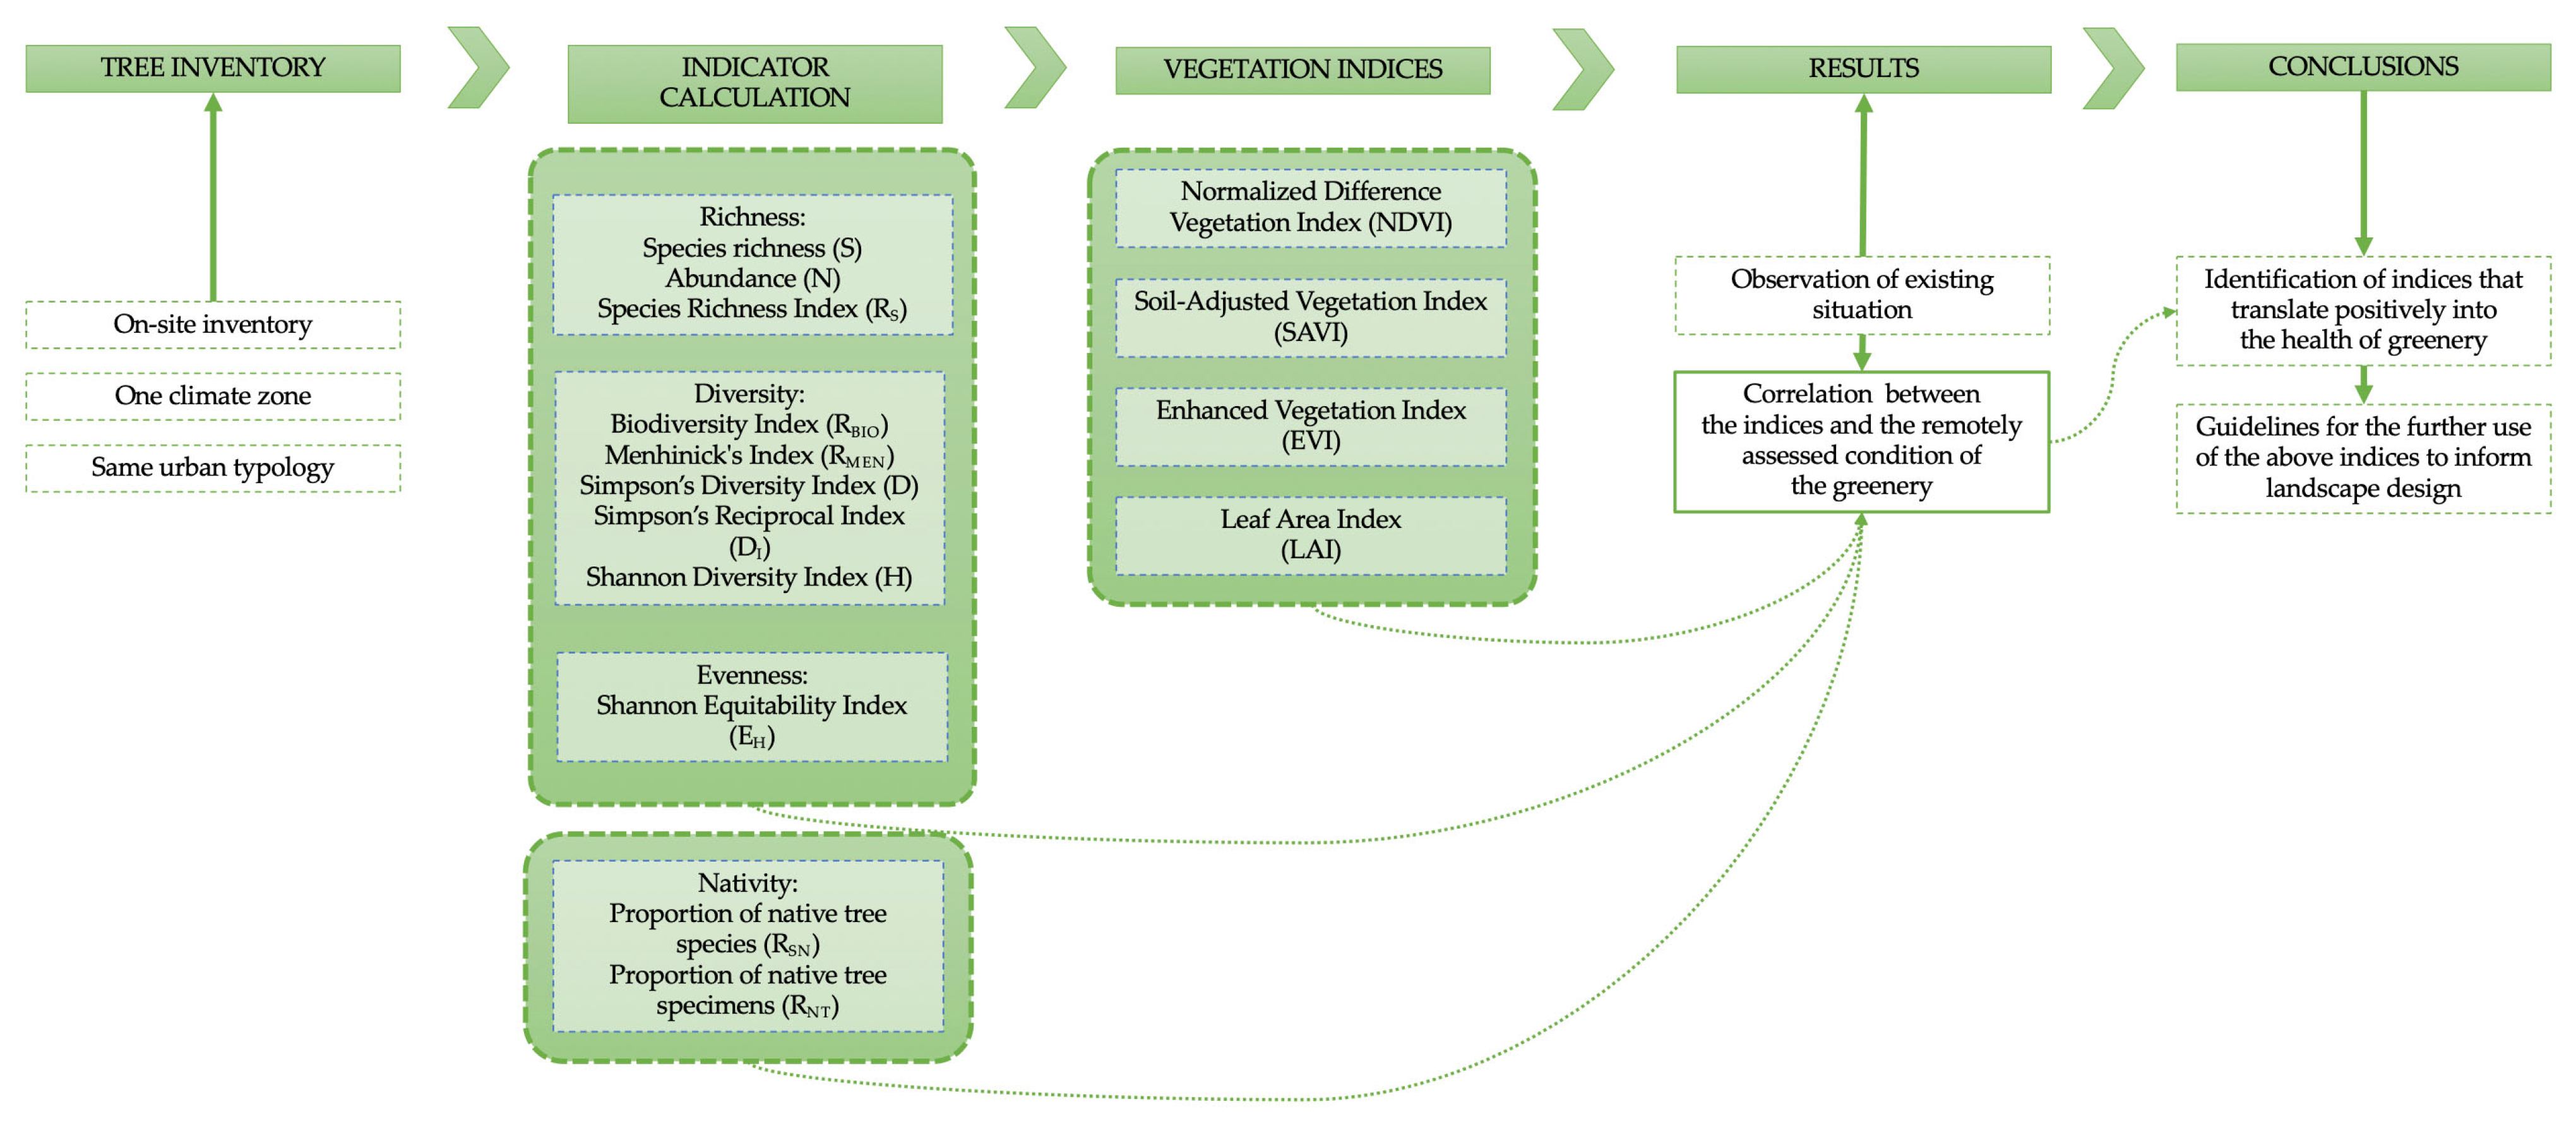
2.3. Methodology
2.3.1. Indicators of Species Richness, Abundance, Diversity, and Evenness
2.3.2. Tree Nativity Analysis
2.3.3. Vegetation Indices (VIs)
3. Results
3.1. The Diversity, Nativity, and Condition of Popular Treescapes in Multi-Family Residential Districts
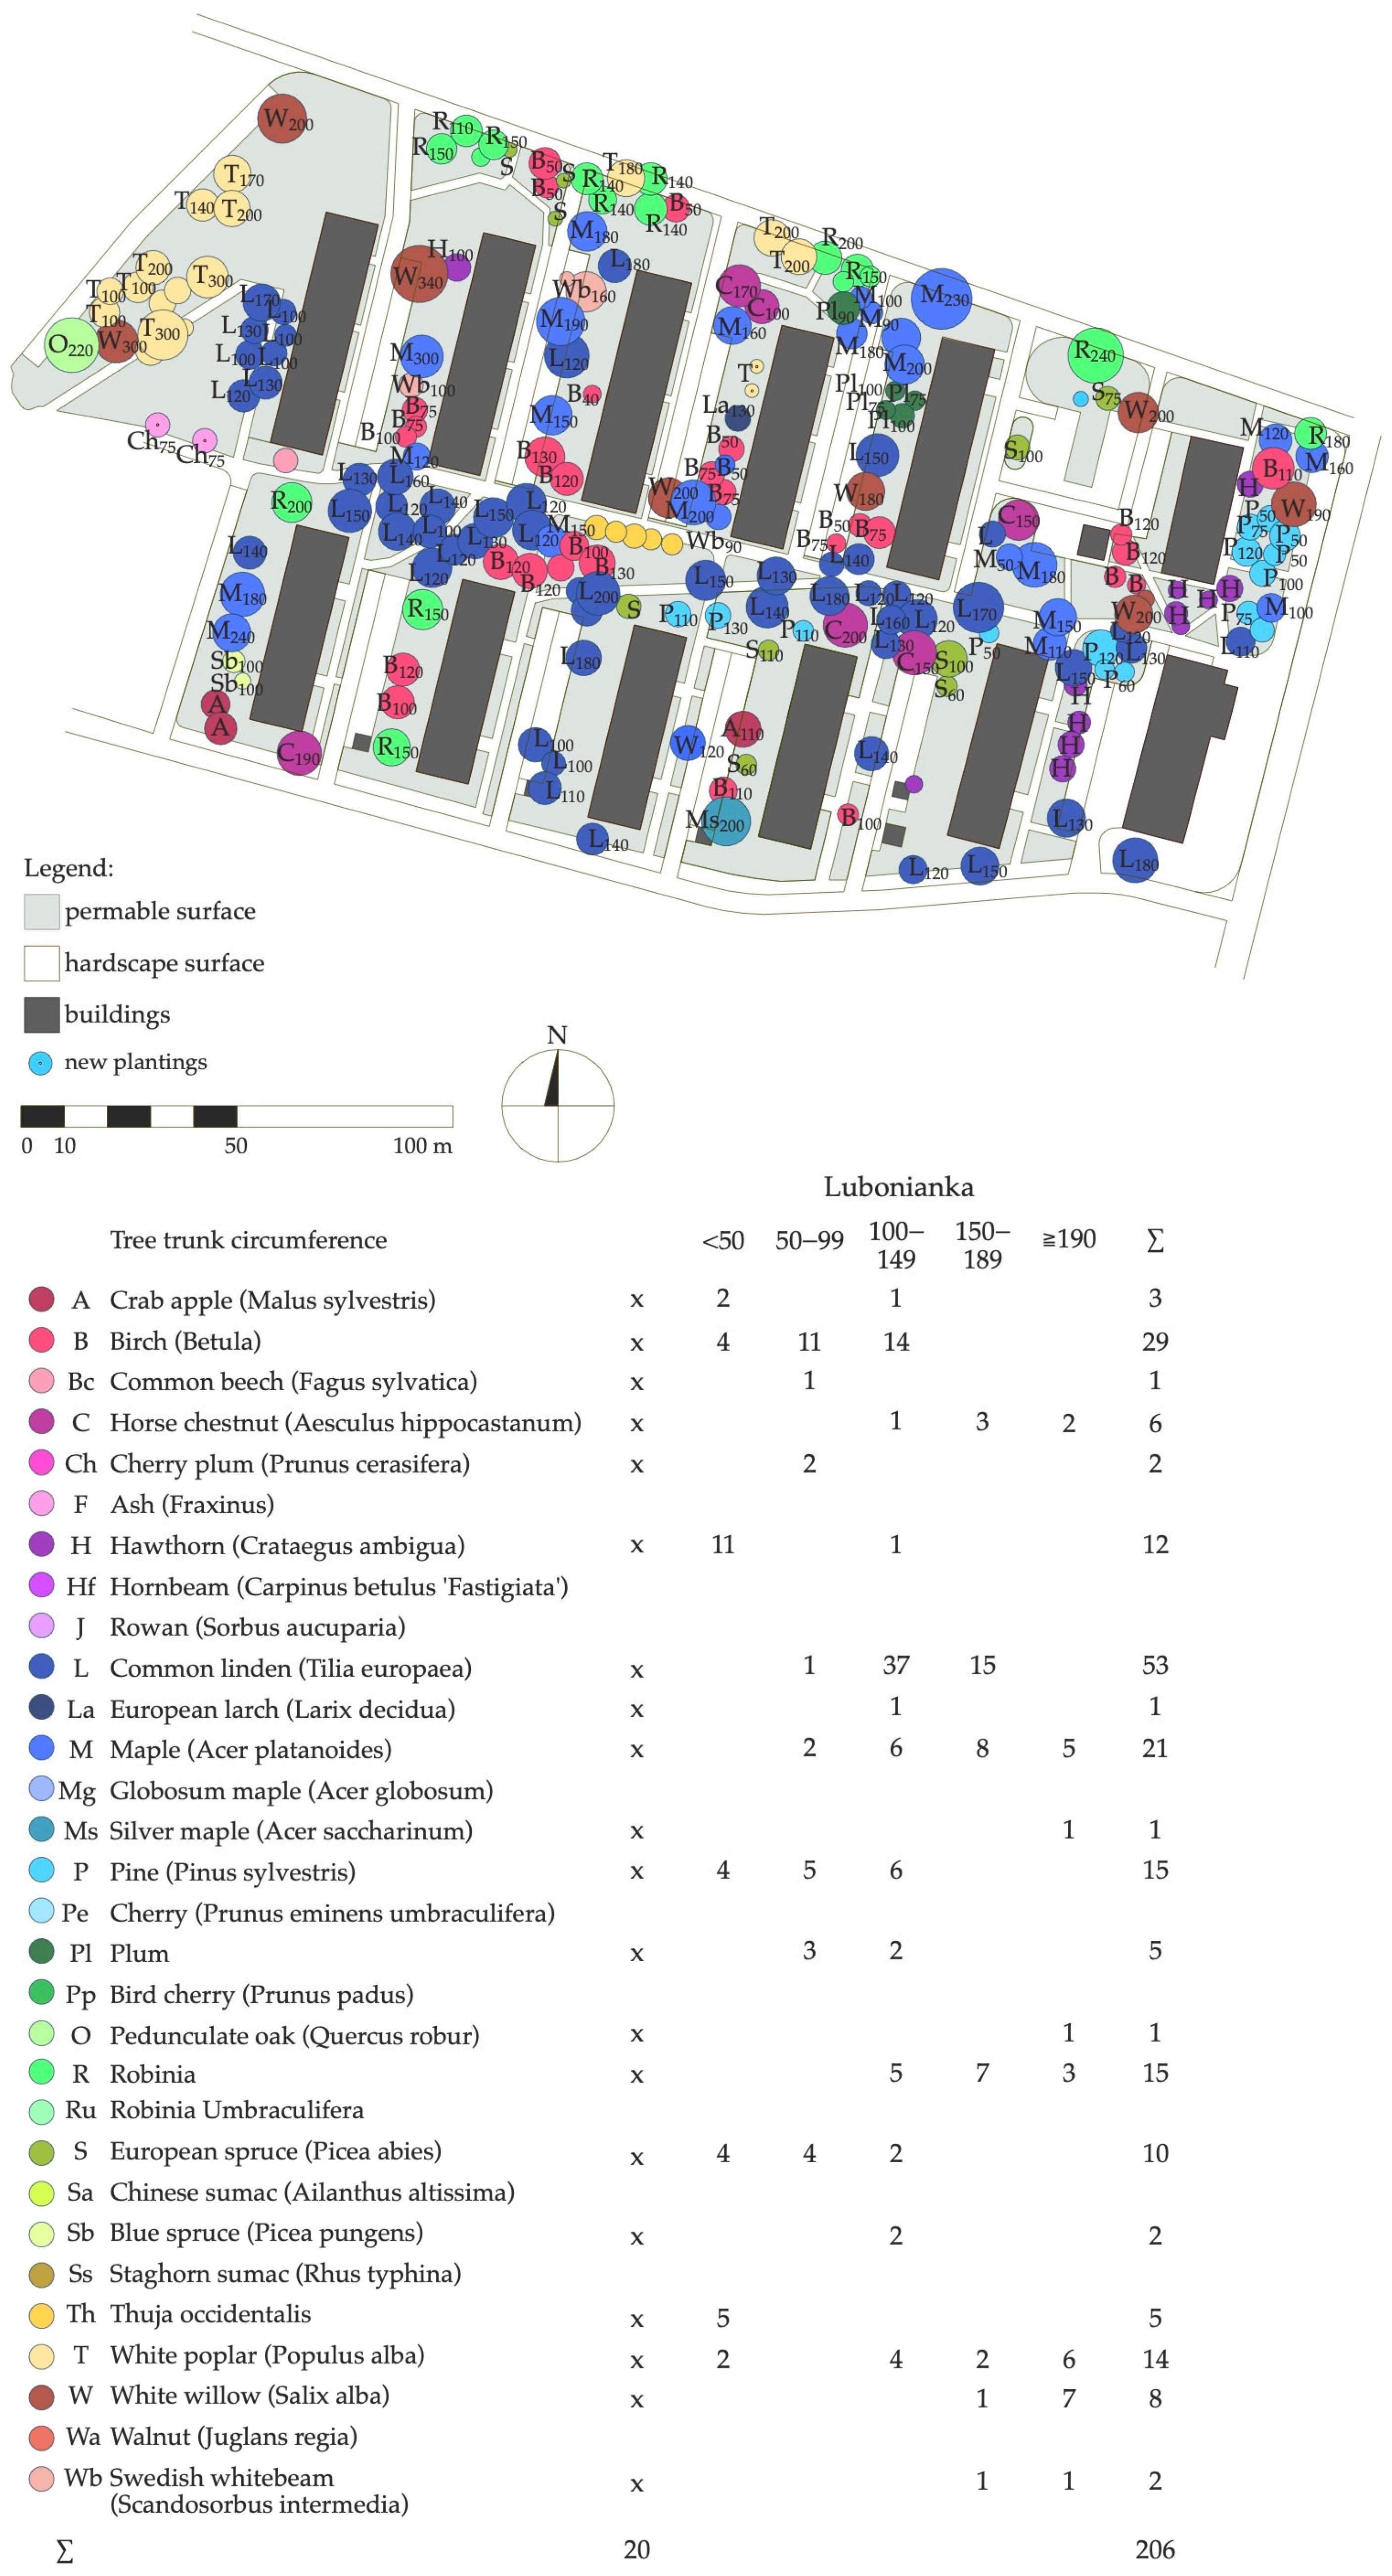
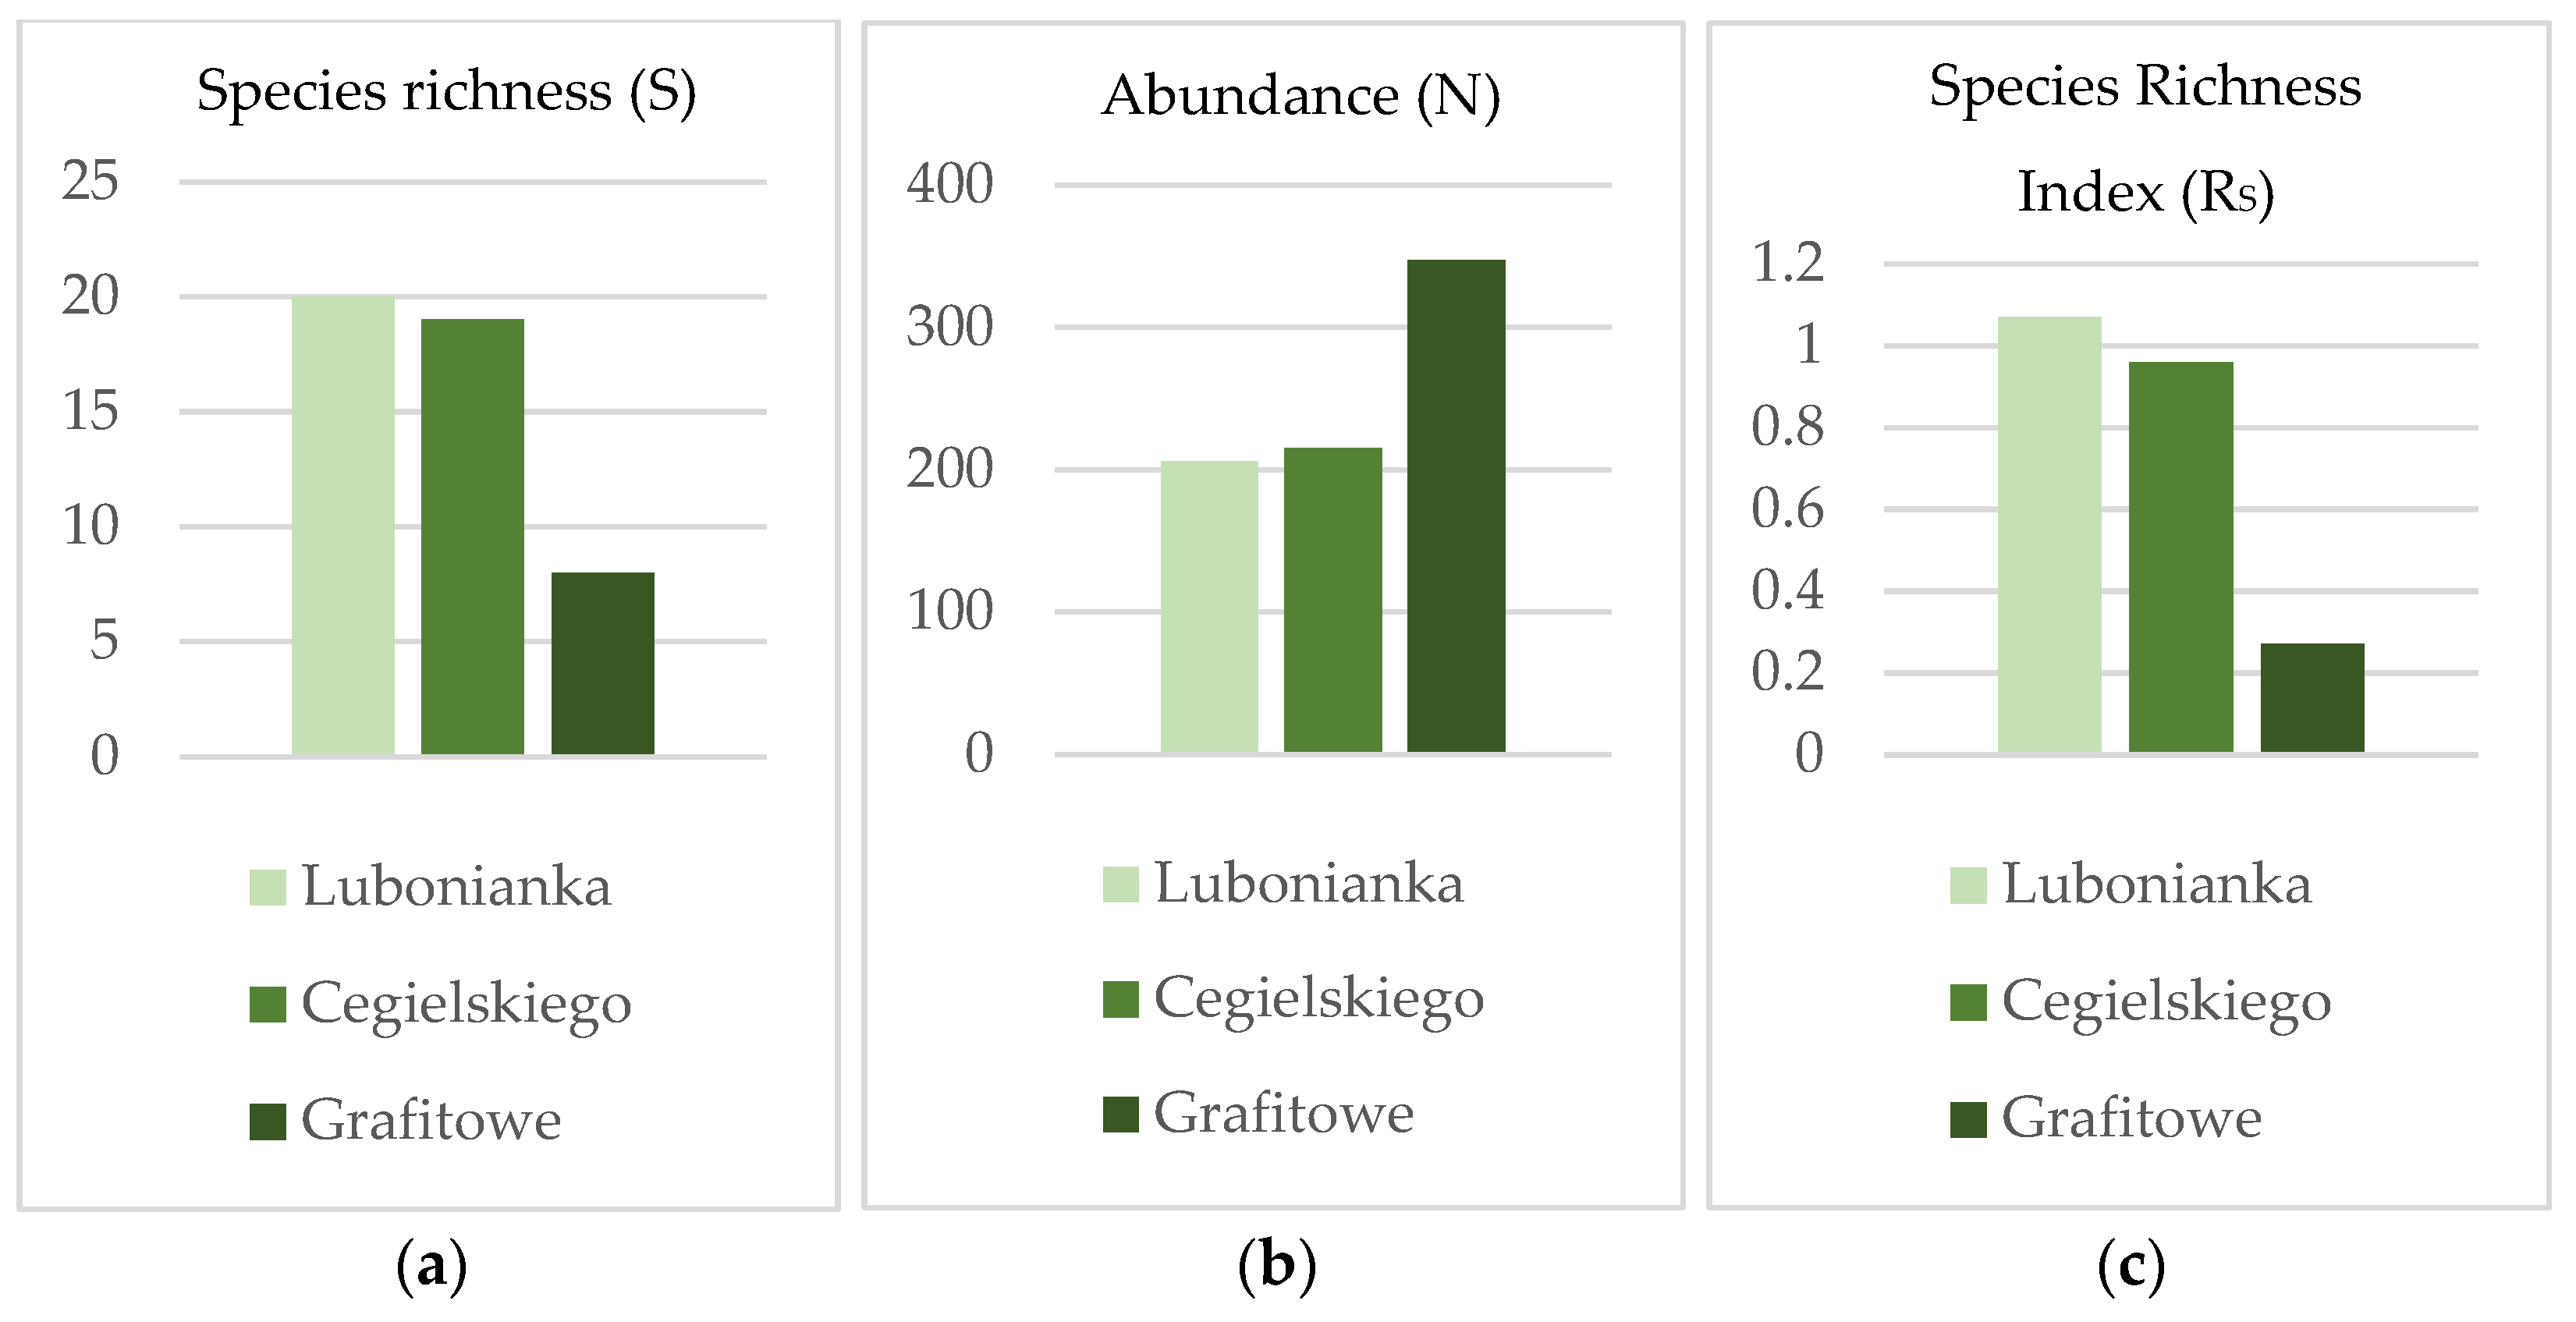
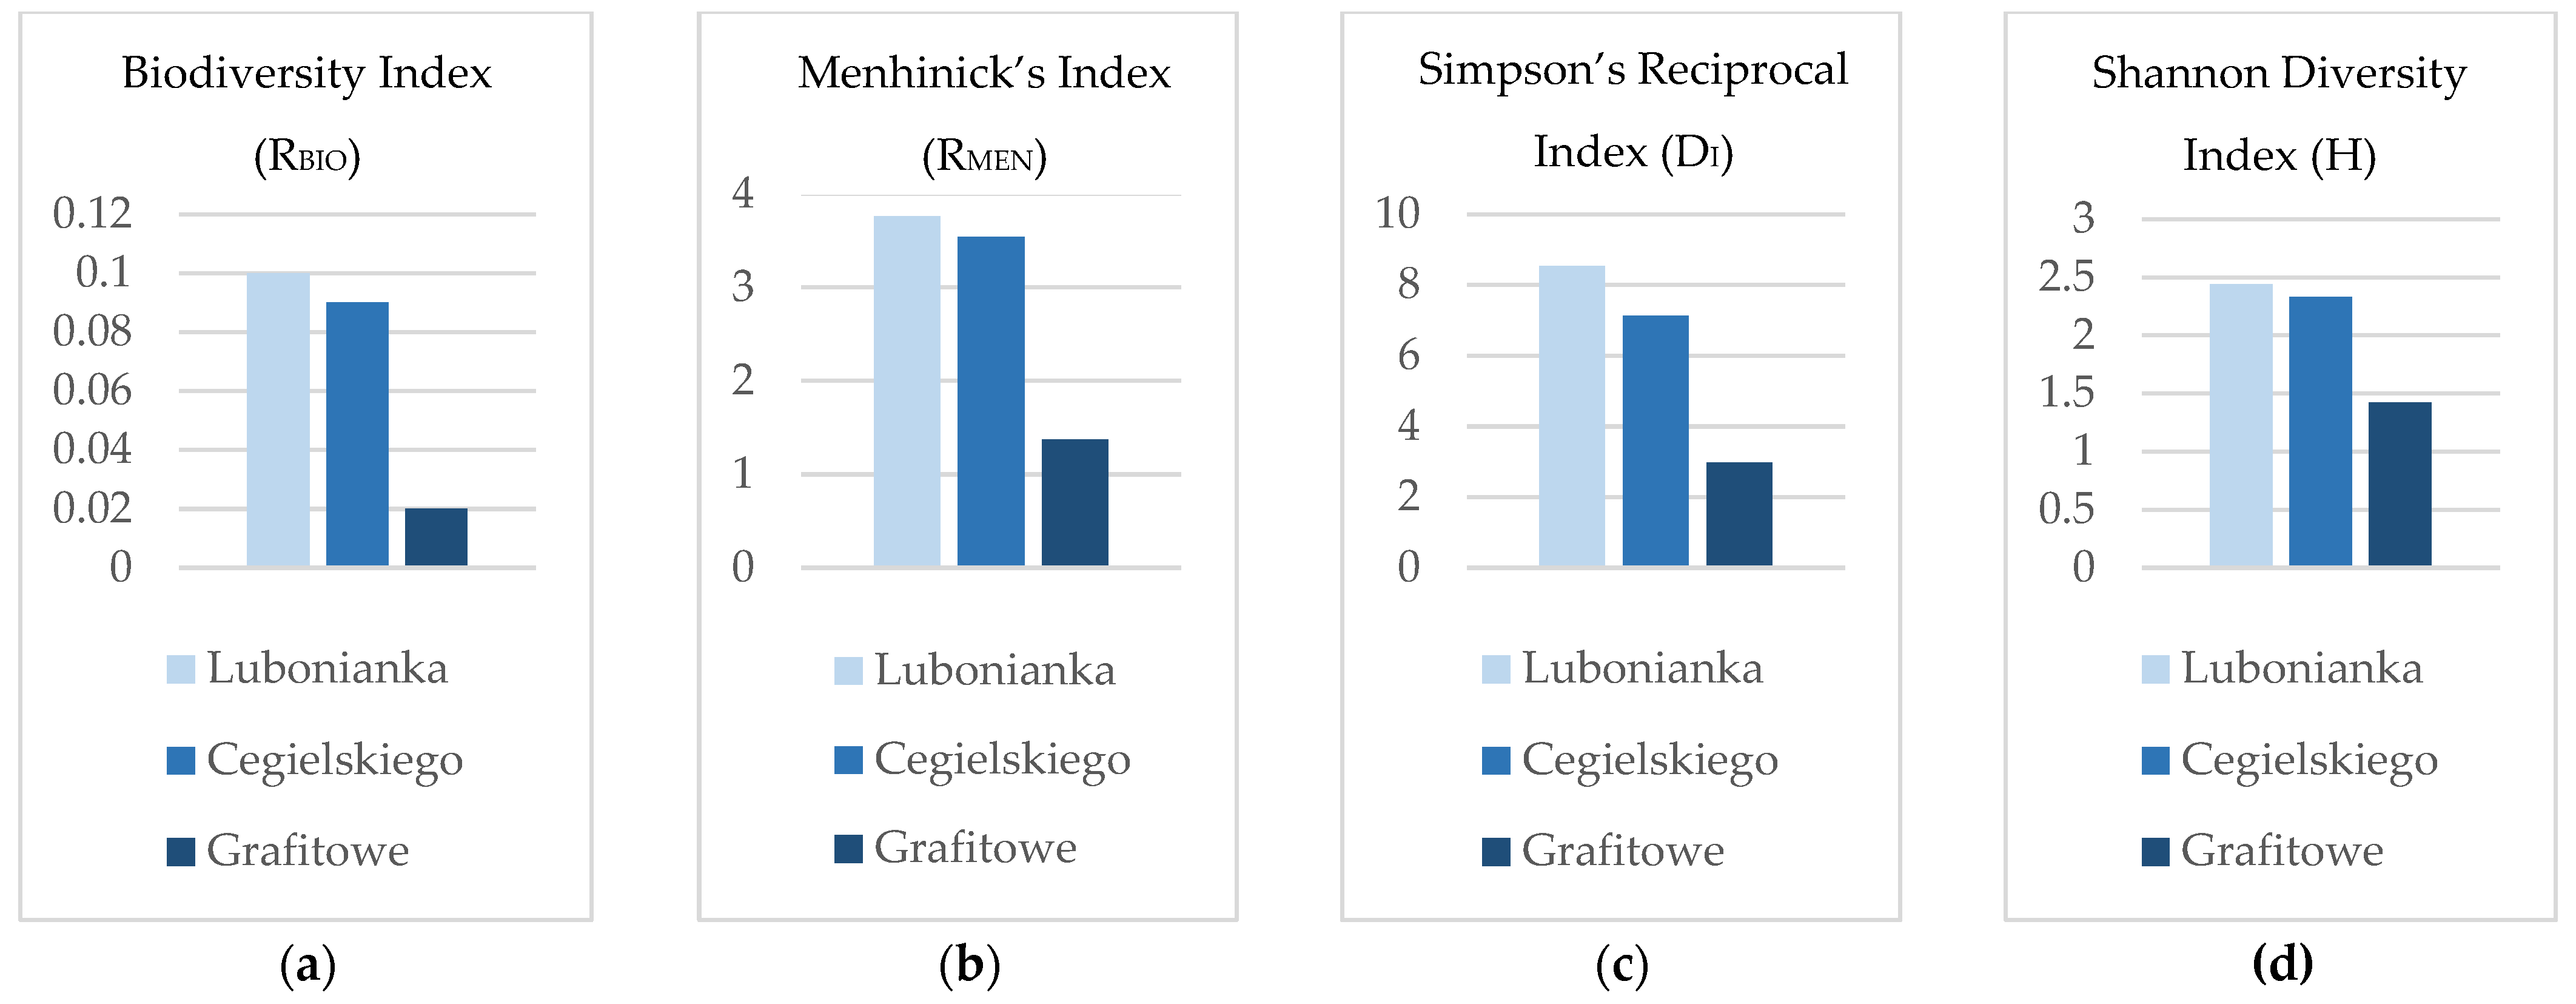
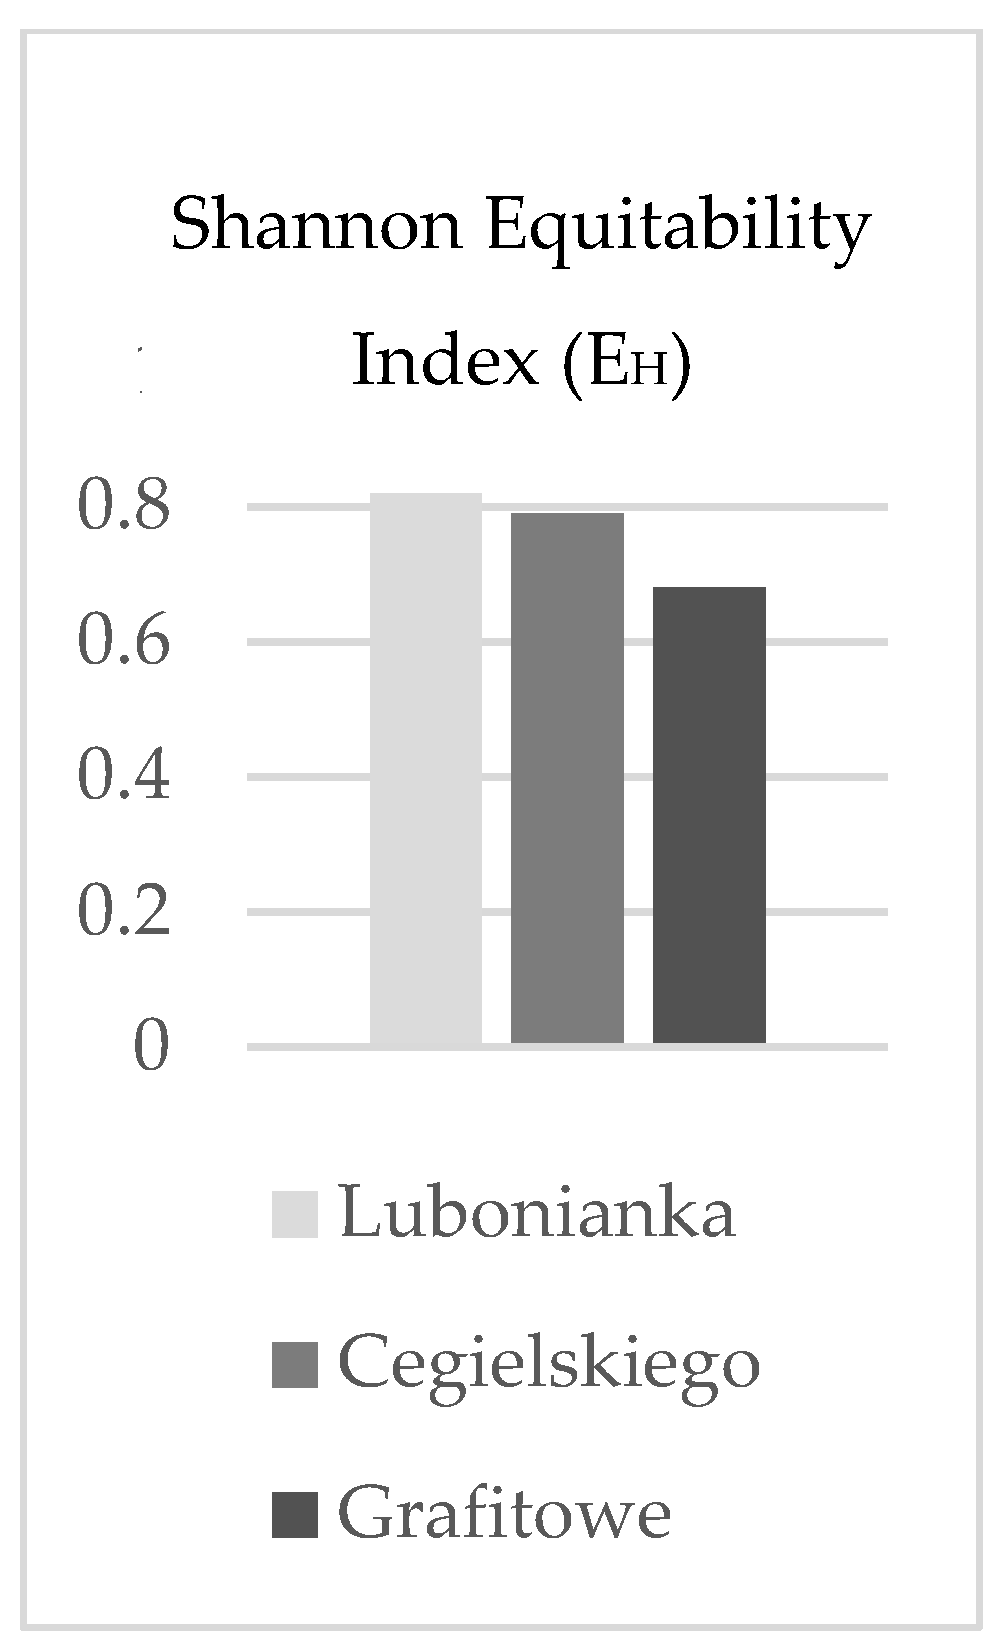
3.1.1. The Greater Diversity of the Tree Community in the Oldest of Three Suburban Housing Estates in Terms of the Species Richness, Diversity, and Evenness
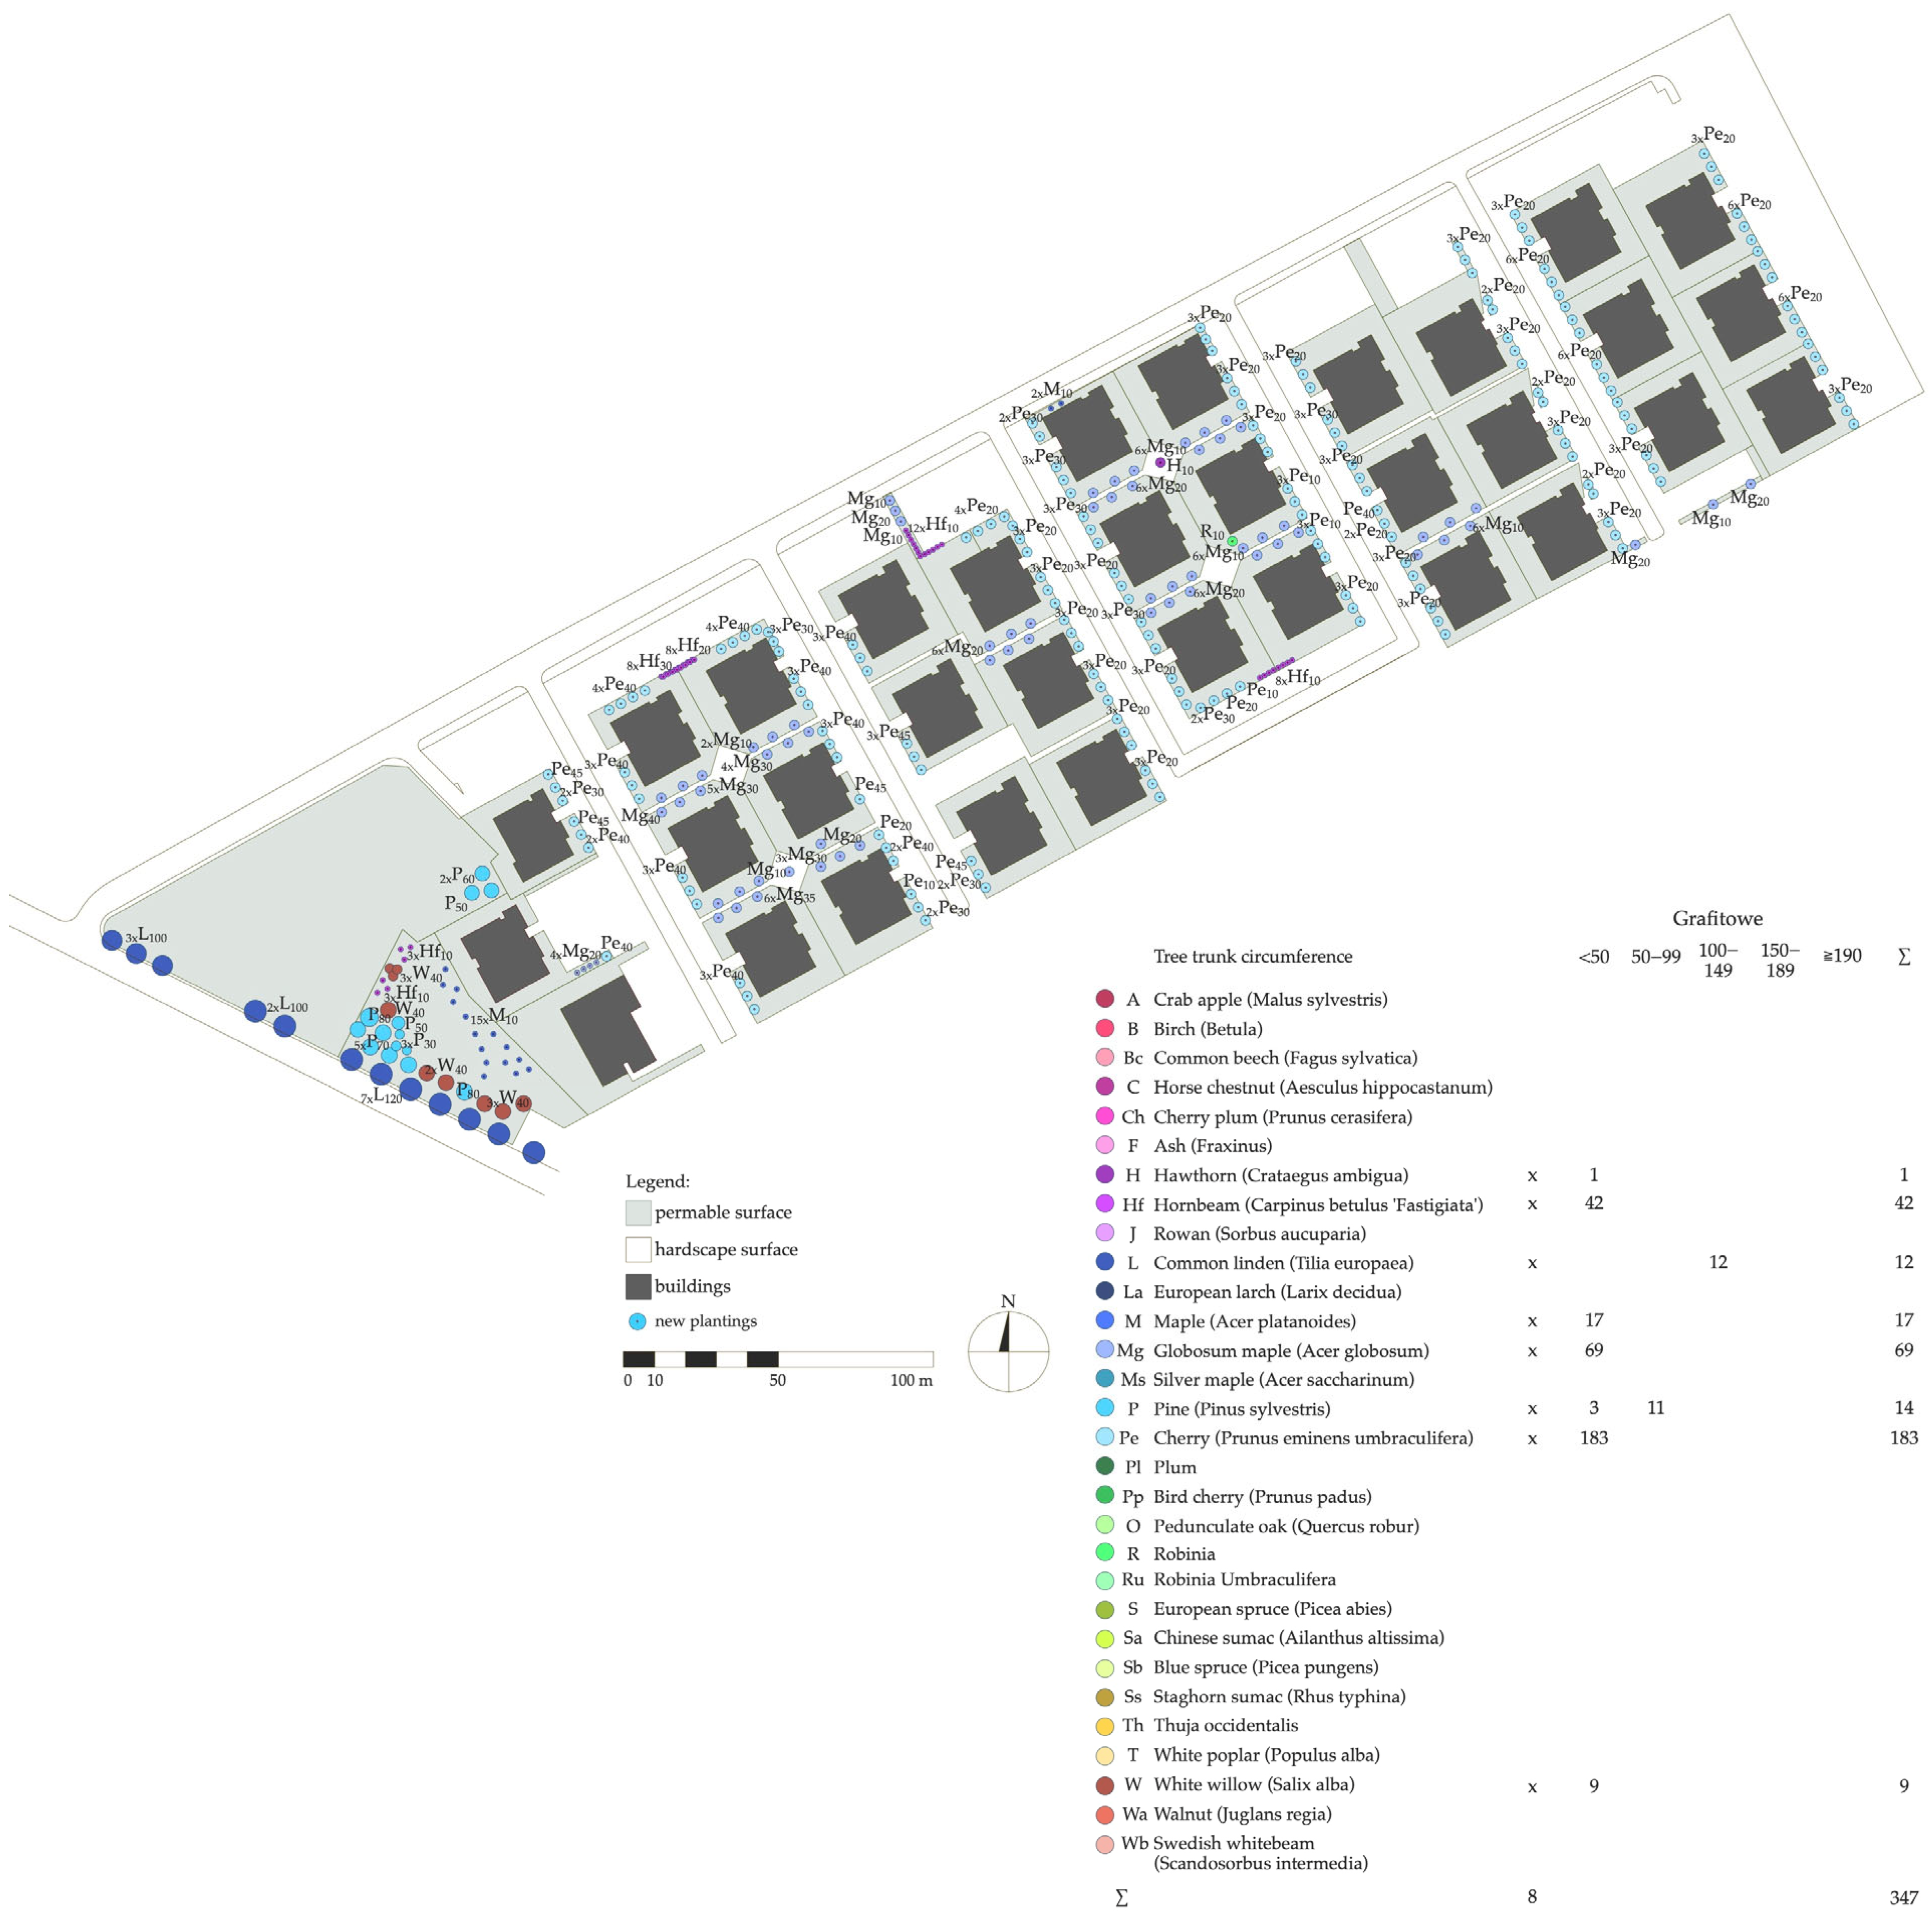
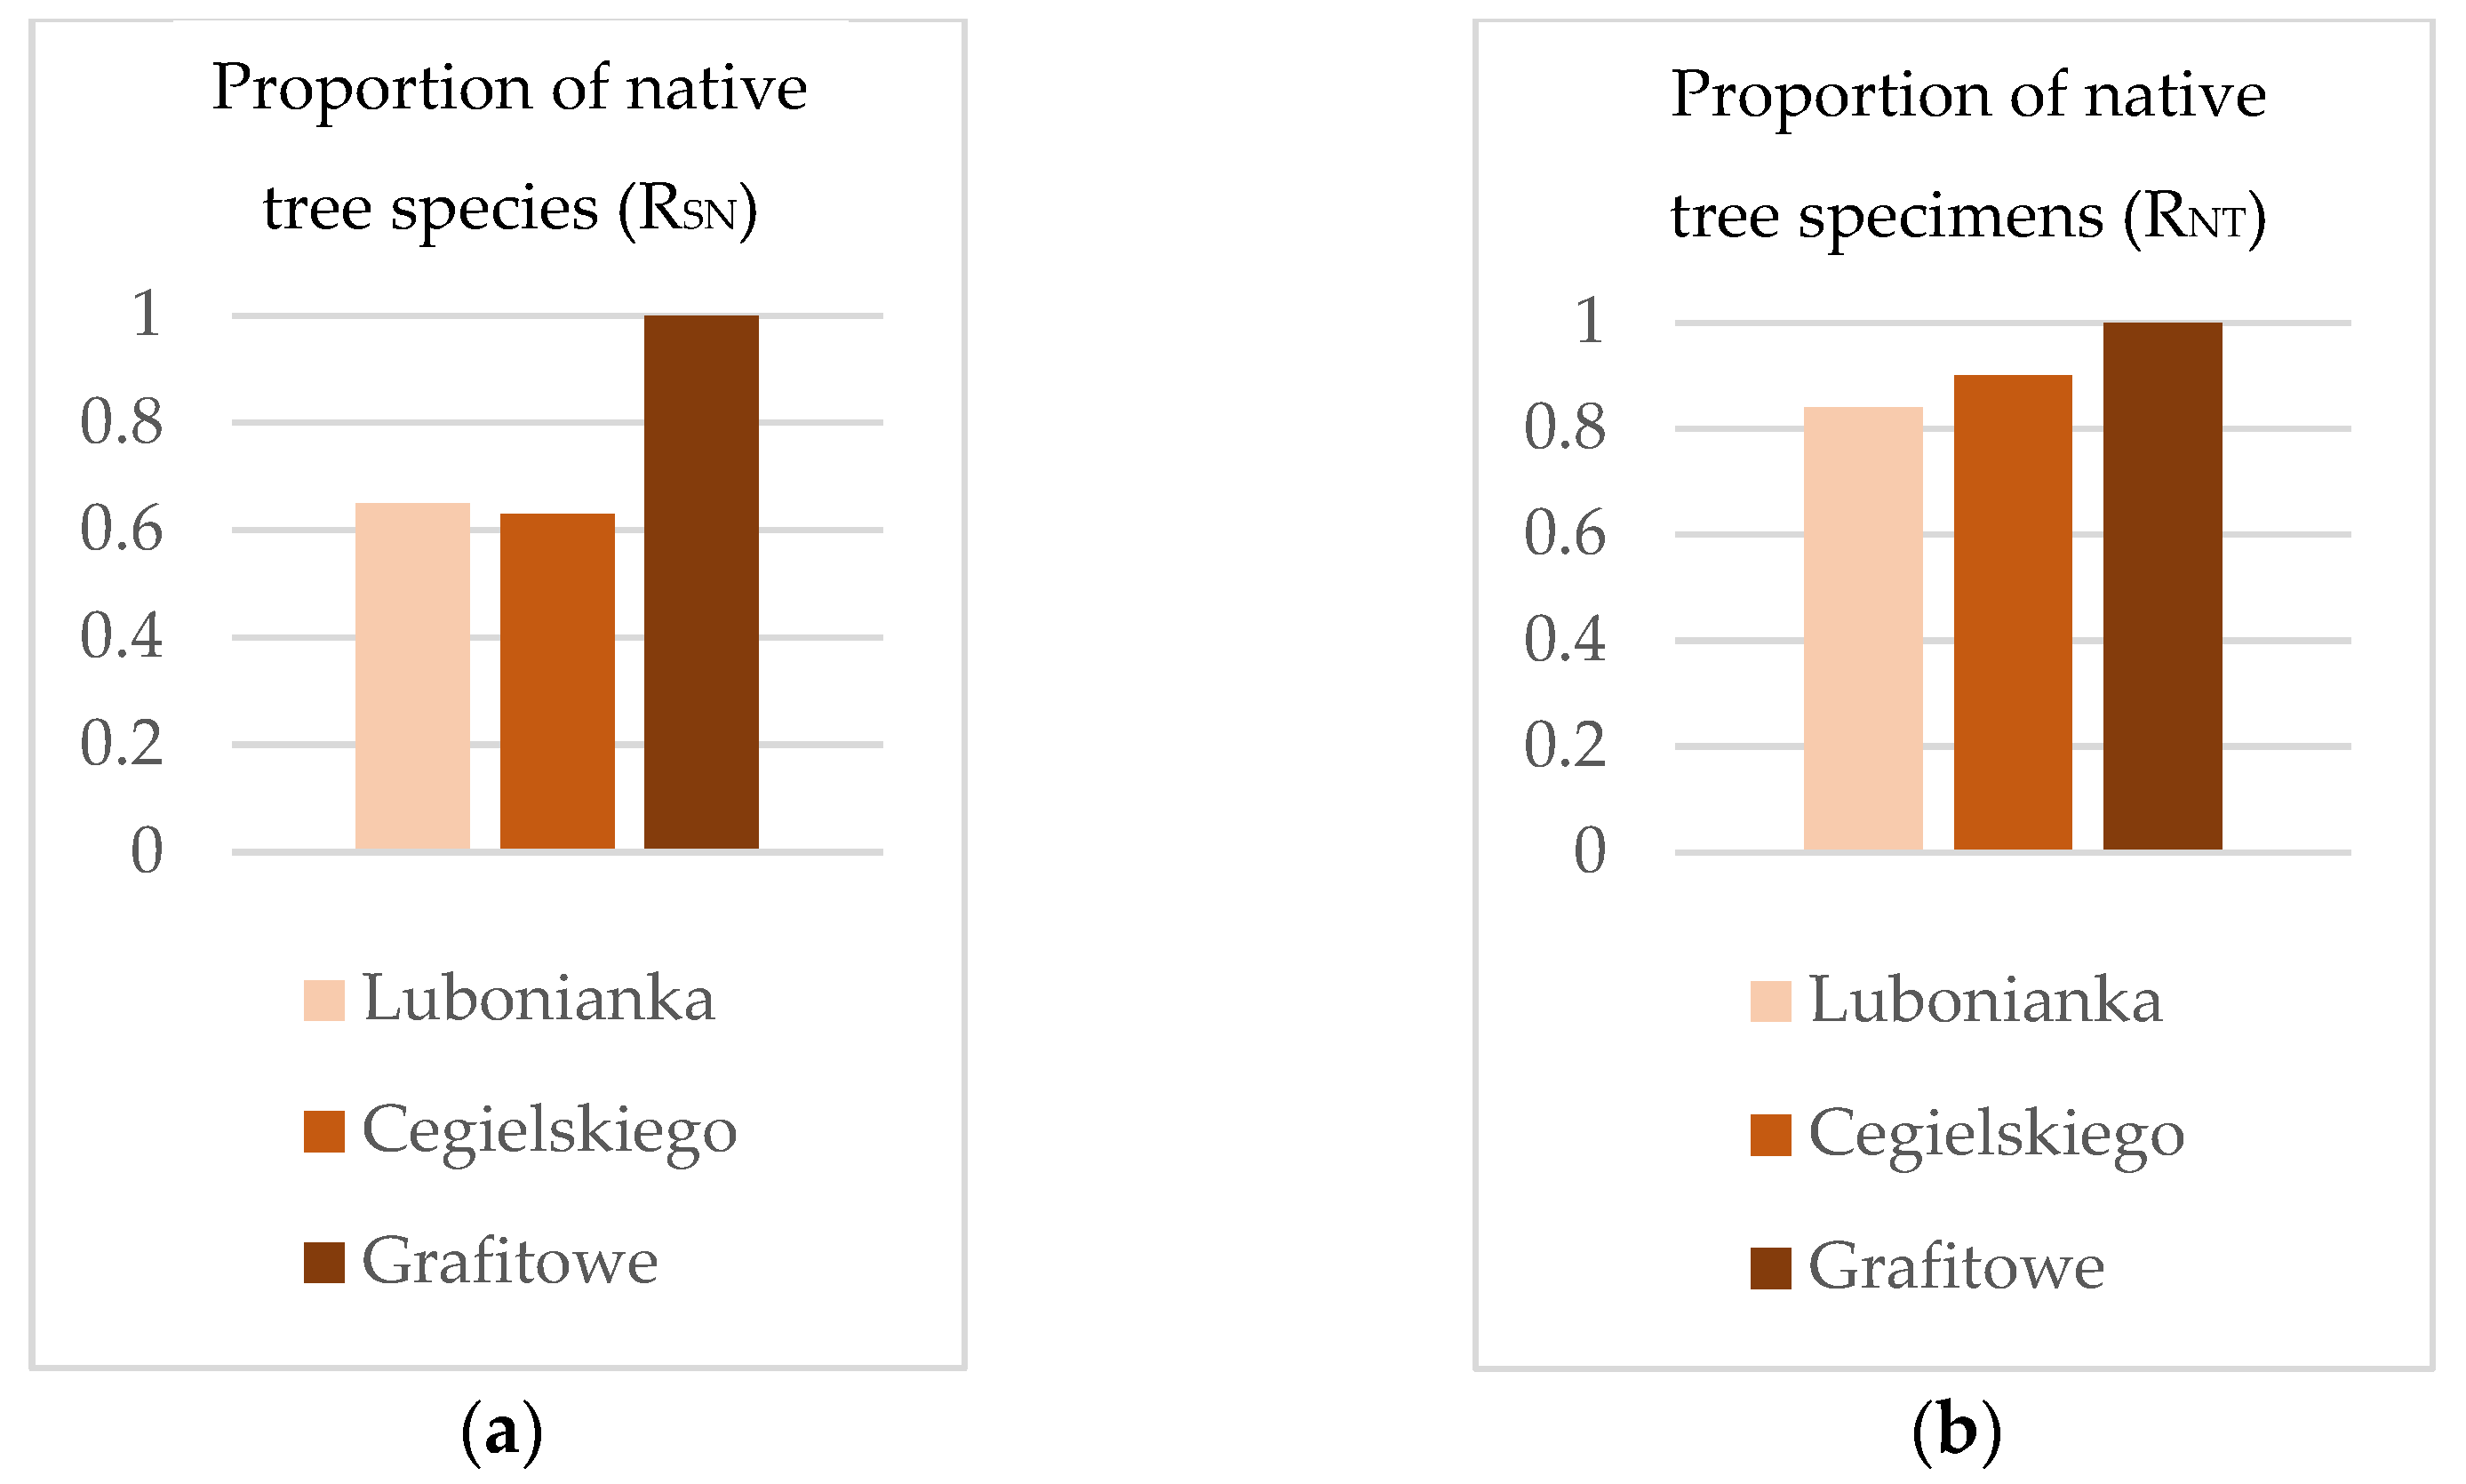
3.1.2. The Newest of the Three Compared Districts Had the Highest Percentage of Native Trees
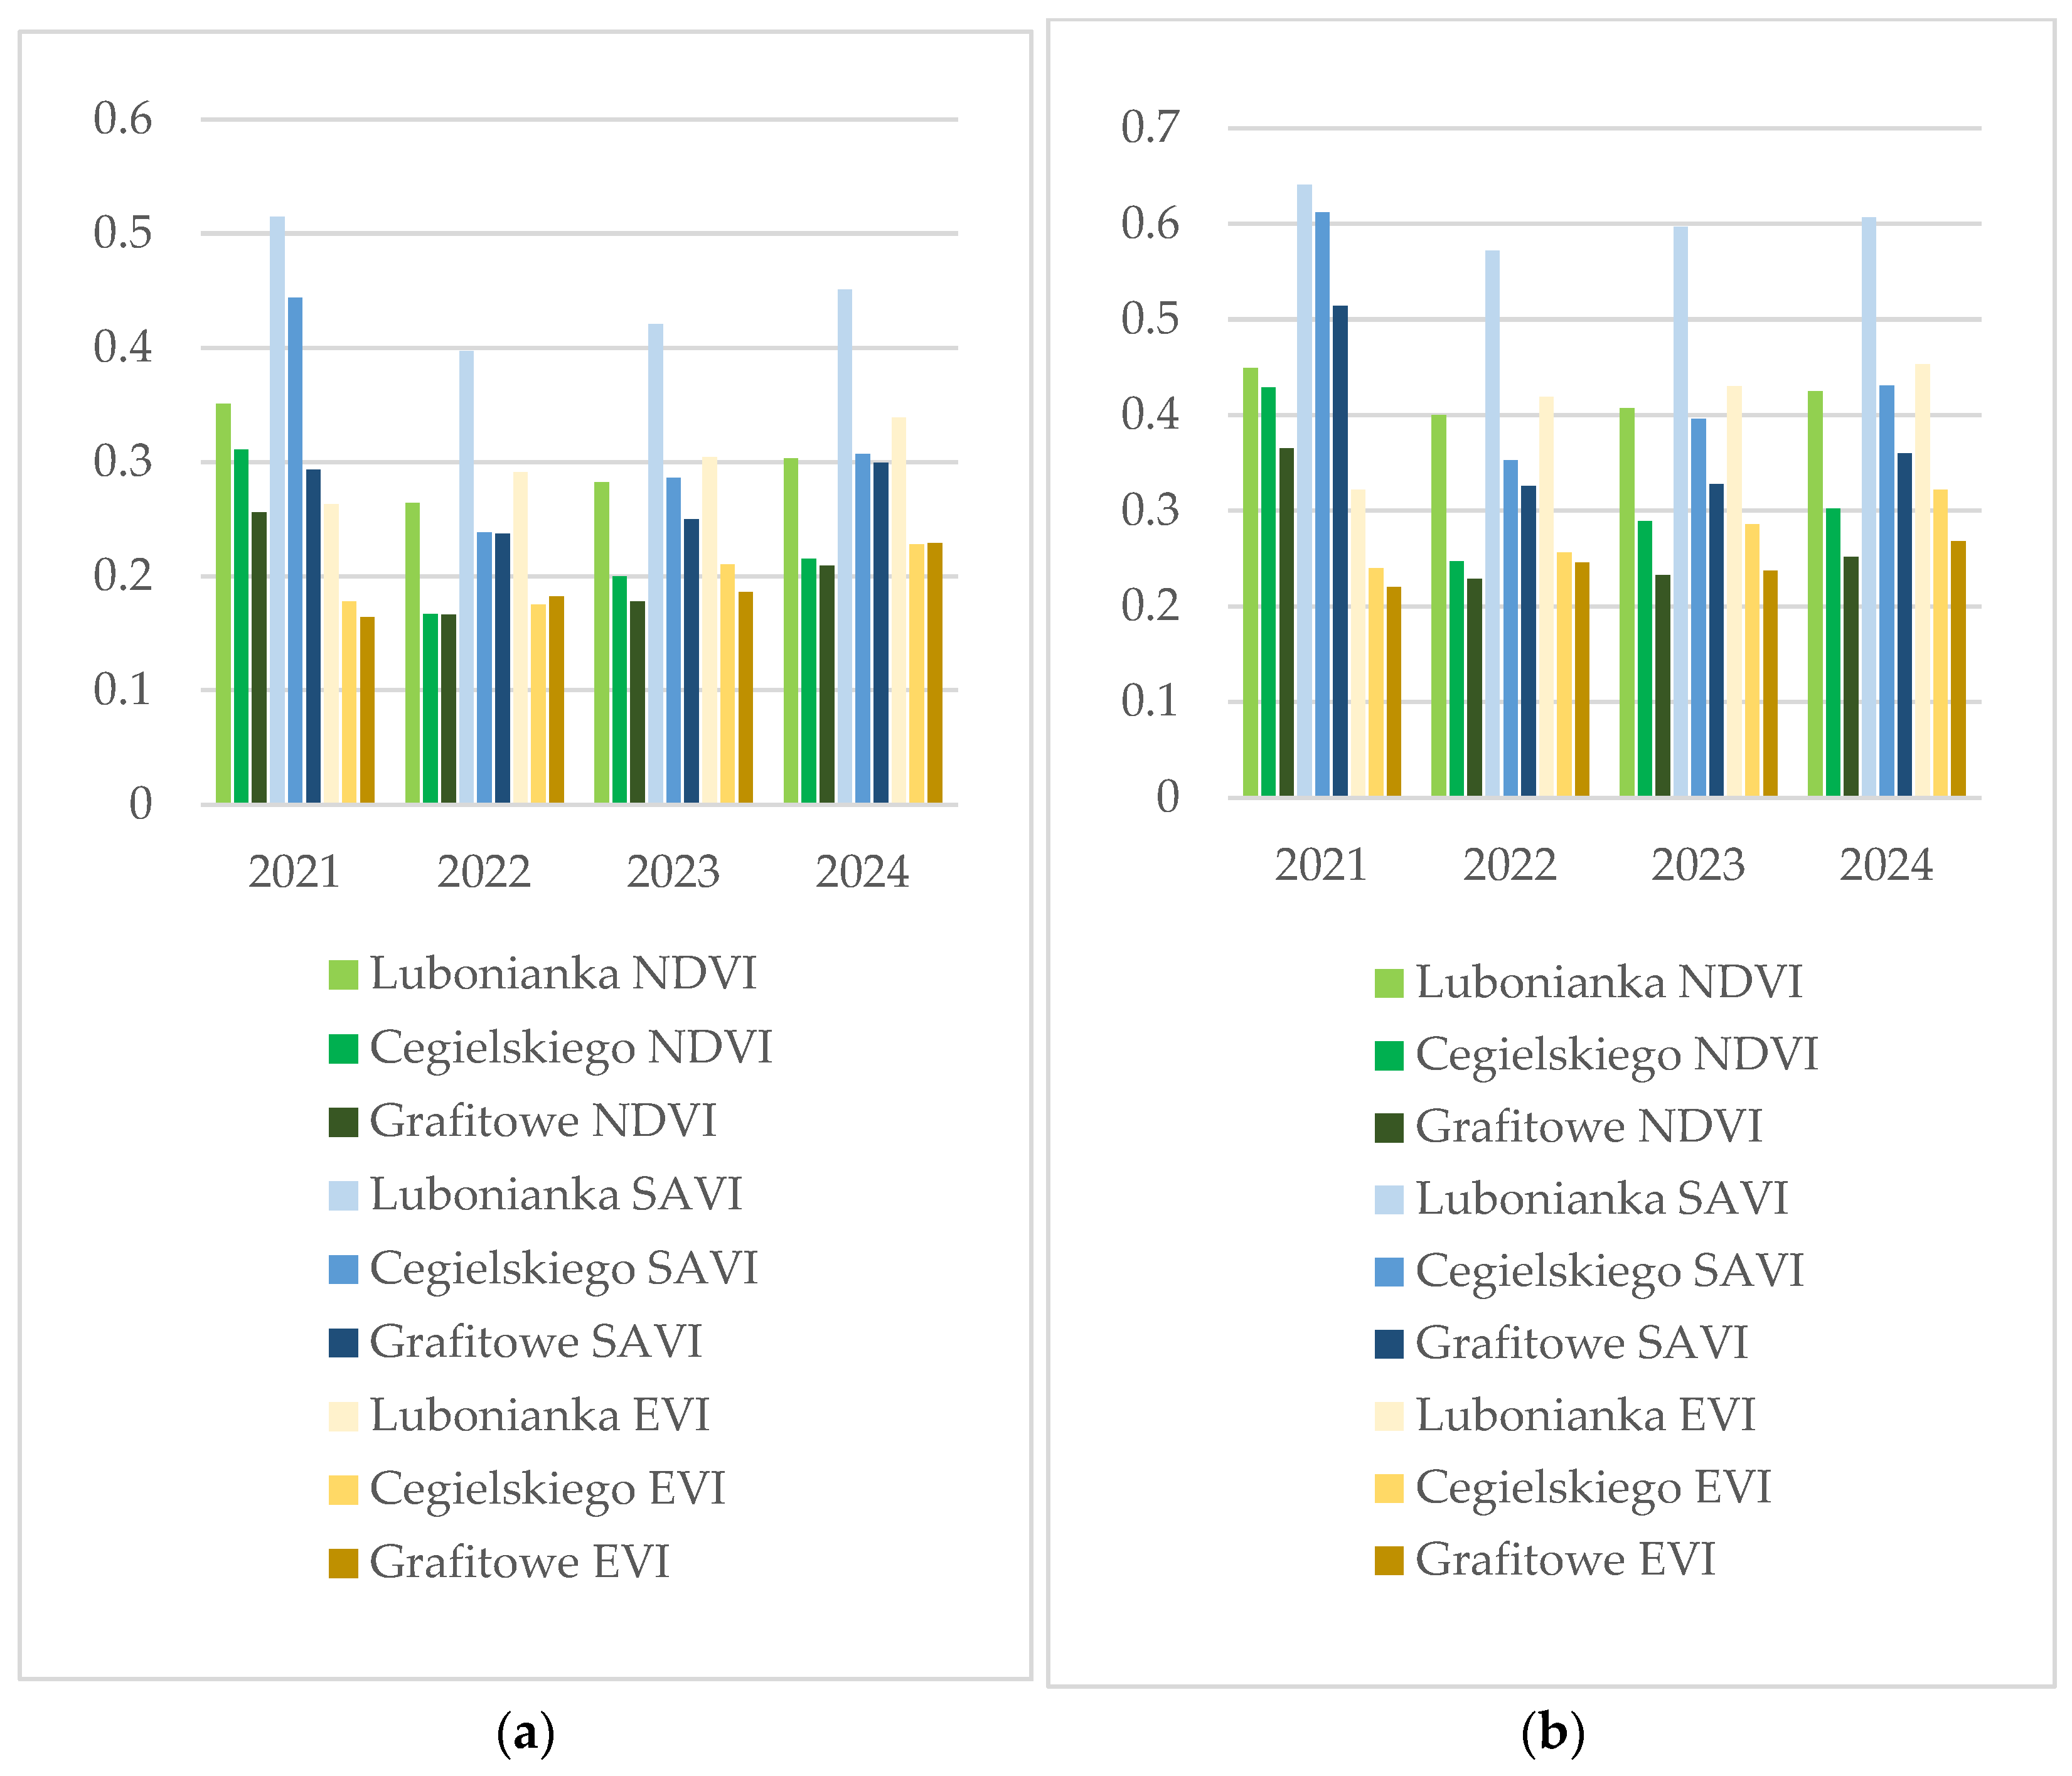
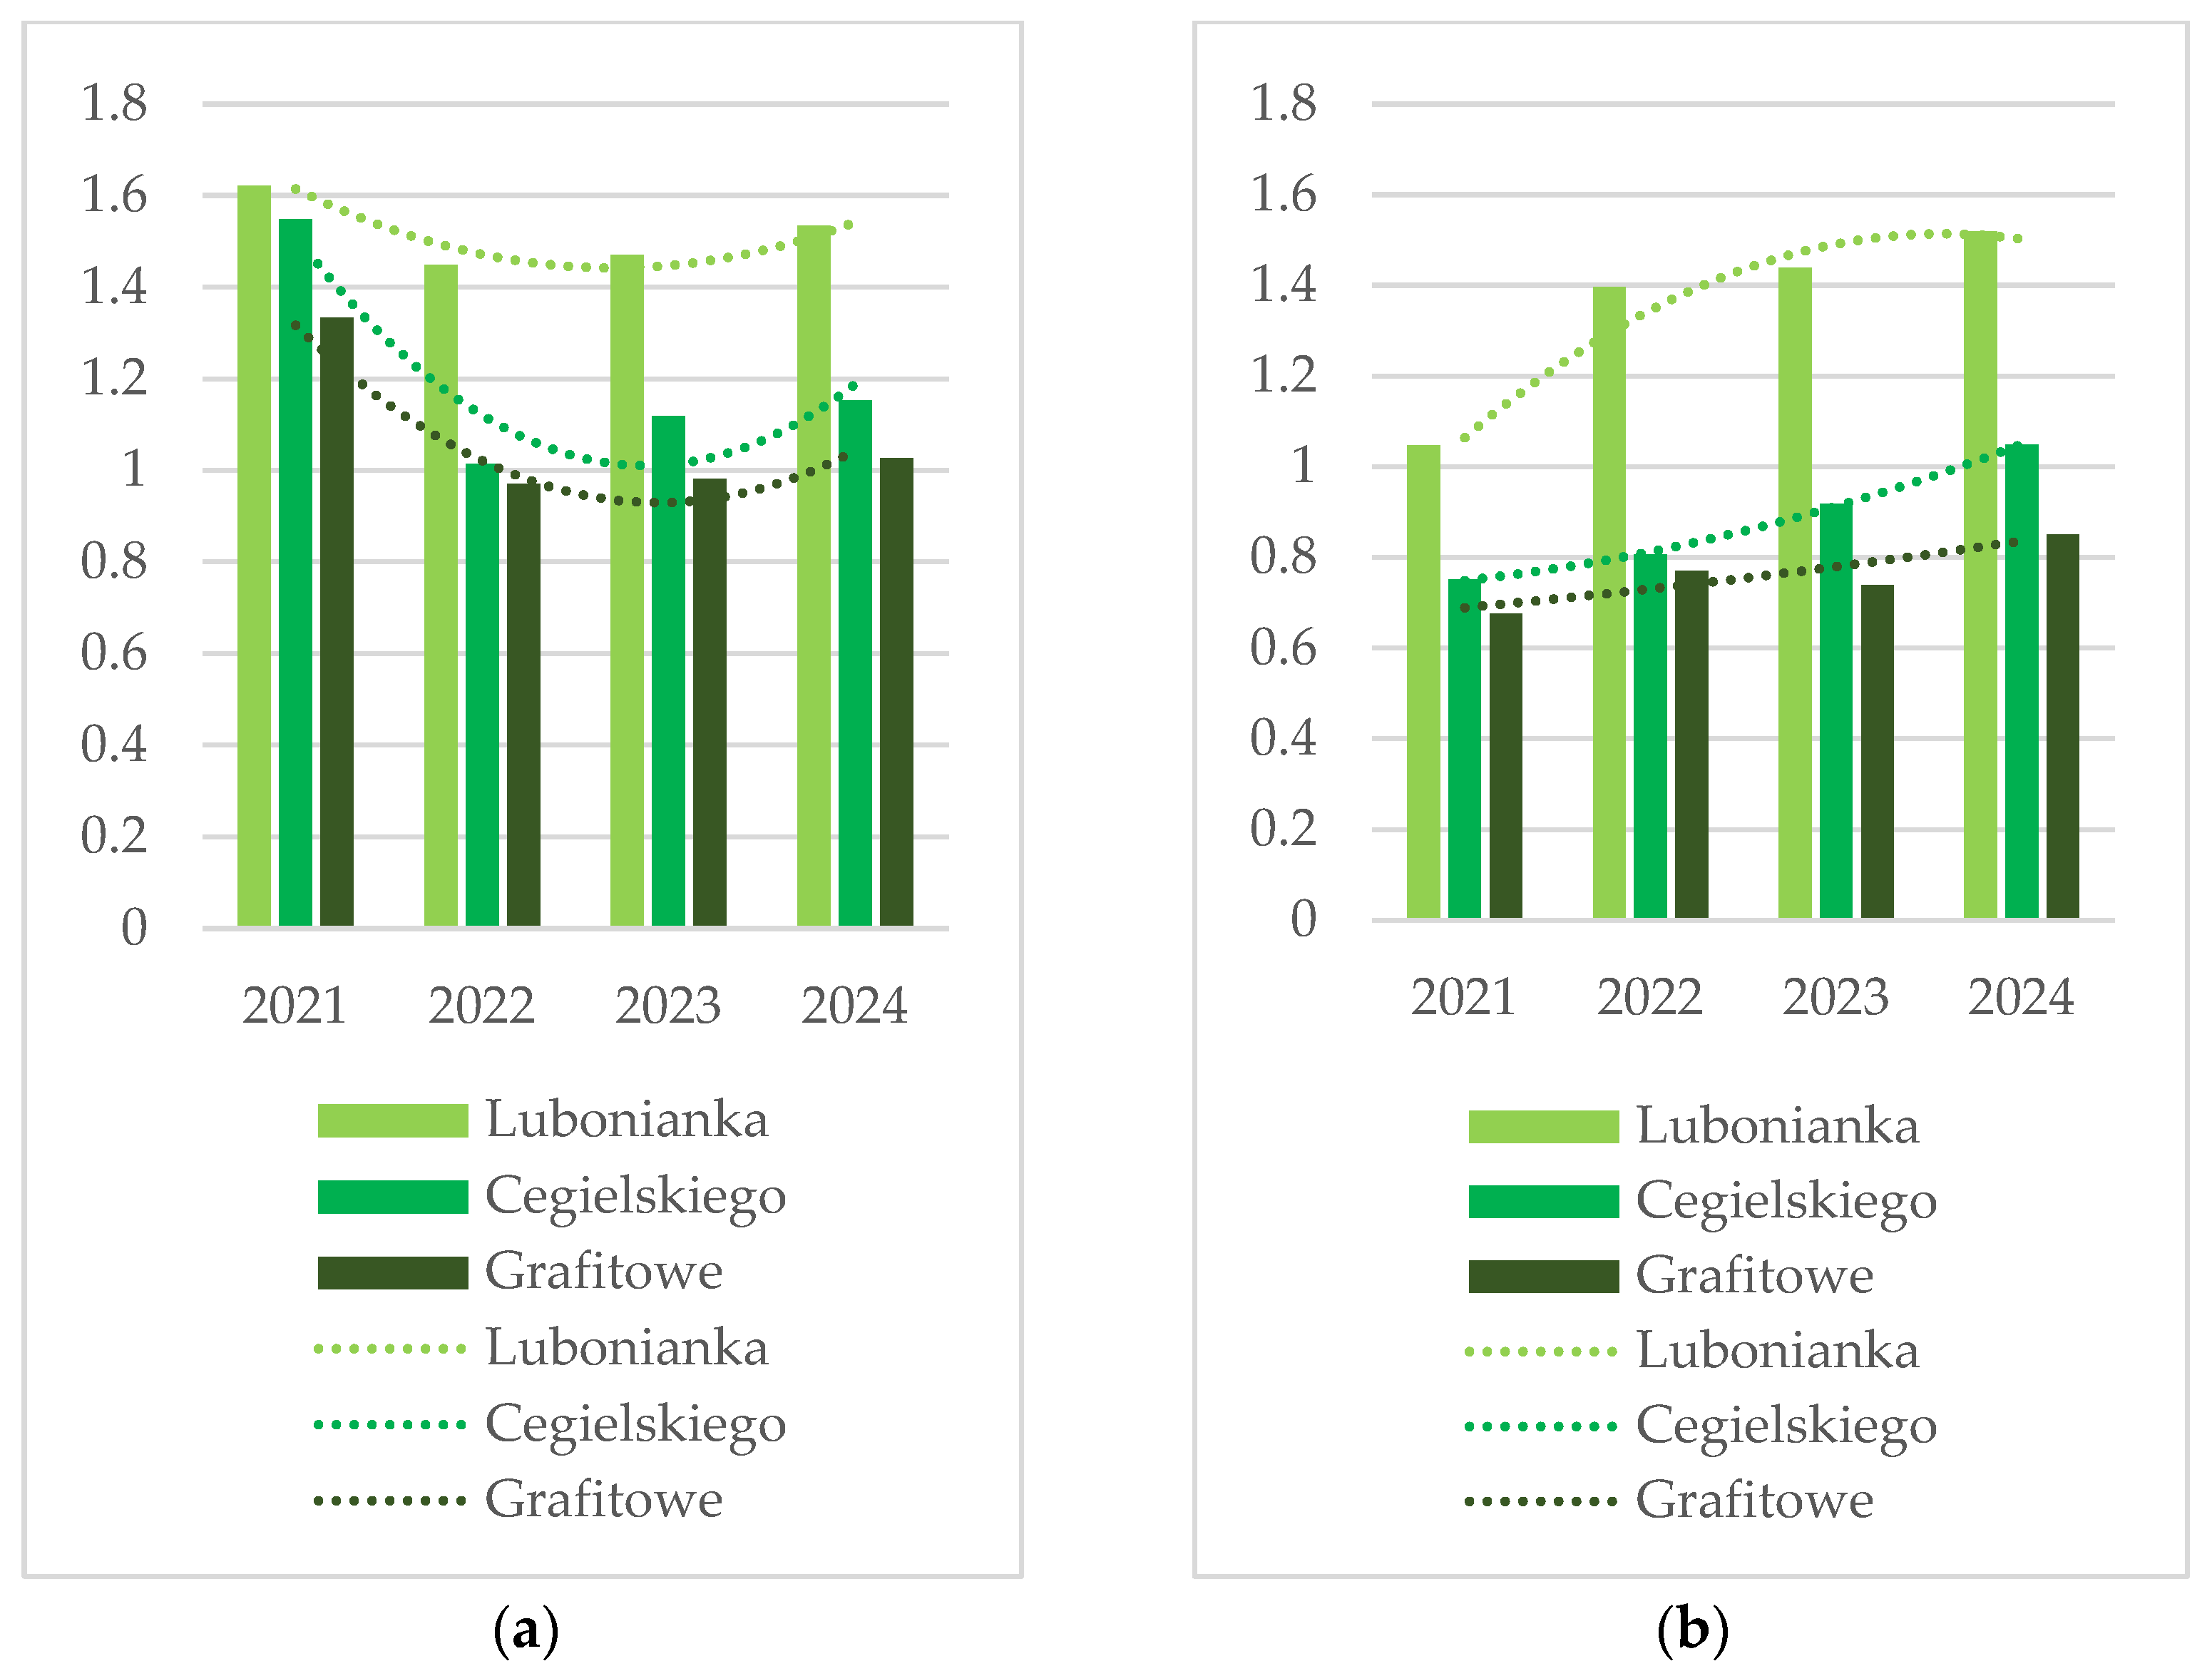
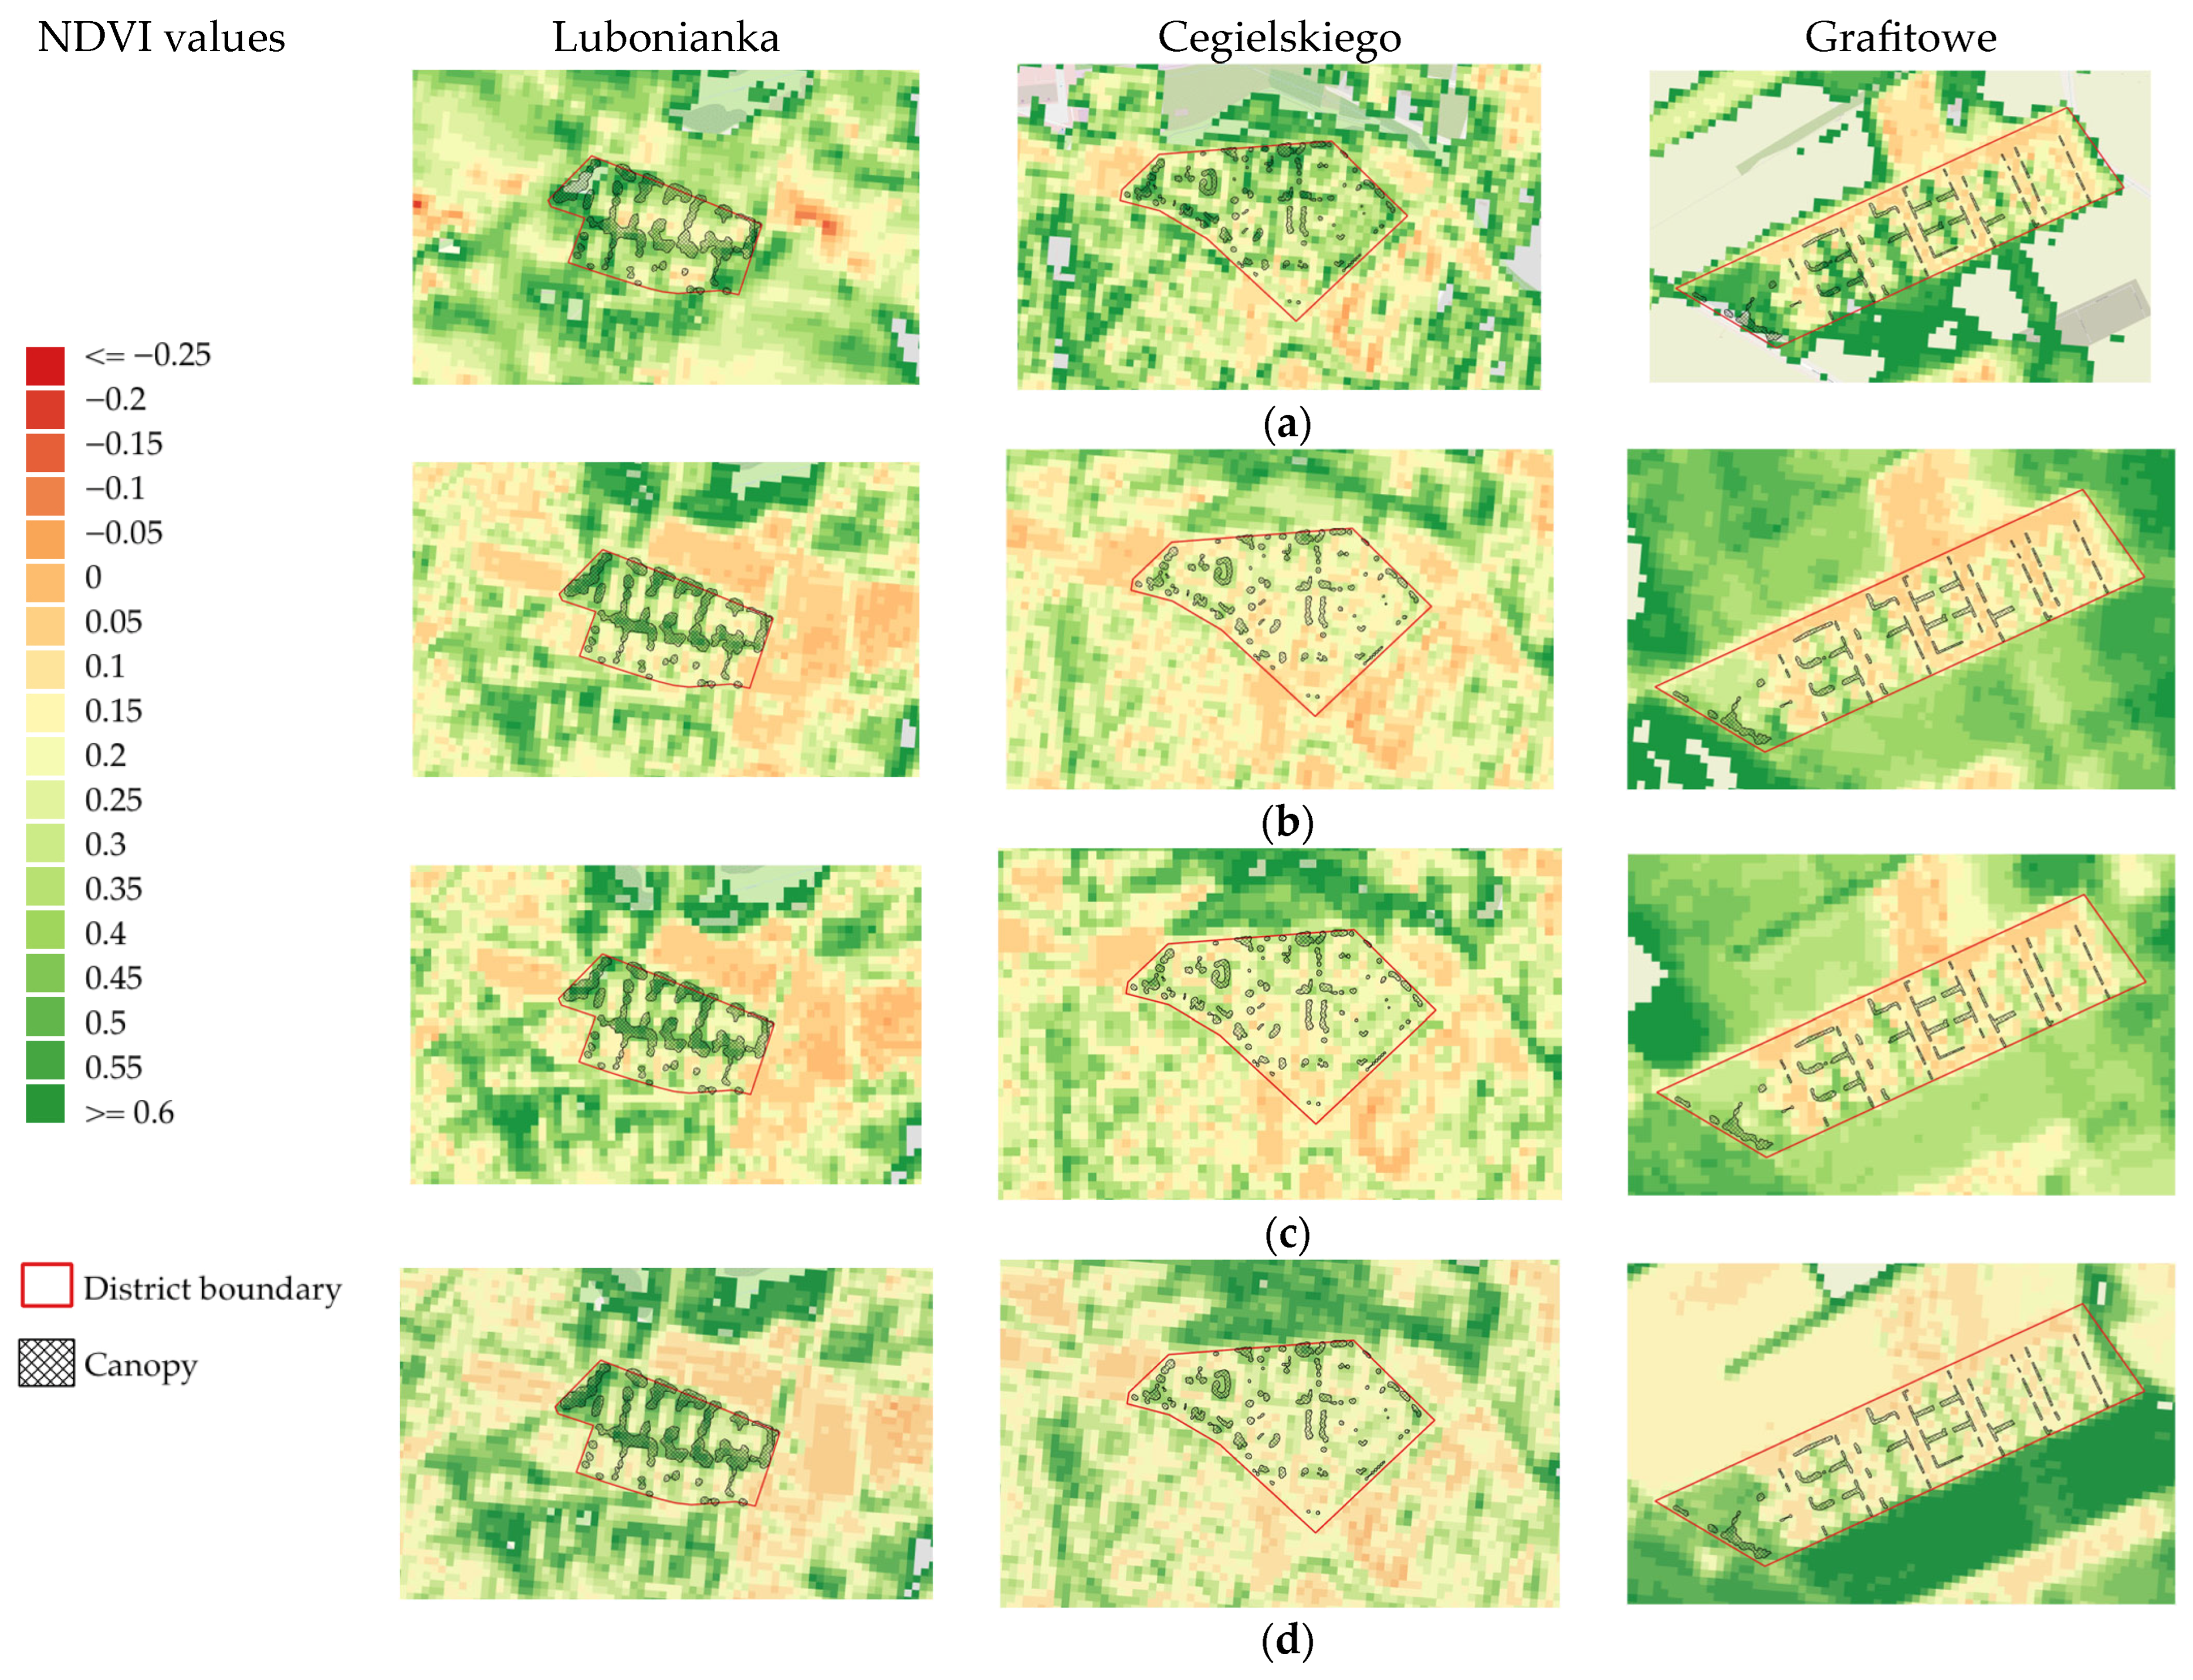
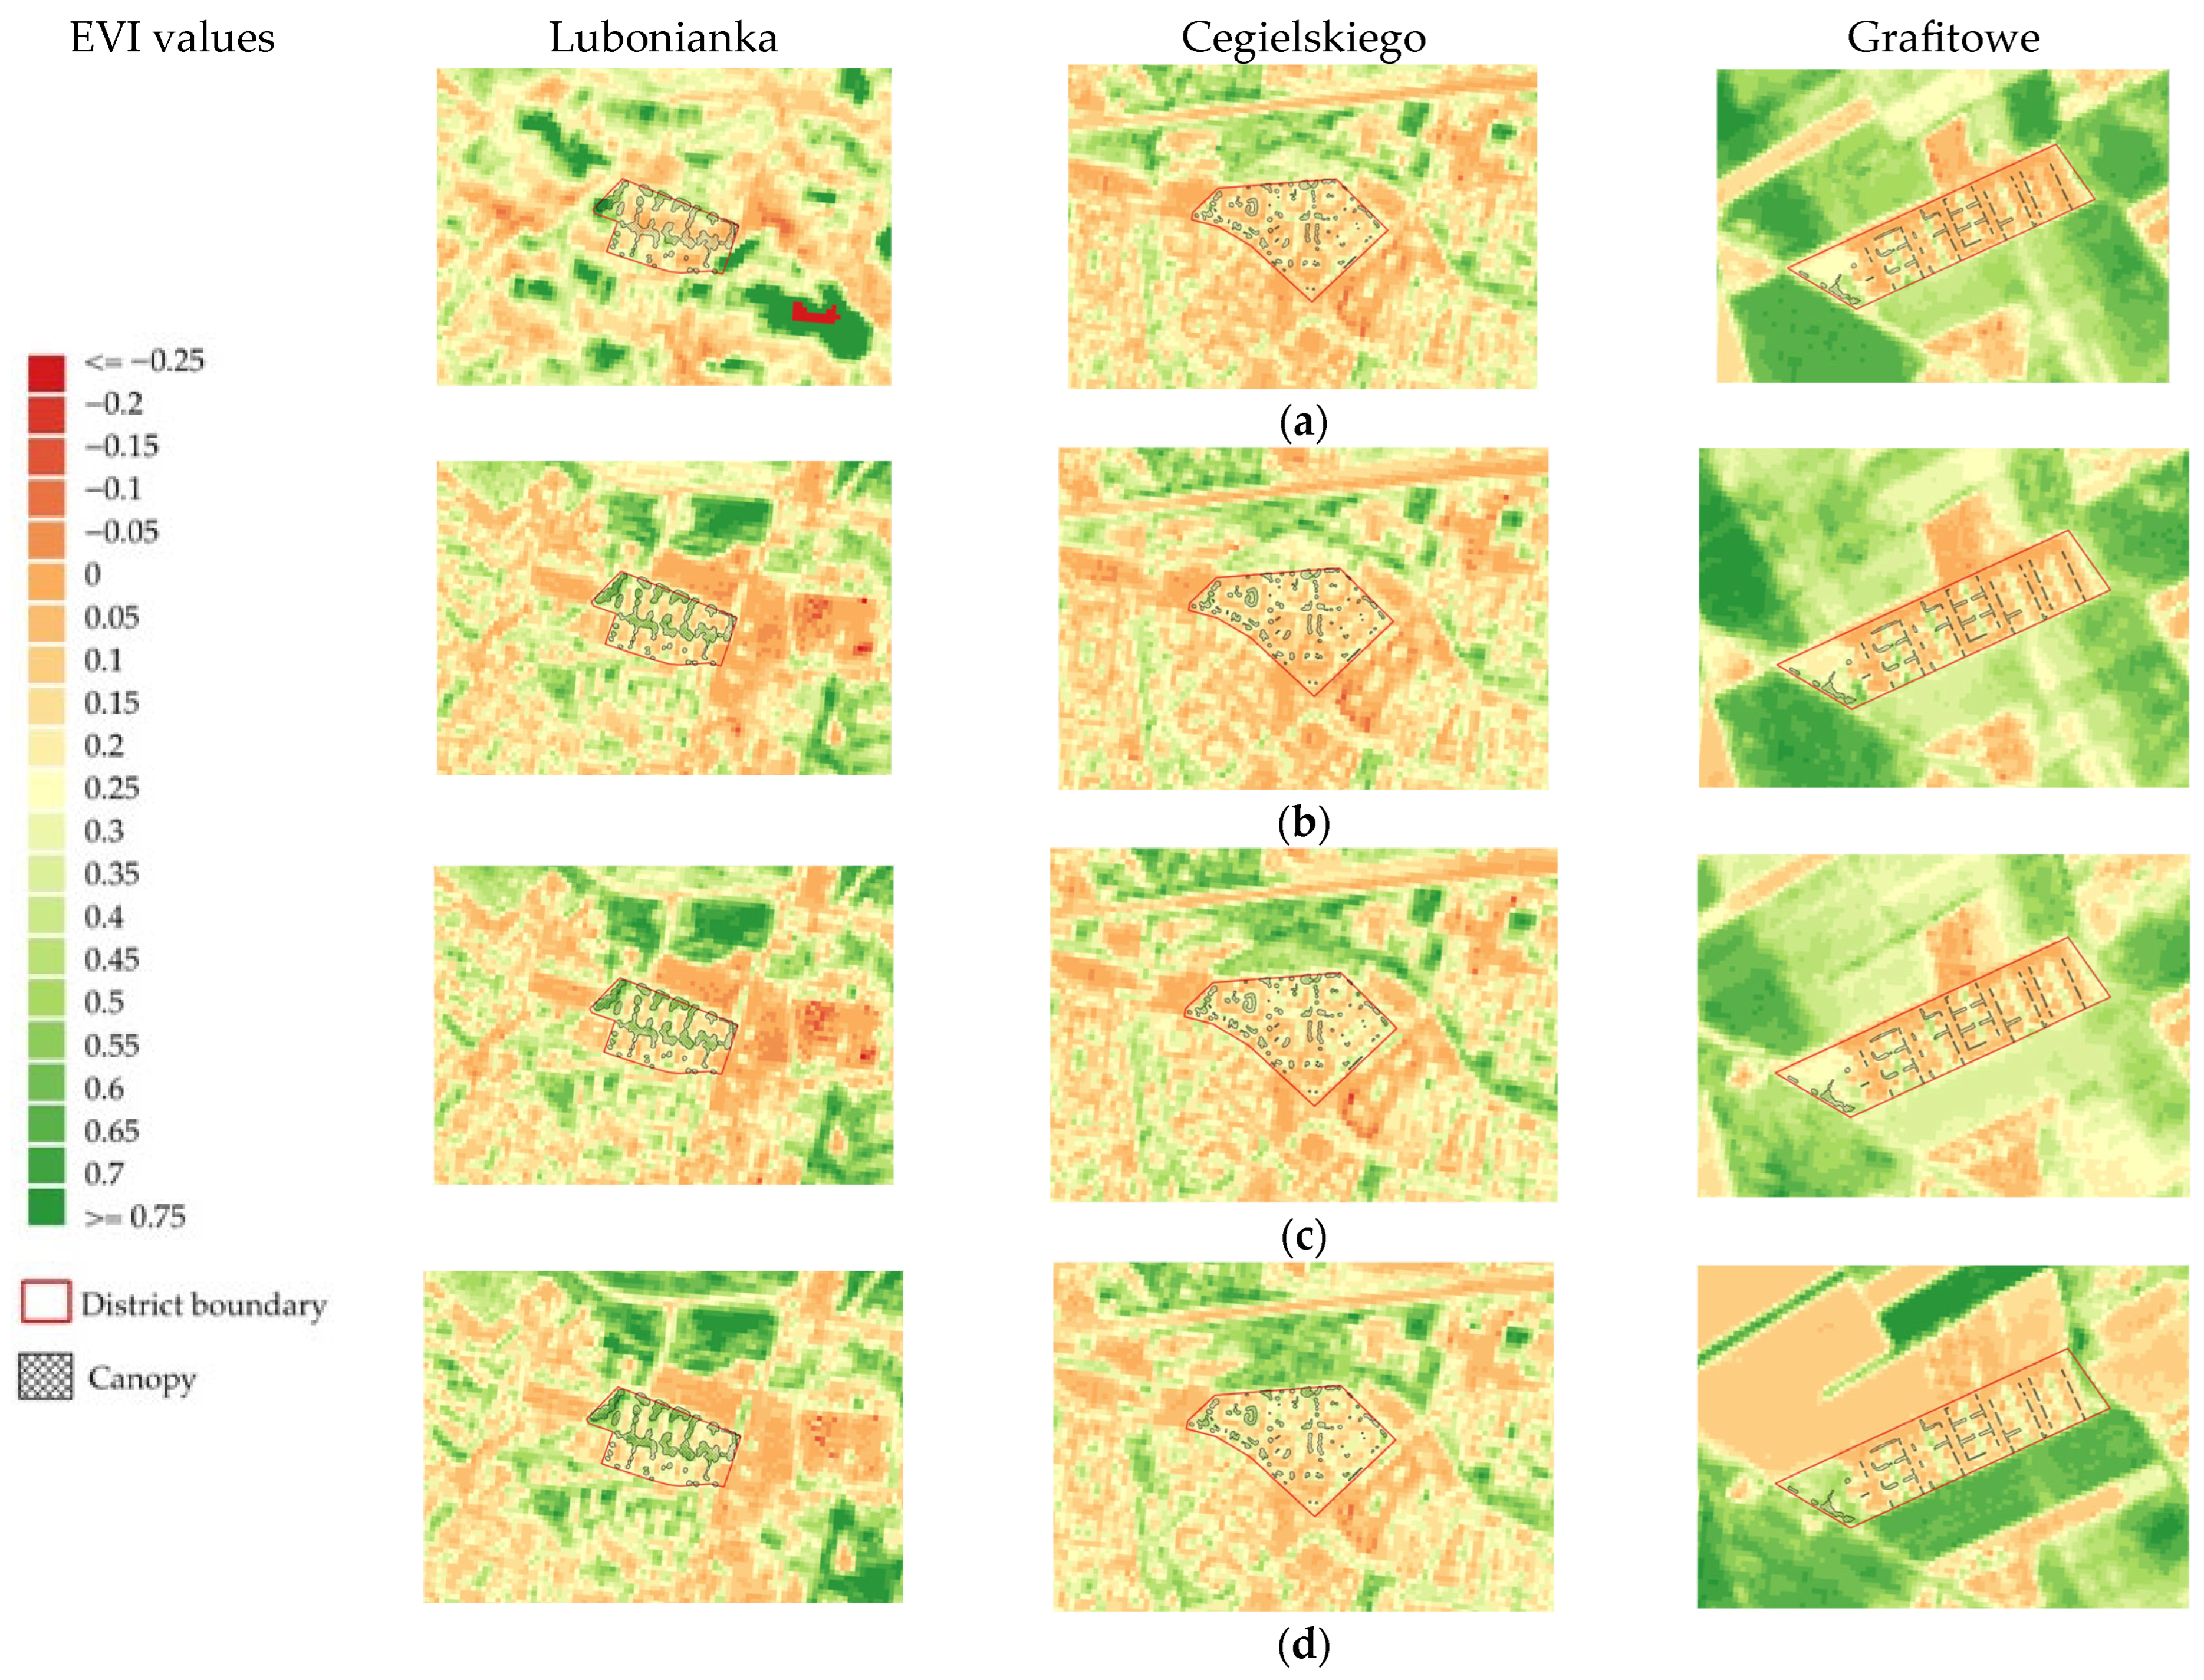
3.1.3. The Most Diverse and Mature Tree Canopy Scored the Best in Terms of the VI Values
3.1.4. Mature Trees, Access to Water, and Larger Permeable Surface Contributed to Higher VI Values
3.2. The Correlation of the VI Values Was Positive with the Diversity and Evenness and Negative with the Nativity
4. Discussion
4.1. Diversity and Health Conditions of Greenery in Residential Districts of Study Area
4.2. Reasons That Led to the Decline in the Diversity and Health of Greenery in the Study Area
4.3. Applicability of Tested Indices for Assessing State of Urban Greenery and Informing Design
- (1)
- Calculate the Vegetation Indices (VIs) for the study area utilizing remotely sensed spectral data;
- (2)
- Identify patches of urban forestry with diverse VI values for further analysis, giving special attention to the tree canopies with the highest mean VI values;
- (3)
- Perform on-site inventories of the identified exemplary greenery patches;
- (4)
- Calculate indices relevant to the species richness, diversity, evenness, and nativity;
- (5)
- Create recommendations for local greenery planning.
5. Conclusions
- (1)
- The oldest residential district in the comparison had the most diverse community of trees, while the newest one had the highest degree of tree nativity.
- (2)
- The tree species diversity and evenness were positively correlated with the mean Vegetation Index (VI) values, reflecting the good health of the greenery, and the oldest of the three compared districts ranked first in terms of the VI values. The current model of suburban planning fails to deliver a healthy treescape.
- (3)
- The two indices most strongly correlated with the VI values, i.e., Simpson’s Reciprocal Index (DI) and the Shannon Equitability Index (EH), can be used to assess the health potential of urban greenery, both existing and projected.
- (4)
- The Enhanced Vegetation Index (EVI) was the most precise in detecting the condition of the tree canopies in the study area, while the Normalized Difference Vegetation Index (NDVI) and the Soil-Adjusted Vegetation Index (SAVI) were more affected by seasonal droughts and yielded a more general image of the state of the greenery in the residential districts compared.
- (5)
- The taxonomic nativeness of the tree species had a negative correlation with the mean NDVI, SAVI, EVI, and LAI values and did not guarantee good greenery health.
- (6)
- The most common tree species in the clusters with high VI values was common linden. However, the habitat quality was of key importance, including the access to water and amount of free space around the trees.
Author Contributions
Funding
Institutional Review Board Statement
Informed Consent Statement
Data Availability Statement
Conflicts of Interest
References
- United Nation. 2018 Revision of World Urbanization Prospects, New York. 2018. Available online: https://www.un.org/uk/desa/68-world-population-projected-live-urban-areas-2050-says-un (accessed on 21 March 2024).
- Haase, D.; Larondelle, N.; Andersson, E.; Artmann, M.; Borgström, S.; Breuste, J.; Gomez-Baggethun, E.; Gren, Å.; Hamstead, Z.; Hansen, R.; et al. A Quantitative Review of Urban Ecosystem Service Assessments: Concepts, Models, and Implementation. Ambio 2014, 43, 413–433. [Google Scholar] [CrossRef] [PubMed]
- Schwarz, N.; Moretti, M.; Bugalho, M.N.; Davies, Z.G.; Haase, D.; Hack, J.; Hof, A.; Melero, Y.; Pett, T.J.; Knapp, S. Understanding biodiversity-ecosystem service relationships in urban areas: A comprehensive literature review. Ecosyst. Serv. 2017, 27, 161–171. [Google Scholar] [CrossRef]
- Bossel, H. Indicators for sustainable development: Theory, method, applications. In A Report to the Balaton Group; International Institute for Sustainable Development: Winnipeg, MB, Canada, 1999; pp. 1–138. Available online: https://www.iisd.org/publications/indicators-sustainable-development-theory-method-applications (accessed on 5 February 2025).
- Sparks, T.H.; Butchart, S.H.M.; Balmford, A.; Bennun, L.; Stanwell-Smith, D.; Walpole, M.; Bates, N.R.; Bomhard, B.; Buchanan, G.M.; Chenery, A.M.; et al. Linked indicator sets for addressing biodiversity loss. Oryx 2011, 45, 411–419. [Google Scholar] [CrossRef]
- United Nations. The Millennium Development Goals Report, New York. 2009. Available online: https://www.un.org/millenniumgoals/pdf/MDG_Report_2009_ENG.pdf (accessed on 5 February 2025).
- Sachs, J.D.; Baillie, J.E.M.; Sutherland, W.J.; Armsworth, P.R.; Ash, N.; Beddington, J.; Blackburn, T.M.; Collen, B.; Gardiner, B.; Gaston, K.J.; et al. Biodiversity Conservation and the Millennium Development Goals. Science 2009, 325, 1502–1503. [Google Scholar] [CrossRef]
- Farinha-Marques, P.; Fernandes, C.; Guilherme, F.; Lameiras, J.M.; Alves, P.; Bunce, R.G.H. Urban Habitats Biodiversity Assessment (UrHBA): A standardized procedure for recording biodiversity and its spatial distribution in urban environments. Landsc. Ecol. 2017, 32, 1753–1770. [Google Scholar] [CrossRef]
- Savard, J.-P.L.; Clergeau, P.; Mennechez, G. Biodiversity concepts and urban ecosystems. Landsc. Urban Plan. 2000, 48, 131–142. [Google Scholar] [CrossRef]
- Faeth, S.H.; Saari, S.; Bang, C. Urban Biodiversity: Patterns, Processes and Implications for Conservation. In eLS; John Wiley & Sons, Ltd.: Chichester, NH, USA, 2012; pp. 1–12. [Google Scholar] [CrossRef]
- Norton, B.A.; Evans, K.L.; Warren, P.H. Urban Biodiversity and Landscape Ecology: Patterns, Processes and Planning. Curr. Landsc. Ecol. Rep. 2016, 1, 178–192. [Google Scholar] [CrossRef]
- Zhang, H.; Jim, C.Y. Contributions of landscape trees in public housing estates to urban biodiversity in Hong Kong. Urban For. Urban Green. 2014, 13, 272–284. [Google Scholar] [CrossRef]
- Werner, P.; Kelcey, J.G. Urban Green and Biodiversity. In Greening Cities. Advances in 21st Century Human Settlements; Tan, P., Jim, C., Eds.; Springer: Singapore, 2017; pp. 131–154. [Google Scholar] [CrossRef]
- Rega-Brodsky, C.C.; Aronson, M.F.J.; Piana, M.R.; Carpenter, E.-S.; Hahs, A.K.; Herrera-Montes, A.; Knapp, S.; Kotze, D.J.; Lepczyk, C.A.; Moretti, M.; et al. Urban biodiversity: State of the science and future directions. Urban Ecosyst. 2022, 25, 1083–1096. [Google Scholar] [CrossRef]
- Olden, J.D.; Comte, L.; Giam, X. Biotic Homogenisation. In eLS; John Wiley & Sons, Ltd.: Chichester, NH, USA, 2016; pp. 1–8. [Google Scholar] [CrossRef]
- Sattler, T.; Obrist, M.K.; Duelli, P.; Moretti, M. Urban arthropod communities: Added value or just a blend of surrounding biodiversity? Landsc. Urban Plan. 2011, 103, 347–361. [Google Scholar] [CrossRef]
- Bang, C.; Faeth, S.H. Variation in arthropod communities in response to urbanization: Seven years of arthropod monitoring in a desert city. Landsc. Urban Plan. 2011, 103, 383–399. [Google Scholar] [CrossRef]
- Kissling, W.D.; Rahbek, C.; Böhning-Gaese, K. Food plant diversity as broad-scale determinant of avian frugivore richness. Proc. R. Soc. B Biol. Sci. 2007, 274, 799–808. [Google Scholar] [CrossRef]
- Muscas, D.; Marrapodi, S.; Proietti, C.; Ruga, L.; Orlandi, F.; Fornaciari, M. Potential Economic and Ecosystem Performances of Some Mediterranean Fruit Plants in an Urban Context. Sustainability 2024, 16, 2081. [Google Scholar] [CrossRef]
- Silva, P.A. Bird-flower interactions in an urban area: Ceiba pubiflora provides nectar and promotes biodiversity in the city. Urban For. Urban Green. 2018, 36, 42–49. [Google Scholar] [CrossRef]
- Mendonça-Santos, R.G.; Antoniazzi, R.; Camarota, F.; dos Reis, Y.T.; Viana-Junior, A.B. Scattered trees as crucial elements in maintaining urban diversity: A case study with canopy ants in a biodiversity hotspot. Acta Oecol. 2023, 118, 103894. [Google Scholar] [CrossRef]
- Andreas, M.; Prausová, R.; Brestovanská, T.; Hostinská, L.; Kalábová, M.; Bogusch, P.; Halda, J.P.; Rada, P.; Štěrba, L.; Čížek, M.; et al. Tree species-rich open oak woodlands within scattered urban landscapes promote biodiversity. Urban For. Urban Green. 2023, 83, 127914. [Google Scholar] [CrossRef]
- Pei, N.; Wang, C.; Jin, J.; Jia, B.; Chen, B.; Qie, G.; Qiu, E.; Gu, L.; Sun, R.; Li, J.; et al. Long-term afforestation efforts increase bird species diversity in Beijing, China. Urban For. Urban Green. 2018, 29, 88–95. [Google Scholar] [CrossRef]
- Shwartz, A.; Turbé, A.; Simon, L.; Julliard, R. Enhancing urban biodiversity and its influence on city-dwellers: An experiment. Biol. Conserv. 2014, 171, 82–90. [Google Scholar] [CrossRef]
- Cerra, J.F.; Crain, R. Urban birds and planting design: Strategies for incorporating ecological goals into residential landscapes. Urban Ecosyst. 2016, 19, 1823–1846. [Google Scholar] [CrossRef]
- Cowett, F.D.; Bassuk, N. Street Tree Diversity in Massachusetts, USA. Arboric. Urban For. 2020, 46, 27–43. [Google Scholar] [CrossRef]
- Liu, J.; Slik, F. Are street trees friendly to biodiversity? Landsc. Urban Plan. 2022, 218, 104304. [Google Scholar] [CrossRef]
- Brundu, G.; Pauchard, A.; Pyšek, P.; Pergl, J.; Bindewald, A.M.; Brunori, A.; Canavan, S.; Campagnaro, T.; Celesti-Grapow, L.; de Sá Dechoum, M.; et al. Global guidelines for the sustainable use of non-native trees to prevent tree invasions and mitigate their negative impacts. Neobiota 2020, 61, 65–116. [Google Scholar] [CrossRef]
- Berthon, K.; Thomas, F.; Bekessy, S. The role of ‘nativeness’ in urban greening to support animal biodiversity. Landsc. Urban Plan. 2021, 205, 103959. [Google Scholar] [CrossRef]
- Moro, M.F.; Westerkamp, C.; de Araújo, F.S. How much importance is given to native plants in cities’ treescape? A case study in Fortaleza, Brazil. Urban For. Urban Green. 2014, 13, 365–374. [Google Scholar] [CrossRef]
- Schlaepfer, M.A.; Guinaudeau, B.P.; Martin, P.; Wyler, N. Quantifying the contributions of native and non-native trees to a city’s biodiversity and ecosystem services. Urban For. Urban Green. 2020, 56, 126861. [Google Scholar] [CrossRef]
- Helden, A.J.; Stamp, G.C.; Leather, S.R. Urban biodiversity: Comparison of insect assemblages on native and non-native trees. Urban Ecosyst. 2012, 15, 611–624. [Google Scholar] [CrossRef]
- Ayala-Azcarraga, C.; Hinojosa-Diaz, I.A.; Segura, O.; Pacheco-Muñoz, R.; Larrucea-Garritz, A.; Diaz, D. Evaluation of Sustainable Landscape Design: Presence of Native Pollinators in an Urban Park in Mexico City, Mexico. Sustainability 2025, 17, 799. [Google Scholar] [CrossRef]
- Velasquez-Camacho, L.; Merontausta, E.; Etxegarai, M.; de-Miguel, S. Assessing urban forest biodiversity through automatic taxonomic identification of street trees from citizen science applications and remote-sensing imagery. Int. J. Appl. Earth Obs. Geoinf. 2024, 128, 103735. [Google Scholar] [CrossRef]
- Useni Sikuzani, Y.; Mpibwe Kalenga, A.; Yona Mleci, J.; N’Tambwe Nghonda, D.; Malaisse, F.; Bogaert, J. Assessment of Street Tree Diversity, Structure and Protection in Planned and Unplanned Neighborhoods of Lubumbashi City (DR Congo). Sustainability 2022, 14, 3830. [Google Scholar] [CrossRef]
- Guevara, B.R.; Uribe, S.V.; de la Maza, C.L.; Villaseñor, N.R. Socioeconomic Disparities in Urban Forest Diversity and Structure in Green Areas of Santiago de Chile. Plants 2024, 13, 1841. [Google Scholar] [CrossRef]
- D’Amato, L.; Bartoli, F.; Savo, V.; Paiella, P.A.; Messina, F.; Caneva, G. Distribution Pattern of Urban Street Trees in Rome (Italy): A Multifactorial Evaluation of Selection Criteria. Sustainability 2023, 15, 14065. [Google Scholar] [CrossRef]
- Boehnke, D.; Krehl, A.; Mörmann, K.; Volk, R.; Lützkendorf, T.; Naber, E.; Becker, R.; Norra, S. Mapping Urban Green and Its Ecosystem Services at Microscale—A Methodological Approach for Climate Adaptation and Biodiversity. Sustainability 2022, 14, 9029. [Google Scholar] [CrossRef]
- Chang, Y.; Wang, Z.; Zhang, D.; Fu, Y.; Zhai, C.; Wang, T.; Yang, Y.; Wu, J. Analysis of Urban Woody Plant Diversity among Different Administrative Districts and the Enhancement Strategy in Changchun City, China. Sustainability 2022, 14, 7624. [Google Scholar] [CrossRef]
- Prevedello, J.A.; Almeida-Gomes, M.; Lindenmayer, D.B. The importance of scattered trees for biodiversity conservation: A global meta-analysis. J. Appl. Ecol. 2018, 55, 205–214. [Google Scholar] [CrossRef]
- Baró, F.; Calderón-Argelich, A.; Langemeyer, J.; Connolly, J.J.T. Under one canopy? Assessing the distributional environmental justice implications of street tree benefits in Barcelona. Environ. Sci. Policy 2019, 102, 54–64. [Google Scholar] [CrossRef] [PubMed]
- Baguette, M.; Blanchet, S.; Legrand, D.; Stevens, V.M.; Turlure, C. Individual dispersal, landscape connectivity and ecological networks. Biol. Rev. 2013, 88, 310–326. [Google Scholar] [CrossRef]
- Kenney, W.A.; van Wassenaer, P.; Satel, A. Criteria and Indicators for Strategic Urban Forest Planning and Management. Arboric. Urban For. 2011, 37, 108–117. [Google Scholar] [CrossRef]
- Conway, T.M.; Bourne, K.S. A comparison of neighborhood characteristics related to canopy cover, stem density and species richness in an urban forest. Landsc. Urban Plan. 2013, 113, 10–18. [Google Scholar] [CrossRef]
- Ma, Z.; Zhai, C.; Ren, Z.; Zhang, D.; Hu, N.; Zhang, P.; Guo, Y.; Wang, C.; Hong, S.; Hong, W. Spatial pattern of urban forest diversity and its potential drivers in a snow climate city, Northeast China. Urban For. Urban Green. 2024, 94, 128260. [Google Scholar] [CrossRef]
- Luck, G.W.; Smallbone, L.T.; O’Brien, R. Socio-Economics and Vegetation Change in Urban Ecosystems: Patterns in Space and Time. Ecosystems 2009, 12, 604–620. [Google Scholar] [CrossRef]
- Łukaszkiewicz, J.; Fortuna-Antoszkiewicz, B.; Borowski, J. The Impact of Earthworks on Older Trees in Historical Parks. J. Environ. Eng. Landsc. Manag. 2022, 30, 188–194. [Google Scholar] [CrossRef]
- Hope, D.; Gries, C.; Zhu, W.; Fagan, W.F.; Redman, C.; Grimm, N.; Nelson, A.L.; Martin, C.; Kinzig, A. Socioeconomics drive urban plant diversity. Proc. Natl. Acad. Sci. USA 2003, 100, 8788–8879. [Google Scholar] [CrossRef] [PubMed]
- Rouse, J.W.; Haas, R.H.; Schell, J.A.; Deering, D.W. Monitoring vegetation system in the great plains with ERTS. In Proceedings of the Third Earth Resources Technology Satellite-1 Symposium, Greenbelt, MD, USA, 1 January 1974; pp. 3010–3017. [Google Scholar]
- Tucker, C.J.; Sellers, P.J. Satellite remote sensing of primary production. Int. J. Remote Sens. 1986, 7, 1395–1416. [Google Scholar] [CrossRef]
- Huete, A. A comparison of vegetation indices over a global set of TM images for EOS-MODIS. Remote Sens. Environ. 1997, 59, 440–451. [Google Scholar] [CrossRef]
- Liu, H.Q.; Huete, A. A feedback based modification of the NDVI to minimize canopy background and atmospheric noise. IEEE Trans. Geosci. Remote Sens. 1995, 33, 457–465. [Google Scholar] [CrossRef]
- Huete, A.R. A soil-adjusted vegetation index (SAVI). Remote Sens. Environ. 1988, 25, 295–309. [Google Scholar] [CrossRef]
- Matsushita, B.; Yang, W.; Chen, J.; Onda, Y.; Qiu, G. Sensitivity of the Enhanced Vegetation Index (EVI) and Normalized Difference Vegetation Index (NDVI) to Topographic Effects: A Case Study in High-density Cypress Forest. Sensors 2007, 7, 2636–2651. [Google Scholar] [CrossRef]
- Waring, R.H.; Coops, N.C.; Fan, W.; Nightingale, J.M. MODIS enhanced vegetation index predicts tree species richness across forested ecoregions in the contiguous U.S.A. Remote Sens. Environ. 2006, 103, 218–226. [Google Scholar] [CrossRef]
- Wang, C.; Ren, Z.; Chang, X.; Wang, G.; Hong, X.; Dong, Y.; Guo, Y.; Zhang, P.; Ma, Z.; Wang, W. Understanding the cooling capacity and its potential drivers in urban forests at the single tree and cluster scales. Sustain. Cities Soc. 2023, 93, 104531. [Google Scholar] [CrossRef]
- Ren, Z.; Du, Y.; He, X.; Pu, R.; Zheng, H.; Hu, H. Spatiotemporal pattern of urban forest leaf area index in response to rapid urbanization and urban greening. J. Res. 2018, 29, 785–796. [Google Scholar] [CrossRef]
- Wang, Q.; Adiku, S.; Tenhunen, J.; Granier, A. On the relationship of NDVI with leaf area index in a deciduous forest site. Remote Sens. Environ. 2005, 94, 244–255. [Google Scholar] [CrossRef]
- Saito, K.; Ogawa, S.; Aihara, M.; Otowa, K. Estimation of LAI and Forest Management on Okutama. In Proceedings of the 22nd Asian Conference on Remote Sensing, Singapore, 5–9 November 2001; pp. 11–17. [Google Scholar]
- Andalibi, L.; Ghorbani, A.; Moameri, M.; Hazbavi, Z.; Nothdurft, A.; Jafari, R.; Dadjou, F. Leaf Area Index Variations in Ecoregions of Ardabil Province, Iran. Remote Sens. 2021, 13, 2879. [Google Scholar] [CrossRef]
- Chrysafis, I.; Korakis, G.; Kyriazopoulos, A.P.; Mallinis, G. Retrieval of Leaf Area Index Using Sentinel-2 Imagery in a Mixed Mediterranean Forest Area. ISPRS Int. J. Geoinf. 2020, 9, 622. [Google Scholar] [CrossRef]
- Bajocco, S.; Ginaldi, F.; Savian, F.; Morelli, D.; Scaglione, M.; Fanchini, D.; Raparelli, E.; Bregaglio, S.U.M. On the Use of NDVI to Estimate LAI in Field Crops: Implementing a Conversion Equation Library. Remote Sens. 2022, 14, 3554. [Google Scholar] [CrossRef]
- Boegh, E.; Soegaard, H.; Broge, N.; Hasager, C.B.; Jensen, N.O.; Schelde, K.; Thomsen, A. Airborne multispectral data for quantifying leaf area index, nitrogen concentration, and photosynthetic efficiency in agriculture. Remote Sens. Environ. 2002, 81, 179–193. [Google Scholar] [CrossRef]
- Gao, Z.; Chen, Y.; Zhang, Z.; Duan, T.; Chen, J.; Li, A. Continuous Leaf Area Index (LAI) Observation in Forests: Validation, Application, and Improvement of LAI-NOS. Forests 2024, 15, 868. [Google Scholar] [CrossRef]
- Vos, C.C.; Opdam, P.; Steingröver, E.G.; Reijnen, R. Transferring ecological knowledge into landscape planning: A design method for ecological corridors. In Key Topics and Perspectives in Landscape Ecology; Wu, J., Hobbs, R., Eds.; Cambridge University Press (Landscape Ecology Series): New York, NY, USA, 2007; pp. 227–245. [Google Scholar]
- Gyurkovich, M.; Kołata, J.; Pieczara, M.; Zierke, P. Assessment of the Greenery Content in Suburban Multi-Family Housing Models in Poland: A Case Study of the Poznań Metropolitan Area. Sustainability 2024, 16, 3266. [Google Scholar] [CrossRef]
- System Informacji Przestrzennej Powiatu Poznańskiego (En. Spatial Information System of the Poznań County). Available online: https://poznanski.e-mapa.net/ (accessed on 17 March 2023).
- Krajowa Mapa Drzew (En. National Tree Map). Available online: https://aplikacja.mapadrzew.com/ (accessed on 17 March 2023).
- European Space Agency. Sentinel-2. Available online: https://www.esa.int/Applications/Observing_the_Earth/Copernicus/Sentinel-2 (accessed on 23 August 2024).
- European Space Agency. Copernicus Browser. Available online: https://browser.dataspace.copernicus.eu/ (accessed on 23 August 2024).
- Kitikidou, K.; Milios, E.; Stampoulidis, A.; Pipinis, E.; Radoglou, K. Using Biodiversity Indices Effectively: Considerations for Forest Management. Ecologies 2024, 5, 42–51. [Google Scholar] [CrossRef]
- Kiester, A.R. Species Diversity, Overview. In Encyclopedia of Biodiversity, 2nd ed.; Levin, S., Ed.; Elsevier: Oxford, UK, 2013; pp. 706–714. [Google Scholar] [CrossRef]
- Thukral, A.K. A review on measurement of Alpha diversity in biology. Agric. Res. J. 2017, 54, 1–10. [Google Scholar] [CrossRef]
- Simpson, E.H. Measurement of Diversity. Nature 1949, 163, 688. [Google Scholar] [CrossRef]
- Shannon, C.E. A Mathematical Theory of Communication. Bell Syst. Tech. J. 1948, 27, 379–423. [Google Scholar] [CrossRef]
- Whittaker, R.H. Evolution and Measurement of Species Diversity. Taxon 1972, 21, 213–251. [Google Scholar] [CrossRef]
- Pielou, E.C. The measurement of diversity in different types of biological collections. J. Theor. Biol. 1966, 13, 131–144. [Google Scholar] [CrossRef]
- Ricotta, C. A Recipe for Unconventional Evenness Measures. Acta Biotheor. 2004, 52, 95–104. [Google Scholar] [CrossRef] [PubMed]
- Jost, L. The Relation between Evenness and Diversity. Diversity 2010, 2, 207–232. [Google Scholar] [CrossRef]
- Jagodziński, A.M.; Leski, T.; Mucha, J.; Tomaszewski, D.; Paź-Dyderska, S.; Wawrzyniak, M.; Guzicka, M.; Broniewska, K.; Nowak, K. Drzewa i krzewy Wielkopolski. Przewodnik (En. Trees and shrubs of Wielkopolska. A Guide); Jagodziński, A.M., Nowak, K., Eds.; Institute of Dendrology Polish Academy of Sciences: Kórnik, Poland, 2022. [Google Scholar]
- Rutkowski, L. Klucz do Oznaczania Roślin Naczyniowych Polski Niżowej (En. Key to the Identification of Vascular Plants in Lowland Poland), 2nd ed.; Polish Scientific Publishers PWN: Warsaw, Poland, 2008. [Google Scholar]
- Deering, D.W.; Haas, R.H. Using Landsat Digital Data for Estimating Green Biomass; Goddard Space Flight Center: Greenbelt, MD, USA, 1980. Available online: https://ntrs.nasa.gov/api/citations/19800024311/downloads/19800024311.pdf (accessed on 5 February 2025).
- Moore, J.C. Diversity, Taxonomic Versus Functional. In Encyclopedia of Biodiversity, 2nd ed.; Levin, S., Ed.; Elsevier: Oxford, UK, 2013; pp. 648–656. [Google Scholar] [CrossRef]
- Woodwell, G.M. Radiation and the Patterns of Nature. Science 1967, 156, 461–470. [Google Scholar] [CrossRef] [PubMed]
- Landsat Missions. Landsat Normalized Difference Vegetation Index, U.S. Geological Survey. Available online: https://www.usgs.gov/landsat-missions/landsat-normalized-difference-vegetation-index (accessed on 23 August 2024).
- NASA Earth Observatory. Measuring Vegetation (NDVI & EVI). Available online: https://earthobservatory.nasa.gov/features/MeasuringVegetation/measuring_vegetation_2.php (accessed on 23 August 2024).
- Sentinel Hub. SAVI (Soil Adjusted Vegetation Index). Available online: https://custom-scripts.sentinel-hub.com/custom-scripts/sentinel-2/savi/ (accessed on 24 April 2025).
- Sentinel Hub. EVI (Enhanced Vegetation Index). Available online: https://custom-scripts.sentinel-hub.com/custom-scripts/sentinel-2/evi/ (accessed on 24 April 2025).
- Climate Data. Available online: https://pl.climate-data.org/europa/polska/greater-poland-voivodeship/poznan-426/ (accessed on 28 November 2024).
- Instytut Meteorologii i Gospodarki Wodnej Państwowy Instytut Badawczy (En. Institute of Meteorology and Water Management—National Research Institute). Available online: https://klimat.imgw.pl/pl/zmiennosc/#Pozna%C5%84%20%C5%81awica/2023/Opad/ (accessed on 28 November 2024).
- Zwierzchowska, I.; Haase, D.; Dushkova, D. Discovering the environmental potential of multi-family residential areas for nature-based solutions. A Central European cities perspective. Landsc. Urban Plan. 2021, 206, 103975. [Google Scholar] [CrossRef]
- Zwierzchowska, I.; Fagiewicz, K.; Poniży, L.; Lupa, P.; Mizgajski, A. Introducing nature-based solutions into urban policy—Facts and gaps. Case study of Poznań. Land. Use Policy 2019, 85, 161–175. [Google Scholar] [CrossRef]
- Borysiak, J.; Breuste, J.; Mizgajski, A. Urban Biodiversity Under Global Trends and Drivers—A Comparative Study of Urban Parks in Poznań (Poland) and Salzburg (Austria). In Making Green Cities. Cities and Nature; Breuste, J., Artmann, M., Ioja, C., Qureshi, S., Eds.; Springer: Cham, Germany, 2023. [Google Scholar] [CrossRef]
- Długoński, A.; Wellmann, T.; Haase, D. Old-Growth Forests in Urban Nature Reserves: Balancing Risks for Visitors and Biodiversity Protection in Warsaw, Poland. Land 2023, 12, 275. [Google Scholar] [CrossRef]
- Kriegler, F.J.; Malila, W.A.; Nalepka, R.F.; Richardson, W. Preprocessing transformations and their effect on multispectral recognition. In Proceedings of the Sixth International Symposium on Remote Sensing of Environment, University of Michigan, Ann Arbor, MI, USA, 13–16 October 1969; pp. 97–131. [Google Scholar]
- Normalized Difference Vegetation Index (NDVI). Available online: https://ipad.fas.usda.gov/cropexplorer/Definitions/spotveg.htm (accessed on 12 December 2024).
- Liu, C.L.C.; Kuchma, O.; Krutovsky, K.V. Mixed-species versus monocultures in plantation forestry: Development, benefits, ecosystem services and perspectives for the future. Glob. Ecol. Conserv. 2018, 15, e00419. [Google Scholar] [CrossRef]
- Cordonnier, T.; Kunstler, G.; Courbaud, B.; Morin, X. Managing tree species diversity and ecosystem functions through coexistence mechanisms. Ann. For. Sci. 2018, 75, 65. [Google Scholar] [CrossRef]
- Larjavaara, M. A Review on Benefits and Disadvantages of Tree Diversity. Open For. Sci. J. 2008, 1, 24–26. [Google Scholar] [CrossRef]
- Ahern, J. Urban landscape sustainability and resilience: The promise and challenges of integrating ecology with urban planning and design. Landsc. Ecol. 2013, 28, 1203–1212. [Google Scholar] [CrossRef]
- Blood, A.; Starr, G.; Escobedo, F.; Chappelka, A.; Staudhammer, C. How Do Urban Forests Compare? Tree Diversity in Urban and Periurban Forests of the Southeastern US. Forests 2016, 7, 120. [Google Scholar] [CrossRef]
- Gaertner, M.; Wilson, J.R.U.; Cadotte, M.W.; MacIvor, J.S.; Zenni, R.D.; Richardson, D.M. Non-native species in urban environments: Patterns, processes, impacts and challenges. Biol. Invasions 2017, 19, 3461–3469. [Google Scholar] [CrossRef]
- Charles, H.; Dukes, J.S. Impacts of Invasive Species on Ecosystem Services. In Biological Invasions; Nentwig, W., Ed.; Springer: Berlin/Heidelberg, Germany, 2007; Volume 193, pp. 217–237. [Google Scholar] [CrossRef]
- Shochat, E.; Lerman, S.B.; Anderies, J.M.; Warren, P.S.; Faeth, S.H.; Nilon, C.H. Invasion, Competition, and Biodiversity Loss in Urban Ecosystems. Bioscience 2010, 60, 199–208. [Google Scholar] [CrossRef]
- Elmqvist, T.; Alfsen, C.; Colding, J. Urban Systems. In Encyclopedia of Ecology; Jørgensen, S.E., Fath, B.D., Eds.; Elsevier: Oxford, UK, 2008; Volume 5, pp. 3665–3672. [Google Scholar] [CrossRef]
- de Carvalho, C.A.; Raposo, M.; Pinto-Gomes, C.; Matos, R. Native or Exotic: A Bibliographical Review of the Debate on Ecological Science Methodologies: Valuable Lessons for Urban Green Space Design. Land 2022, 11, 1201. [Google Scholar] [CrossRef]
- Jang, J.; Woo, S.-Y. Native Trees as a Provider of Vital Urban Ecosystem Services in Urbanizing New Zealand: Status Quo, Challenges and Prospects. Land 2022, 11, 92. [Google Scholar] [CrossRef]
- Zappi, D.C.; Lovo, J.; Hiura, A.; Andrino, C.O.; Barbosa-Silva, R.G.; Martello, F.; Gadelha-Silva, L.; Viana, P.L.; Giannini, T.C. Telling the Wood from the Trees: Ranking a Tree Species List to Aid Urban Afforestation in the Amazon. Sustainability 2022, 14, 1321. [Google Scholar] [CrossRef]
- Sjöman, H.; Morgenroth, J.; Sjöman, J.D.; Sæbø, A.; Kowarik, I. Diversification of the urban forest—Can we afford to exclude exotic tree species? Urban For. Urban Green. 2016, 18, 237–241. [Google Scholar] [CrossRef]
- Castelo, S.; Amado, M.; Ferreira, F. Challenges and Opportunities in the Use of Nature-Based Solutions for Urban Adaptation. Sustainability 2023, 15, 7243. [Google Scholar] [CrossRef]
- Sikorska, D.; Sikorski, P.; Archiciński, P.; Chormański, J.; Hopkins, R.J. You Can’t See the Woods for the Trees: Invasive Acer negundo L. in Urban Riparian Forests Harms Biodiversity and Limits Recreation Activity. Sustainability 2019, 11, 5838. [Google Scholar] [CrossRef]
- Kim, E.; Choi, J.; Song, W. Introduction and Spread of the Invasive Alien Species Ageratina altissima in a Disturbed Forest Ecosystem. Sustainability 2021, 13, 6152. [Google Scholar] [CrossRef]
- Hughes, E.; Moyers-Gonzalez, M.; Murray, R.; Wilson, P.L.; Sivaloganathan, S. Modelling the propagation of invasive tree species: A coupled differential equation approach. Math. Methods Appl. Sci. 2024, 47, 5692–5698. [Google Scholar] [CrossRef]
- Soley, F.G.; Perfecto, I. A way forward for biodiversity conservation: High-quality landscapes. Trends Ecol. Evol. 2021, 36, 770–773. [Google Scholar] [CrossRef]
- Ustawa z Dnia 7 Lipca 2023 r. o Zmianie Ustawy o Planowaniu i Zagospodarowaniu Przestrzennym oraz Niektórych Innych ustaw (En. Act of July 7, 2023 Amending the Act on Spatial Planning and Development and Certain Other Acts). 2023. Available online: https://isap.sejm.gov.pl/isap.nsf/DocDetails.xsp?id=WDU20230001688 (accessed on 30 October 2023).
- Arroyo-Rodríguez, V.; Fahrig, L.; Tabarelli, M.; Watling, J.I.; Tischendorf, L.; Benchimol, M.; Cazetta, E.; Faria, D.; Leal, I.R.; Melo, F.P.L.; et al. Designing optimal human-modified landscapes for forest biodiversity conservation. Ecol. Lett. 2020, 23, 1404–1420. [Google Scholar] [CrossRef] [PubMed]
- Dąbrowska-Milewska, G. Urban planning standards for residential areas—Chosen issues. Archit. Artibus 2010, 1, 17–31. [Google Scholar]
- Gawron, H.; Trojanek, M.; Lis, P.; Palicki, S.; Celka, K. Polityka Mieszkaniowa Miasta Poznania na Lata 2017-2027 (En. Housing Policy of the City of Poznań for the Years 2017–2027); Centrum Polityk Publicznych Uniwersytetu Ekonomicznego w Poznaniu, (en. Center for Public Policies of the Poznań University of Economics): Poznań, Poland, 2017; Available online: https://www.poznan.pl/mim/public/main/attachments.att?co=show&instance=1017&parent=83191&lang=pl&id=243438 (accessed on 10 December 2024).
- Warszawski Standard Mieszkaniowy 1.2 (En. Warsaw Housing Standard 1.2); Biuro Polityki Lokalowej M. St. Warszawy (En. Office of Housing Policy of the Capital City of Warsaw): Warsaw, Poland, 2018; Available online: https://konsultacje.um.warszawa.pl/uploads/decidim/attachment/file/3884/1_warsz_standard_mieszkaniowy_do_konsultacji.pdf (accessed on 10 December 2024).
- Senetra, A.; Czaplicka, M.; Dudzińska, M.; Dawidowicz, A. Functional and Aesthetic Factors for Well-Being in Age-Friendly Residential Areas (AFRA) in Poland: An International Comparative Perspective. Sustainability 2024, 16, 8571. [Google Scholar] [CrossRef]
- Czaplicka, M.; Dudzińska, M.; Dawidowicz, A.; Senetra, A. Concept of Assessment of Age-Friendly Residential Areas (AFRA): A Case Study of Gdańsk, Poland. Sustainability 2024, 16, 6000. [Google Scholar] [CrossRef]
- Szczepańska, M.; Gałecka-Drozda, A.; Wilkaniec, A. Green Space at New Housing Estates: Flat Price Versus Accessibility to Good Quality Greenery. Sustainability 2023, 15, 9997. [Google Scholar] [CrossRef]
- Sylla, M.; Lasota, T.; Szewrański, S. Valuing Environmental Amenities in Peri-Urban Areas: Evidence from Poland. Sustainability 2019, 11, 570. [Google Scholar] [CrossRef]
- Szymańska, D.; Lewandowska, A.; Rogatka, K. Temporal trend of green areas in Poland between 2004 and 2012. Urban Urban Green 2015, 14, 1009–1016. [Google Scholar] [CrossRef]
- Barszczewska-Woszczyk, A.; Grotowska, E.; Olkowska, B.; Orzechowski, M.; Peters, M.; Sęczek, W.; Walter, E. Przestrzeń Dla zieleni. Klucz do Lepszych Inwestycji Publicznych (en. Space for Greenery: The Key to Better Public Investments); Ministerstwo Kultury i Dziedzictwa Narodowego (en. Ministry of Culture and National Heritage): Warsaw, Poland, 2024. Available online: https://www.gov.pl/web/kultura/publikacja-przestrzen-dla-zieleni-klucz-do-lepszych-inwestycji-publicznych (accessed on 6 December 2024).
- Elderbrock, E.; Enright, C.; Lynch, K.A.; Rempel, A.R. A Guide to Public Green Space Planning for Urban Ecosystem Services. Land 2020, 9, 391. [Google Scholar] [CrossRef]
- Capotorti, G.; Del Vico, E.; Anzellotti, I.; Celesti-Grapow, L. Combining the Conservation of Biodiversity with the Provision of Ecosystem Services in Urban Green Infrastructure Planning: Critical Features Arising from a Case Study in the Metropolitan Area of Rome. Sustainability 2016, 9, 10. [Google Scholar] [CrossRef]
- Valbuena, R.; Packalén, P.; Martı’n-Fernández, S.; Maltamo, M. Diversity and equitability ordering profiles applied to study forest structure. For. Ecol. Manag. 2012, 276, 185–195. [Google Scholar] [CrossRef]
- Strong, W.L. Biased richness and evenness relationships within Shannon–Wiener index values. Ecol. Indic. 2016, 67, 703–713. [Google Scholar] [CrossRef]
- Wang, R.; Gamon, J.A. Remote sensing of terrestrial plant biodiversity. Remote Sens. Environ. 2019, 231, 111218. [Google Scholar] [CrossRef]
- Tan, X.; Shan, Y.; Wang, X.; Liu, R.; Yao, Y. Comparison of the predictive ability of spectral indices for commonly used species diversity indices and Hill numbers in wetlands. Ecol. Indic. 2022, 142, 109233. [Google Scholar] [CrossRef]
- Mapfumo, R.B.; Murwira, A.; Masocha, M.; Andriani, R. The relationship between satellite-derived indices and species diversity across African savanna ecosystems. Int. J. Appl. Earth Obs. Geoinf. 2016, 52, 306–317. [Google Scholar] [CrossRef]
- Agbelade, A.D.; Onyekwelu, J.C.; Oyun, M.B. Tree Species Richness, Diversity, and Vegetation Index for Federal Capital Territory, Abuja, Nigeria. Int. J. For. Res. 2017, 1, 4549756. [Google Scholar] [CrossRef]
- Madonsela, S.; Cho, M.A.; Ramoelo, A.; Mutanga, O. Remote sensing of species diversity using Landsat 8 spectral variables. ISPRS J. Photogramm. Remote Sens. 2017, 133, 116–127. [Google Scholar] [CrossRef]
- Cabacinha, C.D.; de Castro, S.S. Relationships between floristic diversity and vegetation indices, forest structure and landscape metrics of fragments in Brazilian Cerrado. For. Ecol. Manag. 2009, 257, 2157–2165. [Google Scholar] [CrossRef]
- Hashemi, S.A.; Fallah Chai, M.M.; Bayat, S. An analysis of vegetation indices in relation to tree species diversity using by satellite data in the northern forests of Iran. Arab. J. Geosci. 2013, 6, 3363–3369. [Google Scholar] [CrossRef]
- Fu, Y.; Tan, X.; Yao, Y.; Wang, L.; Shan, Y.; Yang, Y.; Jing, Z. Uncovering optimal vegetation indices for estimating wetland plant species diversity. Ecol. Indic. 2024, 166, 112367. [Google Scholar] [CrossRef]


| Group of Indices | Indices | Lubonianka | Cegielskiego | Grafitowe |
|---|---|---|---|---|
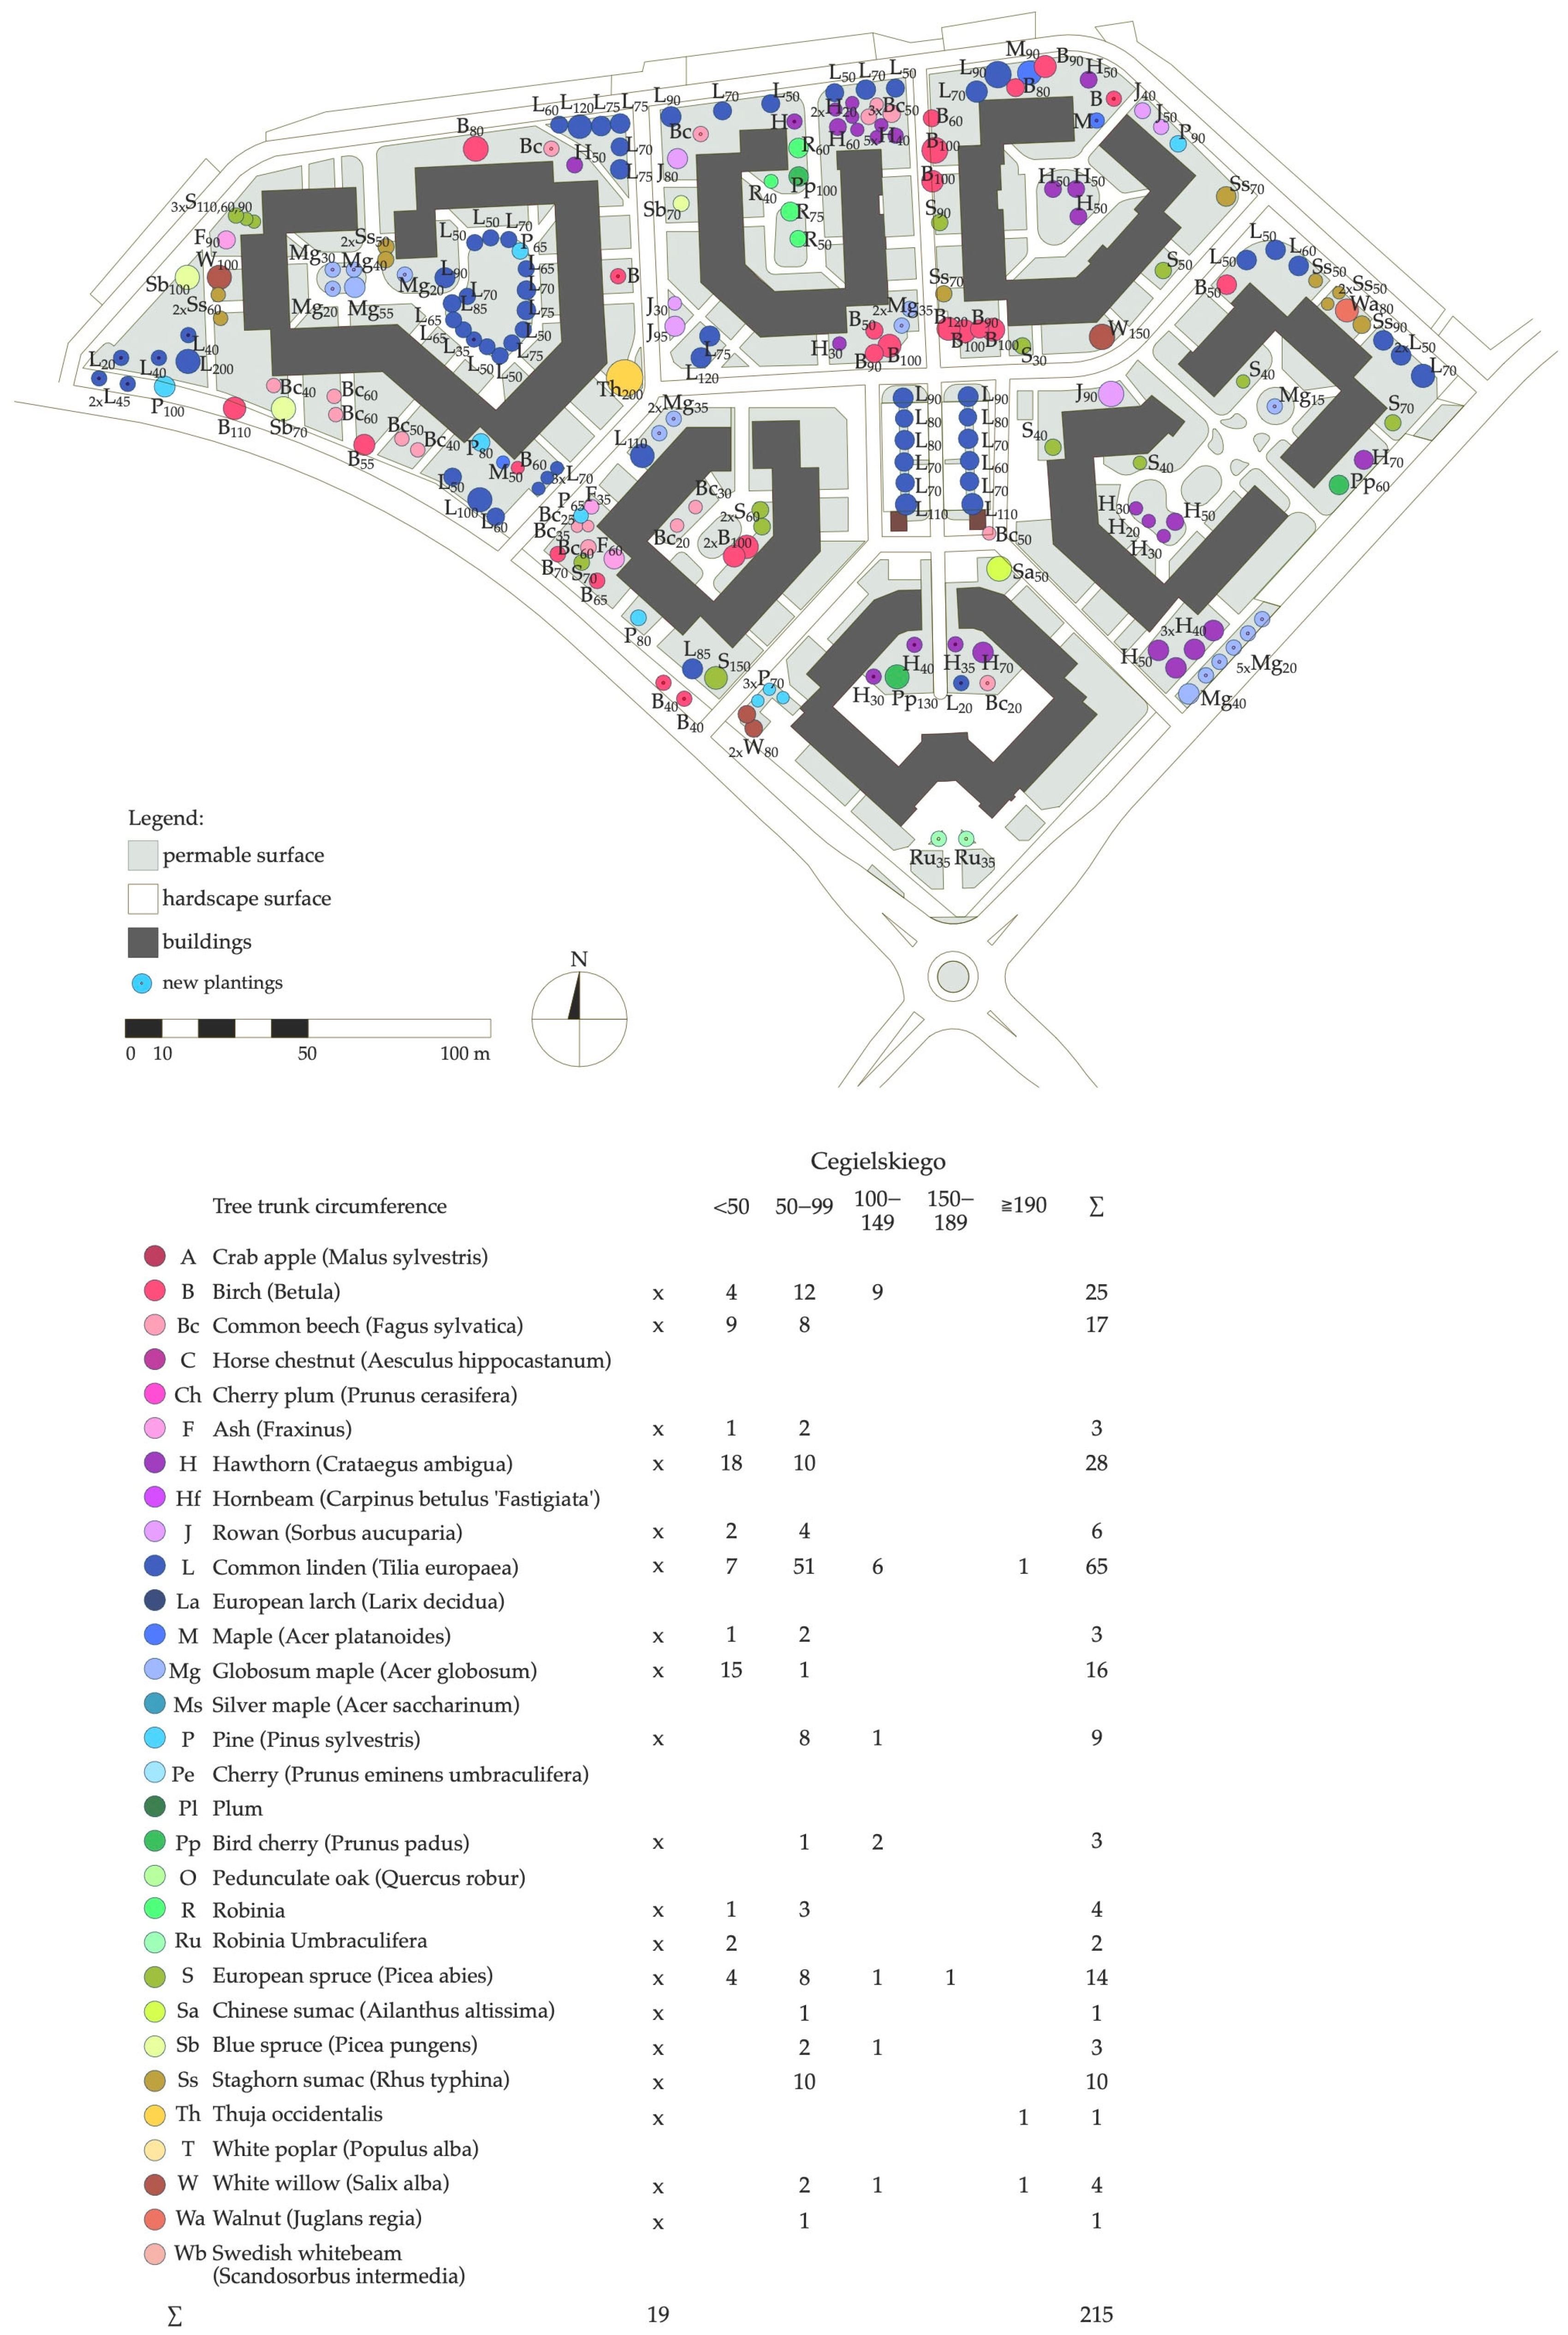
| Richness | Species richness (S) | 20 | 19 | 8 |
| Abundance (N) | 206 | 215 | 347 | |
| Species Richness Index (RS) | 1.07 | 0.96 | 0.27 | |
| Diversity | Biodiversity Index (RBIO) | 0.1 | 0.09 | 0.02 |
| Menhinick’s Index (RMEN) | 3.76 | 3.54 | 1.37 | |
| Simpson’s Diversity Index (D) | 0.12 | 0.14 | 0.34 | |
| Simpson’s Reciprocal Index (DI) | 8.53 | 7.13 | 2.97 | |
| Shannon Diversity Index (H) | 2.44 | 2.33 | 1.42 | |
| Evenness | Shannon Equitability Index (EH) | 0.82 | 0.79 | 0.68 |
| Nativity | Proportion of native tree species (RSN) | 0.65 | 0.63 | 1 |
| Proportion of native tree specimens (RNT) | 0.84 | 0.9 | 1 |
| Date | VI Values | Lubonianka Canopy | Lubonianka District | Cegielskiego Canopy | Cegielskiego District | Grafitowe Canopy | Grafitowe District |
|---|---|---|---|---|---|---|---|
| 13 August 2021 | Mean NDVI | 0.449 | 0.351 | 0.429 | 0.311 | 0.365 | 0.256 |
| Min NDVI | 0.223 | 0.011 | 0.125 | 0.039 | 0.090 | −0.002 | |
| Max NDVI | 0.760 | 0.774 | 0.649 | 0.652 | 0.700 | 0.723 | |
| Mean SAVI | 0.641 | 0.515 | 0.612 | 0.444 | 0.514 | 0.293 | |
| Min SAVI | 0.318 | 0.015 | 0.179 | 0.056 | 0.129 | −0.003 | |
| Max SAVI | 1 | 1 | 0.927 | 0.932 | 0.999 | 1 | |
| Mean EVI | 0.322 | 0.263 | 0.240 | 0.178 | 0.220 | 0.164 | |
| Min EVI | 0.081 | 0.005 | 0.043 | 0.017 | 0.072 | −0.001 | |
| Max EVI | 1 | 1 | 0.369 | 0.452 | 0.526 | 0.570 | |
| LAI (NDVI-based) | 1.622 | - | 1.548 | - | 1.334 | - | |
| LAI (EVI-based) | 1047 | - | 0.751 | - | 0.676 | - | |
| 3 August 2022 | Mean NDVI | 0.400 | 0.264 | 0.247 | 0.167 | 0.229 | 0.166 |
| Min NDVI | 0.182 | 0.012 | 0.055 | 0.008 | 0.073 | 0.001 | |
| Max NDVI | 0.557 | 0.557 | 0.415 | 0.415 | 0.436 | 0.544 | |
| Mean SAVI | 0.572 | 0.397 | 0.353 | 0.238 | 0.326 | 0.237 | |
| Min SAVI | 0.260 | 0.018 | 0.079 | 0.012 | 0.104 | 0.001 | |
| Max SAVI | 0.795 | 0.795 | 0.593 | 0.593 | 0.623 | 0.777 | |
| Mean EVI | 0.419 | 0.291 | 0.256 | 0.175 | 0.246 | 0.182 | |
| Min EVI | 0.152 | 0.013 | 0.049 | 0.007 | 0.090 | 0.001 | |
| Max EVI | 0.669 | 0.669 | 0.399 | 0.412 | 0.495 | 0.632 | |
| LAI (NDVI-based) | 1.449 | - | 1.014 | - | 0.970 | - | |
| LAI (EVI-based) | 1.397 | - | 0.807 | - | 0.771 | - | |
| 9 July 2023 | Mean NDVI | 0.407 | 0.282 | 0.289 | 0.200 | 0.233 | 0.178 |
| Min NDVI | 0.199 | 0.009 | 0.105 | 0.031 | 0.061 | 0.005 | |
| Max NDVI | 0.572 | 0.608 | 0.434 | 0.434 | 0.430 | 0.442 | |
| Mean SAVI | 0.597 | 0.421 | 0.396 | 0.286 | 0.328 | 0.250 | |
| Min SAVI | 0.285 | 0.012 | 0.170 | 0.022 | 0.090 | 0.002 | |
| Max SAVI | 0.868 | 0.868 | 0.620 | 0.620 | 0.614 | 0.632 | |
| Mean EVI | 0.430 | 0.304 | 0.286 | 0.210 | 0.237 | 0.186 | |
| Min EVI | 0.207 | 0.011 | 0.109 | 0.020 | 0.071 | 0.002 | |
| Max EVI | 0.714 | 0.714 | 0.439 | 0.464 | 0.462 | 0.499 | |
| LAI (NDVI-based) | 1.470 | - | 1.119 | - | 0.981 | - | |
| LAI (EVI-based) | 1.439 | - | 0.918 | - | 0.739 | - | |
| 14 May 2024 | Mean NDVI | 0.425 | 0.303 | 0.302 | 0.215 | 0.252 | 0.209 |
| Min NDVI | 0.202 | 0.039 | 0.112 | 0.043 | 0.080 | 0.036 | |
| Max NDVI | 0. 586 | 0.587 | 0.478 | 0.478 | 0.469 | 0.512 | |
| Mean SAVI | 0.607 | 0.451 | 0.431 | 0.307 | 0.360 | 0.299 | |
| Min SAVI | 0.288 | 0.066 | 0.159 | 0.062 | 0.115 | 0.051 | |
| Max SAVI | 0.837 | 0.838 | 0.682 | 0.682 | 0.669 | 0.731 | |
| Mean EVI | 0.453 | 0.339 | 0.322 | 0.228 | 0.268 | 0.229 | |
| Min EVI | 0.185 | 0.054 | 0.104 | 0.044 | 0.091 | 0.036 | |
| Max EVI | 0.714 | 0.714 | 0.504 | 0.510 | 0.534 | 0.592 | |
| LAI (NDVI-based) | 1.534 | - | 1.153 | - | 1.026 | - | |
| LAI (EVI-based) | 1.519 | - | 1.048 | - | 0.850 | - | |
| 4-Year Average | Mean NDVI | 0.420 | 0.300 | 0.317 | 0.223 | 0.270 | 0.202 |
| Min NDVI | 0.201 | 0.018 | 0.099 | 0.031 | 0.076 | 0.010 | |
| Max NDVI | 0.619 | 0.632 | 0.494 | 0.495 | 0.509 | 0.555 | |
| Mean SAVI | 0.604 | 0.446 | 0.448 | 0.319 | 0.384 | 0.288 | |
| Min SAVI | 0.288 | 0.028 | 0.147 | 0.038 | 0.109 | 0.013 | |
| Max SAVI | 0.896 | 0.875 | 0.705 | 0.706 | 0.726 | 0.793 | |
| Mean EVI | 0.406 | 0.300 | 0.276 | 0.198 | 0.242 | 0.190 | |
| Min EVI | 0.156 | 0.021 | 0.076 | 0.022 | 0.081 | 0.009 | |
| Max EVI | 0.774 | 0.774 | 0.428 | 0.459 | 0.504 | 0.573 | |
| LAI (NDVI-based) | 1.519 | - | 1.208 | - | 1.078 | - | |
| LAI (EVI-based) | 1.351 | - | 0.881 | - | 0.759 | - |
| Tree Cluster | Species | Trunk Circumference Class [cm] | Number of Trees |
|---|---|---|---|
| 1 | Pedunculate Oak | >200 | 1 |
| White Poplar | 100–200 | 7 | |
| White Poplar | >200 | 2 | |
| White Willow | 100–200 | 1 | |
| White Willow | >200 | 1 | |
| 2 | Common Linden | 100–200 | 8 |
| 3 | Birch | <100 | 1 |
| Common Linden | 100–200 | 2 | |
| Maple | 100–200 | 2 | |
| Robinia Pseudoacacia | 100–200 | 4 | |
| Swedish Whitebeam | 100–200 | 1 | |
| White Poplar | 100–200 | 1 | |
| 4 | Horse Chestnut | 100–200 | 2 |
| Maple | <100 | 2 | |
| Maple | 100–200 | 2 | |
| Plum | <100 | 1 | |
| Robinia Pseudoacacia | 100–200 | 2 | |
| White Poplar | 100–200 | 2 | |
| 5 | Common Linden | <100 | 3 |
| Common Linden | 100–200 | 1 | |
| Pine | 100–200 | 1 | |
| 6 | Common Beech | <60 | 1 |
| Common Linden | <100 | 5 | |
| Common Linden | 100–200 | 1 | |
| Hawthorn | <60 | 1 | |
| 7 | Common Beech | <100 | 3 |
| Common Linden | <60 | 3 | |
| Hawthorn | <60 | 8 | |
| 8 | Common Linden | 100–200 | 12 |
| Hornbeam | <20 | 6 | |
| Pine | <40 | 3 | |
| Pine | <100 | 8 | |
| White Willow | <40 | 9 | |
| Sum | 103 |
| Indices | NDVI Mean for Canopy | SAVI Mean for Canopy | EVI Mean for Canopy | LAI (NDVI-Based) | LAI (EVI-Based) |
|---|---|---|---|---|---|
| Species Richness Index (RS) | 0.633 | 0.627 | 0.670 | 0.538 | 0.627 |
| p = 0.027 | p = 0.029 | p = 0.017 | p = 0.071 | p = 0.029 | |
| Abundance (N) | −0.601 | −0.593 | −0.626 | −0.504 | −0.593 |
| p = 0.039 | p = 0.042 | p = 0.029 | p = 0.094 | p = 0.042 | |
| Biodiversity Index (RBIO) | 0.628 | 0.621 | 0.662 | 0.532 | 0.621 |
| p = 0.029 | p = 0.031 | p = 0.024 | p = 0.075 | p = 0.031 | |
| Menhinick’s Index (RMEN) | 0. 614 | 0.606 | 0.643 | 0.517 | 0.606 |
| p = 0.034 | p = 0.037 | p = 0.024 | p = 0.085 | p = 0.037 | |
| Simpson’s Reciprocal Index (DI) | 0.681 | 0.677 | 0.734 | 0.588 | 0.677 |
| p = 0.015 | p = 0.016 | p = 0.007 | p = 0.044 | p = 0.016 | |
| Shannon Diversity Index (H) | 0.621 | 0.614 | 0.652 | 0.524 | 0.614 |
| p = 0.031 | p = 0.034 | p = 0.022 | p = 0.080 | p = 0.034 | |
| Shannon Equitability Index (EH) | 0.666 | 0.661 | 0.713 | 0.572 | 0.661 |
| p = 0.018 | p = 0.019 | p = 0.009 | p = 0.052 | p = 0.019 | |
| Proportion of native tree species (RSN) | −0.547 | −0.537 | −0.556 | −0.448 | −0.537 |
| p = 0.066 | p = 0.072 | p = 0.061 | p = 0.144 | p = 0.072 | |
| Proportion of native tree specimens (RNT) | −0.724 | −0.722 | −0.796 | −0.637 | −0.722 |
| p = 0.008 | p = 0.008 | p = 0.002 | p = 0.026 | p = 0.008 |
Disclaimer/Publisher’s Note: The statements, opinions and data contained in all publications are solely those of the individual author(s) and contributor(s) and not of MDPI and/or the editor(s). MDPI and/or the editor(s) disclaim responsibility for any injury to people or property resulting from any ideas, methods, instructions or products referred to in the content. |
© 2025 by the authors. Licensee MDPI, Basel, Switzerland. This article is an open access article distributed under the terms and conditions of the Creative Commons Attribution (CC BY) license (https://creativecommons.org/licenses/by/4.0/).
Share and Cite
Pieczara, M.; Kołata, J.; Zierke, P.; Piątkowski, J. Using Tree Inventory to Assess Urban Treescape Diversity and Health in Popular Residential Typologies in the Poznań Metropolitan Area (Poland). Sustainability 2025, 17, 4752. https://doi.org/10.3390/su17114752
Pieczara M, Kołata J, Zierke P, Piątkowski J. Using Tree Inventory to Assess Urban Treescape Diversity and Health in Popular Residential Typologies in the Poznań Metropolitan Area (Poland). Sustainability. 2025; 17(11):4752. https://doi.org/10.3390/su17114752
Chicago/Turabian StylePieczara, Marta, Joanna Kołata, Piotr Zierke, and Jakub Piątkowski. 2025. "Using Tree Inventory to Assess Urban Treescape Diversity and Health in Popular Residential Typologies in the Poznań Metropolitan Area (Poland)" Sustainability 17, no. 11: 4752. https://doi.org/10.3390/su17114752
APA StylePieczara, M., Kołata, J., Zierke, P., & Piątkowski, J. (2025). Using Tree Inventory to Assess Urban Treescape Diversity and Health in Popular Residential Typologies in the Poznań Metropolitan Area (Poland). Sustainability, 17(11), 4752. https://doi.org/10.3390/su17114752