Abstract
In recent years, electric vehicles (EVs) have attracted much attention worldwide as an effective solution for realizing a carbon-neutral and decarbonized society. Since many batteries are generated over the lifespan of EVs, battery recycling has become an important issue. However, battery-manufacturing countries, including China, Japan, and South Korea (CJK), have yet to build a complete battery resource recovery system. In particular, owing to the lack of a reliable battery performance evaluation method, the residual performance of a battery cannot be accurately determined. Thus, based on the results of a social survey of EV owners, the present study develops a novel battery residual performance evaluation method that can easily predict the remaining battery performance based on the usage status of the vehicle, without relying on external electronic devices to measure the battery parameters. In addition, by clarifying the human factors deteriorating vehicle battery performance and proposing sustainable utilization methods for EVs, the present study demonstrates important research prospects for the protection of the environment and progress in the automobile industry.
1. Introduction
In recent years, with the goal of achieving carbon neutrality and building a decarbonized society, the development and expansion of eco-friendly electric vehicles (EVs) have progressed rapidly to solve the problems of global warming, resource depletion, and energy transformation. According to research, global sales of EVs are expected to soar from 1.1 million in 2020 to 11 million by 2025, and the global vehicle battery market is estimated to expand from 150 GWH in 2020 to 1000 GWH by 2025 [1,2]. In addition, the share of vehicle batteries is predominantly concentrated in China, Japan, and South Korea (CJK). CJK has accounted for approximately 80% of the global vehicle battery market since 2018, and its share is expected to increase further [3]. With the rapid popularization of EVs, many end-of-life (EOL) vehicles and batteries will be generated in the future. There were approximately 84 million EOL vehicles worldwide in 2019 [4]. Notably, the lifespan of batteries is shorter than that of vehicles; therefore, the battery discard rate tends to be higher. As such, between 2015 and 2040, approximately 21 million lithium-ion batteries (LIBs) will be discarded from EVs [5]. In the future, with a sharp increase in the number of used vehicle batteries worldwide, issues such as battery disposal and resource recovery will occur.
However, research on the reuse, recycling, and remanufacture of batteries remains in its infancy. Battery-manufacturing countries led by CJK have yet to establish a complete resource recovery system for batteries. In recent years, with the rise of the new-energy vehicle industry, the production and sales of vehicle batteries have sharply increased in China. Accordingly, China has been actively implementing policies related to the reuse and recycling of vehicle batteries, but since there is not much movement in the recycling industry, the actual operational effect of these policies is limited [6,7]. We assume that the resource recovery system of used batteries in China is still immature. Although Japan is committed to the development of all-solid-state LIBs and innovative batteries, the domestic EV penetration rate is still very low [8]. Also, as most of the used Hybrid Electric Vehicles (HEVs) and EVs are exported abroad, it is difficult to recycle resources domestically [9]. As for South Korea, the release of policies related to battery recycling and disposal occurred even later, and we assume that the construction of a resource recovery system of used batteries will be a major issue for South Korea in the future [10]. Although CJK has promoted technical development and market expansion of vehicle batteries as national strategies, with the popularization of EVs, resource depletion will become a more serious issue, and, as a result, resource nationalism will become more apparent in the future [11].
Therefore, many problems remain with an urgent need to be solved in the resource recovery of vehicle batteries. Batteries recovered from EOL vehicles show performance deviations, owing to their different driving distances, as well as their various years, methods, and environments of use [12]. Thus, the residual performance of batteries must be clarified before they can be reused or recycled. Furthermore, the life prediction and performance evaluation of vehicle batteries are crucial to ensure the efficient and safe operation of equipment by determining their state of health (SOH), and to construct a complete battery management system (BMS) [13]. However, because a highly reliable performance evaluation method for batteries has not been established as of yet, the residual performance of batteries cannot be accurately determined [14]. Conventional methods for evaluating battery performance through conducting experiments to measure the remaining useful life (RUL) are typically time-consuming and require high-quality data. Moreover, such experiments to measure performance must be conducted in a laboratory under strict conditions; therefore, the performance evaluation of batteries is difficult [15]. Ultimately, it is almost impossible for developers or users of vehicle batteries to accurately evaluate the actual performance and state of batteries at present [16].
Based on the results of a social survey of EV owners in Shanghai, China, the present study develops a novel method for estimating the residual performance of EV batteries by establishing a relationship model between the vehicle usage status and the SOH of the battery. Although this evaluation method is built based on survey data collected in China, we believe it has good applicability globally. Firstly, China currently occupies an absolute market in the field of EVs and vehicle batteries. In 2021, the installed capacity of vehicle batteries accounted for 52% of the worldwide installed capacity, far exceeding that of Japan, South Korea, and other countries [17]. Secondly, China is very rich in mineral resources. Among them, China’s production of rare earth resources as raw materials for battery production accounts for 70% of the global production [18]. Based on the above reasons, it is expected that China will provide the world’s largest EV and vehicle battery market, exporting a large number of EVs and batteries to other countries around the world in the future. Therefore, we assume that the evaluation method for the residual performance of batteries proposed in the present study can be widely applied in many countries and regions besides China.
The present study has two main innovations: ① We propose a novel method for estimating the residual performance of EV batteries. Based on this method, the SOH of batteries can be estimated simply as long as the vehicle usage and charging status are determined, instead of relying on complex external electronic devices to measure battery parameters. ② The study identifies human factors that deteriorate the vehicle battery performance, including the battery’s years of use, the EV’s charging frequency, its usage frequency, and so on. In addition, we clarify the degree to which each factor affects battery performance. In addition, this study proposes sustainable utilization methods for EVs, as well as resource recovery policy suggestions, providing important insights for reducing environmental load and advancing the EV industry.
2. Literature Review
For the large number of EV batteries expected to be used in the future, reuse and recycling can improve their residual value and prolong their life cycle, which is conducive to environmental protection, energy conservation, and EV market expansion. Therefore, many researchers have claimed that battery regeneration is highly feasible and has immense commercial potential [19]. However, various issues remain regarding the resource recovery of used batteries, among which life prediction and performance evaluation are considered urgent [20]. According to Su et al., the RUL prediction and SOH evaluation methods for batteries are primarily divided into three types: model-based, data-driven, and hybrid approaches [21].
The model-based approach establishes the corresponding physical model by studying the mechanisms of performance degradation of the battery, and then derives an empirical formula for the performance evaluation of the battery based on experimental data. Yang et al. established an empirical formula for capacity change based on the coulombic efficiency of LIBs, and verified the accuracy of the model through a battery cycle life experiment [22]. In another study, Kaveh et al. developed an RUL prediction algorithm for batteries based on the estimation of parameters of an enhanced single-particle model (eSPM) [23]. Model-based approaches can reflect the physicochemical characteristics of the battery to some extent; however, monitoring the internal state in real time is difficult because of the complex electrochemical reactions inside the battery. In addition, factors such as the dynamic load, external environment, and usage affect battery life. Therefore, constructing an accurate physical model and applying a model-based approach in practice are challenging.
The data-driven approach builds a model based on the collected monitoring data, and then predicts the RUL of the battery by analyzing the association between the explanatory variables and the residual performance of the battery. Based on the correlation between battery capacity and internal resistance, Wei et al. used a support vector regression (SVR) model to simulate battery degradation, realizing SOH evaluation and RUL prediction [24]. Khumprom et al. used a deep neural network (DNN) approach to establish an RUL prediction model for batteries, and experimentally demonstrated that the performance of the DNN algorithm could either match or outweigh that of other machine learning algorithms [25]. Unlike the conventional model-based approach, the data-driven approach does not consider the complex electrochemical reactions and degradation mechanisms inside a battery, nor does it require researchers to have a high level of expertise. If a large amount of experimental data are obtained, an accurate predictive model can be established using a data-driven approach. However, the model based on the data-driven approach can only predict the RUL of a single battery, and cannot predict the RUL of batteries with different specifications and deterioration degrees.
The hybrid approach combines two or more model-based and data-driven approaches to compensate for the shortcomings of single-model evaluations and improve the prediction performance. Chen et al. developed a battery RUL prediction method that combines a linear optimization resampling particle filter (LORPF) and a sliding-window gray model (SGM), and demonstrated that the proposed SGM-LORPF framework could obtain accurate results [26]. Song et al. presented a fusion algorithm of the relevance vector machine (RVM) and Kalman filter (KF), specifically optimizing the new estimator output by the RVM through the KF with a physical degradation model, and thereby improving the long-term predictive performance for the RUL of a battery [27]. Thus, the hybrid approach can offer the advantages of different evaluation methods and improve the robustness of the model output and accuracy of prediction, making it a research hotspot in the field of residual performance evaluation of batteries.
In addition, some other simpler and more direct RUL prediction and SOH evaluation methods for batteries are also being developed. In Japan, EnNet Corporation has developed a diagnostic machine for the measurement of battery degradation through high-speed pulsing, which uses machine learning pulse feedback data to grasp the SOH and RUL of the battery in seconds [28]. However, the battery diagnostic machine is large in size and high in cost, which means that it is mainly used in laboratory scenarios, and is difficult to popularize among general EV users. On the other hand, there are also studies evaluating battery performance through social surveys, but such studies are very few. Zhang analyzed the objective performance indicators through the actual road operation and analyzed the subjective performance indicators through the actual use experience survey of users, evaluating the performances of EVs by combining the methods of empirical experiments and social surveys [29]. However, the research did not focus on evaluating the residual performance of the battery.
To sum up, prior research has basically evaluated the performance of batteries from an engineering perspective (e.g., voltage and discharge characteristics, among others). This analysis depends on the experimental environment and measuring equipment; therefore, the evaluation method has significant limitations. To this end, the present study evaluates the residual performance of vehicle batteries from the perspective of social science (e.g., vehicle usage status and usage habits, among others), providing a new viewpoint for the SOH evaluation and RUL prediction of batteries. Specifically, after conducting an online questionnaire survey among EV owners, we analyzed and considered the degradation factors of the battery based on the collected data, and finally evaluated the residual performance of the vehicle battery. The method proposed in the present study for evaluating the residual performance of batteries is fundamentally a data-driven approach, but it is highly applicable because of the ease of data collection from surveys, rather than engineering experiments. Furthermore, the battery data used in establishing this evaluation method come from the EVs of many different car companies (including BYD, XPENG, NIO, Tesla, etc.) in the Chinese market. The types and specifications of batteries carried by different EVs are different; therefore, we assume that the battery residual performance evaluation method proposed in this study can be applied to batteries with different specifications and deterioration degrees.
3. Data Collection and Research Methods
In this section, we introduce the methodology of this study. To obtain sample data for the residual performance evaluation of vehicle batteries, we first conducted a social survey among EV owners. Firstly, in Section 3.1, we describe how we determined the survey objects and sample size. Then, in Section 3.2, we detail how we designed the questionnaire content based on the research objectives. Next, in Section 3.3, we describe how we conducted an online survey, and briefly introduce the collected questionnaire results. The collected responses were analyzed and organized, and the effectiveness of the questionnaire was verified through reliability and validity analyses using SPSS Statistics 23.
3.1. Survey Objects and Sample Size
Driving is determined by a driver’s judgment, which is the result of subjective behavior. Thus, to obtain information and data more effectively and perform an accurate statistical analysis, the present study aimed to acquire basic information and actual data on the usage and charges of vehicles from EV drivers through a social survey.
First, EV (including EV and Plug-in Hybrid Electric Vehicle (PHEV), collectively referred to as EV in this study) owners were selected as participants of the survey. Currently, among next-generation vehicles, EVs and HEVs have relatively high penetration rates. However, because of the low capacity of HEV batteries and their concentration in the HEV market in Japan, a simple comparison is difficult. In addition, HEVs can automatically switch power sources based on driving conditions, charging the battery while the engine drives the vehicle, without the need for users to charge. However, the residual performance evaluation method proposed in this study involves the charging behavior of users; therefore, HEVs cannot be regarded as the research subject in this study. In other words, the evaluation method in this study is only applicable to EV batteries, but not to HEV batteries. In addition, among EV users, some use rental or shared EVs, as well as vehicles owned by family members or friends. Since these people, who are not the actual vehicle owners, may not know the actual EV usage status, their answers will reduce the reliability and validity of the survey. Therefore, in this survey, only EV owners were surveyed; other EV users were not permitted to answer the questionnaire.
Second, the survey selected Shanghai, China, as the target area. China is home to the largest EV market in the world, with approximately 2.73 million new EVs sold in 2021; hence, it was easy to obtain the samples required for this survey from China. However, if a questionnaire survey is conducted in multiple cities in China, the survey results will be greatly affected by factors such as different temperatures, environments, and humanities; therefore, we decided to focus on one city. Finally, because of the large number and wide distribution of new-energy vehicles, Shanghai, the economic center of China and one of the pilot cities for EV promotion from an early stage, was selected as the target area for this survey [30].
Moreover, the required sample size for the survey was calculated based on the error rate, confidence coefficient, and population deviation. According to the literature, a 5% error rate and 95% confidence interval are common settings for questionnaire surveys [31,32,33]. When the confidence interval is set to 95%, the confidence coefficient is 1.96 [34,35]. Regarding population deviation, because the sample size was the largest when the population deviation was 50% in the calculation, it was set to 50%. Thus, the required sample size was calculated from an error rate of 5%, a confidence interval of 95%, and a population deviation of 50%. Based on the calculation results, the sample size for the questionnaire was assumed to be greater than 385. Consequently, the sample size for the initial questionnaire was fixed at 400 participants.
where , E, and represent the confidence coefficient, error rate, and population deviation, respectively.
3.2. Questionnaire Content
The questionnaire comprised three parts, with a total of 18 questions. The first part contained questions regarding the respondents’ basic information, with five questions on the age, sex, family income, family size, and family composition of the EV owners. The second part included seven questions concerning the vehicle usage status, asking the EV owners information about their vehicle usage and their utilization habits, such as the battery capacity, years of use, and frequency of use. Finally, the third part included six questions concerning the vehicle charge status, asking the EV owners about their usual charging conditions and habits, such as the charging method, depth of charging/discharging (DoC/DoD), frequency of charge, charging amount, and state of charge (SOC). Please refer to the appendix (Appendix A) for the specific questionnaire content.
Among the above 18 questions, the battery capacity/vehicle type, last charging amount, and last SOC were set to calculate the SOH of the vehicle battery, whereas the remaining questions were discussed as factors affecting the SOH of the battery. At present, the definition of the battery SOH, which varies across studies, is typically based on two perspectives: battery capacity and internal resistance. In addition, the definitions of SOH based on battery capacity distinguish between absolute and relative capacity [36]. In the present study, the SOH of a vehicle battery was calculated from its absolute capacity, which is the most common definition. The calculation method is shown in Formula (3).
where is the last charging amount of the EV (corresponding to item 18 in the questionnaire); B% and A% are the SOCs after and before the last charge, respectively (corresponding to item 17 in the questionnaire); and is the rated capacity of the battery (corresponding to item 6 in the questionnaire).
In addition, considering the energy loss during EV charging, the energy conversion rate must be incorporated into the calculation formula. The of the EV battery is generally 85–95%, but the value fluctuates depending on the case [37]. In the present study, to calculate the battery SOH with as much similarity as possible to the actual value, the value of was adjusted based on the specific usage and charge status of the EVs. Thus, the residual performance of the vehicle battery was determined based on the battery capacity, battery SOC, and charging amount provided in the questionnaire.
3.3. Social Survey Method and Collection Results
Owing to the fast distribution speed and wide distribution range of the questionnaire, as well as the convenience for respondents of being able to fill in the questionnaire anytime, online surveys can render data collection easy and improve the efficiency of sample collection [38]. Therefore, the present study adopted the online survey method, distributing and collecting questionnaires through the platform “Sojump”, the largest survey company in China. The online survey was conducted from September to October 2022, and finally, 911 samples were collected. Excluding 511 invalid samples, the number of valid samples reached 400, as planned (recovery rate ≈ 43.9%).
To ensure that the questionnaires were well designed and that the survey results were effective, reliability and validity analyses were conducted. First, for the reliability analysis, SPSS Statistics 23 was used to calculate the Cronbach’s α coefficient of the questionnaire. The Cronbach’s α coefficient was as low as 0.647, but still within the acceptable range, proving that the questionnaire’s reliability was satisfactory. On the other hand, a method combining content and construct validity was used in the validity analysis. In this survey, question items were created according to the regional characteristics of Shanghai by referring to the questionnaire content verified in previous research. Furthermore, the questionnaire was improved through a pre-investigation, making the structure and content of the questionnaire more rational; thus, we believe that the content validity was excellent. For construct validity, SPSS Statistics 23 was used to perform KMO and Bartlett’s test of sphericity on the sample data; the results are shown in Table 1. The KMO value was 0.578 > 0.5, and the p-value of Bartlett’s test of sphericity was 0.000 < 0.05, indicating concordance between the observed variables and confirming the validity of the survey.

Table 1.
KMO and Bartlett’s Test.
4. Survey Results and Data Analysis
In this section, the survey results are analyzed in three parts. First, Section 4.1 describes how the characteristics of the sample data were analyzed using descriptive statistics. Second, Section 4.2 details how a correlation analysis was conducted using RStudio to identify the human factors deteriorating battery performance. Finally, Section 4.3 describes how a multiple regression analysis was performed, using RStudio, to establish an evaluation model that considers the association between the vehicle usage status and the battery SOH in order to evaluate the residual performance of the battery.
4.1. Descriptive Statistics
This section describes the descriptive statistical analysis of the sample data, the quantitative and qualitative analyses of responses to each item in the questionnaire, and the impact of each variable on the deterioration of vehicle battery performance. The questionnaire items included age, family income, family size, and other questions related to respondents’ basic personal information. Although these items were not the major subjects of the present study, they are indispensable components of social surveys, because the analysis of their descriptive statistics provides the perspective necessary for subsequent data analyses. Figure 1 shows the statistics of respondents’ basic information. First, the age distribution was centered around 26–35 years, accounting for 66% of the total, whereas the number of people under or above this age range was relatively small. In other words, EV owners were largely young people in their 20s and 30s, which is consistent with the characteristics of the EV consumer market. In terms of family income, respondents with an annual income of 4–8 million JPY accounted for the majority (54%), followed by 21% and 15.75% with an annual income of 8–12 million JPY and <4 million JPY, respectively; meanwhile, very few respondents had an annual income of over 12 million JPY. As the prices of EVs are higher than those of most gasoline vehicles, the families of EV owners must have a certain level of economic strength. According to the age distribution, however, most of the respondents were under 35 years of age, and the income of individuals in this age group is not very high; therefore, it was reasonable that the respondents’ annual family income was mainly below 12 million JPY in the survey. Regarding family size, the percentage of households with three people was the highest, at 53.75%. Although there were few families with four or more than five people, they accounted for a considerable proportion. We assumed that with an increase in family size, the load of the EV would increase, accelerating the deterioration of vehicle batteries.
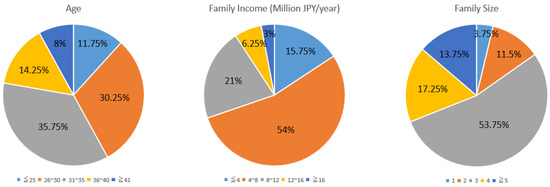
Figure 1.
Statistics of basic information of respondents.
Subsequently, a descriptive statistical analysis of the key evaluation elements of the questionnaire was conducted. Figure 2 shows the number of EVs by years of use. Most EVs were 3 years old, and almost no EVs were in use for over 6 years. Despite China’s promotion of R&D and the popularization of EVs constituting a national policy since 2010, the actual popularization of EVs began in the country in 2015. Therefore, as is evident from the survey results, the years of EV use were very short. In addition, we assumed that the batteries of EVs that were manufactured over 5 years ago would deteriorate rapidly after being used for approximately 6 years, and then the EVs would become EOL vehicles.
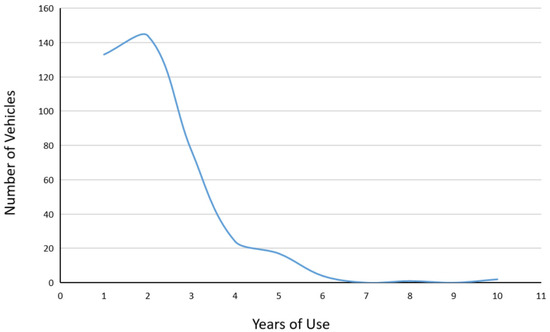
Figure 2.
Years of use of EVs.
Generally, when charging EVs, the faster the charging mode of the charging stand, the more accelerated the deterioration of the vehicle batteries. Therefore, we assumed that the charging method of an EV would be an important indicator for evaluating its residual battery performance. Figure 3 shows the number of EV owners corresponding to each charging method. Most EV owners use the regular charging mode at home and the fast charging mode at public charging stations. When going out, people usually use the fast charging mode of public charging stations because of the need for charging in a short time, but when at home, people use the regular charging mode because they have sufficient time to charge. Additionally, only 10 of the 400 respondents used the charging method of battery exchange. According to the survey results, only NIO Inc.’s EVs can realize battery exchange in China. Thus, the charging method of battery exchange is not widespread.
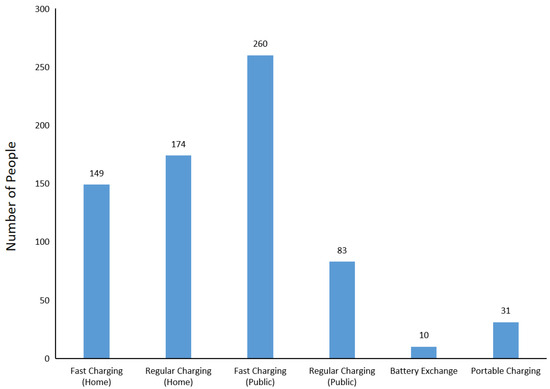
Figure 3.
Charging methods of EVs.
The DoC and DoD of EVs in Figure 4 indicate the ratio of the SOC of batteries when the EV owners charge and discharge at regular times. Charging EV batteries to >90% was the highest for DoC, and discharging the batteries to 10–30% was the highest for DoD. In this regard, we believe that most EV owners select “full charge” for convenience, without worrying about the performance deterioration of the vehicle battery due to overcharging. However, unlike during charging, if the SOC of the battery is very low during discharging, this may significantly damage the battery. In particular, if the battery is discharged to <10%, the performance of the EV may decrease significantly and the vehicle may stop operating. Therefore, it is common to start charging when the SOC of the battery drops to 10–30%.
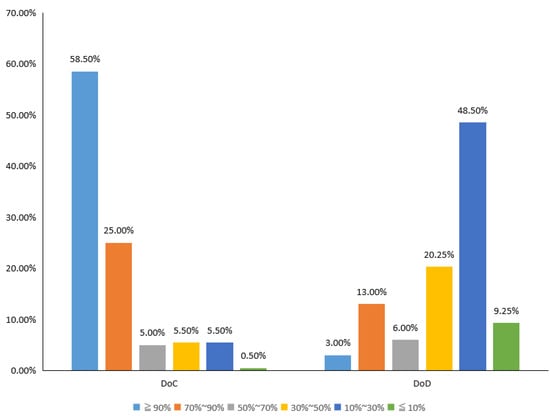
Figure 4.
DoC and DoD of EVs.
In general, the more frequently an EV is used, the more frequently it is charged. In addition, the lifespan of the battery is directly related to the charge/discharge cycles; therefore, we assume that the frequency of the use and frequency of charge of EVs are important indicators for evaluating the residual performance of vehicle batteries. Figure 5 shows the frequency of use and frequency of charge of EVs, as well as the corresponding number of EV owners. In terms of the frequency of use, most people use their EVs every day or 4–6 days a week, whereas in terms of the frequency of charge, the majority charge their EVs once to thrice a week. In other words, even if EV owners use the vehicles every day, they charge them approximately every 2–3 days.
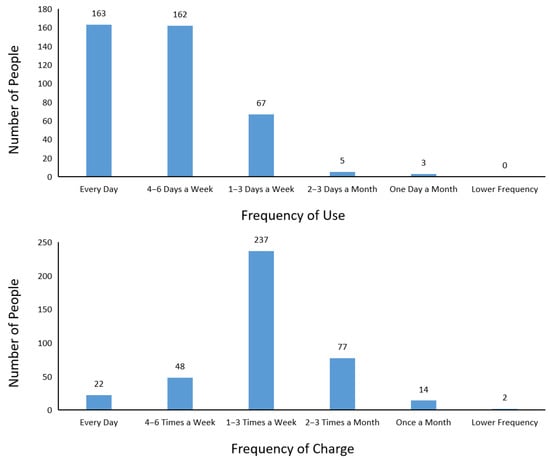
Figure 5.
Frequencies of use and charge of EVs.
Regarding the remaining evaluation items in the questionnaire, some other findings were noted. For instance, the EV charging fee per time was approximately 200–1400 JPY. By calculating the charging fee, together with the electricity bill in Shanghai and the charging methods of the EV, the EV owners’ charging amount each time was calculated. Then, by judging whether the charging amount each time corresponded reasonably to the usage and charging frequency, the usability of the questionnaire could be determined. This facilitated the elimination of invalid questionnaires. Additionally, in terms of the period of EV usage, vehicles were most frequently used during the commuting hours of 5 a.m. to 10 a.m. and 4 p.m. to 8 p.m. on weekdays, whereas on weekends, they were more frequently used during 11 a.m. to 3 p.m. and 9 p.m. to 1 a.m. Regarding the maintenance cost of the EVs (excluding insurance premiums), the annual amount reported by most respondents was >10,000 JPY. We assumed that with an increase in maintenance costs, the deterioration of vehicle batteries might be mitigated to some extent.
4.2. Correlation Analysis
The free statistical software RStudio (version 2022.07.2+576) was used to perform correlation analysis on the sample data. Specifically, the correlations between the explanatory and objective variables were analyzed. In the present study, battery SOH, which indicates the residual performance of vehicle batteries, was selected as the objective variable, whereas the other evaluation items were considered the explanatory variables. In other words, a correlation analysis was performed based on the relationship between each evaluation item and the SOH of the battery. Given the large number of evaluation items, the analysis was divided into three parts: the basic information of the respondents, the vehicle usage status, and the vehicle charge status.
The analysis results of the correlation between the respondents’ basic information and the SOH of the battery are presented in Figure 6. Other than the items “male” and “female” showing an absolute negative correlation, which was expected, no obvious correlation was noted between the other variables. Thus, the basic information of EV owners, such as age, sex, family income, and family size, was not directly correlated with the residual performance of vehicle batteries.
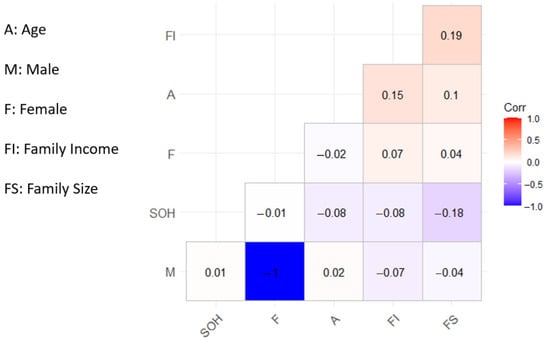
Figure 6.
Correlation between respondents’ basic information and battery SOH.
Figure 7 shows the analysis results of the correlation between the vehicle usage status and the battery SOH. The correlation coefficient between the battery’s years of use and SOH is −0.8, and the p-value is 0.000; therefore, these two variables show a strong negative and significant correlation at the 1% level. Similarly, the EV use frequency and battery SOH show a weak negative but significant correlation at the 1% level. However, the other variables related to the vehicle usage status, such as EV’s usage time in different periods and maintenance costs, are not directly correlated with the battery SOH.
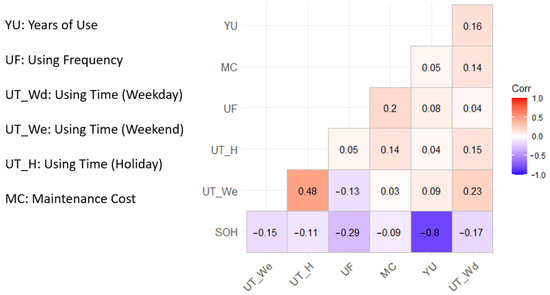
Figure 7.
Correlation between vehicle usage status and battery SOH.
The analysis results of the correlation between the charge status of the EV and the SOH of the battery are shown in Figure 8. Among the evaluation items related to the vehicle charge status, only the charging frequency and DoD show an obvious correlation with the battery SOH. The correlation coefficients between the two variables and battery SOH are −0.35 and −0.3, respectively, and the p-value is 0.000. Thus, the charging frequency and DoD of EVs exhibit a weak negative but significant correlation with the battery SOH at the 1% level.
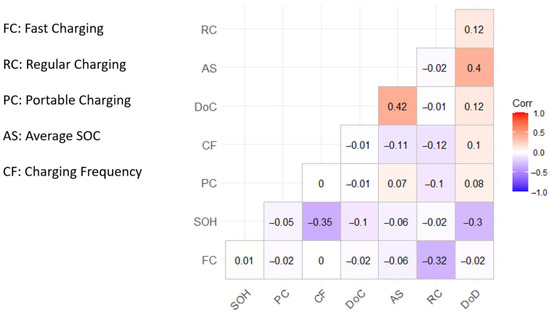
Figure 8.
Correlation between vehicle charge status and battery SOH.
4.3. Multiple Regression Analysis
Based on the results of correlation analysis, a multiple regression analysis was performed to construct a residual performance evaluation model for vehicle batteries. Specifically, as with the correlation analysis, each evaluation item was considered the explanatory variable, and battery SOH was considered the objective variable. Multiple regression analysis was performed on the sample data using RStudio to build a linear regression model. In addition, based on the regression coefficients of the model, a multiple regression equation was established to clarify the association between the usage status of the vehicle and the residual performance of its battery.
The results of the multiple regression analysis are presented in Table 2 and Table 3. The former presents a summary of the regression model, and the latter presents the relevant coefficient of the regression model. As shown in Table 2, the adjusted R2 is 0.8608 and the p-value is 0.000, indicating that the analysis results are significant at the 1% level. Moreover, the Durbin–Watson (DW) value is 1.947, which is close to 2, indicating that the samples were independent of one another.
Table 2.
Model summary of multiple regression.
Table 3.
Coefficients of multiple regression model.
Furthermore, Figure 9 shows the residual in the results of multiple regression analysis. From the normal P-P plot of the regression standardized residual, it can be seen that the distribution of the expected and observed cumulative probability is nearly linear. Moreover, from the histogram of the residual, it can be seen that the distribution of the regression standardized residual is close to normal distribution. In view of this, the evaluation index parameters have a clear linear relationship with the objective variable (SOH); therefore, the results of multiple regression analysis are valid and statistically significant.
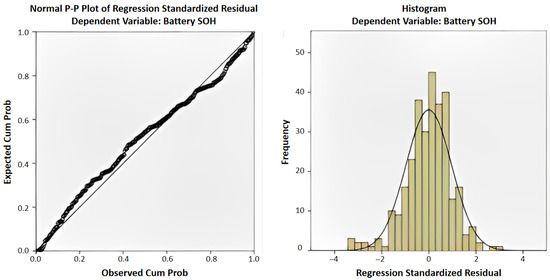
Figure 9.
Residual in results of multiple regression analysis.
As shown in Table 3, most explanatory variables were automatically deleted during multiple regression, leaving only seven variables with strong correlations. Among these, the VIF values of the first six variables were close to 1, all of which were relatively small; therefore, we judged that there was no multicollinearity problem. In addition, all p-values were 0.000, indicating that these variables affected the SOH of battery at the significance level of 1%. However, the VIF value of the seventh variable, “time of use (weekends)”, was significantly larger than that of the first six variables; therefore, a multicollinearity problem was present for the seventh variable. This is because the usage time of EVs on weekends is strongly correlated with that on weekdays and long holidays. In addition, the p-value of the seventh variable was 0.089, which failed the test of significance at the 5% level. Therefore, this variable could not be included in the multiple regression equation. Finally, the standardized coefficient of each variable was extracted to construct a multiple regression equation, as shown in Formula (4).
where Y is the objective variable “battery SOH”, and X1–X6 are the six explanatory variables described above, namely “years of use”, “charging frequency”, “DoD”, “fast charging”, “frequency of use”, and “regular charging”, respectively, according to the descending order of regression coefficient. Among these, four variables, namely “years of use”, “charging frequency”, “DoD”, and “frequency of use”, were consistent with the results of the correlation analysis, but the variables “fast charging” and “regular charging” in the charging methods did not show a clear correlation with battery SOH in the correlation analysis. Furthermore, according to the formula, among the six explanatory variables, only the regression coefficient of “regular charging” was positive, whereas the coefficients of the other explanatory variables were negative.
Note that the variables are represented differently. Regarding a battery’s years of use, it is necessary to add months to the number of years the batteries have been used for, and then convert them to decimal form. The charging and usage frequencies of EVs must be converted to the number of average charging times and usage days per month. Fast and regular charging modes of EVs are displayed using dummy variables 0 and 1, where the charging mode is 1 if used; otherwise, the charging mode is 0. Moreover, DoD is represented by the SOC of batteries when the EVs begin to charge.
Next, according to the results of multiple regression analysis, the impact of each evaluation item on the battery SOH was analyzed. First, the regression coefficient of “years of use” was −0.8297, which was several times the coefficient of the other variables; therefore, among the human factors deteriorating battery performance, the years of battery use has the greatest impact, and is a decisive factor in battery deterioration. Naturally, with an increase in the number of years of use of EVs and batteries, the performance of batteries will decline significantly. The next variable that significantly impacted the SOH of the battery was the “charging frequency”. This is because the lifespan of a battery is directly related to the number of charge/discharge cycles, and an increase in the charging/discharging frequency can significantly decrease battery performance. Regarding the “frequency of use”, with an increase in the usage frequency of an EV, the charging frequency will increase with the acceleration of battery power consumption, thereby affecting battery performance. However, because the regression coefficient was small, the impact of increased usage frequency of EVs on battery performance was not significant. In other words, it is unnecessary to deliberately refrain from using a vehicle to protect its battery. Additionally, “DoD” was also one of the important factors promoting the deterioration of battery performance. This is because if the DoD of the battery is very large, with an increase in the utilization rate of the active material of the electrode, the electrode plate will swell and deform and the active material on the electrode plate will easily fall off, causing irreversible damage to the structure of the battery and significantly shortening its life. Conversely, DoC does not greatly affect the performance of the battery, because current vehicle batteries are typically equipped with overcharge-protection circuits, which automatically cut off the power or maintain low-current charging when the batteries are fully charged. Moreover, charging stations were reported as the most frequently used charging methods for EVs. Among the relevant evaluation items, the regression coefficient for “fast charging” was negative, while that for “regular charging” was positive. This is because the charging temperature is relatively high when the fast-charging mode is used. Therefore, frequent fast charging can damage the battery. In contrast, batteries can be used for a long life cycle if the regular charging mode is used frequently.
5. Construction of a Residual Performance Evaluation Method for Batteries
Through the above correlation and multiple regression analyses, the effect of the vehicle usage status on battery performance was investigated, and the human factors deteriorating battery performance were clarified. Among these, six evaluation items, including the battery’s years of use, the EV’s charging frequency, DoD, fast charging, usage frequency, and regular charging, showed the most significant impact on battery deterioration. Therefore, to delay the deterioration and extend the life of vehicle batteries, the usage methods and habits of vehicles warrant attention. For instance, EV owners should properly control the EVs’ charging frequency and refrain from charging the EVs if the batteries still have sufficient residual power. Even though EVs are used every day for commuting, they are supposed to be charged every 2–3 days. In addition, attention should be paid to avoid over-discharging the batteries. Moreover, batteries should be immediately charged when the battery power drops to 20–30%, and situations in which the battery is charged after the power drops below 10% should be avoided. Furthermore, unless it is necessary to complete EV charging in a short time, and it is better to use the regular charging mode, rather than the fast charging mode of charging stations, as much as possible. If attention is paid to these details when using EVs, we believe that the deterioration process of vehicle batteries can be significantly delayed, and the performance of batteries can be maintained over the long term.
Furthermore, we built a multiple regression model to accurately predict the residual performance of vehicle batteries. In previous research, the residual performance of vehicle batteries was mainly evaluated by measuring the relevant battery parameters. For instance, the degree of battery deterioration was determined by measuring the actual voltage of the batteries and comparing it with the rated voltage. Alternatively, the internal resistance of the batteries was measured and a capacity decay model was used to predict the RUL of batteries. However, to predict the residual performance of batteries, any engineering evaluation method inevitably depends on an array of electronic devices to measure various battery parameters. Since evaluation cannot be performed without measuring equipment, the current performance evaluation methods for batteries are limited by the measurement environment, and it is difficult to measure the parameters of all batteries. Therefore, the present study proposed a residual performance evaluation method for batteries from a social science perspective. By inputting the data of the six key variables mentioned above—the battery’s years of use, the EV’s charging frequency, DoD, fast charging, usage frequency, and regular charging—into the multiple regression model developed in the present study, the residual performance of batteries could be calculated accurately. In other words, in the proposed evaluation method, the residual performance of batteries can be judged as long as the vehicle usage and charge status are known; therefore, analysis using this method is simpler and faster than that using conventional battery performance evaluation methods. However, due to the lack of waste battery samples and instruments for diagnosing battery residual performance, the EV battery residual performance evaluation method proposed in this study has not undergone conduct empirical analysis. We plan to collaborate with EV dealers in future research to conduct face-to-face interviews with EV owners, in order to gain insight into the usage and charging status of the vehicles. At the same time, we will use diagnostic instruments to measure the SOH of the interviewees’ EV batteries, in order to empirically evaluate the battery SOH evaluation model proposed in this study. In summary, the residual performance evaluation method for batteries proposed in the present study may be useful for predicting the RUL of vehicle batteries and evaluating the battery SOH for reuse and recycling. Additionally, it is of great significance as a simple performance evaluation model for batteries, and holds tremendous academic value in the field of sustainability science.
6. Conclusions and Future Tasks
From the perspective of the resource recovery trends of EV batteries, the construction of battery recycling systems in most countries lags, and evaluation methods that can easily grasp the residual performance of batteries have not been developed as of yet. Existing methods for evaluating battery residual performance focus on estimating or predicting the residual performance by measuring the battery parameters that are relevant from an engineering perspective. However, owing to the limitations of measuring equipment, inconvenience of measurement, and large measurement errors, the current evaluation methods cannot accurately evaluate the residual performance of vehicle batteries. However, in the present study, the residual performance of vehicle batteries was evaluated by estimating their SOH according to the usage status of EVs from a social science viewpoint. Specifically, multiple regression analysis was performed using a large amount of sample data obtained through a social survey of EV owners in China. A predictive model for battery SOH was developed based on the EV usage/charge status. As long as the parameters of the battery’s years of use, the EV’s charging frequency, DoD, fast charging, usage frequency, and regular charging, which are regarded as the key variables, are known and input into the regression model created here, the SOH of batteries can be estimated and the residual performance of batteries can be evaluated. Unlike previous evaluation methods, the method proposed in the present study for evaluating the residual performance of batteries does not rely on external electronic devices for battery parameter measurement, and it can easily estimate the residual performance of batteries by applying the developed model based on vehicle usage and charge status information. The proposed evaluation method provides judgment criteria for battery lifetime prognosis and performance diagnosis, as well as recycling and reuse of used batteries, which is of great research significance.
In addition, the following policy proposals are drawn based on the results of the present study. First, to address resource recovery and proper treatment of the large number of batteries that are subsequently generated, battery deterioration must be delayed, and their residual value must be fully exploited at the stage of use. In the present study, human factors deteriorating battery performance were clarified, including the battery’s years of use, the EV’s charging frequency, DoD, fast charging, usage frequency, and regular charging. Thus, consumers can be trained in maintaining battery performance based on these influencing factors through general EV usage instructions. Consequently, while extending the service life of vehicle batteries, waste battery generation can be fundamentally reduced. On the other hand, countries should attribute importance to the residual performance evaluation of batteries and strive to improve the accuracy and speed of battery performance measurements; only based on these can battery recovery, reuse, and recycling systems be constructed. A comprehensive battery performance evaluation system can be built by determining the residual performance of batteries based on the vehicle usage and charge status, instead of assessing the performance and RUL of batteries using measuring devices.
Overall, the novelty of this study lies in our proposal of a new residual performance evaluation method for vehicle batteries and clarification of the main human factors deteriorating vehicle battery performance. Although we believe that, based on the analysis results, the evaluation method has high accuracy and reliability, it is an undeniable fact that it lacks experimental validation. In the future, we plan to double-verify the residual performance of the batteries based on engineering evaluation and social science evaluation to achieve method fusion. We aim to deepen the discussion in this article by constructing a comprehensive battery performance evaluation system that combines the performance evaluation method of batteries based on the social science viewpoint derived in the present study with one based on an engineering perspective. Furthermore, international comparisons of battery resource recovery systems in various countries will be conducted to further deepen the discussion of international standardization and global recycling strategies of vehicle batteries.
Author Contributions
Conceptualization, H.C. and J.Y.; methodology, H.C. and J.Y.; formal analysis, H.C., J.Y., and X.L.; investigation, H.C. and X.L.; data curation, H.C. and X.L.; writing—original draft preparation, H.C.; writing—review and editing, H.C., J.Y., X.L., and K.O.; visualization, H.C.; supervision, J.Y.; project administration, J.Y., X.L., and K.O.; funding acquisition, J.Y.; validation, K.O. All authors have read and agreed to the published version of the manuscript.
Funding
This research was funded by the Murata Science Foundation and Japan Society for the Promotion of Science, grant number 21H03666.
Institutional Review Board Statement
This social survey does not involve any specific personal information. Participants can withdraw from the survey at any time midway. Besides, at the end of the survey, participants will not be directly rewarded with money, but will be rewarded with points. Therefore, according to the Ethics Committee regulations of the Graduate School of International Cultural Studies, Tohoku University, ethics approval is not required for this research.
Informed Consent Statement
Informed consent was obtained from all subjects involved in the study. The beginning of this questionnaire included a statement of information confidentiality agreement. All subjects must agree to the statement in order to enter the questionnaire filling process.
Data Availability Statement
The original contributions presented in this study are included in the article. Further inquiries can be directed to the corresponding authors.
Conflicts of Interest
The funders had no role in the design of the study; in the collection, analyses, or interpretation of data; in the writing of the manuscript; or in the decision to publish the results.
Abbreviations
The following abbreviations are used in this manuscript:
| EVs | electric vehicles |
| CJK | China, Japan, and South Korea |
| EOL | end-of-life |
| LIBs | lithium-ion batteries |
| HEVs | Hybrid Electric Vehicles |
| SOH | state of health |
| BMS | battery management system |
| RUL | remaining useful life |
| eSPM | enhanced single-particle model |
| SVR | support vector regression |
| DNN | deep neural network |
| LORPF | linear optimization resampling particle filter |
| SGM | sliding-window gray model |
| RVM | relevance vector machine |
| KF | Kalman filter |
| PHEV | Plug-in Hybrid Electric Vehicle |
| SOC | state of charge |
| DoD | depth of discharging |
| DW | Durbin–Watson |
| DoC | depth of charging |
Appendix A
Table A1.
Questionnaire content.
Table A1.
Questionnaire content.
| Parts | Items | Variables | Contents |
|---|---|---|---|
| Respondents’ basic information | Q1 | Age | Your age |
| Q2 | Sex | Your sex | |
| Q3 | Family income | Your family’s annual income | |
| Q4 | Family size | Number of household members currently living with you | |
| Q5 | Family composition | Family members with whom you currently live | |
| Vehicle usage status | Q6 | Battery capacity | Your battery capacity/vehicle type (including specific configuration) |
| Q7 | Years of use | Your EV’s years of use | |
| Q8 | Battery replacement | Has the battery been replaced? (if so, answer the new battery’s years of use) | |
| Q9 | Frequency of use | Your EV’s frequency of use | |
| Q10 | Time of use | Your EV’s time of use on weekdays, weekends, and holidays, respectively | |
| Q11 | Period of use | Your EV’s period of use on weekdays and weekends, respectively | |
| Q12 | Maintenance costs | Your EV’s average annual maintenance cost (excluding insurance costs) | |
| Vehicle charge status | Q13 | Charging methods | Your EV’s primary charging method |
| Q14 | Charging frequency | Your EV’s charging frequency | |
| Q15 | Charging fee | Your EV’s average charging fee per time | |
| Q16 | DoC/DoD | Percentage you normally charge or discharge your EV to | |
| Q17 | SOC | Range of SOC when you charged the EV last | |
| Q18 | Charging amount | Charging amount when you charged the EV last |
References
- Abdelbaky, M.; Peeters, J.R.; Dewulf, W. On the influence of second use, future battery technologies, and battery lifetime on the maximum recycled content of future electric vehicle batteries in Europe. Waste Manag. 2021, 125, 1–9. [Google Scholar] [CrossRef]
- Alfaro-Algaba, M.; Ramirez, F.J. Techno-economic and environmental disassembly planning of lithium-ion electric vehicle battery packs for remanufacturing. Resour. Conserv. Recycl. 2020, 154, 104461. [Google Scholar] [CrossRef]
- Choi, Y.; Rhee, S.-W. Current status and perspectives on recycling of end-of-life battery of electric vehicle in Korea (Republic of). Waste Manag. 2020, 106, 261–270. [Google Scholar] [CrossRef] [PubMed]
- Yang, Y.; Hu, J.; Liu, Y.; Chen, X. Alternative selection of end-of-life vehicle management in China: A group decision-making approach based on picture hesitant fuzzy measurements. J. Clean. Prod. 2019, 206, 631–645. [Google Scholar] [CrossRef]
- Richa, K. Sustainable Management of Lithium-Ion Batteries After Use in Electric Vehicles; Rochester Institute of Technology: Rochester, NY, USA, 2016. [Google Scholar]
- Li, Z.; Li, Y. Research on laws and regulations of power battery recycling in developed countries. Automob. Accessories 2019, 19, 3. [Google Scholar]
- Komeyama. Vehicle Batteries, Mandatory Recovery and Accelerated Reuse; ARC Watching: Tokyo, Japan, 2018; Available online: https://www.google.com/url?sa=t&source=web&rct=j&opi=89978449&url=https://arc.asahi-kasei.co.jp/member/watching/pdf/w_286-05.pdf&ved=2ahUKEwjfnYrg96-NAxV73zgGHTRSMWoQFnoECCYQAQ&usg=AOvVaw0x3jcQs3kYiaihymxWY2gu (accessed on 5 April 2025).
- METI. Interim Arrangement (Draft) Supplementary Material of the Automotive New Era Strategies; Ministry of Economy, Trade and Industry: Tokyo, Japan, 2019. [Google Scholar]
- Wang, S.; Yu, J.; Okubo, K. Estimation of End-of-Life Hybrid Vehicle number in Japan considering secondhand vehicle exportation. Waste Manag. 2020, 104, 198–206. [Google Scholar] [CrossRef]
- MoE. Notice Concerning the Return of EV Batteries. 2018. Available online: https://www.law.go.kr/LSW/admRulInfoP.do?admRulSeq=2100000239532&chrClsCd=010201 (accessed on 21 November 2021).
- Yu, J. Resource Weaponization, Environmental Regulation, Carbon Neutralization. Scrap Watch. 2022. Available online: https://www.scrapwatch.co.kr/news/articleView.html?idxno=42186 (accessed on 25 June 2022).
- Chen, H.; Zhang, T.; Gao, Q.; Han, Z.; Jin, Y.; Li, L.; Yang, K.; Xu, Y.; Liu, X.; Xu, X.; et al. Assessment and management of health status in full life cycle of echelon utilization for retired power lithium batteries. J. Clean. Prod. 2022, 379, 134583. [Google Scholar] [CrossRef]
- Li, R.; Hong, J.; Zhang, H.; Chen, X. Data-driven battery state of health estimation based on interval capacity for real-world electric vehicles. Energy 2022, 257, 124771. [Google Scholar] [CrossRef]
- Lipu, M.S.H.; Hannan, M.A.; Hussain, A.; Hoque, M.M.; Ker, P.J.; Saad, M.H.M.; Ayob, A. A review of state of health and remaining useful life estimation methods for lithium-ion battery in electric vehicles: Challenges and recommendations. J. Clean. Prod. 2018, 205, 115–133. [Google Scholar] [CrossRef]
- Zhao, X.; Geng, G.; Lin, D.; Li, Z.; Zhang, Y. Review of Data-driven State of Health Estimation for Lithium-ion Battery. Zhejiang Electr. Power 2021, 40, 65–73. [Google Scholar]
- Oriental Consultants Co., Ltd. Cascade Reuse Model Demonstration Project Aiming to Maximize the Life Cycle of EV Lithium-Ion Batteries Based on the Application of Battery Diagnosis Technology. 2017. Available online: https://www.env.go.jp/content/900532493.pdf (accessed on 1 February 2023).
- Chen, H.; Yu, J.; Liu, X. Development Strategies and Policy Trends of the Next-Generation Vehicles Battery: Focusing on the International Comparison of China, Japan and South Korea. Sustainability 2022, 14, 12087. [Google Scholar] [CrossRef]
- Okudera, J. China’s rare earths, 70% of the world’s share. Asahi Shimbun. 2023. Available online: https://www.asahi.com/articles/ASR4L71P3R4LUHBI04P.html (accessed on 1 February 2023).
- Wang, W. Cascade Development and Utilization of Power Battery and Economic Research; North China Electric Power University: Beijing, China, 2015. [Google Scholar]
- Wang, C.; Yuan, Z.-Y.; Wang, Y.-W.; Cao, W.-J.; Jiang, F.-M. Overview of Key Technologies for Echelon Utilization of Decommissioned Power Batteries. Adv. New Renew. Energy 2021, 9, 327–341. [Google Scholar]
- Su, C.; Chen, H. A review on prognostics approaches for remaining useful life of lithium-ion battery. IOP Conf. Ser. Earth Environ. Sci. 2017, 93, 012040. [Google Scholar] [CrossRef]
- Yang, F.; Song, X.; Dong, G.; Tsui, K.-L. A coulombic efficiency-based model for prognostics and health estimation of lithium-ion batteries. Energy 2019, 171, 1173–1182. [Google Scholar] [CrossRef]
- Khodadadi Sadabadi, K.; Jin, X.; Rizzoni, G. Prediction of remaining useful life for a composite electrode lithium ion battery cell using an electrochemical model to estimate the state of health. J. Power Sources 2021, 481, 228861. [Google Scholar] [CrossRef]
- Wei, J.; Dong, G.; Chen, Z. Remaining useful life prediction and state of health diagnosis for lithium-ion batteries using particle filter and support vector regression. IEEE Trans. Ind. Electron. 2017, 65, 5634–5643. [Google Scholar] [CrossRef]
- Khumprom, P.; Yodo, N. A Data-Driven Predictive Prognostic Model for Lithium-ion Batteries based on a Deep Learning Algorithm. Energies 2019, 12, 660. [Google Scholar] [CrossRef]
- Chen, L.; An, J.; Wang, H.; Zhang, M.; Pan, H. Remaining useful life prediction for lithium-ion battery by combining an improved particle filter with sliding-window gray model. Energy Rep. 2020, 6, 2086–2093. [Google Scholar] [CrossRef]
- Song, Y.; Liu, D.; Hou, Y.; Yu, J.; Peng, Y. Satellite lithium-ion battery remaining useful life estimation with an iterative updated RVM fused with the KF algorithm. Chin. J. Aeronaut. 2018, 31, 31–40. [Google Scholar] [CrossRef]
- Noboru, K.; Shuichiro, Y.; Yasuhiko, O.; Bayashi, F.; Yasumasa, M. Development of a deterioration diagnosis method for commercial batteries based on high-speed pulse and AC impedance measurement. Electrochem. Soc. Jpn. 2021, 89, 107–118. [Google Scholar]
- Zhang, H. Study on the Assessing Methods and the Possibility of Popularity of Pure Electric Vehicles Based on the Empirical Test; Wuhan University of Technology: Wuhan, China, 2014. [Google Scholar]
- Li, M. By the end of 2021, the number of new energy vehicles in China will reach 7.84 million. The People’s Daily, 12 January 2022. [Google Scholar]
- Austin, P.C. Type I error rates, coverage of confidence intervals, and variance estimation in propensity-score matched analyses. Int. J. Biostat. 2009, 5, 13. [Google Scholar] [CrossRef] [PubMed]
- Siegel, A.F.; Wagner, M.R. Chapter 9—Confidence Intervals: Admitting That Estimates Are Not Exact. In Practical Business Statistics, 8th ed.; Siegel, A.F., Wagner, M.R., Eds.; Academic Press: Cambridge, MA, USA, 2022; pp. 237–266. [Google Scholar]
- Brooks, J.L.; Zoumpoulaki, A.; Bowman, H. Data-driven region-of-interest selection without inflating Type I error rate. Psychophysiology 2017, 54, 100–113. [Google Scholar] [CrossRef]
- Wu, X. How to Estimate Confidence Intervals of Proportions for Different Population Sizes and Sample Sizes. Stat. Inf. Forum 2005, 20, 8–10. [Google Scholar]
- Zhao, Q.; Xu, Y. Lesson 3 How to determine the sample size required for sampling research. Chin. J. Prev. Med. 2001, 35, 203–204. [Google Scholar]
- Song, K.; Xu, H. Review of State of Health and Remaining Useful Life of Power Lithium-ion Batteries. J. Jiamusi Univ. 2021, 39, 71–75. [Google Scholar]
- Yang, B.; Zhao, J.; Wu, R.; Wang, C.; Li, P.; Liu, P.; Song, J. Factors Analysis based on Electric Vehicle charging efficiency. Automob. Appl. Technol. 2017, 13, 164–165. [Google Scholar]
- Evans, J.R.; Mathur, A. The value of online surveys: A look back and a look ahead. Internet Res. 2018, 28, 854–887. [Google Scholar] [CrossRef]
Disclaimer/Publisher’s Note: The statements, opinions and data contained in all publications are solely those of the individual author(s) and contributor(s) and not of MDPI and/or the editor(s). MDPI and/or the editor(s) disclaim responsibility for any injury to people or property resulting from any ideas, methods, instructions or products referred to in the content. |
© 2025 by the authors. Licensee MDPI, Basel, Switzerland. This article is an open access article distributed under the terms and conditions of the Creative Commons Attribution (CC BY) license (https://creativecommons.org/licenses/by/4.0/).