1. Introduction
The transition toward low-carbon transportation modes is an integral component of Indonesia’s national strategy to address climate change, as outlined in the strategic agenda of the National Development Planning Agency [
1,
2]. This transition requires well-designed and specific scenarios that consider multiple interrelated aspects, including energy security, the competitiveness of electric vehicles, and transportation emissions [
3,
4,
5]. These three dimensions are interconnected, thereby necessitating a comprehensive analysis to inform effective policy formulation.
Electric vehicle (EV) sales in Indonesia experienced a remarkable increase between 2021 and 2023, with an average annual growth rate of 206.6% [
6]. However, without a parallel transition to renewable electricity sources, EV adoption may introduce new challenges. This concern is echoed in the work of Canals Casals et al. [
7], who demonstrate that the emission reduction benefits of EVs are highly dependent on the source of electricity generation. If the national grid is still dominated by fossil fuels, EV usage can produce carbon emissions comparable to—or even higher than—those of internal combustion engine (ICE) vehicles. Conversely, Atabani et al. [
8] show that fuel efficiency improvements and emission reductions can be achieved through energy-efficient vehicle technologies. Indonesia faces considerable challenges in its transition to EVs, largely due to its continued reliance on fossil fuels [
9]. Currently, renewable energy contributes only 14% to the national electricity mix. State Electricity Company (PLN) aims to increase this share to 23% by 2030 [
1,
10,
11]. However, no comprehensive study has yet examined whether EV deployment in Indonesia will bring substantial climate mitigation benefits.
Meanwhile, ICE-based transportation continues to present serious challenges, particularly regarding carbon emissions and the nation’s heavy reliance on imported petroleum fuels [
12]. To meet domestic demand, Indonesia imports a substantial volume of fossil fuels [
13], which contributes to rising national expenditure, trade balance pressures, and the weakening of foreign exchange reserves [
14].
Although various policies have been issued to promote the adoption of EVs, to date, there is a lack of research that systematically integrates the dynamics of energy mix, emission impacts, and fossil fuel dependency into a unified, data-driven transition framework. To address this gap, this study poses three core research questions: (1) What form should a transition model from ICE vehicles to EVs take in order to reflect the dynamics of energy demand and emission efficiency? (2) What percentage of EV adoption is required to eliminate Indonesia’s dependency on imported fossil fuels? (3) What is the most optimal scenario to ensure a sustainable transportation system in Indonesia?
This study has the potential to provide important implications for government policy in designing a more systematic, data-based transportation transition strategy that aligns with the country’s Net Zero Emissions (NZE) target by 2050 [
15]. From an academic standpoint, the results of this study are expected to enrich the literature on sustainability and energy transition in developing countries.
The study by Albatayneh et al. [
16] employs a well-to-wheel (WTW) approach to compare the overall energy efficiency between EV and ICE. This method is notably detailed, as it accounts for the efficiency of each stage along the energy supply chain—from fuel extraction to the final energy conversion at the vehicle’s wheels. However, the approach has certain limitations, particularly its exclusion of real-world operational conditions such as vehicle mileage, trip frequency, and usage patterns. These factors can significantly influence the cumulative energy efficiency of vehicles over time and are critical for a more accurate and context-specific assessment. To analyze such aspects, a bottom-up approach to emission inventories and transport behavior modeling may be employed. Arioli et al. [
17] suggest that the bottom-up method is more effective for designing targeted transport policies. However, this approach often faces challenges related to data availability and the high cost of large-scale information collection. Therefore, leveraging technological tools becomes essential to overcome these limitations [
18].
As an alternative, Google Environmental Insights Explorer (Google EIE) provides a bottom-up framework to efficiently estimate emissions and transportation behavior. Google EIE is a data-driven platform that integrates Google Maps and traffic sensor data to generate emissions inventories and behavioral analyses [
19]. This technology replaces traditional methods that rely heavily on manual field surveys. It has already undergone validation in the United States [
20], making it a suitable tool for this study. Currently, Google EIE has only been implemented in one Indonesian province, West Nusa Tenggara (NTB), which has therefore been selected as the case study area to assess the integration of Google EIE into low-carbon transport transition scenarios.
Since Banister [
4] introduced the sustainable transportation paradigm, understanding transport systems has required multiple perspectives beyond linear approaches. Sustainable transportation systems must consider not only mobility needs but also energy availability, environmental impacts, and economic implications. In the analysis of transport policy systems, several studies have recommended the use of System Dynamics (SD). SD is powerful in analyzing the complexity of interconnected systems [
21], allowing for the qualitative mapping of causal relationships between variables and the numerical simulation of scenarios to achieve desired indicators [
22,
23,
24]. Given that this research demands a systemic thinking framework combined with numerical simulations, the SD approach is deemed suitable for generating robust policy insights.
By integrating the SD approach with technologically derived data from Google EIE, this study aims to construct a low-carbon transport transition model that is contextually relevant for Indonesia and potentially replicable in other regions with similar characteristics. The following Section outlines the methodological framework used to develop the model.
This paper is structured as follows:
Section 2 reviews the relevant literature on EV transitions and the role of Google EIE as a data source.
Section 3 explains the methodological framework, including the System Dynamics approach and data integration.
Section 4 presents the simulation results across different policy scenarios.
Section 5 discusses the implications of the findings, and
Section 6 concludes the study with policy recommendations, identified limitations, and suggestions for future research.
2. Literature Review
Based on the Google EIE dashboard for NTB, as presented in
Table 1 and
Table 2, there was a noticeable decline in transportation emissions, reaching their lowest point in 2020. This reduction is likely attributed to mobility restrictions during the COVID-19 pandemic. Following 2020, transportation emissions began to rise again; however, the increase was primarily driven by motorcycle activity rather than car usage.
A closer look at the data reveals a fundamental insight: motorcycles account for a higher number of trips and total travel distance compared to cars, yet cars produce higher total emissions. This discrepancy underscores that four-wheeled ICE vehicles remain the dominant contributor to transportation-related carbon emissions. Therefore, transitioning these vehicles to electric alternatives has a greater potential impact on emission reduction and fossil fuel savings than focusing solely on two-wheelers. The results of the Astuti’s study [
26] showed that sales of electric motorbikes from 2029 to 2022 only reached 30,837 units, while for two-wheeled vehicles with conventional combustion systems, they had reached 29 million units.
According to Langer et al. [
27], Indonesia possesses vast renewable energy potential both on land and at sea, which, from a technical standpoint, could meet the country’s electricity demand several times over. The greatest potential lies in solar photovoltaics (PV) and offshore wind power, while geothermal energy holds a critical role as a stable baseload source. Indonesia is estimated to hold around 40% of the world’s geothermal reserves; however, by 2019, only approximately 9% had been utilized—far below the national energy roadmap (RUEN) target of 17.5 GW by 2050. The slow development of geothermal energy is attributed to complex land permitting processes, uncompetitive electricity tariffs, local opposition, and long project lead times. Overall, the deployment of renewable energy in Indonesia remains sluggish due to data limitations, inadequate regulatory frameworks, and a lack of investment. Nevertheless, if fully harnessed, this renewable potential could enable Indonesia to achieve a 100% renewable electricity system by 2050, thereby accelerating its energy transition and strengthening national energy security.
In this context, Google EIE provides a valuable emissions inventory tool by offering quantifiable and geographically disaggregated data, such as travel distance and trip frequency. These metrics are essential for transport modeling and policy formulation. Several studies support this perspective. Banister [
3] emphasized reducing trip demand as a central pillar of sustainable transportation policy. Sayyadi and Awasthi [
28] proposed an SD model that incorporates trip frequency as a key behavioral variable. Wang et al. [
29] demonstrated that transport needs are driven by factors such as population and travel demand, rather than by vehicle ownership alone. Integrating these insights into modeling frameworks can significantly enhance the policy relevance of transportation emission strategies.
3. Method
3.1. System Dynamics Approach
In this study, the System Dynamics (SD) approach was chosen as it is more suitable for analyzing low-carbon transportation systems that are aggregate, at a macro level, and oriented toward long-term policy planning. While Agent-Based Modeling (ABM) excels in capturing individual micro-level behaviors and agent interactions, SD offers superior capability in mapping systemic structures and feedback-based causal relationships, such as the interplay between energy mix, EV adoption rates, and carbon emissions. Furthermore, SD enables the exploration of policy scenarios through numerical simulation over extended time horizons, making it more appropriate for modeling the dynamics of accumulated variables such as vehicle ownership or energy demand. Given the focus of this study on data-driven scenario formulation and systemic policy impact forecasting, SD is deemed more relevant than ABM. The latter is more appropriate for exploring individual behavior and micro-level scenarios, which are not the primary focus of this research [
30].
As a computer-based simulation method, SD facilitates the modeling of systemic thinking frameworks by considering the interrelationships between various elements of a system. One of the core tools in SD is the Causal Loop Diagram (CLD), which is used to visually represent cause-and-effect relationships within a system [
23]. This diagram helps to understand how changes in one variable can influence others. CLDs consist of three key components: (1) variables, representing system elements subject to change; (2) Causal Arrows, which denote the direction of influence between variables; and (3) positive (+) and negative (−) signs, indicating whether the relationship is reinforcing or balancing.
The CLD serves as the conceptual framework for simulating the transportation transition model. In line with the study’s objectives, it is necessary to perform dynamic system behavior analysis through numerical computation and simulation [
31]. These calculations address the core research questions, such as the required EV adoption rate to eliminate Indonesia’s dependency on imported fossil fuels, and the renewable energy ratio necessary to achieve a low-carbon transportation system. For this purpose, the CLD is further developed into a Stock and Flow Diagram (SFD), which facilitates the quantification of stocks and flows within the system and produces more accurate simulation outputs.
The analysis is based on a combination of official government data and transportation data from Google EIE for NTB, which are dynamically processed through the SFD model. The SFD enables the development of multiple policy scenarios, allowing the transition strategy to be managed in a more flexible and adaptive manner. Three scenarios are explored: (1) Business as Usual (BAU), representing a trajectory with no significant policy intervention; (2) the Moderate Scenario, a realistic scenario with limited policy intervention and implementation constraints; and (3) the Optimistic Scenario, which assumes maximum policy interventions leading to significant environmental and economic impacts.
The detailed research process is illustrated in
Figure 1. The study began with the collection of both primary and secondary data. These datasets were processed and validated to identify the most relevant variables for constructing the CLD. The CLD was further developed into simulation scenarios using SFD. The simulation results were then analyzed to address the research questions and to formulate corresponding policy recommendations and conclusions.
3.2. Scope and Limitation
In designing the Causal Loop Diagram (CLD), it is essential to define the system boundaries to ensure that the model remains focused, avoids excessive complexity, and stays aligned with the research objectives. The core focus of this analysis is the transition from ICE vehicles to EVs, taking into account national energy security and the carbon emission reduction resulting from future transportation growth. Therefore, variables that do not have a significant impact on the study’s focus are excluded. The system boundary setting follows the method proposed by Bureš [
32], which includes the following: (1) Endogenization, or the elimination of exogenous variables that do not directly contribute to the system’s internal behavior; (2) Encapsulation, the merging of variables that serve only as single-input/single-output intermediaries, to simplify the model structure; and (3) Order-Oriented Reduction, the removal of connector variables that lack systemic relevance, such as public perception or communal awareness of environmentally friendly vehicles.
This study adopts the perspective of policymakers—particularly at the national and subnational levels. From a policy standpoint, the analysis presented in this research is intended to support institutions such as Bappenas (the National Development Planning Agency), the Ministry of Transportation, the Ministry of Energy, and the Provincial Government of West Nusa Tenggara in developing more effective low-carbon transportation transition strategies.
However, a notable limitation of this study lies in the geographical scope of data availability. The analysis utilizes data from Google EIE, which, at the time of this research, only provides comprehensive transportation-related emissions data for NTB Province. As a result, the System Dynamics modeling and policy implications are derived from the context of this province alone. Nevertheless, NTB is considered a reasonably representative case due to its composition of two medium-sized islands—Lombok and Sumbawa—a geographical structure shared by 24 out of 36 provinces in Indonesia. Given that Indonesia is the world’s largest archipelagic nation, with over 922 inhabited islands, insights drawn from NTB offer valuable indications for broader applicability. Still, further research is needed to validate and adapt the model for provinces with markedly different geographic, economic, or infrastructural characteristics.
3.3. Model Variable Identification and Data Integration
The variables and parameters used in this study were derived from a review of the credible journal literature that discusses transportation system modeling through an SD approach. These variables were then integrated with those provided by Google EIE, which serves as the primary data source for transportation-related emissions in NTB. Studies by Onat et al. and Sayyadi [
28,
33] propose four main categories of variables that influence the adoption of EVs: (1) transportation aspects, (2) economic aspects, (3) environmental aspects, and (4) social aspects. All relevant variables across these four categories were summarized alongside available supporting data.
The transportation aspect includes a set of variables representing the transportation system [
28]. Population growth is the primary driver of increased travel demand, which, in turn, leads to greater use of transportation modes—both ICE- and EV-based. These two modes of transport consume fuel (gasoline or diesel) and electricity, respectively, based on travel distance. ICE vehicles produce direct emissions from internal combustion, while EVs generate indirect emissions from electricity production.
In identifying economic aspects, studies have highlighted a strong correlation between economic growth and transport mobility [
34]. Increased mobility enhances productivity and stimulates economic growth, and vice versa [
35]. From the perspective of externalities, previous studies have emphasized the long-term socioeconomic consequences of global warming [
36,
37]. There is a negative correlation between climate change and investment, employment availability, and overall well-being. Simulations by Masters and McMillan [
38] also suggest that tropical countries face higher risks of slow economic growth compared to subtropical regions.
The urgency to adopt EVs is largely driven by the need to reduce transportation-related emissions, which pose significant environmental and social challenges. Lelieveld et al. [
39] provide compelling evidence that phasing out fossil fuel use could prevent approximately 3.6 million (range: 2.96–4.21 million) premature deaths annually due to outdoor air pollution. Globally, fossil fuel-related emissions are responsible for around 65% of these excess deaths. James Woodcock [
40] also argues that reducing motor vehicle use—especially through increased walking and cycling—provides substantial public health benefits. Thus, there is a direct relationship between transport-related externalities and public health.
3.4. EV Transition Simulation Design
To sharpen the formulation of the research questions, this study incorporates findings from previous transportation transition studies conducted in Indonesia. Lonan and Ardi [
41] provide projections for feasible EV adoption rates within specific timeframes. Their study suggests that EV adoption can increase significantly if the government implements proper incentives, such as vehicle purchase subsidies, tax reductions, and the development of widespread charging infrastructure. In the most ambitious scenario, EVs are projected to replace up to 60% of ICE vehicles by 2040. This growth could be achieved if EV prices are reduced by 50%, domestic production capacity is expanded, and the charging station network develops faster than EV ownership itself. For this reason, the simulation in this study adopts an exploratory approach and does not consider the policy feasibility constraints when establishing the baseline.
The simulation assumes substantial growth in EV adoption based on the data presented by Ardiyanti et al. [
6]. According to the Indonesian National Police Traffic Corps (Korlantas) in 2023, the number of registered four-wheeled vehicles in Indonesia reached 20.1 million units [
42]. Over the past decade, annual vehicle sales in Indonesia have stagnated at around 1 million units [
43], suggesting that recent EV sales may have started substituting for ICE vehicle sales over the last five years.
Indonesia has considerable potential to expand renewable energy (RE) as a primary source for electricity generation. Government Regulation No. 79 of 2014 on the National Energy Policy set a target for RE to contribute at least 23% of the national energy mix by 2025 and 31% by 2050 [
44]. Indonesia’s estimated RE potential reaches 442 gigawatts (GW), yet by 2018, only 8.8 GW had been installed—approximately 14% of the national capacity of 64.5 GW. This indicates significant room for growth in RE deployment.
Conversely, the production of primary energy sources such as natural gas, petroleum, and coal has shown a declining trend in recent years. Meanwhile, the contribution of RE to the primary energy mix has steadily increased—from just 4.9% in 2015 to 12.16% in 2021. On the consumption side, between 2019 and 2023, Indonesia’s per capita electricity consumption increased by 23.3% [
13]. The average annual growth rate of per capita electricity consumption over the last five years (2019–2023) has been approximately 5.38%.
The emission factor for coal combustion follows the IPCC guidelines [
45], set at 0.0003406 tCO
2/KWh. According to technical estimates from Li et al. [
46], the average energy consumption required for an EV to travel one kilometer is approximately 0.33 KWh/km. This value reflects the typical energy efficiency under normal operating conditions and serves as a baseline for estimating EV electricity demand in energy planning, transportation system simulation, and emission analysis based on electricity mix scenarios.
All variables, parameters, and Indonesian-specific data summarized in
Table 3 and
Table 4 are compiled to construct the CLD, which maps the causal relationships among the relevant subsystems.
3.5. Data Acquisition and Validation
This study utilized three primary data sources collected during the 2022–2023 period to develop a sustainable transportation system model. The first source is travel and emissions inventory data from Google EIE, which served as the foundation for the transportation analysis. The second source consists of secondary data obtained from the Central Statistics Agency (BPS), government ministry reports, the academic literature, and previous research studies to ensure the model’s validity and reliability. The model structure was developed using Vensim PLE Version 10.1.3 software, which was employed to construct both the CLD and the SFD.
The validation process followed two approaches: (1) Structure Verification, in which the model structure was compared with insights from the existing literature and expert knowledge, and (2) a Behavior Reproduction Test, where the simulation output of the Business-as-Usual (BAU) Scenario was matched against historical energy consumption trends in NTB Province.
To build the CLD structure, expert interviews were conducted as part of a Participatory Dynamic Modeling approach [
51,
52], involving purposively selected experts [
53]. These experts were chosen based on their domain expertise in transportation, urban planning, sustainable development, and energy security. Three experts were interviewed to assess the reliability of the model: one academic who also serves as the head of an SDGs Center, a member of the National Energy Council, and a prominent transportation expert who is well known in the media. These in-person interviews provided valuable feedback that helped confirm and enrich the model structure with expert insights.
Several limitations were acknowledged in this study: (1) The research did not incorporate qualitative data into the simulation framework, and therefore could not capture the social dynamics influencing EV adoption. (2) The model structure excludes public transportation systems, as this study specifically focuses on EV transition dynamics related to energy security, fiscal impact, and emissions. However, the inclusion of public transport aspects is recommended for future research. (3) A key limitation of the SD approach applied in this study is its inability to account for detailed individual behavioral dynamics, spatial effects, and user preferences toward EVs. As such, the simulation results should not be interpreted as precise forecasts, but rather as exploratory scenarios to support evidence-based policy design for transportation transition.
3.6. Google Environmental Insight Explorer
Arioli et al., in The Evolution of City-Scale GHG Emissions Inventory Methods: A Systematic Review [
17], highlight the primary challenges in city-level transportation emissions inventorying, particularly in the implementation of the bottom-up approach. While the bottom-up method is recognized as more accurate than the top-down approach, their study identifies significant barriers to its implementation, including data limitations, high costs, and a lack of standardization in transport data collection systems. In many cities, especially in developing countries, crucial transportation activity data such as Vehicle Kilometers Traveled (VKT), travel patterns, and fuel consumption remain poorly documented, making the bottom-up approach difficult to apply on a broader scale.
This study aims to refine the bottom-up approach by integrating real-time data-driven technology through Google EIE. By addressing the limitations identified in previous research, this study contributes not only to the enhancement of more efficient policy development but also to the advancement of the bottom-up methodology as previously discussed by Arioli et al. Google EIE has advantages over government methods in transportation emissions inventorying [
19]. As shown in
Figure 2, Google EIE is able to detect emissions based on transportation mode type, while government methods still rely on calculating the total energy consumption of the transportation sector.
The Jakarta Environmental Agency document [
54] states that transportation emissions are calculated as part of total energy consumption.
Figure 3 illustrates the inventory method of the above needs which results in a lack of granularity in the data. With this approach, it is difficult to know the specific contribution of two-wheeled and four-wheeled vehicles to total emissions, in contrast to Google EIE which is able to present emission data in more detail.
Based on
Table 5, Google EIE is considered more accurate in describing the details of motor vehicle emissions, so it needs to be further tested as to whether its use can provide new insights into sustainable transportation systems. The emissions trend presented by Google EIE closely aligns with the emissions data recorded by BPS (Statistics Indonesia) for West Nusa Tenggara Province, as shown in
Table 6. However, in 2020, the BPS data indicates a sudden spike—more than double the previous year’s emissions. The underlying cause of this anomaly remains unclear, especially considering that Indonesia was under social mobility restrictions due to the COVID-19 pandemic during that period.
4. Transition Model
4.1. Causal Loop Diagram of Transportation Transition
The CLD sequence begins with the Transportation Driver Subsystem, as illustrated in
Figure 4. Population and economic growth serve as the primary drivers of increased travel demand. Gross Domestic Product (GDP) and the number of trips are linked through a reinforcing feedback loop, as a higher volume of travel also contributes positively to economic activity. The number of trips influences the total travel distance across transportation modes. This travel distance is further affected by the average distance per trip.
Several factors can influence the average travel distance—such as land use patterns, the availability of public transportation, and geographical conditions. However, these factors were not included in the model, as they are not directly relevant to the central focus of this study.
The Transportation Driver CLD is then connected to the EV subsystem. Total travel distance is converted into EV-specific travel distance, which is derived from the number of EV trips and the average distance per trip. The number of EV trips is influenced by the EV adoption rate. This adoption rate is, in turn, affected by various factors such as government policies, pricing, reliability, public perception, and others. These factors are simplified in this model as they are not the primary focus of the study. The total EV travel distance drives electricity consumption, thereby increasing electricity demand.
Electricity demand simultaneously reduces electricity supply and stimulates electricity production. Electricity production is sourced from both fossil fuels and RE, with each contributing to the overall electricity supply. However, non-renewable electricity generation increases coal usage. When multiplied by the carbon emission coefficient, coal combustion results in increased carbon emissions, which subsequently contributes to greenhouse gas (GHG) accumulation. The rise in GHG levels leads to climate change, which in turn may trigger negative economic consequences. This overall feedback loop forms a balancing loop, aiming to stabilize the system.
Figure 5 below illustrates how the share of RE in the electricity mix plays a critical role in minimizing the externalities of EV usage. The use of fossil fuels for electricity production creates a chain of externalities that impact both environmental and economic dynamics. Nevertheless, despite the adverse emissions associated with fossil fuels, coal reserves in Indonesia remain abundant.
The Transportation Driver CLD is also connected to the ICE subsystem, as illustrated in
Figure 6. The ICE subsystem features a more complex structure compared to the EV subsystem. Travel distance is converted into ICE-specific distance traveled, calculated based on the number of ICE trips and the average distance per trip. This ICE travel distance drives fuel consumption, which in turn increases fuel demand.
Rising fuel demand reduces the available fuel supply while simultaneously stimulating domestic fossil fuel production, encouraging biofuel development, and increasing fuel import expenditures. Imports continue to dominate the national fuel supply, thereby requiring sustained government budget allocations and placing pressure on fiscal resources. This situation can reduce the availability of funds for other, more productive sectors. Conversely, if fuel import spending could be eliminated, the reallocated funds could potentially be used to stimulate broader economic activity.
Unlike EVs, ICE vehicle usage results in not only carbon emissions but also direct and localized air pollution. These emissions can have social implications, particularly in terms of public health. Empirical evidence shows that vehicle-related air pollution negatively affects community health. In Indonesia, the government provides public healthcare subsidies, which means that declining public health conditions lead to increased healthcare spending. This increase in health-related expenditures reduces the government’s ability to allocate funding toward programs that promote economic growth.
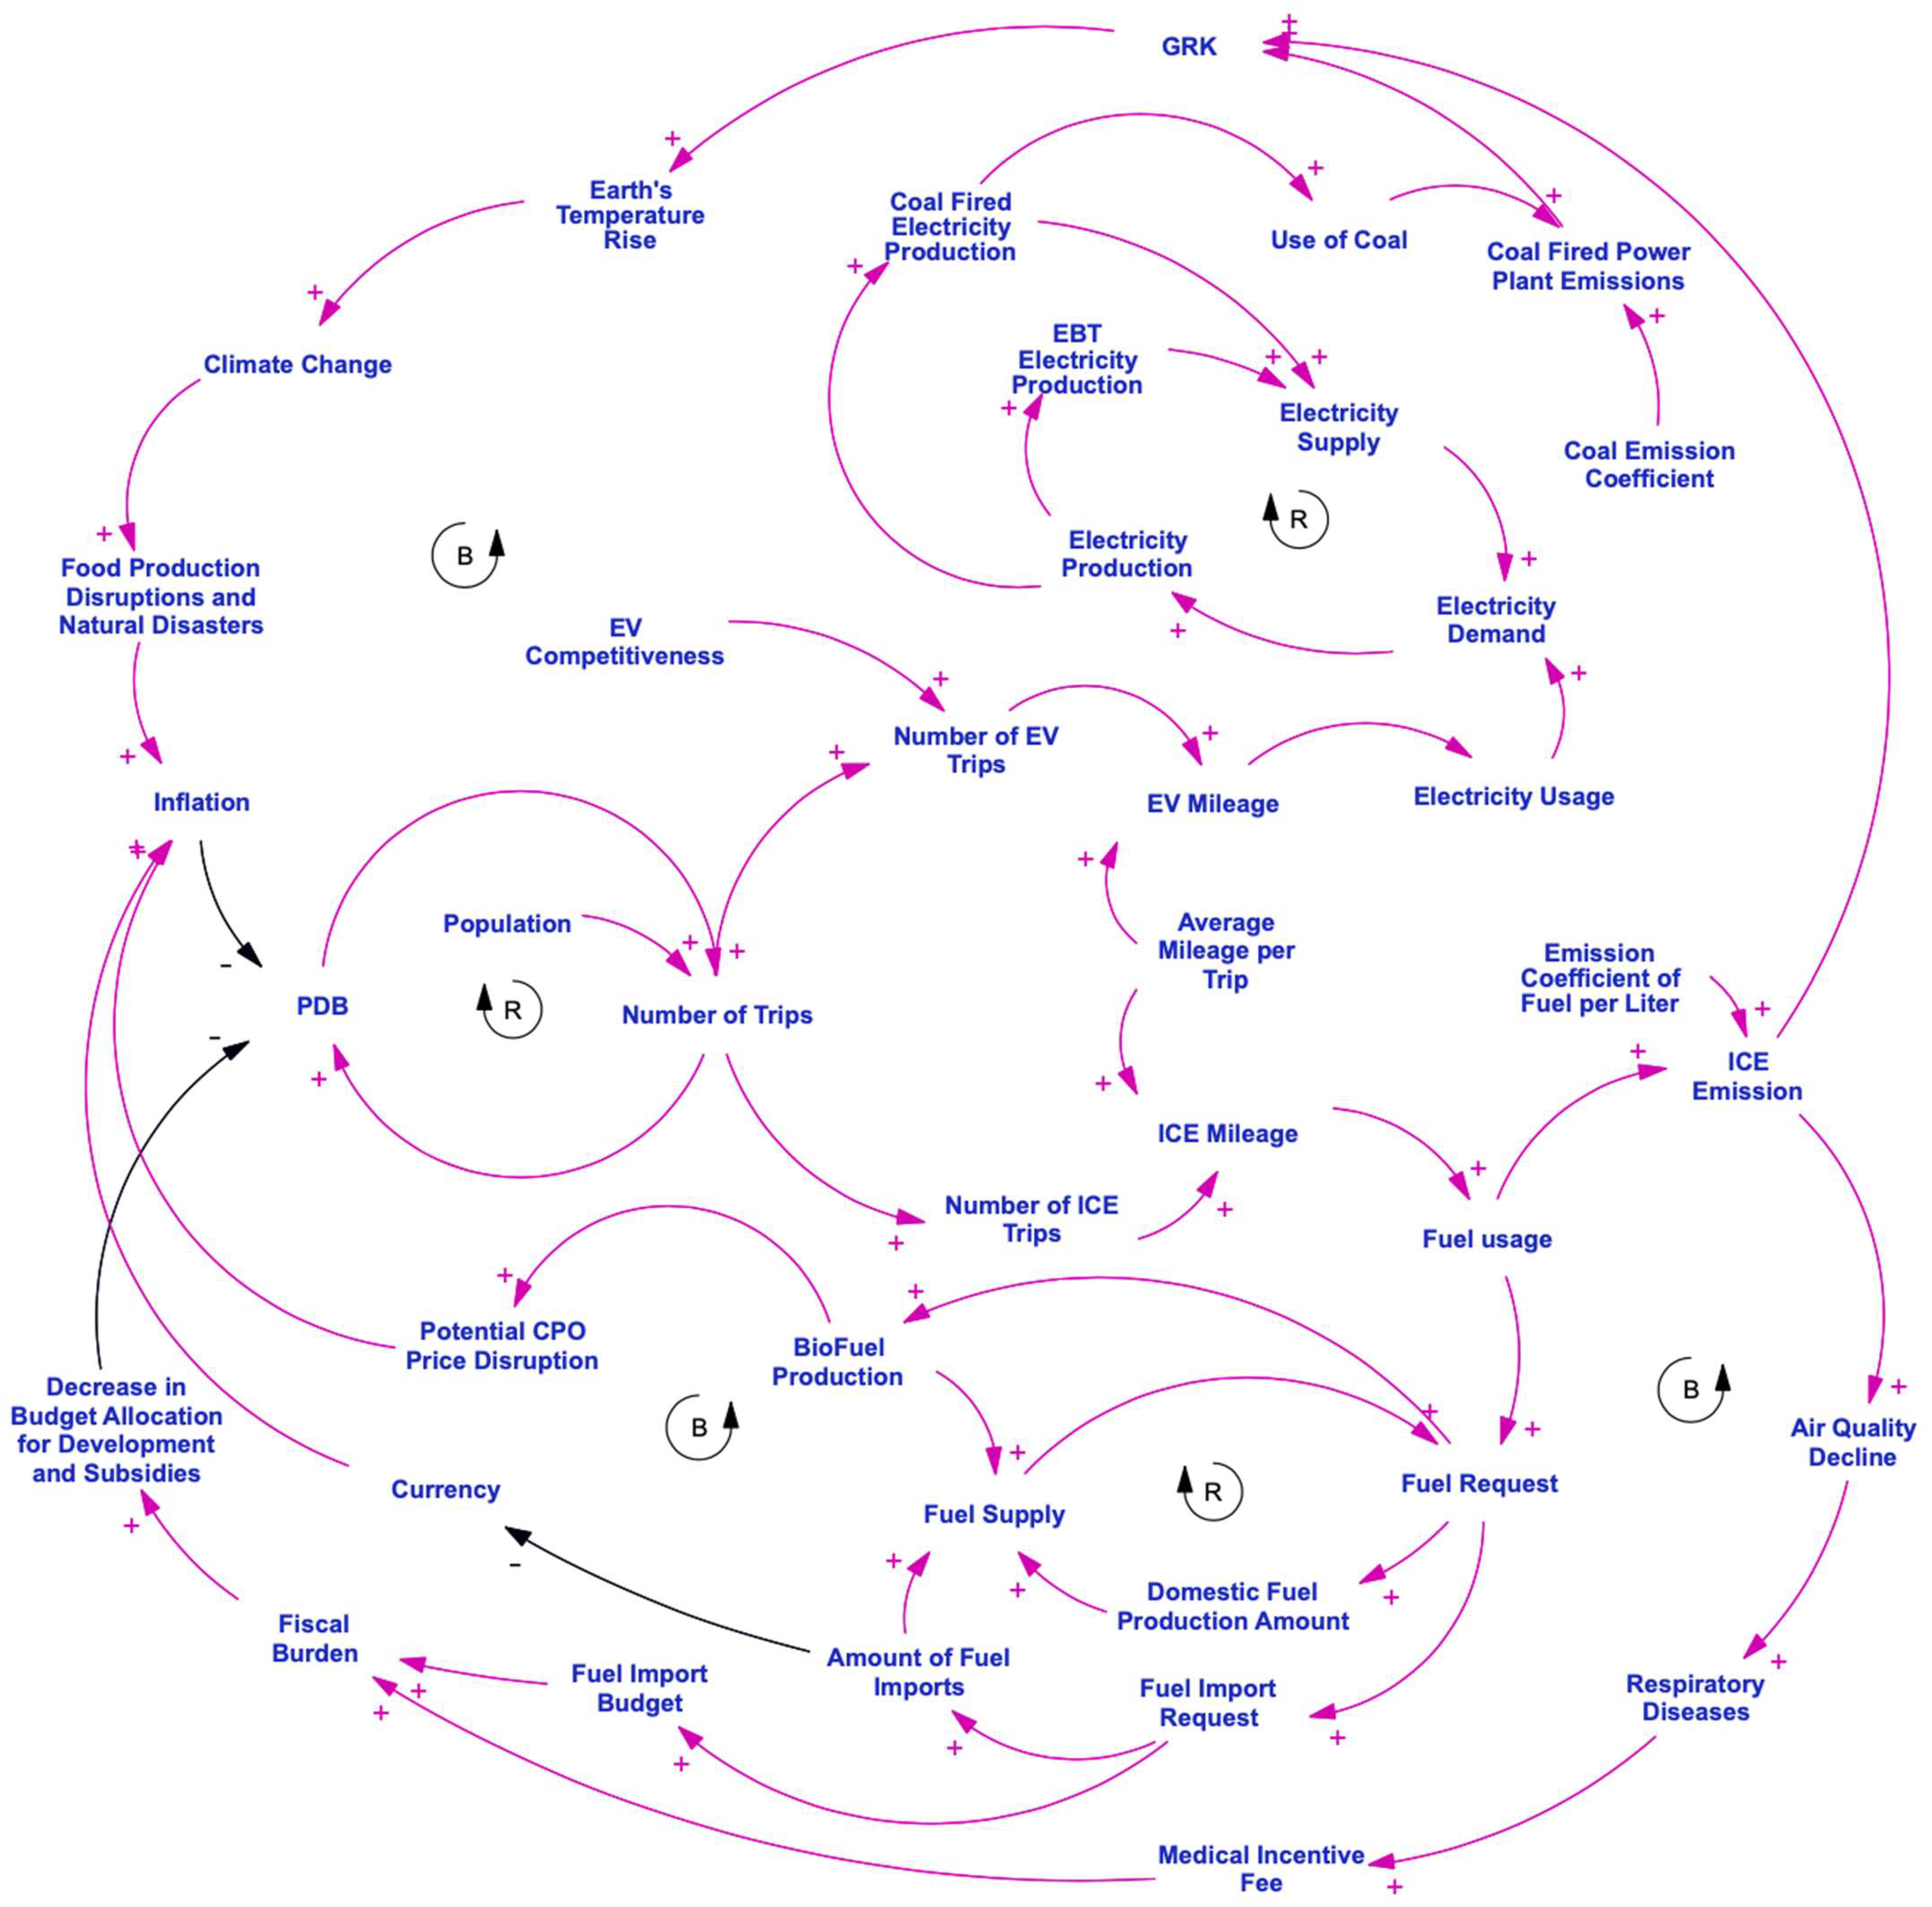
The three CLDs were then integrated into a unified transition model illustrating the shift from ICE-based to EV-based transportation. As shown in
Figure 7, both ICE and EV systems contribute to GHG emissions, but through different mechanisms. The ICE subsystem has a more direct emission pathway, as combustion occurs within the vehicle itself. In contrast, EV emissions originate indirectly from the combustion of fossil fuels used in electricity generation.
The fuel supply chain for ICE vehicles is more complex and involves higher externalities compared to EVs. Indonesia’s limited petroleum reserves necessitate reliance on imported fuel and the use of palm oil blends in fuel mixtures. Both sources carry potential negative implications if not managed carefully.
4.2. Stock and Flow Diagram: EV Adoption to Eliminate Fuel Imports
Following the development of the CLD for the sustainable transportation system, the analysis proceeded by establishing a baseline for fuel savings using an SFD. This stage aimed to quantify the parameters required for reducing the national dependence on imported fossil fuels.
Relevant variables were integrated into the SFD framework to derive quantitative estimates. The projection of EV and ICE vehicle shares was modeled up to 2050, ensuring that the total projected vehicle growth did not exceed the historical trends observed over the past five years. While EV adoption is expected to follow an exponential trajectory, this growth is constrained by eventual market saturation. As EVs gain market shares, the proportion of ICE vehicles is projected to decline. Notably, this shift in market composition does not affect the overall number of vehicles on the road. The decline in ICE vehicles leads to a reduction in ICE-related travel distance, which is offset by a corresponding increase in EV usage. Consequently, reliance on imported fuel gradually decreases. Fuel import elimination is projected to occur once ICE vehicle travel falls by approximately 42% from current levels—a milestone expected around 2040, which coincides with the saturation point of EV market growth.
4.3. Stock and Flow Diagram of Energy Mix Dynamics, Fuel Imports, and EV Adoption
Upon establishing the baseline scenario for eliminating fuel imports, the sustainable transport framework was expanded to incorporate environmental impact considerations.
Figure 8 illustrates the EV transition simulation, emphasizing improvements in environmental quality and fuel efficiency. To ensure the robustness of the projected outcomes, model validation was conducted by comparing the simulated fossil-fuel-based electricity production growth against actual historical trends. As presented in
Table 7, the projection accuracy falls within a 10–11% margin, aligning with Indonesia’s electricity production growth over the past decade. This alignment indicates that the SFD model in
Figure 8 adequately represents the real-world conditions.
Several scenarios were then explored to identify the most optimal and sustainable pathway, as visualized in
Figure 9. As shown in
Table 8, the first scenario—the Business-as-Usual (BAU) Scenario—reflects current trends in EV adoption, fossil-fuel-based electricity generation, RE development, and other contextual variables in NTB. Under this scenario, the coal-based electricity supply is projected to grow by 10–20% annually, while renewable sources expand by 15–20% annually. Electricity consumption is expected to rise by 6.6% per year, with additional demand from EVs ranging from 5% to 75%. Simulation results suggest that electricity supply shortages could begin as early as 2028, with the gap widening over time.
The second scenario—the Moderate Scenario—is designed to mitigate the projected deficits of the BAU Scenario while also advancing fossil fuel reduction goals. EV penetration is limited to a range of 4–64% to provide flexibility in managing the electricity supply. The energy mix targets an annual growth of 15–32%, while coal-based generation is increased by 10–40% to ensure grid stability.
The Optimistic Scenario aims to fully eliminate fossil fuel imports. EV ownership grows at rates similar to those of BAU (5–75%), resulting in a substantial surge in electricity demand. To meet this demand, fossil-fuel-based electricity production must increase by 15–45%, while RE generation is maximized between 30 and 65%. Under this scenario, fossil fuel import dependency—and the associated fiscal burden—can be entirely eliminated.
5. Discussion
The simulation results from the SD model reveal contrasting implications across the three scenarios of EV transition in Indonesia. As seen in
Table 9, the BAU Scenario, while achieving up to 56% fuel savings, leads to cumulative emissions exceeding 41 million tCO
2e by 2050. This scenario is ultimately unsustainable due to severe deficits in electricity supply, indicating that without significant upgrades to the power sector, the benefits of fuel efficiency will be offset by energy shortages. In comparison, the Moderate Scenario provides a more balanced trajectory, reducing fossil fuel consumption by up to 25% and potentially lowering fuel imports by as much as 60%. However, this scenario does not sufficiently curb the growth in emissions, which remains close to 50 million tCO
2e due to a persistent reliance on coal-based power generation, even as EV adoption progresses.
In contrast, the Optimistic Scenario presents the most ambitious outcomes. It promises to eliminate fuel imports entirely and maximize EV adoption. Yet, the scenario faces formidable obstacles, especially regarding the availability of renewable primary energy sources and the massive investments required to expand renewable infrastructure and grid capacity. As shown in
Figure 10, the number of EVs owned will reach over 10 million units. This puts additional pressure on Indonesia’s electricity system. Without a corresponding shift toward RE, such as solar or geothermal sources, EV adoption risks transferring emissions from the transport sector to the energy sector. This aligns with findings by Canals Casals et al. [
7], who argue that the environmental efficiency of EVs is highly dependent on the electricity mix.
Even though EVs contribute to fuel savings and enhanced energy security, they cannot be viewed as a standalone solution to decarbonization. To ensure that EV adoption leads to meaningful environmental outcomes, it must be accompanied by substantial growth in RE capacity. For example, the Optimistic Scenario requires RE growth of 30% to 65% annually—an ambitious target that demands both policy support and capital investment. The economic implications of reduced fuel imports are also significant. If Indonesia were able to cut imports by 25%, or 170 million barrels (
Figure 11), the estimated savings would reach USD 13.6 billion, based on an average crude oil price of USD 80 per barrel [
13,
55]. This figure rivals the national health budget allocation in the 2023 State Budget and could instead be redirected to fund up to 2.47 GW of geothermal capacity or 13.6 GW of solar photovoltaic capacity, enhancing Indonesia’s long-term energy resilience [
56,
57,
58].
Among the three scenarios, the Moderate Scenario emerges as the most pragmatic. While it does not aim for full electrification, its more gradual approach allows for manageable investment levels while still delivering substantial reductions in fuel dependency and emissions. It supports annual RE growth between 15% and 32%, striking a feasible balance between ambition and affordability. These findings support the conclusions of Onat et al. [
33], who emphasize that the integration of EV deployment with renewable energy development offers the most reliable path to achieving net-zero emissions targets.
Ultimately, the success of Indonesia’s EV transition depends on cross-sectoral integration and systemic reform. Fiscal measures such as EV subsidies and tax incentives must be aligned with energy policies that promote renewable development and with transportation regulations that accelerate the phase-out of internal combustion engines. As also noted by Santos-Paulino and Thirlwall [
14], policy coherence is critical to maintaining macroeconomic stability during major structural shifts. Without this alignment, the transition risks becoming a false solution—one that simply shifts emissions rather than eliminating them. Therefore, a coordinated, multi-level governance strategy is essential to ensure that EV adoption contributes meaningfully to Indonesia’s sustainability goals.
6. Conclusions
This study demonstrates that EV adoption in Indonesia has a significant impact on reducing dependence on imported fossil fuels and lowering emissions from petroleum-based fuels. However, this shift does not automatically translate into a net reduction in carbon emissions. The continued reliance on coal-fired electricity to power EVs remains a major barrier to emission reductions. Using an SD approach and data from Google EIE, the simulation model developed in this study successfully maps the complex interrelationships among vehicle growth, energy demand, and carbon emission dynamics. The findings reveal that fuel import elimination can be achieved once ICE vehicle travel is reduced by approximately 42%, around 2040 under the Optimistic Scenario. However, achieving this scenario requires complex trade-offs, including large-scale electricity production investments that may pose fiscal sustainability challenges.
Under the BAU Scenario, NTB is projected to face prolonged electricity supply deficits due to increased EV penetration, should there be a failure to expand power generation capacity—either from conventional or renewable sources. Therefore, it is crucial for the government to adopt a more balanced Moderate Scenario, supported by systemic and cross-sectoral policy interventions, as shown at
Table 10. Local governments may gradually increase fuel taxes on ICE vehicles while offering tax incentives to encourage the adoption of EVs. Effective implementation requires cross-institutional coordination among national agencies—such as the Ministry of Energy, the Ministry of Finance, and the Ministry of Transportation—to synchronize regulatory frameworks, subsidy schemes, and investment roadmaps. A coordinated multi-stakeholder approach, supported by institutional capacity-building and transparent monitoring systems, is essential to ensure that policy actions are not fragmented and that the intended climate and energy security outcomes are achieved. Without these enabling conditions, the policy targets envisioned in the Moderate Scenario may prove difficult to implement. Meanwhile, the state-owned electricity company (PLN) must continue to advance its renewable energy development roadmap while also considering the need to expand fossil-fuel-based electricity generation to ensure grid stability.
The proposed cross-agency policy integration is feasible, given Indonesia’s abundant renewable energy resources, particularly geothermal and solar power [
59]. Furthermore, the country’s consistent economic growth and stable fiscal condition over the past decade enhance the practical viability of the Moderate Scenario [
58]. In implementation, the government could develop a transportation roadmap aligned with sustainable development principles, particularly those outlined in the SDGs framework under Presidential Regulation No. 59/2017 [
60].
Looking ahead, future research could be enhanced by integrating Agent-Based Modeling (ABM) to capture micro-level behavioral dynamics of vehicle users, as well as spatial data analysis to examine regional disparities in impact. Moreover, incorporating variables related to public transport usage and social dimensions—such as consumer preferences, technology gaps, and energy justice—would enrich the policy analysis of sustainable transportation transitions in Indonesia.
However, one of the main limitations of this study lies in the scope of available data. The analysis relies exclusively on data from Google EIE, which, at present, is only available for NTB Province. This geographic limitation constrains the generalizability of the findings across Indonesia’s diverse regional contexts. Nevertheless, NTB serves as a relevant case study due to its archipelagic nature and medium island size—characteristics shared by many other Indonesian provinces. To overcome this constraint, this study advocates for other local governments in Indonesia to actively collaborate with Google EIE to enable wider access to strategic transportation and emissions data. Expanding such collaborations would not only support more comprehensive policy analyses at the national level but also help standardize data-driven planning for low-carbon transportation transitions.
Furthermore, the methodological framework and findings of this study may serve as a reference for other island nations or archipelagic regions that share similar conditions—namely, fragmented geography, abundant RE potential, and emerging plans to adopt EVs. With improved data coverage and tailored policy modeling, future research can play a crucial role in guiding sustainable mobility strategies in such contexts.


