Article

Multidimensional Evaluation Model for Sustainable and Smart Urban Mobility in Global South Cities: A Citizen-Centred Comprehensive Framework

by
Diana Angarita-Lozano
1,*,
Darío Hidalgo-Guerrero
2,
Sonia Díaz-Márquez
1,
María Morales-Puentes
3 and
Miguel Angel Mendoza-Moreno
1
1
Faculty of Engineering, Universidad Pedagógica y Tecnológica de Colombia, Tunja 150003, Colombia
2
Faculty of Engineering, Pontificia Universidad Javeriana, Bogotá 110311, Colombia
3
Faculty of Science, Universidad Pedagógica y Tecnológica de Colombia, Tunja 150003, Colombia
*
Author to whom correspondence should be addressed.
Sustainability 2025, 17(10), 4684; https://doi.org/10.3390/su17104684
Submission received: 7 March 2025 / Revised: 23 April 2025 / Accepted: 5 May 2025 / Published: 20 May 2025
(This article belongs to the Section Sustainable Transportation)

Abstract

:
Dealing with the challenge of urban sustainability, especially after the COVID-19 pandemic, requires a holistic approach to urban mobility planning. While numerous mobility assessment frameworks exist for developed regions, there remains a significant gap in methodologies adapted to Global South contexts because they do not incorporate governance dimensions and citizen perspectives. This research addresses this gap by developing and validating a comprehensive assessment framework that extends beyond the traditional sustainability triad to include governance aspects. Our research question explores how a hybrid evaluation approach combining objective measurements with subjective citizen perceptions can enhance mobility assessments in resource-constrained environments. The proposed model comprises four dimensions (environmental, social, economic, and governance), eight sub-dimensions, and thirty-six indicators, with weights assigned through the Analytic Hierarchy Process (AHP) by diverse mobility experts. The methodology was validated in two intermediate Colombian cities, demonstrating its applicability in contexts with limited availability of data. The results highlight gaps in mobility policies due to discrepancies between official measurements and citizen perceptions. This assessment framework offers a practical instrument for urban mobility decision-makers in Global South cities, enabling evidence-based prioritization while ensuring that citizen needs remain central to sustainable transportation planning.

1. Introduction

Sustainability has been identified as a strategy to promote development based on the human–nature interrelation under the three pillars of social inclusion, economic growth, and environmental balance. A fourth pillar to achieve sustainability is adequate governance that allows informed citizens to participate in decision-making [1].
The growing interest in searching for sustainability in cities has created the necessity of involving evaluation parameters that allow tracking and monitoring within the framework of the Sustainable Development Goals [2]. The expectation is to advance in inclusive, safe, resilient, and sustainable territories [3].
Urban mobility is a structural axis of the city, and in its evaluation models, it also considers the pillars of sustainability [4,5]. However, they must include actions and policies that promote sustainable mobility [6] and spaces where citizens can foster appropriate, solid, and sustainable strategies [7]. However, a significant gap is evidenced between the theory and practice of sustainable mobility [8]; thus, reducing this distance in city planning is a priority [9].
In parallel with evaluating mobility from a sustainable approach, the smart approach is also considered an instrument for managing current urban dynamics [4,10]. Based on a conceptual level, the concept of smart mobility has been made [11,12,13,14,15], and various definitions of sustainable mobility have been proposed [6,7,8,9,10,16,17,18,19,20,21,22,23,24]. Although no agreement exists to establish a unique concept, arguments have been raised that seek to harmonize the two paradigms (sustainability and intelligence). Smart and sustainable urban mobility can be considered connectivity in cities characterized as affordable, effective, attractive, and sustainable, including a multidisciplinary approach to enrich its perspective [25].
The measurement of the sustainability of urban mobility is supplied with indicators and/or indexes [26], in an increasing number, which provide relevant information to establish priorities, plan investments, propose policies by local authorities [23], and conduct the evolution of the cities and their transportation systems looking for better efficiency [10,27]. In the same way, smart mobility indicators have gained strength in recent research, but they depend on the author who has formulated them [28], and sustainability is lacking.
Despite the growing interest in sustainable mobility assessment, existing frameworks present the following limitations when applied to Global South contexts: (1) they often lack governance dimensions critical for implementation in developing regions; (2) they rarely incorporate citizen perceptions alongside objective measurements; and (3) they frequently require data inputs unavailable in resource-constrained environments.
This research addresses these limitations by answering the following questions: (1) How can a hybrid assessment framework incorporating objective measurements and subjective perceptions enhance urban mobility evaluation in Global South cities? (2) To what extent does incorporating a governance dimension along with traditional sustainability pillars improve the contextual relevance of mobility assessment? (3) What methodological adaptations are needed to make the mobility assessment frameworks functional in data-constrained environments typical of developing regions?
We hypothesize that a citizen-centred approach that incorporates perception metrics will reveal implementation gaps not captured by objective indicators alone, and governance indicators will emerge as critical factors in the overall assessment of sustainable mobility in Global South contexts.
Due to the pandemic, adopting sustainable and smart mobility in cities is an urgent challenge. COVID-19 has modified the sense of place, and new vulnerabilities have been identified. Considering the previous statement, territory, distance, time, space, and social relations must be rethought [29]. Additionally, the need to transform people’s lifestyles based on the risk to health and the population’s life is evident, especially in urban areas [30], to encourage changes in city planning and mobility, considering that some activities are performed remotely rather than in person.
Another factor that promotes smart and sustainable mobility is the regulatory framework, which seeks to satisfy people’s needs for mobility through mobility plans, improve environmental conditions, and improve quality of life [31]. It is crucial to prioritize non-motorized transport and energetic public transport with low- or zero-emission technologies [32].
In this context, an opportunity to contribute to urban mobility management instruments, considering the new paradigms, is identified. As a result, an evaluation model proposal about smart and sustainable mobility focused on the citizen is presented.
The proposal model comprises four dimensions (environmental, social, economic, and governance), eight sub-dimensions (global environment, environmental quality, livability, gender perspective, operational performance, security, participatory and inclusive planning, and smart mobility), and thirty-six indicators.
This model is evaluated based on citizen perception and the performance results or measurements of the city. The values are weighted according to weights assigned by academic and professional experts. The findings determine the level of maturity of sustainable and smart urban mobility. This instrument will allow cities to trace the evaluation of their mobility over time, and it will be a valuable input in planning, management, decision-making, and monitoring.
In this article, Section 2 outlines the methodology and procedures used to consolidate the proposed model, including findings from the literature review. Section 3 presents the proposed model and discusses the results of prioritizing the model components and their weights based on the selected AHP multi-criteria method. Additionally, a case study illustrates the model validation process. Section 4 highlights the main findings from the evaluation conducted through a case study in two intermediate cities in Colombia. Section 5 explores the application outlook and potential generalizability of the proposed model. Finally, Section 6 addresses the discussion and conclusions.

2. Materials and Methods

The methodology implemented in this research followed a mixed-methods approach, structured in the following four sequential phases: (1) literature review and gap identification, (2) framework development, (3) expert validation and prioritization using multi-criteria decision analysis, and (4) empirical validation through case studies.
The literature review followed the principles of systematic reviews to ensure transparency and comprehensiveness. Our search strategy used the following specific inclusion criteria: (1) publications in English or Spanish between 2013 and 2023, (2) focus on sustainable and/or smart mobility indicators or assessment frameworks, (3) peer-reviewed journal articles, technical reports from recognized institutions, or doctoral theses with methodological rigour. We systematically searched the Scopus database using specific keywords defined by our research team. The initial search yielded 157 publications, which were screened using the following inclusion criteria and exclusion factors: (1) publications focusing solely on technological developments without assessment frameworks, (2) articles addressing only one specific transport mode without comprehensive evaluation, and (3) papers without clear methodological approaches. After the full-text assessment, 33 documents met our criteria for in-depth analysis.
The framework development phase utilized a modified Delphi technique to synthesize indicators from the literature and adapt them to Global South contexts. We systematically compared our proposed framework with established models, identifying governance dimensions and gaps in implementation feasibility within resource-constrained environments.
For weighting and prioritization, we employed the Analytic Hierarchy Process (AHP), a well-established MCDA technique selected for its ability to convert qualitative expert judgments into quantitative weights [33,34,35]. While AHP provides valuable insights through structured expert evaluation, we acknowledge the inherent subjectivity in this approach. To strengthen methodological rigour, we implemented a mixed-method triangulation strategy. The qualitative AHP results were complemented by quantitative analysis in the following ways:
Initially, statistical validation using consistency ratio calculations (CR < 0.1) ensured the internal coherence of expert judgments. In addition, outlier detection using standard deviation thresholds (2σ) identified and removed extreme evaluations. Finally, sensitivity analysis was performed by systematically varying individual dimension weights (±20%) and observing the effects on final rankings, which revealed robust stability in the model’s prioritization structure.
The AHP process was implemented using online software developed by Goepel [33], which generated pairwise comparison matrices and calculated consistency ratios. Expert participants (n = 18) represented diverse sectors (academia, government, consultancy, NGO) and regions (primarily Colombia, with additional participants from Chile, Mexico, the U.K., and the U.S.). Only evaluations with consistency ratios below 10% were retained for the final weight calculation, and outliers exceeding twice the standard deviation were excluded to ensure statistical robustness.
The case study validation employed mixed-method triangulation. We conducted stratified random sampling for citizen perception assessment to ensure representative participation across demographics and geographic areas. Sample sizes were calculated for a 95% confidence level and 1.5% margin of error (Tunja: N = 383; Ibagué: N = 370). Surveys used a 5-point Likert scale and were administered online and in person to ensure the inclusion of peripheral populations with limited internet access. Internal consistency was verified using McDonald’s Omega coefficient (ω = 0.92 for Tunja; ω = 0.95 for Ibagué).
We developed a custom software platform (Responsive Mobility website) [36] for objective indicator measurement to systematically collect and analyze data from official sources, city master plans, and interviews with authorities. Data were normalized on a 1–5 scale using reference values established through literature review and expert consultation. Statistical analysis employed both parametric (T-Student, ANOVA) and non-parametric tests (Mann–Whitney, Kruskal–Wallis) to determine the significance of differences between cities and dimensions (p < 0.05).

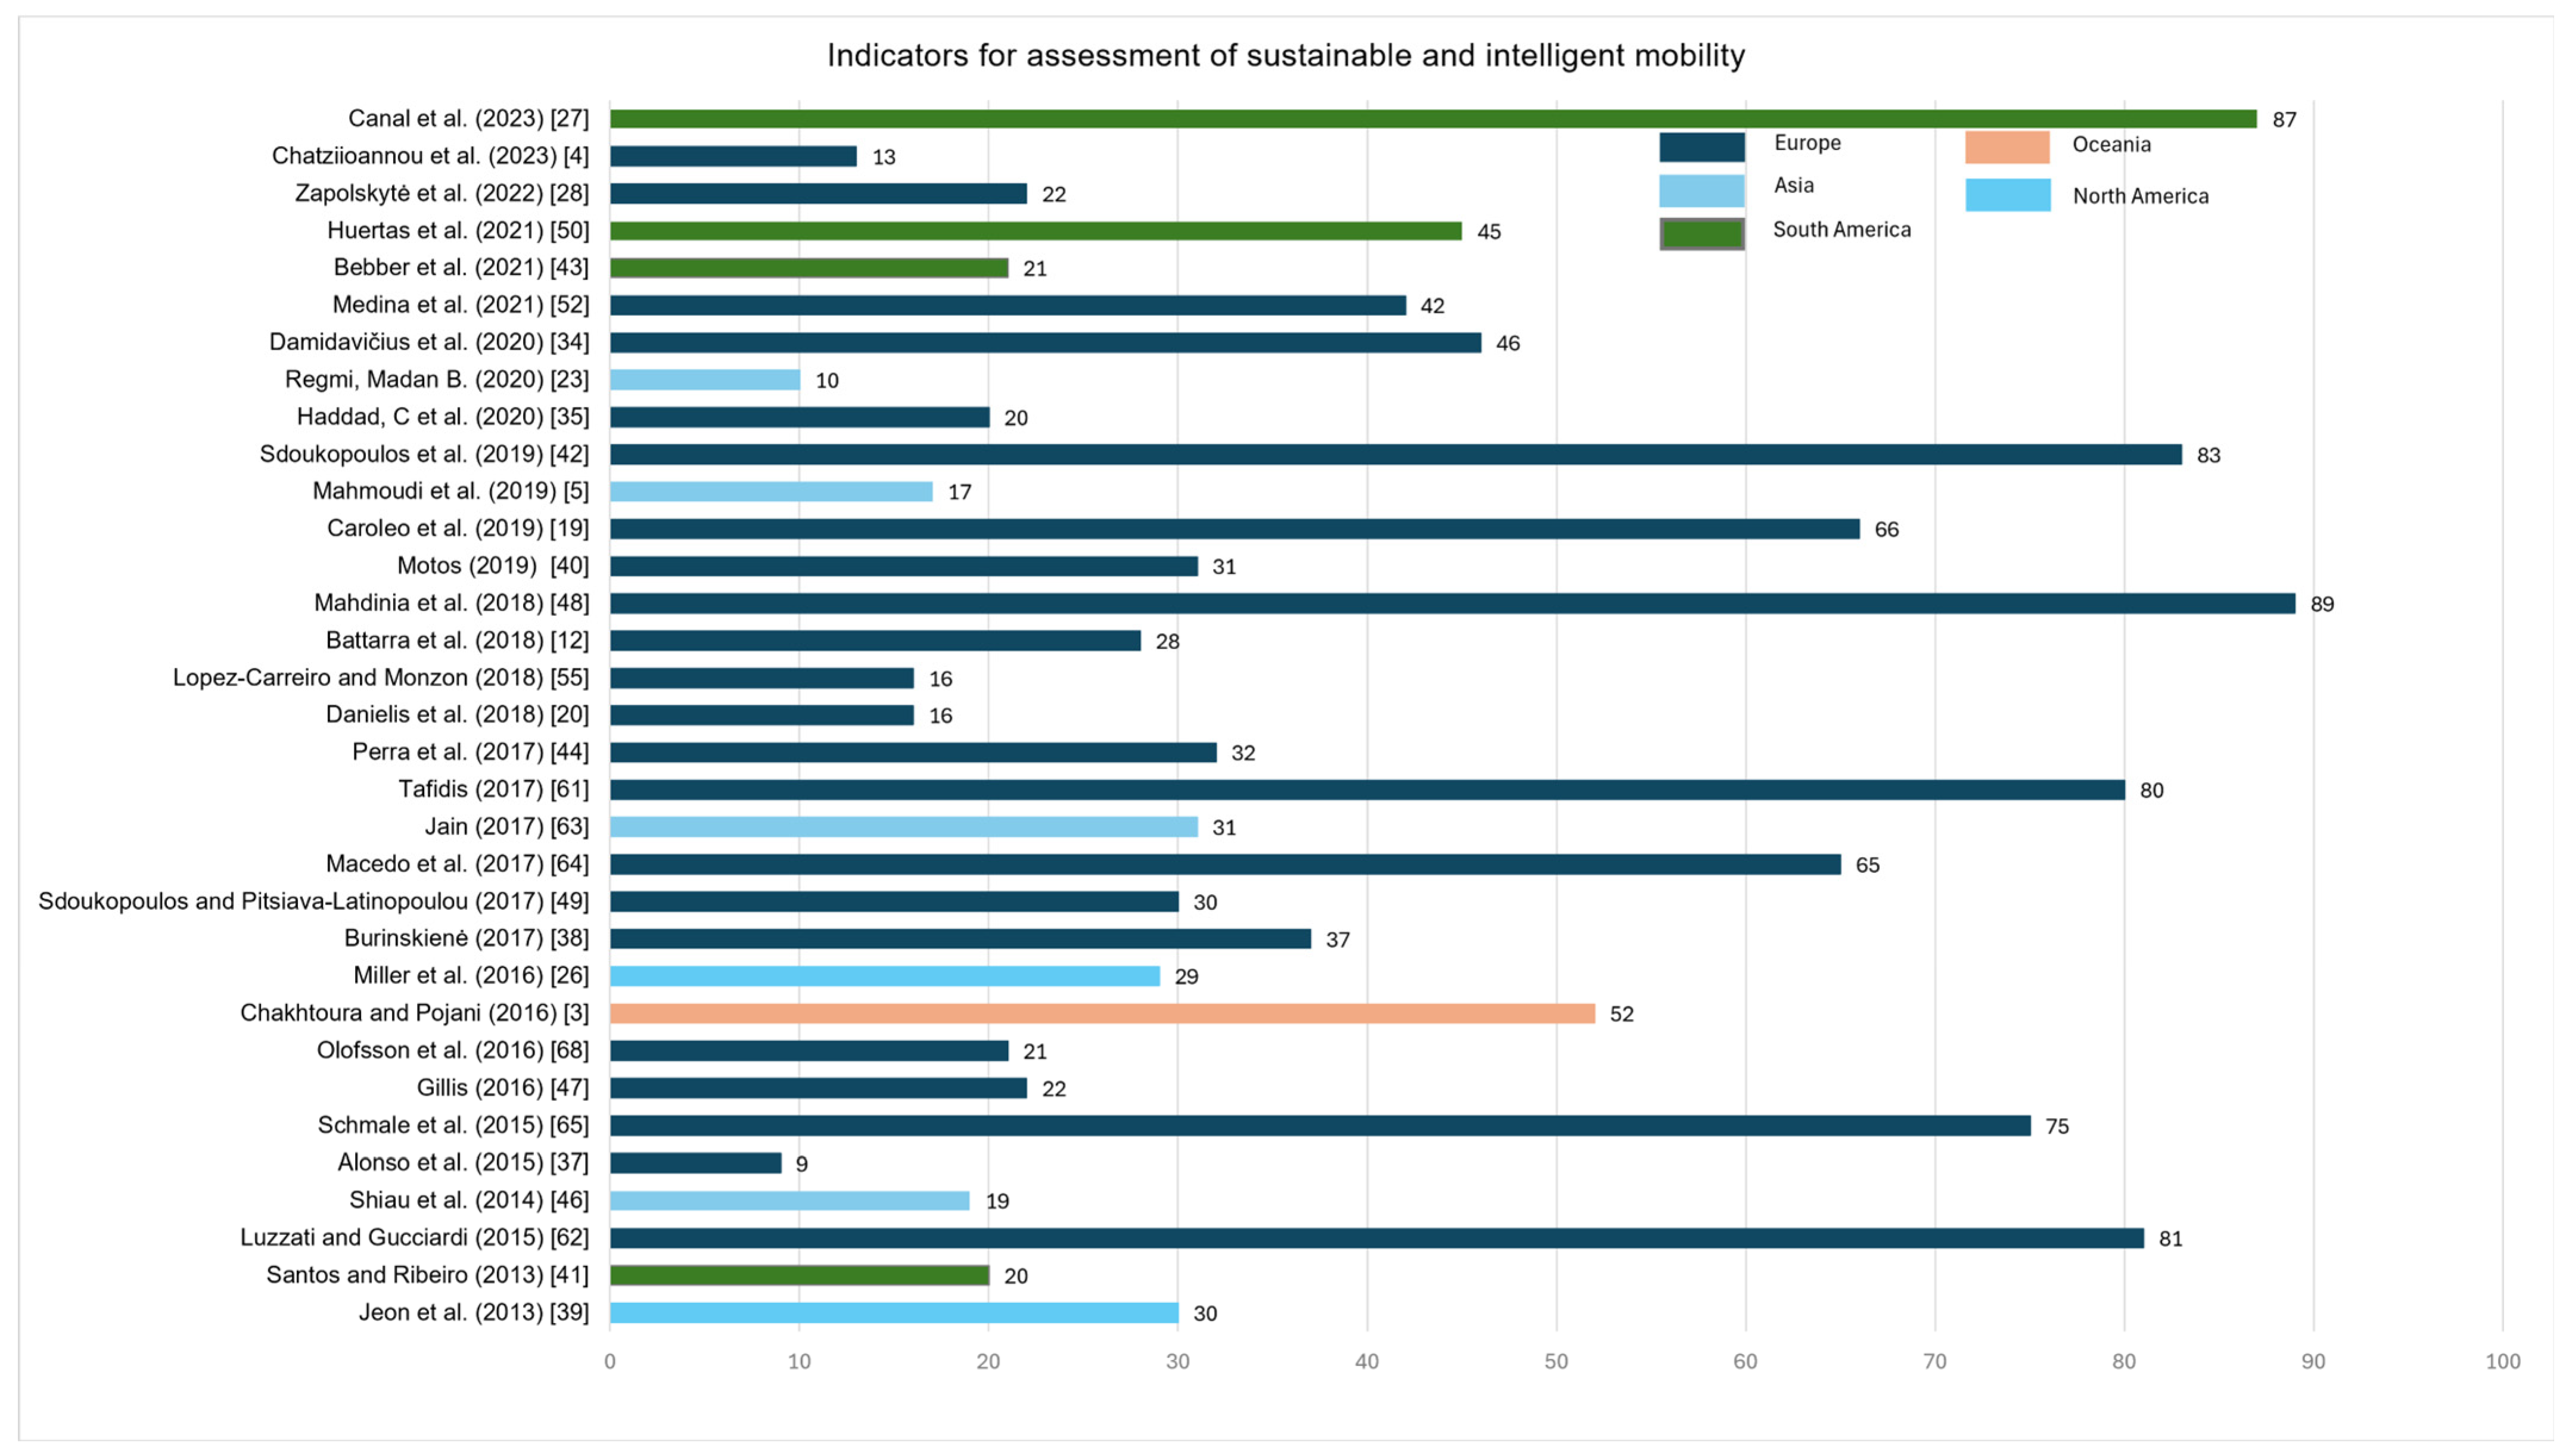
2.1. Literature Review

The search in the Scopus scientific database yielded publications containing the terms “sustainable mobility indicators”, “sustainable transport indicators”, and “sustainable transport assessment”. After reviewing each publication, 32 documents were selected as references, along with one identified doctoral thesis. In total, 33 documents were included in the analysis.
The review indicates that the classical pillars of sustainability, which are economic, environmental, and social, support the evaluation of mobility [4,20,37,38,39,40,41,42]. In addition, technological considerations are integrated into new Smart mobility proposals [28,43]. The concept of smart has also spread to technology, and it has recognized citizens and their needs [25]. This evolution shows the need to be more inclusive and develop metrics beyond the traditional elements that have been considered.
As a result of the literature review, the mobility evaluation indicators were identified and used recurrently [44]. In the social dimension, the following indicators are highlighted: accessibility, spatial equity, satisfaction, community cohesion, road safety, citizen safety, visual quality, variety of transport, social interaction, social equity, traffic congestion, comfort in public transport, physical activity, urban planning process, and participation of the population in decision-making [10,27,42,45,46].
In the economic dimension, the following items are highlighted: travel time, travel expenses/mobility expenses, government transportation costs, indirect passenger transportation costs, economic efficiency, affordability, economic development, investments, and modal share [19,47,48,49].
The environmental dimension widely considers the following aspects: biodiversity and protected areas, greenhouse gas emissions, air quality, energy consumption, hiking, biking, water pollution, natural and technological risks, acoustic and light disturbance, impact on architecture or heritage, use of space, and urban planning [6,27,40,42,50,51,52,53].
In the technological dimension, the following aspects are highlighted: car sharing, bicycle sharing, connected and automated vehicles, electric and hybrid vehicles, fuel, smart transportation systems, micro-mobility, smart traffic lights, online payment, trip planning, parking solutions, smart infrastructure, smart and green technologies, and quality open data [4,10,11,27,28,54,55].
There were 1285 indicators identified in 33 reviewed publications from various parts of the world, primarily in Europe (22), Asia (4), Oceania (1), and North America (2). A few evaluations were available for Latin American cities, with 3 in Brazil and 1 in Mexico. The proposed model contributes to the cities of the Global South. Furthermore, the terms used have multiple interpretations in different countries; thus, these indicators require a process of conceptual homogenization or harmonization. Figure 1 presents the final selection of publications and the number of indicators used. These methodologies utilize between 9 (minimum) and 89 (maximum) indicators, with an average of 39 and a standard deviation of 25.
Reviewing publications from 2013 to 2023 revealed the frequency of key sustainable and smart mobility indicators. The most common indicators included greenhouse gas emissions (present in 85% of studies), modal share (82%), accessibility (76%), traffic safety (73%), and energy efficiency (67%). This convergence suggests an emerging consensus on essential metrics despite regional differences in implementation.
The literature review was extended to include a study on key evaluation models, such as Sustainable Urban Transport Index (SUTI) [56], Sustainable Urban Mobility Indicators (SUMI) [57], ISO 37120:2018 standard [58], Transport System Indicators [42], Institute for Transportation and Development Policy (ITDP) Indicators for Sustainable Mobility [59], and World Business Council for Sustainable Development (WBCSD) Sustainable Mobility 2.0 [60].
Given the relevance of these models, a comparative analysis was conducted, revealing distinct patterns across the following five criteria groups: fundamental characteristics, structural elements, content focus, implementation characteristics, and contextual relevance.
For each model, the fundamental characteristics group establishes the institutional foundations, geographic focus, and target audience. Most originate from European or international organizations, demonstrating a limited explicit focus on Global South contexts.
For the second group, these models exhibit considerable variation in structural elements, with dimensional structures, assessment methodology, and weighting approach ranging from 3 to 19 categories with a diversity of indicators, suggesting complexity in management and measurement precision.
For the third group, content focus analysis demonstrates that, while the environmental dimension dominates most models, a significant disparity exists between the governance dimension and smart/ technological integration, with few frameworks providing comprehensive coverage across all dimensions relevant to sustainable mobility transitions.
In the fourth group, implementation characteristics present the most critical differentiator, as do data requirements, citizen perception integration, adaptability to data constraints, and scalability across city sizes, creating substantial barriers to application in resource-constrained environments typical of Global South cities.
Finally, in the fifth group, contextual relevance assessment further reveals significant limitations in existing models, with only two demonstrating strong Global South adaptability; similarly, the characteristics of practical implementation evidence and maturity assessment capability are analyzed.
Table 1 presents a comparative synthesis of global mobility assessment models focused on fundamental characteristics, implementation characteristics, and contextual relevance criteria groups. Meanwhile, Table 2 offers the same analysis centred on structural elements and content focus criteria groups.
A comparative analysis of established mobility assessment frameworks—including SUTI [56], SUMI [57], ISO 37120 [58], Transport System Indicators [42], ITDP Indicators [59], and WBCSD Sustainable Mobility 2.0 [60]—reveals significant heterogeneity in methodological approaches and contextual applicability. Regarding fundamental characteristics, most frameworks originate from international organizations or academic institutions targeting municipal authorities and planners; however, they exhibit considerable variance in geographic focus, with only ITDP and WBCSD being explicitly designed for global application. The structural elements demonstrate diversity in dimensional content, encompassing SUTI’s four dimensions and ISO 37120’s nineteen thematic areas. These elements predominantly utilize quantitative methodologies with minimal qualitative integration. An analysis of content focus indicates comprehensive coverage of environmental dimensions across various frameworks, particularly emissions and energy metrics. In contrast, the governance dimension receives minimal attention; it is absent from SUTI, ISO 37120, and ITDP indicators and is only implicitly addressed in the implementation guidance provided by the WBCSD. This systematic exclusion of governance indicators represents a significant methodological gap, especially as the quality of governance becomes a critical factor in sustainable mobility transitions within urban contexts [42].
The implementation characteristics reveal considerable obstacles to application in the Global South, as most frameworks necessitate high or exceedingly high data inputs, which presuppose a robust municipal data infrastructure [61]. Only the ITDP indicators exhibit moderate data requirements, while the incorporation of citizen perceptions is minimal or entirely lacking across all frameworks. Consequently, the adaptability to data constraints is predominantly low, with only the ITDP providing moderate adaptability through visual assessment possibilities. The assessment of contextual relevance further underscores limitations; notwithstanding claims of global applicability, most frameworks demonstrate limited practical implementation evidence in developing regions. SUTI has been exclusively applied in Asian cities, ISO 37120 exhibits limited implementation in developing regions despite global standardization, and the application of ITDP remains primarily confined to contexts within the United States. The adaptability to the global South varies significantly; the Transport System Indicators and ITDP Indicators are assessed as strong due to their indicator design, while SUMI and SUTI display limited adaptability owing to their regional focus. Moreover, the capabilities for maturity assessment are underdeveloped across the frameworks, with SUMI offering moderate benchmarking capability. In contrast, the Transport System Indicators and ITDP Indicators entirely omit metrics for developmental progression. These findings signify substantial methodological gaps in the existing frameworks regarding their applicability to resource-constrained environments, incorporating citizen perspectives, and providing developmental pathways toward sustainable mobility as referenced in [56,57].
The formulation of metrics and indicators (simple and compound) of sustainable mobility was identified [20,62,63,64] due to technical and academic interest in guiding urban transportation systems toward greater efficiency [10,27]. Additionally, indices that simplify mobility evaluation and facilitate city comparisons were recognized [23]. These instruments aim to ensure traceability in mobility management and their contribution to city decision-making [65].
Some particularities of contemporary cities were identified, including decreased dependence on private vehicles due to COVID-19, the importance of adapting cities and technologies to human nature for the efficient solution of their needs, and holistic planning centred on the human being [66]. Additionally, new mobility requirements emerged, where active modes of transport, strengthened public transport, accessibility, territorial planning, citizen participation, and governance work together to guarantee inclusive, safe, resilient, and sustainable mobility. The recurrence of sustainable and smart mobility evaluation models in developed countries and the concern for proper evaluation in developing countries were evident [67,68].
The identified gaps highlight the need to develop new assessment tools that incorporate additional dimensions usable in the context of cities in developing countries to advance sustainable, smart, and citizen-centred mobility.
Figure 1. Evaluation indicators of sustainable and smart mobility between 2013 and 2023 [3,4,5,12,19,20,23,26,27,28,34,35,37,38,39,40,41,42,43,44,46,47,48,49,50,52,55,61,62,63,64,65,68].
Sustainability 17 04684 g001

Background of the Governance Dimension

The United Nations Sustainable Development Goal 11, especially targets 11.2 and 11.3, clearly indicates that developing sustainable cities and communities requires not only physical infrastructure but also “inclusive and sustainable urbanization and capacity for participatory, integrated, and sustainable human settlement planning and management” [2]. In addition, it is necessary to promote the inclusion of diverse mobility actors (decision-makers, citizens, transportation managers) to establish projects aimed at sustainable mobility [69]; this recognition transforms governance from a basic factor to a sustainable urban development core element.
In this way, the OECD defines governance quality as prioritizing transparency, accountability, participation, and institutional capacity, which are vital for effectively executing urban policies [69,70]. The European Commission’s Urban Mobility Framework [57] has adapted to underscore governance as a key success element, affirming that good governance, supported by a long-term political commitment, clear responsibilities, and adequate resources, is indispensable for achieving sustainable mobility transitions.
Empirical evidence from developing regions further supports the dimensional treatment of governance. The governance failures, rather than technical or financial constraints, often represent the primary barrier to sustainable urban development in Global South contexts, such as sub-Saharan African cities [71]. Governance promotes focused actions in mobility planning, leading to significant enhancements without requiring large infrastructure investments, which is crucial in resource-limited contexts in the Global South.
Therefore, this study aims to enhance the direct assessment of essential factors that are recognized as significant but that are rarely included in existing urban mobility assessment frameworks by emphasizing governance as a critical component defined by transparent and quantifiable indicators.

3. Proposal for a Citizen-Centred, Sustainable, and Intelligent Mobility Evaluation Model

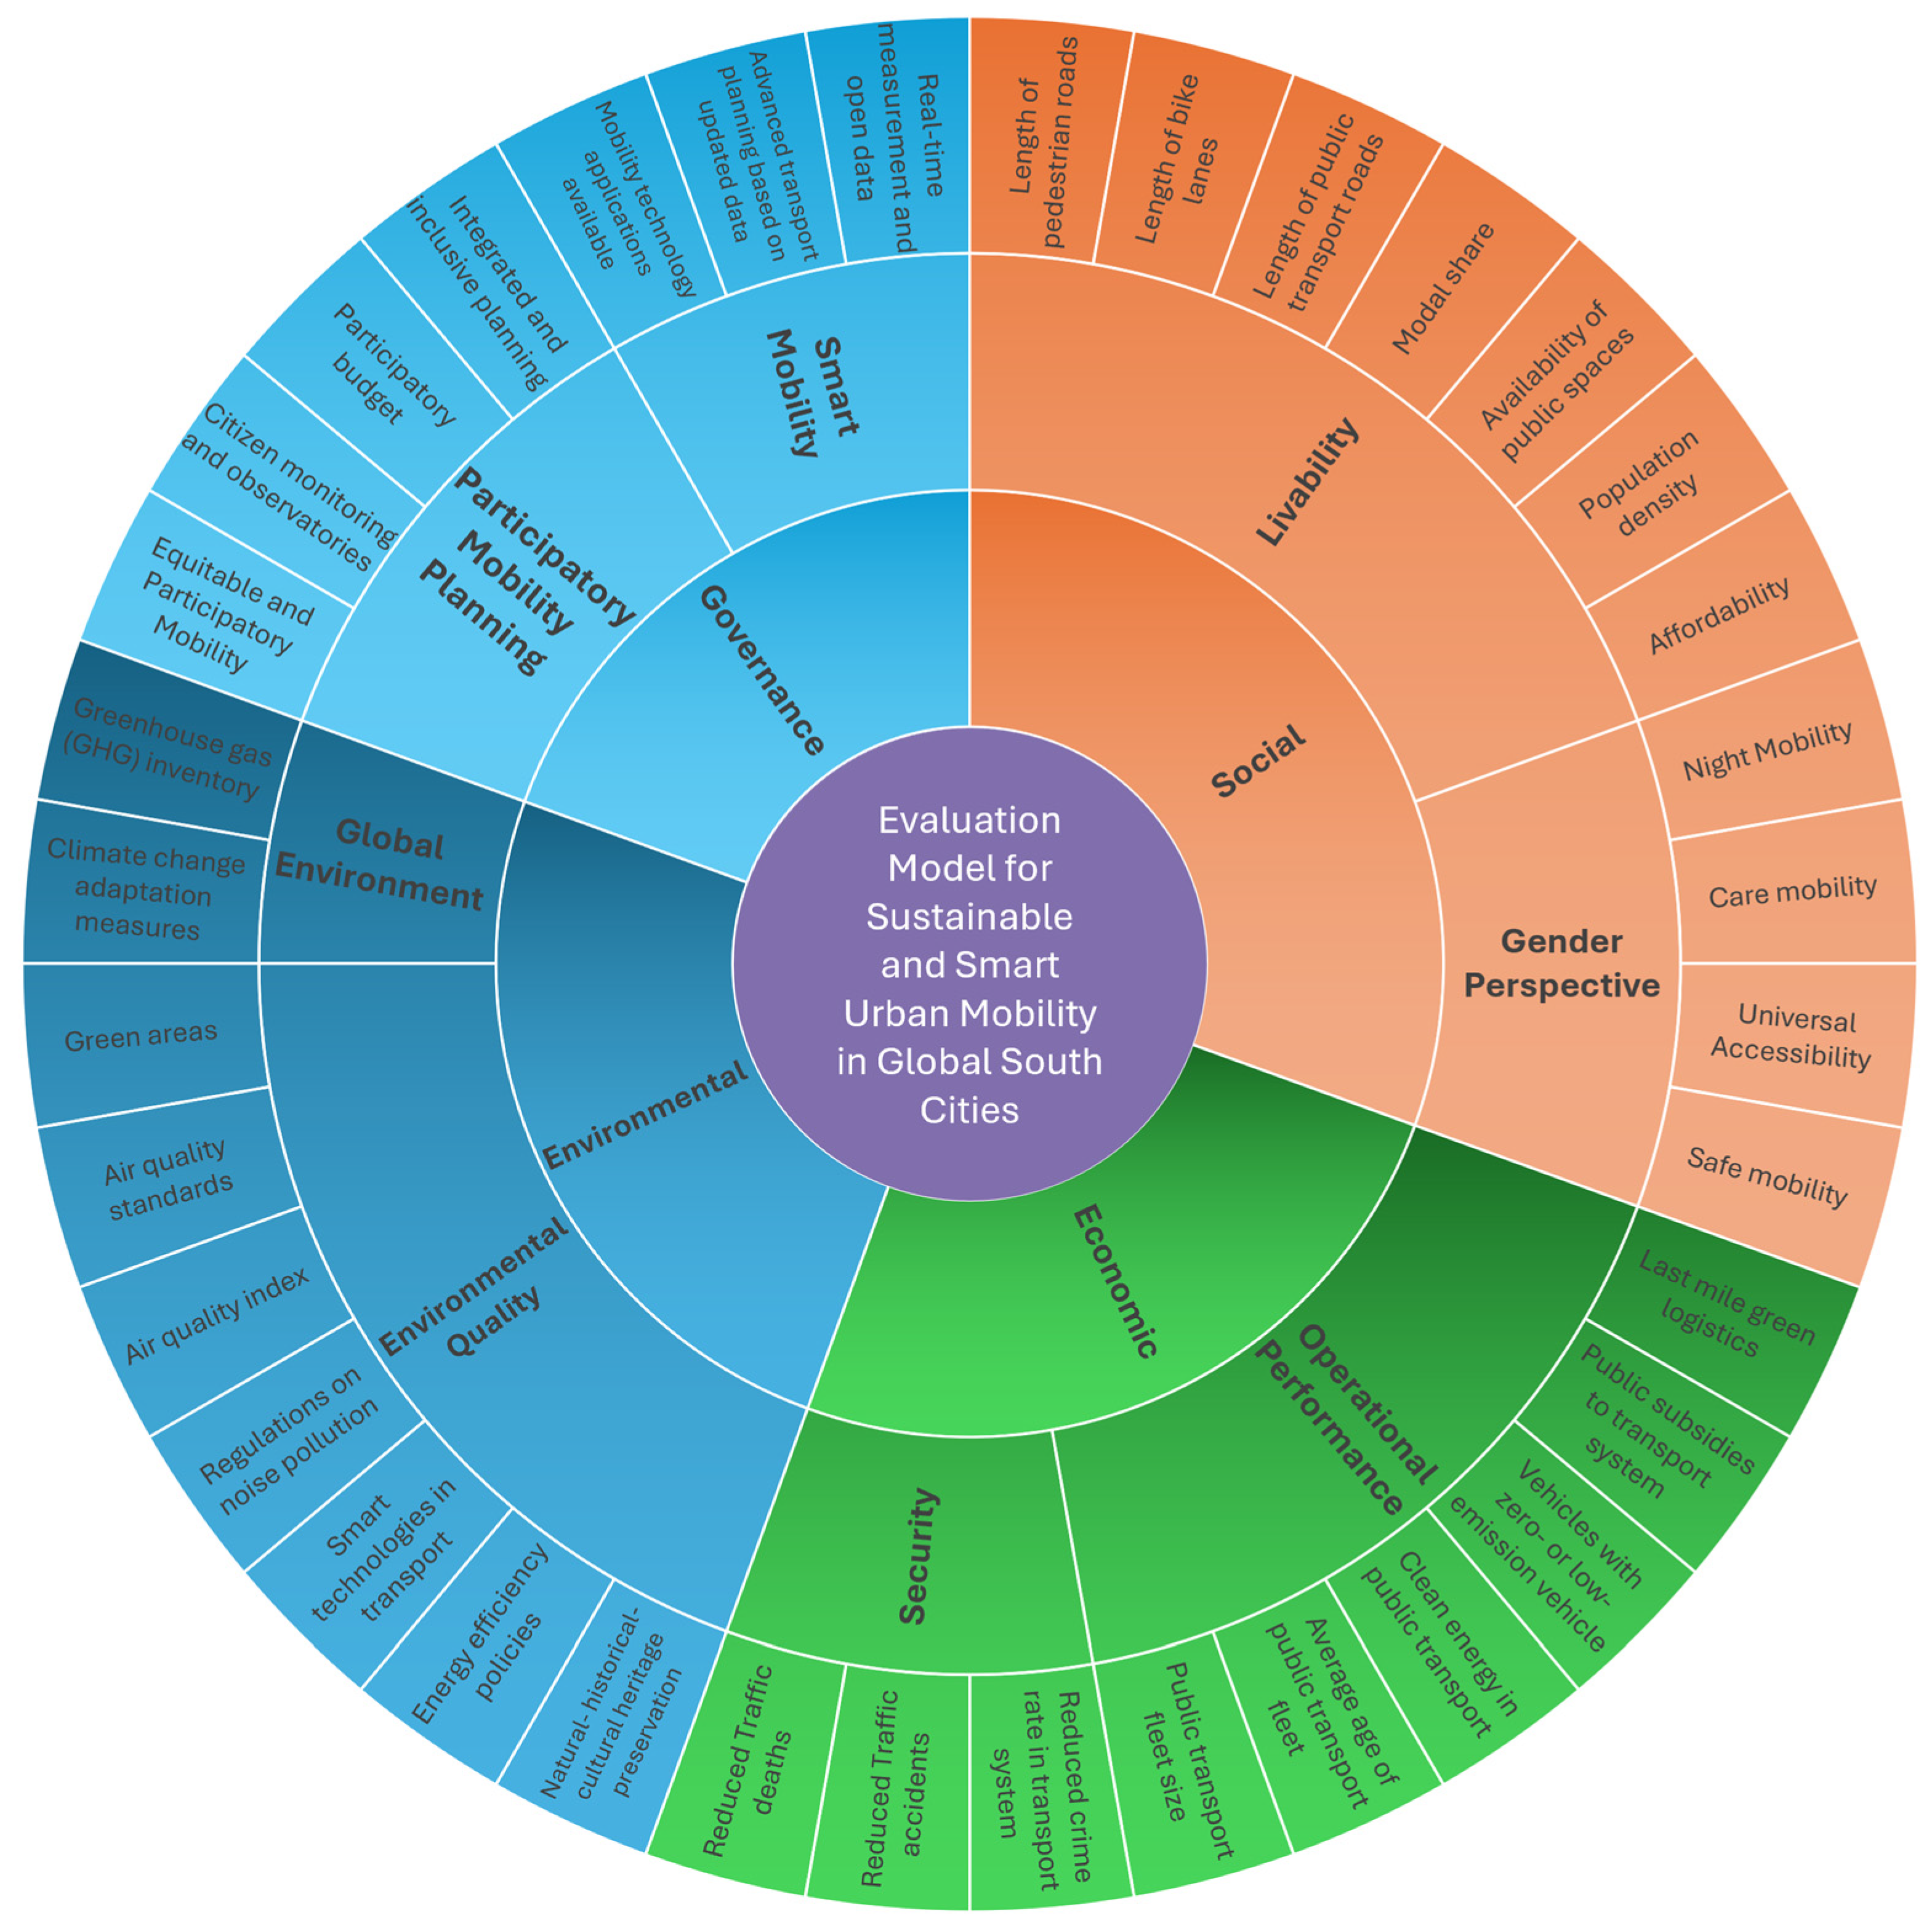
3.1. Description Model

The proposed model aims to help reduce the identified gap and provide a multidimensional evaluation instrument for decision-makers and transportation planners. It considers current dynamics related to the post-pandemic era and climate change. Figure 2 presents the conceptual model.
Figure 2 presents the conceptual model created based on the systematic analysis. The structure was developed via an iterative process: (1) identifying recurring dimensions across the reviewed literature, (2) clustering related indicators into coherent sub-dimensions, (3) evaluating dimensional relationships through expert validation, and (4) adapting the framework to address identified gaps in Global South contexts.
A relevant finding highlights governance challenges in developing regions, which often arise from limitations rather than technical constraints. This study emphasizes the underrepresentation of governance in traditional frameworks and its crucial role in sustainability. Additionally, the citizen-centred approach explicitly positions the four dimensions (environmental, social, economic, and governance) as equally relevant to the citizen, illustrating our finding that sustainable and smart mobility must balance these aspects, which represents an important theoretical advance of this study.
At the centre of the model are four dimensions (environmental, social, economic, and governance), eight sub-dimensions (global environment, environmental quality, livability, gender perspective, operational performance, security, inclusive and participatory planning, and smart mobility), and 36 indicators.
The four main dimensions are based on conventional sustainability pillars [42]. A governance dimension is added since it is essential to advance and sustain development over time [67], and it is usually relevant under the concept of “smart cities” [1].
Environmental: The evaluation based on environmental indicators may be unfeasible due to the costs of data collection and analysis [51]; however, having available information from the environmental and transportation authority reduces costs and allows traceability. In the model, this dimension addresses the environmental implications of transportation from the global and local context. It considers the regulatory structure that guarantees limits and regulation in the air, noise, and energy efficiency components and highlights the importance of preserving natural, cultural, and historical heritage in decisions regarding mobility in the city. It is made up of two sub-dimensions, global environment and environmental quality.
Social: Accessibility inequalities in cities are the product of transportation planning based on spatial segregation and development based on private vehicles [72]; thus, equity in transportation contributes to the construction of social equity, which is reflected in well-being and quality of life [6,73]. This dimension considers the particularities of the city so that optimal conditions for sustainable mobility are evident. It also considers the population’s characteristics and travel reasons so that mobility is inclusive, accessible, and affordable by gender, age, physical condition, or economic situation. It is subdivided into livability and gender perspectives.
Economic: Nowadays, cities seek structural solutions to problems related to mobility, such as pollution, congestion, and a lack of public space [69]; thus, public transport and active modes are viable alternatives. This dimension evaluates the characteristics of public transportation in the city, road safety, and citizen security as necessary conditions to promote sustainable urban mobility. It is subdivided into operational performance and safety.
Governance: Achieving sustainable mobility involves public support and understanding, using people-centred approaches from urban and transportation planning [66]. This dimension values the possibility of including citizens and using real-time data in urban mobility planning, management, decision-making, and monitoring processes. It is subdivided into participatory mobility planning and smart mobility.
Two main mobility actors evaluate the model’s components, and they are citizens and decision-makers. In this way, sustainable and smart mobility must be evaluated based on citizen perception and compared with each city’s results from measuring its parameters by local authorities.
The urban mobility assessment result is an average of the two evaluations, expressed as a mobility index that can be determined at the level of dimensions, sub-dimensions, and indicators. Generally, a level of maturity on a scale of 1 to 5 is obtained to establish the city’s progress toward achieving sustainable and smart mobility.

3.2. Validation and Prioritization of Model Components

The proposed model results from the findings obtained in the exhaustive literature review and internal discussions with the research team, which gave rise to a strong structure.
The validation process was based on the multi-criteria decision analysis (AHP) method [33]. There were 18 experts in mobility from academia, non-governmental organizations, consultancies, multilateral development agencies, and state entities from Colombia, as well as experts from Chile, Mexico, the United Kingdom, and the United States. It was held in June and July 2022. The research team identified representative experts from various sectors and contacted them directly. Additionally, the research team convened a large group of mobility scholars in Colombia, which brought in additional participants.
In the first stage, the model was socialized with experts, to whom a survey based on the hierarchical analysis process (Analytic Hierarchy Process (AHP)) was applied to prioritize each element based on comparing components at the same level.
The AHP method is a multi-criteria decision-making approach that establishes priorities based on expert judgment through a pairwise comparison exercise using a preference scale of 1 to 9 [74]. It involves disaggregating complex structures into their components to build hierarchies, defining priorities, and ensuring logical consistency [75].
The hierarchy represents the decomposition of the problem into its parts to obtain a solution. For this reason, an objective (the evaluation of sustainable and smart urban mobility), general criteria (dimensions), specific criteria (sub-dimensions), and sub-criteria (indicators) were defined.
The prioritization was conducted using online software based on AHP [33]. The tool generated pairwise comparison arrays and their evaluations to obtain the weightings for each dimension, sub-dimension, and indicator, thus establishing their priority within their levels and the model in general [54].
Logical consistency was calculated to assess the degree of dispersion of the judgments. Evaluations with a consistency of less than 10% were considered to ensure accurate judgments and to avoid inconsistencies in this evaluation. Extreme values (outliers) were eliminated using evaluations that exceeded twice the standard deviation as criteria.
As a product of the validation, the weightings of dimensions, sub-dimensions, and indicators were obtained to evaluate sustainable and smart mobility focused on the citizen, as presented in Table 3 and Table 4.
The obtained results assign great importance to the social dimension, which is consistent with the purpose of the model, which is to focus on the citizen and their needs. The governance and environmental dimensions were very close in their weights, which indicates that citizen participation in planning, decision-making, and monitoring of mobility in the city is relevant, and environmental quality at a global and local level is an aspect of interest. Finally, there is the economic dimension, which had a representative rating even though it was not the most important.
The results of prioritizing dimensions, sub-dimensions, and indicators enable us to identify thematic areas and aspects for direct intervention and prioritize investments and decision-making related to urban mobility.
Regarding the results obtained from the weightings provided by expert checkers, we find the following:
-
In the social dimension, the city’s conditions are more relevant for mobility based on public transport, walking, and cycling, which are the foundations of sustainable mobility.
-
In the governance dimension, citizen participation, inclusion, and equity are essential in all planning, investment, and mobility monitoring stages.
-
In the environmental dimension, the impact of mobility on the global environment is emphasized.
-
In the economic dimension, the characteristics of public transport and its technology are very important. Still, if it presents better conditions for users and the environment, its number of users could increase.
Based on these results, the city’s maturity level is defined to achieve sustainable and intelligent mobility. This level ranges from 1 to 5 and is derived from citizen perceptions and measurements of urban mobility. Thus, it is possible to contrast citizens’ opinions with the actual mobility situation in the city. The maturity level evaluation scales are an adaptation of the maturity measurement model of smart cities and territories in Colombia [76].

3.3. Validation by Case Study

The validation of the model as a case study was conducted in Ibagué and Tunja, two intermediate-sized cities in Colombia, with populations ranging from 100,000 to 1,000,000 inhabitants [77]. Tunja, the capital of the department of Boyacá, is in the centre of Colombia; its projected population was 185,469 inhabitants in 2023, comprising 47.3% men and 52.7% women. Ibagué, the capital of the department of Tolima, is situated in the west of the country; its projected population was 542,046 inhabitants in 2022, consisting of 47.6% men and 52.4% women [78].
Method: The software “Responsive Mobility” version 1.0 [36] was developed with the structure of the model to facilitate the collection of online information and the calculation of the results, allowing citizens and authorities to consult and provide information related to city mobility. The software summarized each indicator, its means, definition, unit of measurement, calculation formula, variables, reference values, and weighting factor for the respective calculation. It was applied to indicators, sub-dimensions, and dimensions. The city’s maturity level to achieve sustainable and intelligent mobility was determined from that starting point. This level of maturity was proposed as an adaptation of a maturity measurement model for smart cities and territories in Colombia [76]. The evaluation of each model’s component was assessed on a Likert scale, ranging from 1 to 5, where 1 represents the worst scenario, and 5 is considered the highest condition to achieve this type of mobility. The criteria were defined by the research team based on the literature review.
Citizen participation was performed through online perception surveys; however, in the case of the population in the periphery without Internet access, it was performed in person in their homes. It was evaluated using a Likert scale with five points, 1 being the most unfavourable and 5 being the most favourable, to obtain their quantitative perception regarding each proposed mobility evaluation indicator [79].
The online data available on mobility in each city were obtained from official sources of information [80,81], and technical documents, such as the Mobility Master Plans [82] and Territorial Ordering Plans [83], were also consulted, among others. Additionally, interviews were conducted with local authorities to gather missing data. The evaluation was carried out by considering the reference values defined by the research team on a scale from 1 to 5. Thus, the mobility evaluation was derived from citizen perception, while the city data emerged from its mobility planning.
The research team included the participation of students who belonged to a research incubator, who oversaw collecting and recording data in the software to evaluate results. The principal researcher established contact with local authorities, and the students were responsible for obtaining official data and socializing with the community for their participation in citizen perception surveys. This work was carried out in both cities and included assistance to areas located on the periphery to guarantee the involvement of different social groups. Several means, such as social networks, academic events, public places, universities, shopping centres, and visits to vulnerable neighbourhoods, were used to spread the information to the citizens.
The evaluation was carried out through citizen perception surveys, considering a representative sample calculated with a confidence level of 95% and a margin of error of 1.5%.
The reliability and validity of the data collection instrument were evaluated, and the results were analyzed statistically using the free JASP 0.15 software [84].

4. Results

This section presents the results of the proposed model from the following two perspectives: (1) practical, focused on applying the model to case studies, and (2) conceptual, focused on the comparative analysis of the proposed model for existing mobility assessment models.

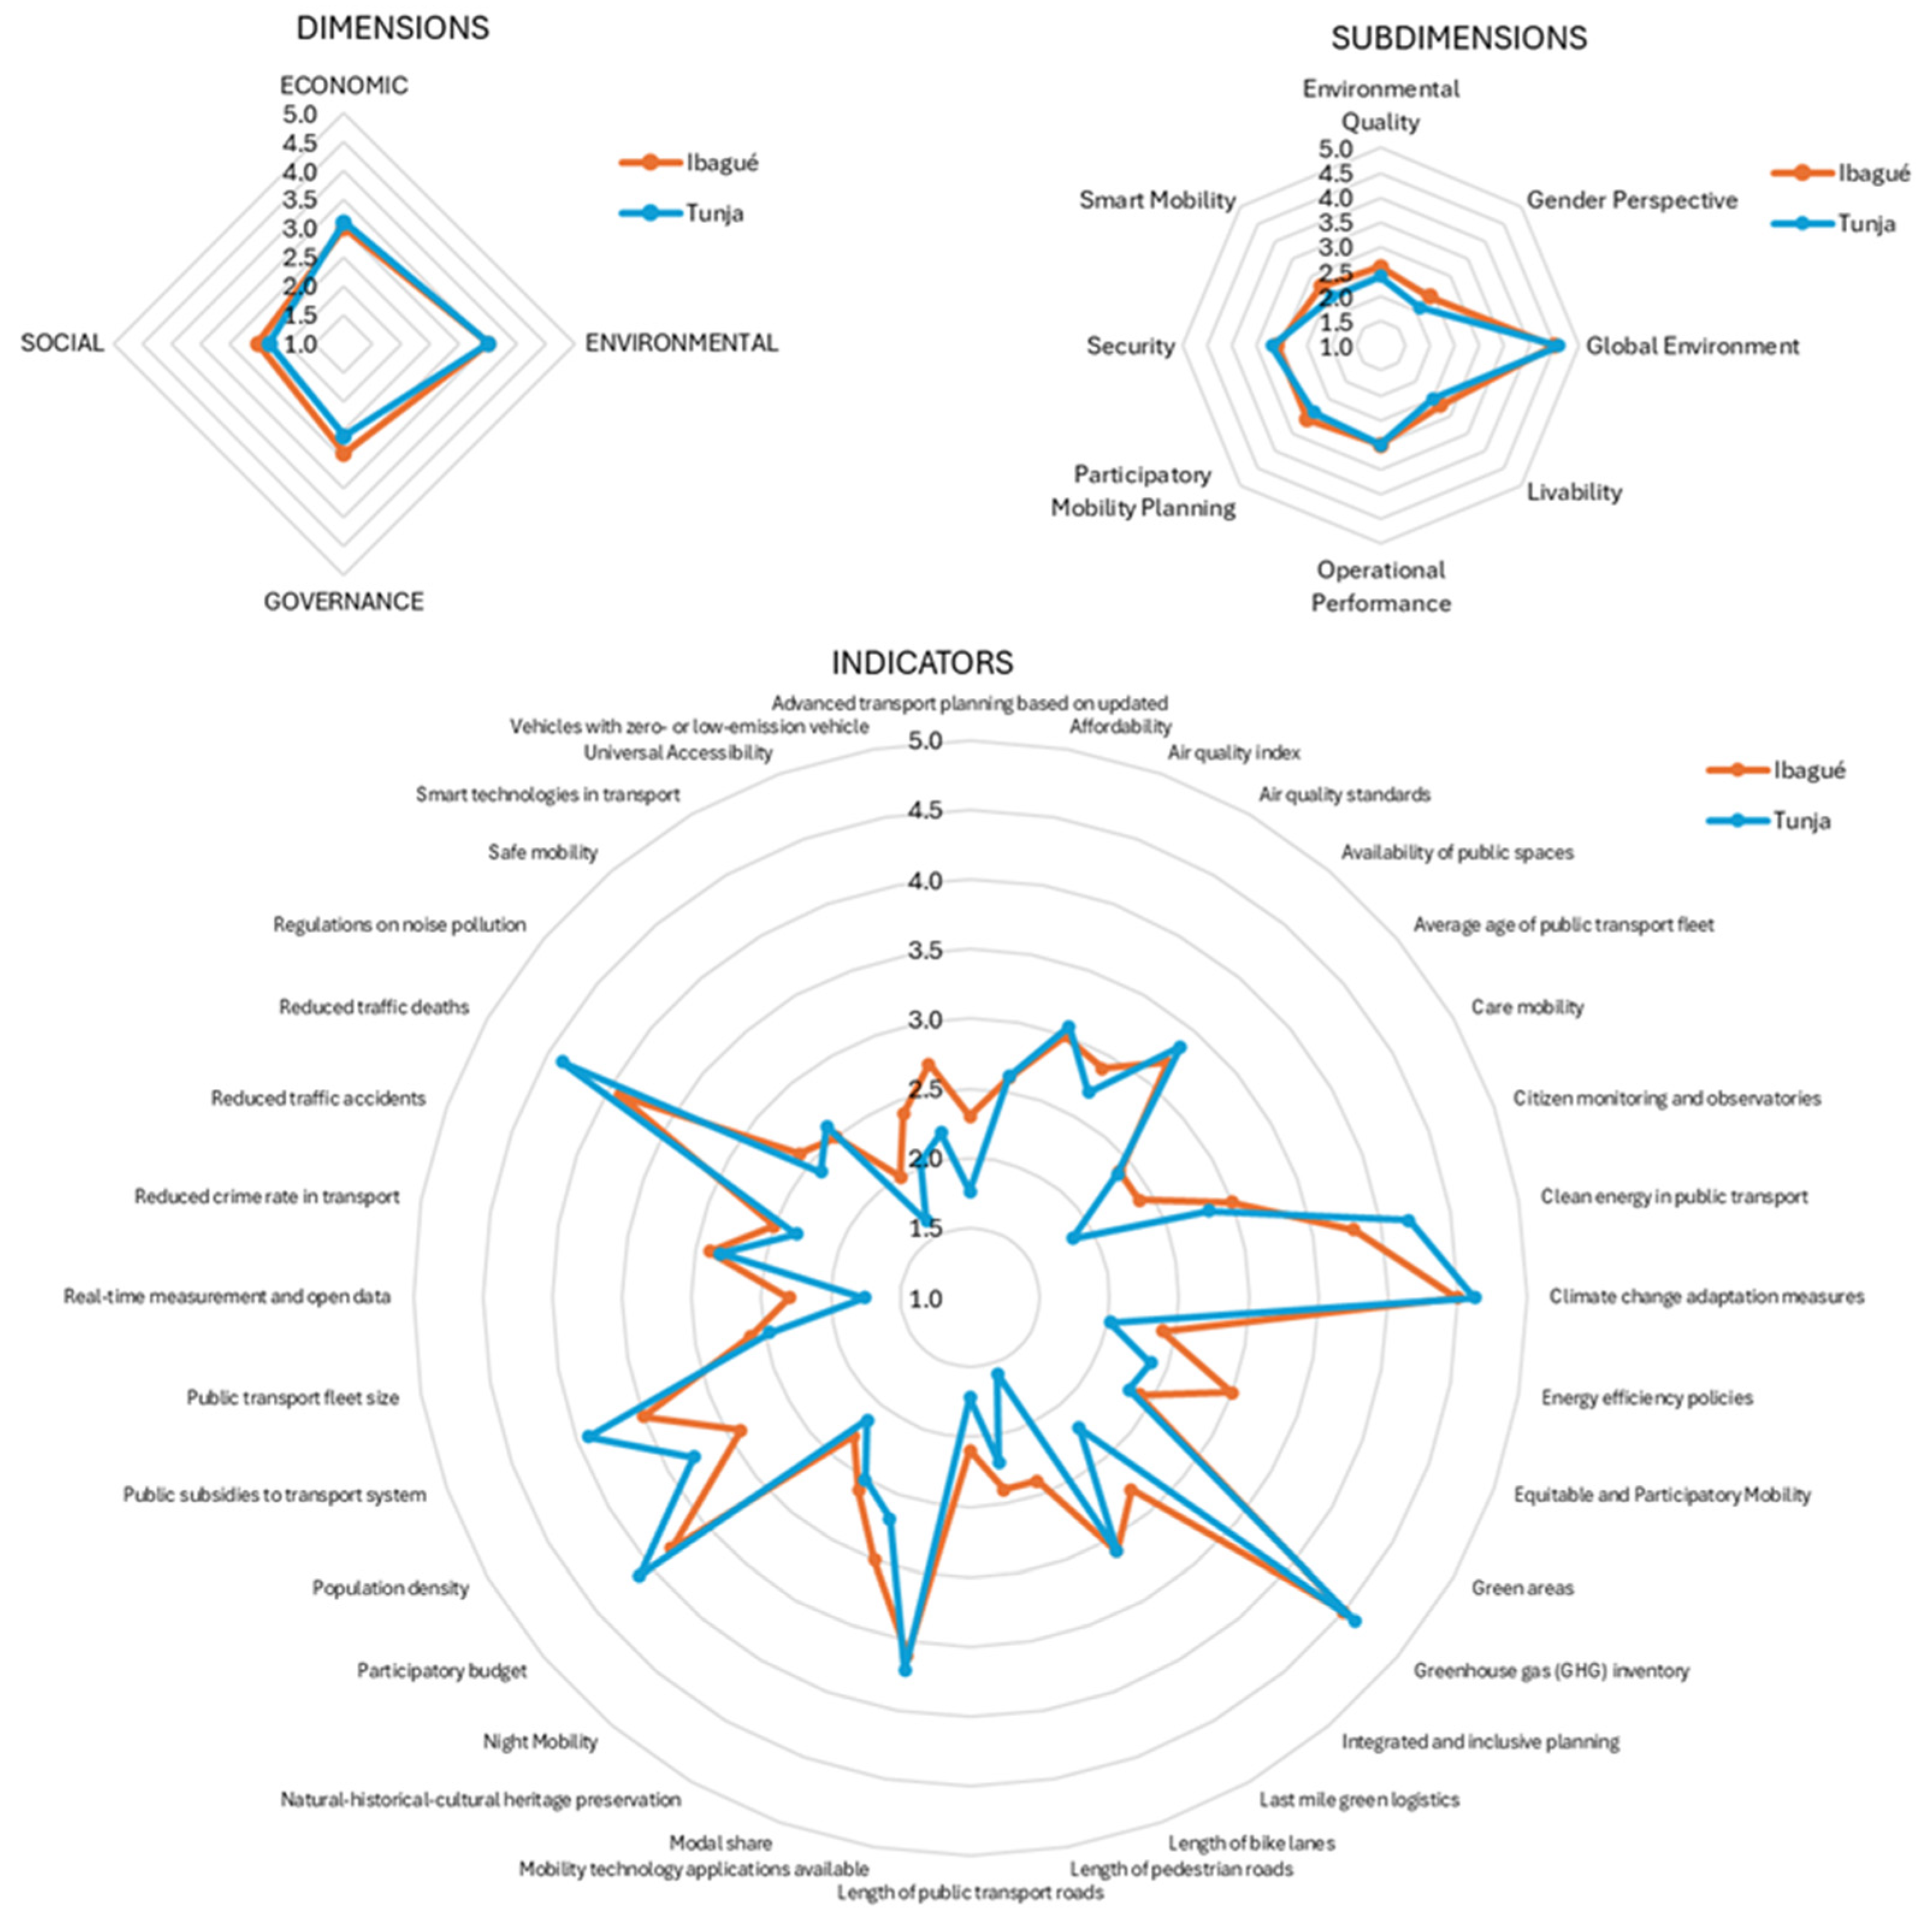
4.1. Practical Results

This section presents the results of evaluating urban mobility in the two selected cities for case studies.

4.1.1. Perception Surveys

The instrument used to determine citizen perception was an online survey. Representative samples were collected in Tunja (N = 383, Male = 171, Female = 207, non-binary = 5) and in Ibagué (N = 370, Male = 197, Female = 172, non-binary = 1).
The internal consistency test of the perception survey was carried out by calculating McDonald’s Omega coefficient (ω), considering the multidimensionality of the instrument used and the fact that this coefficient does not depend on the number of items [85]. A ω = 0.92 was obtained for Tunja and a ω = 0.95 for Ibagué. The instrument’s reliability is acceptable when ω has a higher value than 0.7 [86].
Sample: The representative sample for the citizen perception survey in Tunja consisted of 44.7% men, 54% women, and 1.3% non-binary individuals. The frequency of participation by age ranged from 18 to 29 years: 53.2%, from 30 to 45 years: 23.0%, from 46 to 59 years: 15.4%, and those over 60 years old: 8.4%.
In Ibagué, the representative sample consisted of 53.1% men, 46.6% women, and 0.3% non-binary. The frequency of participation by age ranged from 18 to 29 years, 70.3%; from 30 to 45 years, 14.6%; from 46 to 59 years, 9.7%; and those over 60 years old, 5.4%.
Data analysis: Statistical analysis was performed with JASP software (version 0.16.4) to assess the significance of differences between cities and dimensions. The Shapiro–Wilk test evaluated the normality of data distribution. Parametric tests (t-test and ANOVA) were utilized to analyze normally distributed data. In contrast, non-parametric tests (Mann–Whitney and Kruskal–Wallis) were applied for data that did not meet normality assumptions. A significance level of p < 0.05 was established to identify statistically significant differences between citizens’ perspectives from Ibagué and Tunja. Effect sizes were calculated using Cohen’s d for parametric tests and r for non-parametric tests, with values of 0.2, 0.5, and 0.8 indicating small, medium, and large effects, respectively. The McDonald’s Omega coefficient (ω = 0.92 for Tunja and ω = 0.95 for Ibagué) validated the internal consistency of the survey instrument, showing excellent reliability well above the widely accepted threshold of 0.7 in social science research.
It was found that there were significant differences in the global environment in the subdimensions of environmental quality, livability, gender perspective, security, participatory mobility planning, and smart mobility, since p < 0.05. In operational performance (p = 0.064), there was no significant difference between the two cities. In the social and governance dimensions, significant differences existed (p < 0.001), while in the environmental (p = 0.148) and economic (p = 0.163) dimensions, they were not evident. Regarding maturity level, statistically significant differences were also noted between the two cities based on citizen perception (p < 0.001).
Figure 3 presents the results of the mobility evaluation in the two cities, which were based on citizen perception.
The perception results show that the environmental and economic dimensions, respectively, evidenced the most favourable opinion, with evaluations ranging from 3 to 4 (on a scale of 1 to 5); this is due to the indicators of the global environment sub-dimension being the best evaluated in the study cities (4.5 in Ibagué and 4.6 in Tunja), followed by the security sub-dimension (3.1 in Ibagué and 3.2 in Tunja). The social and governance dimensions received the lowest results in both cities, scoring between 2 and 3; this is a consequence of the evaluations of the gender perspective sub-dimensions (2.4 in Ibagué and 2.1 in Tunja) and smart mobility (2.7 in Ibagué and 2.4 in Tunja).
The level of maturity by perception placed Ibagué at 2.9 and Tunja at 2.8, which indicates that, in both cases, citizens perceive a slight improvement in the evaluated indicators measured in the city.

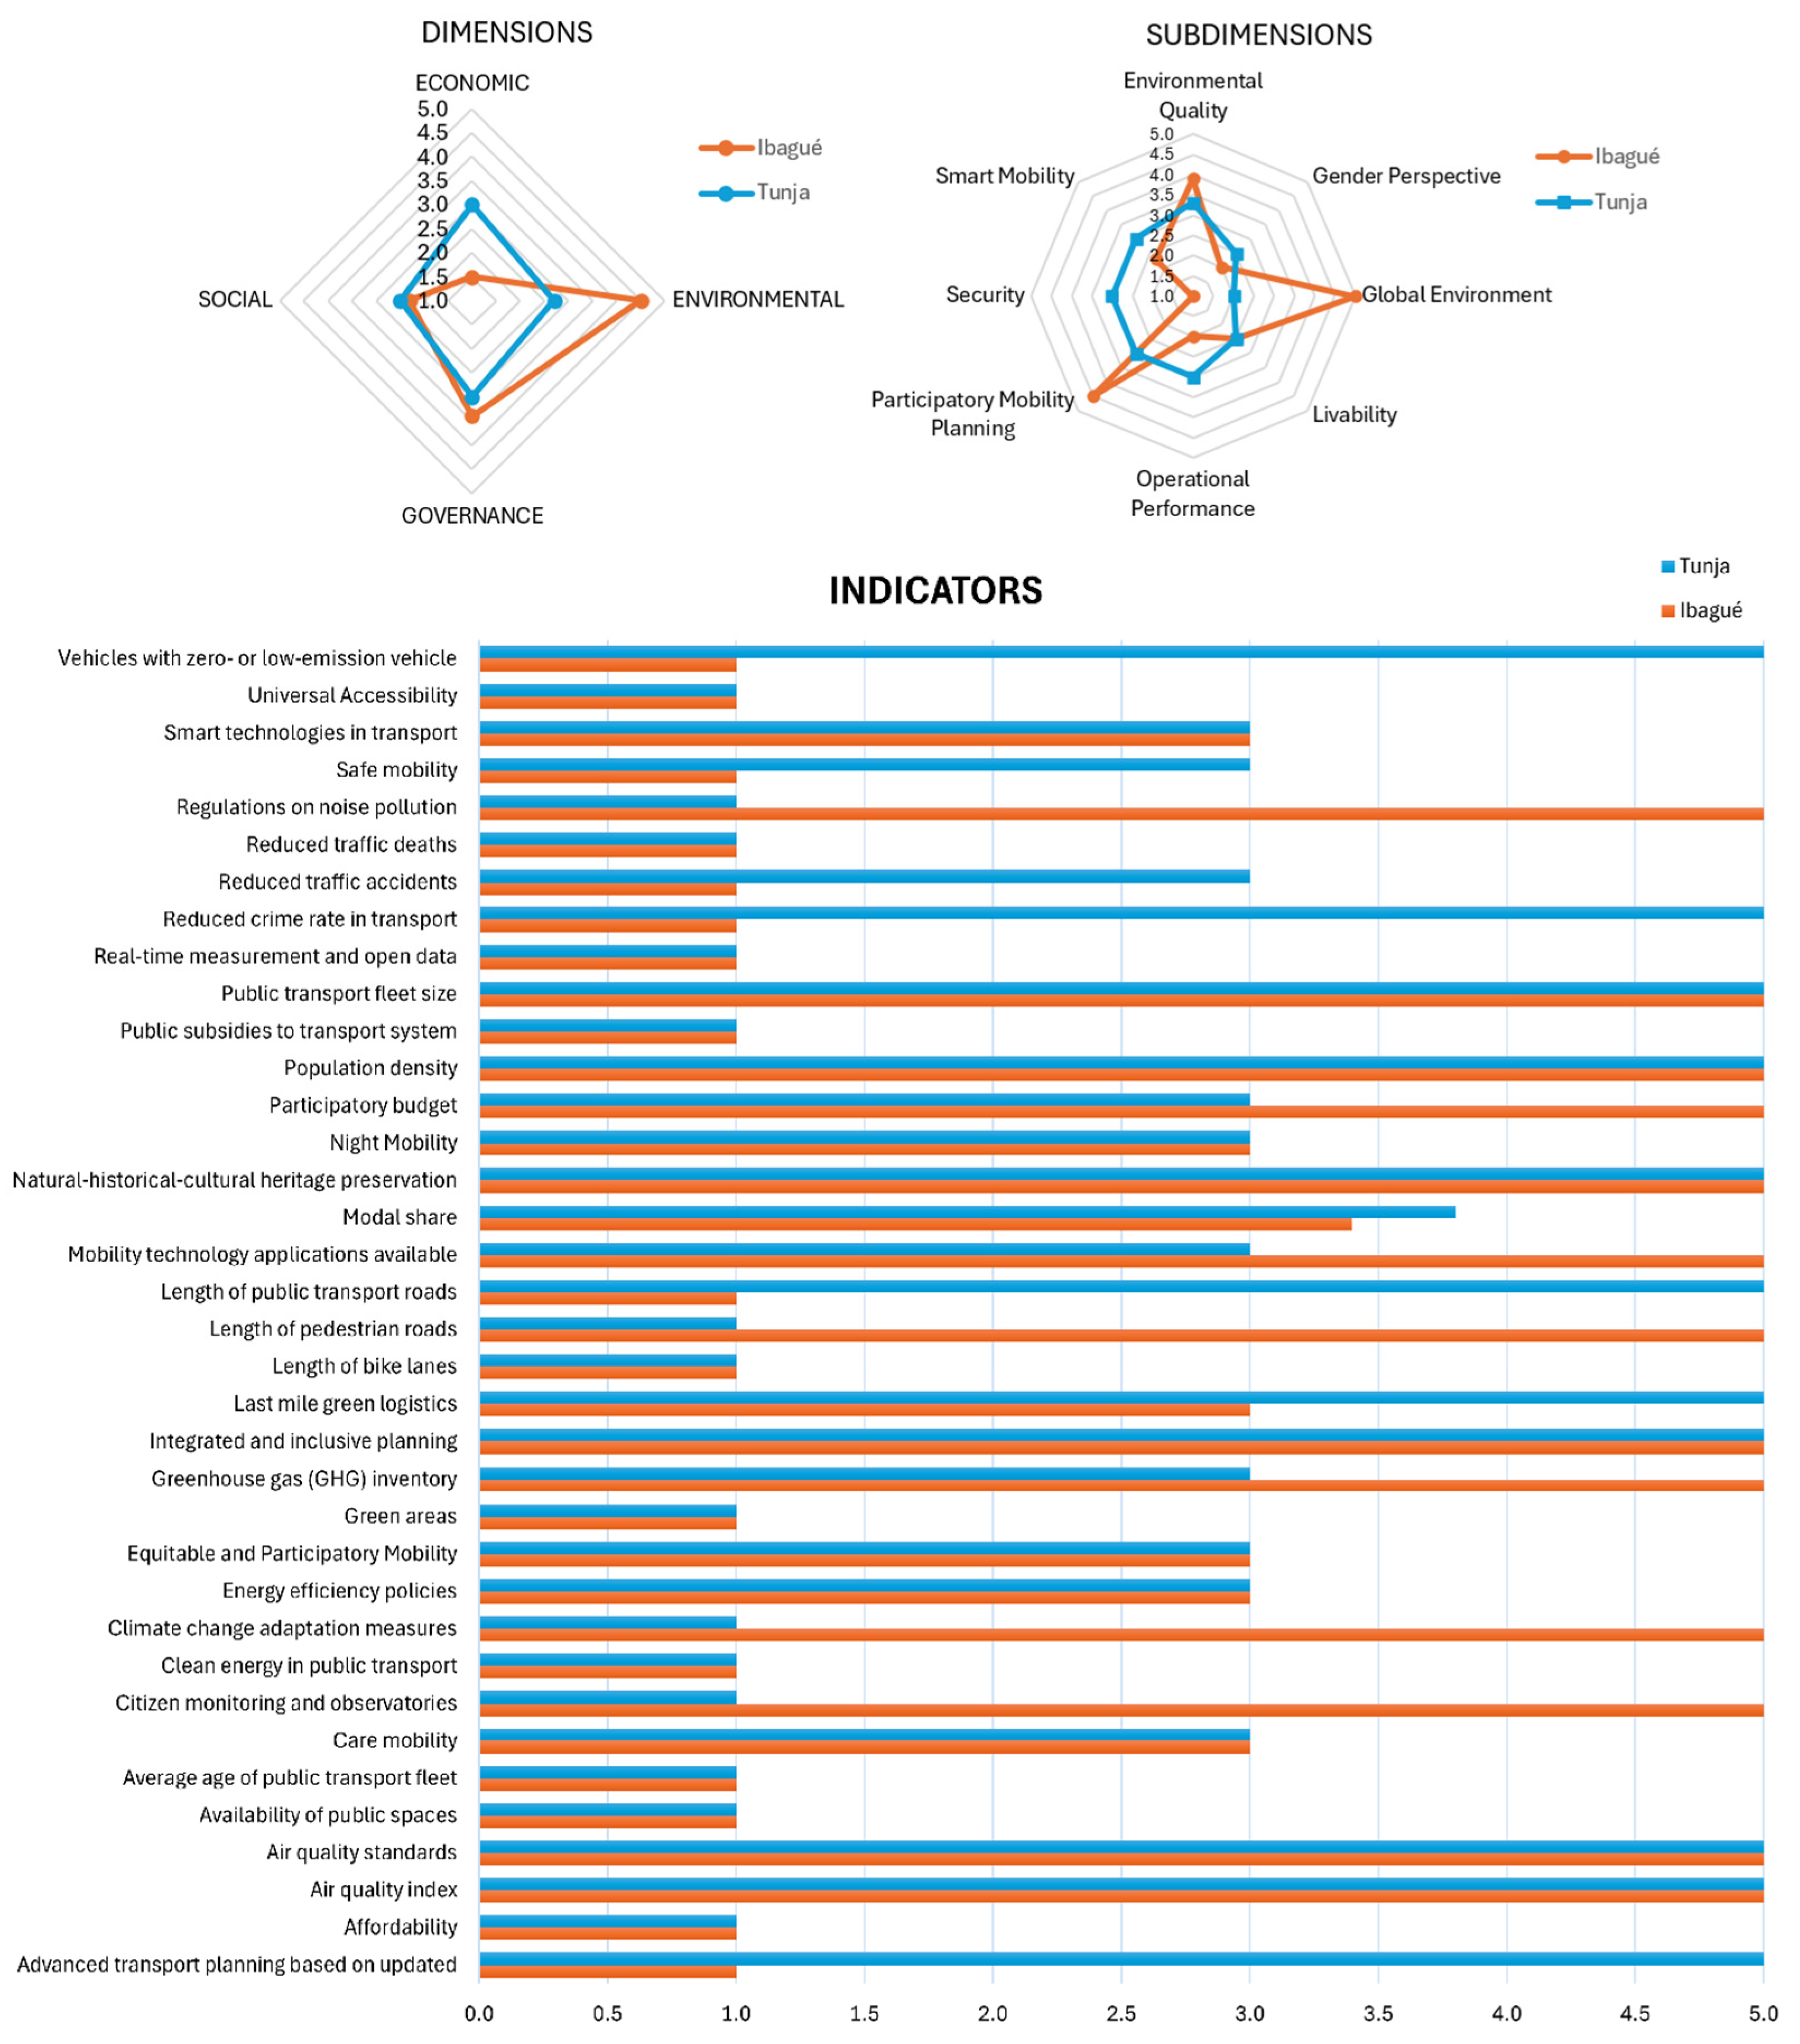
4.1.2. Measurement Results by Authority and Online Data

The mobility evaluation was also conducted using data gathered by the city in collaboration with its local authorities and available information online. In this instance, differences were identified between the two cities in the environmental and economic dimensions.
Figure 4 presents the results of the mobility evaluation, which was based on input from authorities and online data in the two cities. This figure shows a favourable result for the environmental and governance dimensions in Ibagué city. This is due to environmental quality policies, the implementation of strategies such as measuring local greenhouse gases [87], climate change adaptation plans for the city, citizen participation in mobility planning processes, and the use of technological applications by citizens related to decision-making for their mobility.
In Tunja, the economic and governance dimensions stood out and yielded better results; this is due to aspects such as the size of the public transport fleet, the number of hybrid and electric vehicles in the city, the number of non-conventional conveyances for the delivery of small packages within the urban area, the improvement of safety conditions in public transportation, and inclusive and participatory planning.
The consolidated results of this evaluation for Ibagué (Ibg) and Tunja (Tnj) cities are presented in Figure 5.
Once the results of all the constituent elements of the model were obtained, the weighted average of the dimensions was calculated to determine the maturity level, which indicates the city’s position regarding achieving sustainable and smart mobility, thereby improving the citizens’ quality of life. Additionally, it allowed for comparisons between cities based on an evaluation instrument that utilizes the needs identification of the local context and facilitates decision-making based on updated information from the model [76].
This level of maturity can be differentiated (by citizen perception or measuring results) or generalized for the city. Table 5 describes the characteristics of each maturity level.
Figure 6 presents the results of the maturity level obtained for the two study cities, Ibagué and Tunja.
The results indicate that both Ibagué and Tunja are at a medium-low maturity level, which implies the need to strengthen each of the aspects considered in the model, especially those related to affordability, the average age of the public transportation fleet, infrastructure for active mobility, real-time measurements, and the use of these data in transportation planning, road safety, and universal accessibility.

4.2. Conceptual Results

From the comparative analysis process conducted for the six sustainable mobility assessment models, as delineated in the “Literature Review” section, identical criteria were systematically employed in evaluating the proposed model. This methodological rigour aimed to clarify its distinctive conceptual characteristics, as seen in Table 6.
The proposed model introduces several methodological innovations compared to established frameworks (SUTI, SUMI, ISO 37120, Sdoukopoulos Transport System Indicators, ITDP Indicators, and WBCSD Mobility 2.0).
Primarily, it uniquely integrates subjective citizen perceptions with objective measurements through a statistically validated dual-evaluation approach (McDonald’s Omega coefficient ω > 0.90). This hybrid methodology represents a significant epistemological shift from the predominantly positivist orientation of existing frameworks, which primarily rely on quantitative metrics and demonstrate limited or no citizen participation input. While ITDP and WBCSD incorporate some stakeholder feedback, neither framework considers citizens central to the evaluation methodology. This integration addresses the documented disconnect between technical indicators and lived mobility experiences [8,88] while enabling the detection of implementation gaps that traditional single-method frameworks often overlook.
Secondly, the dimensional structure of the proposed model elevates governance from an auxiliary consideration to a core dimension, possessing a substantial expert-validated weighting of 23.9%, comparable to environmental considerations, weighted at 23.6%. This structural reconfiguration directly responds to empirical evidence indicating that governance failures, as opposed to technical limitations, frequently represent the primary barriers to sustainable mobility within Global South contexts [89,90]. Comparative analysis reveals that, while the Sustainable Urban Transport Index (SUTI) and the Sustainable Urban Mobility Index (SUMI) include limited aspects of governance, and the World Business Council for Sustainable Development (WBCSD) incorporates governance implicitly within its implementation guidance, none of the existing frameworks position governance as a central evaluative dimension with explicit indicators. Furthermore, the proposed model exhibits notable contextual adaptability facilitated by flexible data requirements that sufficiently accommodate varying data availability, the integration of sustainable modes of transport, and cultural sensitivity in indicators. This approach effectively addresses the limitations identified in existing frameworks, which generally presume Northern urban characteristics, data infrastructure, and institutional arrangements [91].
Thirdly, the implementation architecture introduces a five-level maturity scale that provides municipalities with a clear pathway for progressive improvement rather than the binary evaluations or rankings typical of established frameworks. This approach identifies implementation deficits beyond simple policy adoption, which is a crucial distinction. Comparative analysis indicates that ISO 37120 offers certification levels but does not provide implementation guidance. In contrast, the indicators from SUTI, SUMI, ITDP, and Transport System Indicators do not include a maturity scale that effectively reflects the characteristics and status of the transition toward sustainable urban mobility. Moreover, the proposed model distinctly integrates technological components through a dedicated smart mobility sub-dimension while simultaneously emphasizing broader sustainability goals. This approach differs from WBCSD’s technology-focused framework and the limited technical indicators presented by ISO 37120. The AHP-derived dimensional weighting structure highlights a distinctive prioritization of social dimensions (34.1%), in contrast to the environmental emphasis found in most established frameworks, and aligns with the documented citizen priorities in Global South contexts where accessibility, affordability, and safety frequently take precedence over environmental concerns [73].

5. Application Outlook and Potential Generalizability

While our model has been validated in intermediate Colombian cities, its design principles allow adaptation to diverse urban contexts across the Global South. This section outlines specific recommendations for parameter adjustment and implementation strategies in various urban setting typologies.

5.1. Adaptability to Different Urban Scales

In extensive metropolitan areas with populations exceeding one million, the model should encompass the following components: (1) zonal disaggregation: instead of relying on city-wide averages, it is imperative that indicators be evaluated at the district or corridor levels to more accurately reflect intra-urban disparities; (2) sample stratification: citizen perception surveys ought to utilize multi-stage stratified sampling methods to ensure representation across diverse socioeconomic groups and peripheral regions; (3) governance complexity: the indicators for participatory planning should be expanded to include multi-level governance frameworks at metropolitan, municipal, and local levels.
For small urban centres with populations under 100,000, the following changes can be adopted: (1) focused indicator set: emphasize the essential indicators most relevant to smaller urban areas; (2) enhanced data gathering: combine various indicator measurements into single surveys; (3) customized technology: minimize dependence on advanced smart mobility apps while prioritizing more appropriate technology solutions.

5.2. Regional Contextual Adjustments

In African urban environments [71], significant adaptations encompass the following: (1) integration of informal transportation: enlarged measures regarding the quality and governance of paratransit and informal transport; (2) aspects of land tenure: additional metrics correlating mobility with enhancements in informal settlements; (3) protocols addressing data scarcity: established proxy indicators in scenarios where direct data collection is unfeasible.
In the context of Asian urban environments [23], considerations include the following: (1) metrics recalibrated for density: adjusted spatial indicators to reflect elevated urban densities; (2) emphasis on the transition of motorization: heightened focus on indicators denoting mode shifts during accelerated phases of motorization; (3) potential for leapfrogging in technology: enhanced smart mobility indicators that demonstrate advanced digital infrastructure.

5.3. Implementation Strategies for Resource-Constrained Environments

To enhance the model’s practical utility in resource-limited environments, the following strategies should be considered: (1) phased implementation: start with high-priority indicators that demand minimal data collection; (2) collaborative data gathering: partner with universities, community organizations, and mobile network operators; (3) leverage technology: lower equipment expenses by employing smartphone surveys and traffic counting; (4) integrate capacity building: merge assessment with training for local officials in data collection methods.
These strategies aid the model in preserving its conceptual integrity while accommodating the diverse realities of urban environments in the Global South. The holistic framework provides flexibility that supports standardization (facilitating comparisons across cities) and contextual sensitivity (ensuring relevance to local conditions); this represents a significant insight, as it empowers territorial authorities and citizens to utilize an evaluation model in a practical manner that is adaptable to their circumstances.

6. Discussion and Conclusions

This research developed and validated a comprehensive evaluation model for sustainable and smart urban mobility in cities within the Global South. It effectively addressed the deficiencies that are present in the existing frameworks, particularly with regard to governance dimensions, citizen participation, and adaptability to data-constrained environments.
Our study emphasizes the significance of a multi-dimensional approach to mobility assessment. We incorporated the traditional sustainability triad—environmental, economic, and social—while introducing a governance dimension that has garnered attention in the contemporary literature. However, our findings diverged from numerous prevailing frameworks by including the governance dimension at the same level as the classical pillars of the sustainable urban mobility assessment. In contrast to European models, which generally prioritize environmental factors, our expert validation process determined that social factors are identified as the preeminent priority (34.1%), succeeded by governance (23.9%), while environmental considerations are placed in third (23.6%). This divergence exemplifies the unique priorities of cities in the Global South, where social equity, accessibility, and participatory planning may be emphasized over the environmental concerns that are more predominant in Northern models.
The findings from our case studies present several critical implications that must be considered in urban mobility planning and policy development. Conventional mobility assessment frameworks generally conduct objective assessments without considering citizens’ perceptions, which reveals a significant concern. For instance, in the Colombian cities of both Ibagué and Tunja, environmental policies were assigned relatively strong objective scores, measuring 3.5 and 3.2, respectively. Conversely, citizen perception scores were significantly lower, recorded at 2.9 and 2.8. This trend illustrates that, despite the presence of policy frameworks, their effectiveness in yielding tangible benefits to citizens persists as an insufficient challenge. Consequently, urban planners should focus not solely on policy formulation but also on effective implementation and the establishment of clear communication strategies.
Furthermore, the prioritization results for the case studies underscore the significance of social dimensions, accounting for 34.1%, over environmental considerations, representing 23.6% in Global South contexts; this contrasts with the environmentally centred approaches frequently adopted from Northern contexts. This conclusion indicates that mobility initiatives in developing areas must prioritize accessibility, affordability, and inclusivity to gain public backing and secure sustainable results. For example, the significant focus on universal accessibility, which makes up 31.9% of the gender perspective sub-dimension, shows that targeted efforts to reduce mobility obstacles for vulnerable groups can greatly improve the system’s overall sustainability.
The significant importance of the governance dimension (23.9%) substantiates our hypothesis that both institutional and participatory elements are critical in fostering sustainable mobility transitions in developing contexts. The notably elevated appraisal of integrated and inclusive planning (37.3%) indicates that the enhancement of planning processes could result in more considerable advantages than solely depending on technical interventions, particularly when implementation capacity is limited.
The assessment of the model’s maturity level serves as a pragmatic diagnostic instrument for urban environments, indicating that the two case study cities persist in functioning at medium-low maturity levels, despite the existence of mobility policies. This observation suggests that progress toward sustainable and intelligent mobility demands more than mere policy adoption; it entails continuous implementation, rigorous monitoring, and modifications guided by ongoing user feedback.
Sustainable urban mobility is currently a priority on the agenda of local governments, and the possibility of conceiving smart mobility has motivated interest in managing it properly to contribute to the commitments of urban dynamics. Intelligence in mobility also addresses citizen participation. Therefore, citizen-centred management instruments, such as the one proposed in this research, strengthen the methodological framework for sustainable and smart mobility assessment, promote effective monitoring during their implementation, and assist urban mobility planners in making informed decisions.
This study draws on citizen perceptions as input for the urban mobility evaluation to understand their real needs and, based on these needs, contribute to formulating policies that reflect local realities. In addition, it enables citizen traceability to be an integral part of the participatory process in city governance. The evaluation of the study cities highlights the limited availability of online information and the absence of a measurement culture in this context.
The comparative analysis between the existing mobility assessment frameworks and our proposed model corroborates a significant contribution to the sustainable and smart urban mobility assessment methodology. Our research demonstrates that conventional frameworks need to be extended to the following five essential characteristics for the contexts of the Global South: the integration of governance, the incorporation of citizen perception, adaptability to data limitations, the lack of real-time measurement strategies, and the capacity to assess the level of maturity in the transition process.
The research process integrates methodological rigour with contextual flexibility, simultaneously achieving statistical robustness through expert-validated weightings employing the AHP process while maintaining adaptability to resource-constrained settings through hybrid data collection approaches. By elevating governance to a central dimension (23.9% weighting), integrating citizens’ perspectives as fundamental rather than peripheral data sources (ω > 0.90 reliability), and providing a structured five-level maturity scale with clear progression mechanisms, this model advances the limitations of the existing assessment tools that measure aspects focused on developed country contexts, ignoring the particularities of the Global South. This research presents, as an output, not only a conceptual framework encompassing dimensions, sub-dimensions, and indicators but also its application process designed to effectively facilitate the transition towards sustainable and intelligent urban mobility in cities situated in the Global South. This region exhibits substantial variations in institutional capacity, citizen priorities, and implementation constraints when compared to developed urban areas contexts.
Consequently, this research presents a model that effectively addresses the discrepancies between the theoretical postulates of sustainability and the practical realities of implementation in developing urban environments. This model facilitates an adaptable transition process and illustrates the current state of progress for each case territory.
Future research is expected to utilize the model in cities of different sizes to create a database for city comparisons while encouraging discussions among local authorities and citizens to support an effective transition to sustainable and smart mobility practices.

Author Contributions

All authors contributed to the conception and design of the study corresponding to the doctoral research of D.A.-L. The contributions are as follows: D.A.-L. and D.H.-G. proposed the methodology and managed the model validation process. D.A.-L. performed the conceptualization, composition, data collection, and analysis. D.H.-G., S.D.-M. and M.M.-P. oversaw the review and supervision. D.A.-L. and M.A.M.-M. handled software development and data analysis processes. D.A.-L. wrote the first draft of the manuscript, and all authors contributed to the various versions of the writing. All authors have read and agreed to the published version of the manuscript.

Funding

This research received no external funding.

Institutional Review Board Statement

The study was conducted in accordance with the Declaration of Helsinki. On 3 April 2025, the Research Ethics Committee of the Universidad Pedagógica y Tecnológica de Colombia reviewed the manuscript and granted its endorsement. This endorsement was given because the study complies with ethical considerations, from its planning and execution to the results submitted for publication.

Informed Consent Statement

Informed consent was obtained from all subjects involved in the study.

Data Availability Statement

The web portal “Responsive Mobility” was developed in the research, which shows the software used and some data obtained in the study. Responsive Mobility 1.0. Code 13-96-454, 22 November 2023. National Copyright Directorate, Ministry of the Interior, Bogotá, Colombia, accessed on 12 December 2023. Available on https://www.responsivemobility.com.

Acknowledgments

Special thanks to the editor and reviewers for their constructive instructions and to the Universidad Pedagógica y Tecnológica de Colombia for its support during the development of the Doctorate in Engineering process.

Conflicts of Interest

The authors declare no conflicts of interest.

References

  1. Hall, R.P. Understanding and Applying the Concept of Sustainable Development to Transportation Planning and Decision-Making in the U.S. Ph.D. Thesis, Massachusetts Institute of Technology, Cambridge, MA, USA, 2006; p. 872. [Google Scholar]
  2. United Nations. Objetivos y Metas de Desarrollo Sostenible—Desarrollo Sostenible. Available online: https://www.un.org/sustainabledevelopment/es/objetivos-de-desarrollo-sostenible/ (accessed on 2 July 2020).
  3. Chakhtoura, C.; Pojani, D. Indicator-Based Evaluation of Sustainable Transport Plans: A Framework for Paris and Other Large Cities. Transp. Policy 2016, 50, 15–28. [Google Scholar] [CrossRef]
  4. Chatziioannou, I.; Nikitas, A.; Tzouras, P.G.; Bakogiannis, E.; Alvarez-Icaza, L.; Chias-Becerril, L.; Karolemeas, C.; Tsigdinos, S.; Wallgren, P.; Rexfelt, O. Ranking Sustainable Urban Mobility Indicators and Their Matching Transport Policies to Support Liveable City Futures: A MICMAC Approach. Transp. Res. Interdiscip. Perspect. 2023, 18, 100788. [Google Scholar] [CrossRef]
  5. Mahmoudi, R.; Shetab-Boushehri, S.N.; Hejazi, S.R.; Emrouznejad, A. Determining the Relative Importance of Sustainability Evaluation Criteria of Urban Transportation Network. Sustain. Cities Soc. 2019, 47, 101493. [Google Scholar] [CrossRef]
  6. Gallo, M.; Marinelli, M. Sustainable Mobility: A Review of Possible Actions and Policies. Sustainability 2020, 12, 7499. [Google Scholar] [CrossRef]
  7. Tanikawa-Obregón, K.; Paz-Gómez, D.M. El Peatón Como Base de Una Movilidad Urbana Sostenible En Latinoamérica: Una Visión Para Construir Ciudades Del Futuro. Bol. Cienc. Tierra 2021, 29–34. [Google Scholar] [CrossRef]
  8. Brůhová Foltýnová, H.; Vejchodská, E.; Rybová, K.; Květoň, V. Sustainable Urban Mobility: One Definition, Different Stakeholders’ Opinions. Transp. Res. Part Transp. Environ. 2020, 87, 102465. [Google Scholar] [CrossRef]
  9. Spadaro, I.; Pirlone, F. Sustainable Urban Mobility Plan and Health Security. Sustainability 2021, 13, 4403. [Google Scholar] [CrossRef]
  10. Costa Braga, P.I.; Bezerra Dantas, H.F.; Deusdará Leal, M.R.; Rodrigues De Almeida, M.; Medeiros Dos Santos, E. Urban Mobility Performance Indicators: A Bibliometric Analysis. Gest. Prod. 2019, 26, e3828. [Google Scholar] [CrossRef]
  11. Albino, V.; Berardi, U.; Dangelico, R.M. Smart Cities: Definitions, Dimensions, Performance, and Initiatives. J. Urban Technol. 2015, 22, 3–21. [Google Scholar] [CrossRef]
  12. Battarra, R.; Gargiulo, C.; Tremiterra, M.R.; Zucaro, F. Smart Mobility in Italian Metropolitan Cities: A Comparative Analysis through Indicators and Actions. Sustain. Cities Soc. 2018, 41, 556–567. [Google Scholar] [CrossRef]
  13. Benevolo, C.; Dameri, R.P.; D’Auria, B. Smart Mobility in Smart City Action Taxonomy, ICT Intensity and Public Benefits. In Lecture Notes in Information Systems and Organisation; Springer: Berlin/Heidelberg, Germany, 2016; Volume 11, pp. 13–28. [Google Scholar]
  14. Caragliu, A.; del Bo, C.; Nijkamp, P. Smart Cities in Europe. J. Urban Technol. 2011, 18, 65–82. [Google Scholar] [CrossRef]
  15. Yigitcanlar, T.; Foth, M.; Kamruzzaman, M. Towards Post-Anthropocentric Cities: Reconceptualizing Smart Cities to Evade Urban Ecocide. J. Urban Technol. 2019, 26, 147–152. [Google Scholar] [CrossRef]
  16. Al-Thawadi, F.E.; Banawi, A.A.A.; Al-Ghamdi, S.G. Social Impact Assessment towards Sustainable Urban Mobility in Qatar: Understanding Behavioral Change Triggers. Transp. Res. Interdiscip. Perspect. 2021, 9, 8. [Google Scholar] [CrossRef]
  17. Banister, D. The Sustainable Mobility Paradigm. Transp. Policy 2008, 15, 73–80. [Google Scholar] [CrossRef]
  18. Barón, G.N. La transición urbana y social hacia un paradigma de movilidad sostenible. Cuad. Cent. Estud. Diseño Comun. 2020, 153–172. [Google Scholar] [CrossRef]
  19. Caroleo, B.; Morelli, N.; Lissandrello, E.; Vesco, A.; Dio, S.D.; Mauro, S. Measuring the Change Towards More Sustainable Mobility: MUV Impact Evaluation Approach. Systems 2019, 7, 30. [Google Scholar] [CrossRef]
  20. Danielis, R.; Rotaris, L.; Monte, A. Composite Indicators of Sustainable Urban Mobility: Estimating the Rankings Frequency Distribution Combining Multiple Methodologies. Int. J. Sustain. Transp. 2018, 12, 380–395. [Google Scholar] [CrossRef]
  21. Joumard, R.; Gudmundsson, H. Indicators of Environmental Sustainability in Transport: An Interdisciplinary Approach to Methods; Les Collections de l’INRETS: Bron, France, 2010; p. 427. ISBN 978-2-85782-684-2. [Google Scholar]
  22. Leśniewski, M.; Świąder, M.; Kaczmarek, I.; Castro, D.G.; Kamińska, J.A.; Pilawka, T.; Kazak, J.K. Towards Transit-Oriented Development for Sustainable Urban Mobility: Insights from a Central European City. Geomat. Environ. Eng. 2021, 15, 39–53. [Google Scholar] [CrossRef]
  23. Regmi, M.B. Measuring Sustainability of Urban Mobility: A Pilot Study of Asian Cities. Case Stud. Transp. Policy 2020, 8, 1224–1232. [Google Scholar] [CrossRef]
  24. Zietsman, J.; Rilett, L.R. Sustainable Transportation: Conceptualization and Performance Measures; Texas Transportation Institute; College Station: Texas, TX, USA, 2002; pp. 1–165. [Google Scholar]
  25. Lyons, G. Getting Smart about Urban Mobility – Aligning the Paradigms of Smart and Sustainable. Transp. Res. Part Policy Pract. 2018, 115, 4–14. [Google Scholar] [CrossRef]
  26. Miller, P.; de Barros, A.G.; Kattan, L.; Wirasinghe, S.C. Analyzing the Sustainability Performance of Public Transit. Transp. Res. Part Transp. Environ. 2016, 44, 177–198. [Google Scholar] [CrossRef]
  27. Canal, A.; César Pinto, P.; Vicente Filipak Vanin, D.; Isabel Hentges, T. Applying the Index of Sustainable Urban Mobility (I_SUM) in a Planned Small City: The Case of Itá, Brazil. Case Stud. Transp. Policy 2023, 14, 101109. [Google Scholar] [CrossRef]
  28. Zapolskytė, S.; Trépanier, M.; Burinskienė, M.; Survilė, O. Smart Urban Mobility System Evaluation Model Adaptation to Vilnius, Montreal and Weimar Cities. Sustainability 2022, 14, 715. [Google Scholar] [CrossRef]
  29. Angarita Lozano, D.L.; Diaz Marquez, S.E.; Morales Puentes, M.E. Sustainable and Smart Mobility Evaluation since Citizen Participation in Responsive Cities. Transp. Res. Procedia 2021, 58, 519–526. [Google Scholar] [CrossRef]
  30. Moreno, C. Vie Urbaine et Proximité à l’heure Du COVID-19; l’Observatoire/Humensis: Paris, France, 2020; p. 188. ISBN 979-10-329-1777-0. [Google Scholar]
  31. Rupprecht, S.; Brand, L.; Böhler-Baedecker, S.; Brunner, L.M. Guidelines for Developing and Implementing a Sustainable Urban Mobility Plan; Rupprecht Consult: Cologne, Germany, 2019; p. 168. [Google Scholar]
  32. Ministerio de Transporte de Colombia. Resolución 20203040015885; Ministerio de Transporte de Colombia: Bogotá, Colombia, 2020; p. 34. [Google Scholar]
  33. Goepel, K.D. Implementation of an Online Software Tool for the Analytic Hierarchy Process (AHP-OS). Int. J. Anal. Hierarchy Process 2018, 10, 469–487. [Google Scholar]
  34. Damidavičius, J.; Burinskienė, M.; Antuchevičienė, J. Assessing Sustainable Mobility Measures Applying Multicriteria Decision Making Methods. Sustainability 2020, 12, 6067. [Google Scholar] [CrossRef]
  35. Haddad, C.A.; Fu, M.; Straubinger, A.; Plötner, K.; Antoniu, C. Choosing Suitable Indicators for the Assessment of Urban Air Mobility: A Case Study of Upper Bavaria, Germany. Eur. J. Transp. Infrastruct. Res. 2020, 20, 214–232. [Google Scholar] [CrossRef]
  36. Angarita-Lozano, D.; Rodriguez-Hernández, A.; Mendoza-Moreno, M.; Díaz-Marquez, S.; Morales-Puentes, M. Responsive Mobility (Evaluación de La Movilidad). Available online: https://www.responsivemobility.com (accessed on 13 December 2023).
  37. Alonso, A.; Monzón, A.; Cascajo, R. Comparative Analysis of Passenger Transport Sustainability in European Cities. Ecol. Indic. 2015, 48, 578–592. [Google Scholar] [CrossRef]
  38. Burinskienė, M.; Gaučė, K.; Damidavičius, J. Successful Sustainable Mobility Measures Selection. In Proceedings of the 10th International Conference on Environmental Engineering, ICEE 2017, Vilnius, Lithuania, 27–28 April 2017; p. 7. [Google Scholar]
  39. Jeon, C.M.; Amekudzi, A.A.; Guensler, R.L. Sustainability Assessment at the Transportation Planning Level: Performance Measures and Indexes. Transp. Policy 2013, 25, 10–21. [Google Scholar] [CrossRef]
  40. Motos Cascales, G. Análisis de Indicadores de Movilidad Urbana Sostenible. Master´s Thesis, Universidad Politécnica de Cartagena, Cartagena, España, 2019; p. 134. [Google Scholar]
  41. Santos, A.S.; Ribeiro, S.K. The Use of Sustainability Indicators in Urban Passenger Transport during the Decision-Making Process: The Case of Rio de Janeiro, Brazil. Curr. Opin. Environ. Sustain. 2013, 5, 251–260. [Google Scholar] [CrossRef]
  42. Sdoukopoulos, A.; Pitsiava-Latinopoulou, M.; Basbas, S.; Papaioannou, P. Measuring Progress towards Transport Sustainability through Indicators: Analysis and Metrics of the Main Indicator Initiatives. Transp. Res. Part Transp. Environ. 2019, 67, 316–333. [Google Scholar] [CrossRef]
  43. Bebber, S.; Libardi, B.; De Atayde Moschen, S.; Correa da Silva, M.B.; Cristina Fachinelli, A.; Nogueira, M.L. Sustainable Mobility Scale: A Contribution for Sustainability Assessment Systems in Urban Mobility. Clean. Eng. Technol. 2021, 5, 100271. [Google Scholar] [CrossRef]
  44. Perra, V.M.; Sdoukopoulos, A.; Pitsiava-Latinopoulou, M. Evaluation of Sustainable Urban Mobility in the City of Thessaloniki. Transp. Res. Procedia 2017, 24, 329–336. [Google Scholar] [CrossRef]
  45. Guimarães, J.G.d.A. Cidades Inteligentes: Proposta de Um Modelos Brasileiro Multi Ranking de Classificação. Ph.D. Thesis, Universidade de São Paulo, São Paulo, Brazil, 2018; p. 278. [Google Scholar]
  46. Shiau, T.A.; Huang, M.W.; Lin, W.Y. Developing an Indicator System for Measuring Taiwan’s Transport Sustainability. Int. J. Sustain. Transp. 2014, 9, 81–92. [Google Scholar] [CrossRef]
  47. Gillis, D.; Semanjski, I.; Lauwers, D. How to Monitor Sustainable Mobility in Cities? Literature Review in the Frame of Creating a Set of Sustainable Mobility Indicators. Sustainability 2016, 8, 29. [Google Scholar] [CrossRef]
  48. Mahdinia, I.; Habibian, M.; Hatamzadeh, Y.; Gudmundsson, H. An Indicator-Based Algorithm to Measure Transportation Sustainability: A Case Study of the U.S. States. Ecol. Indic. 2018, 89, 738–754. [Google Scholar] [CrossRef]
  49. Sdoukopoulos, A.; Pitsiava-Latinopoulou, M. Assessing Urban Mobility Sustainability through a System of Indicators: The Case of Greek Cities. WIT Trans. Ecol. Environ. 2017, 226, 617–631. [Google Scholar] [CrossRef]
  50. Huertas, J.I.; Stöffler, S.; Fernández, T.; García, X.; Castañeda, R.; Serrano-guevara, O.; Mogro, A.E.; Alvarado, D.A. Methodology to Assess Sustainable Mobility in LATAM Cities. Appl. Sci. 2021, 11, 34. [Google Scholar] [CrossRef]
  51. Litman, T. Developing Indicators for Sustainable and Livable Transport Planning; Victoria Transport Policy Institute: Victoria, BC, Canada, 2021; p. 116. [Google Scholar]
  52. Medina, J.C.; Pinho de Sousa, J.; Jimenez Perez, E. Defining and Prioritizing Indicators to Assess the Sustainability of Mobility Systems in Emerging Cities. In Proceedings of the Advances in Mobility-as-a-Service Systems; Nathanail, E.G., Adamos, G., Karakikes, I., Eds.; Springer International Publishing: Berlin/Heidelberg, Germany, 2021; Volume 1278, pp. 616–625. [Google Scholar]
  53. Jeon, C.M.; Amekudzi, A. Addressing Sustainability in Transportation Systems: Definitions, Indicators, and Metrics. J. Infrastruct. Syst. 2005, 11, 31–50. [Google Scholar] [CrossRef]
  54. Sharifi, A. A Typology of Smart City Assessment Tools and Indicator Sets. Sustain. Cities Soc. 2020, 53, 101936. [Google Scholar] [CrossRef]
  55. Lopez-Carreiro, I.; Monzon, A. Evaluating Sustainability and Innovation of Mobility Patterns in Spanish Cities. Analysis by Size and Urban Typology. Sustain. Cities Soc. 2018, 38, 684–696. [Google Scholar] [CrossRef]
  56. United Nations; ESCAP. Assessment of Urban Transport System; ESCAP: Bangkok, Thailand, 2017; p. 78. ISBN 978-92-1-362888-1. [Google Scholar]
  57. European Commission. Sustainable Urban Mobility Indicators: Harmonisation Guideline; European Commission: Brussels, Belgium, 2020; p. 25. [Google Scholar]
  58. ISO 37120:2018; Sustainable Cities and Communities—Indicators for City Services and Quality of Life. International Organization for Standardization: Genève, Switzerland, 2018; p. 121.
  59. Chestnut, J.; Associate, R.; Mason, J. Indicators for Sustainable Mobility; Institute for Transportation and Development Policy ITDP: New York, NY, USA, 2019; p. 44. [Google Scholar]
  60. WBCSD. Methodology and Indicator Calculation Method for World Business Council for Sustainable Development Sustainable Mobility Project 2.0 (SMP2.0) Indicators Work Stream Sustainable Urban Mobility; World Business Council for Sustainable Development: Geneva, Switzerland, 2020; p. 64. [Google Scholar]
  61. Tafidis, P.; Sdoukopoulos, A.; Pitsiava-Latinopoulou, M. Sustainable Urban Mobility Indicators: Policy versus Practice in the Case of Greek Cities. Transp. Res. Procedia 2017, 24, 304–312. [Google Scholar] [CrossRef]
  62. Luzzati, T.; Gucciardi, G. A Non-Simplistic Approach to Composite Indicators and Rankings: An Illustration by Comparing the Sustainability of the EU Countries. Ecol. Econ. 2015, 113, 25–38. [Google Scholar] [CrossRef]
  63. Jain, D.; Tiwari, G. Sustainable Mobility Indicators for Indian Cities: Selection Methodology and Application. Ecol. Indic. 2017, 79, 310–322. [Google Scholar] [CrossRef]
  64. Macedo, J.; Rodrigues, F.; Tavares, F. Urban Sustainability Mobility Assessment: Indicators Proposal. In Proceedings of the Energy Procedia; Elsevier Ltd.: Chania, Greece, 2017; Volume 134, pp. 731–740. [Google Scholar]
  65. Schmale, J.; von Schneidemesser, E.; Dörrie, A. An Integrated Assessment Method for Sustainable Transport System Planning in a Middle Sized German City. Sustainability 2015, 7, 1329–1354. [Google Scholar] [CrossRef]
  66. Filippi, F. A Paradigm Shift for a Transition to Sustainable Urban Transport. Sustainability 2022, 14, 2853. [Google Scholar] [CrossRef]
  67. Ortúzar, J.d.D. Sustainable Urban Mobility: What Can Be Done to Achieve It? J. Indian Inst. Sci. 2019, 99, 683–693. [Google Scholar] [CrossRef]
  68. Olofsson, Z.; Hiselius, L.; Várhelyi, A. Development of a Tool to Assess Urban Transport Sustainability: The Case of Swedish Cities. Int. J. Sustain. Transp. 2016, 10, 645–656. [Google Scholar] [CrossRef]
  69. Loorbach, D.; Schwanen, T.; Doody, B.J.; Arnfalk, P.; Langeland, O.; Farstad, E. Transition Governance for Just, Sustainable Urban Mobility: An Experimental Approach from Rotterdam, the Netherlands. J. Urban Mobil. 2021, 1, 100009. [Google Scholar] [CrossRef]
  70. Docherty, I.; Marsden, G.; Anable, J. The Governance of Smart Mobility. Transp. Res. Part Policy Pract. 2018, 115, 114–125. [Google Scholar] [CrossRef]
  71. Cirolia, L.R.; Harber, J.; Croese, S. Governing Mobility in Sub-Saharan African Cities; The Volvo Research and Educational Foundations, VREF: Gothenburg, Sweden, 2020; p. 37. [Google Scholar]
  72. Arellana, J.; Oviedo, D.; Guzman, L.A.; Alvarez, V. Urban Transport Planning and Access Inequalities: A Tale of Two Colombian Cities. Res. Transp. Bus. Manag. 2021, 40, 100554. [Google Scholar] [CrossRef]
  73. Venter, C.; Mahendra, A.; Hidalgo, D. From Mobility to Access for All: Expanding Urban Transportation Choices in the Global South; Cities for all; World Resources Institute: Washington, DC, USA, 2019; p. 48. [Google Scholar]
  74. Saaty, T. Toma de Decisiones Para Líderes. El Proceso Analítico Jerárquico; RWS Publications; University of Pittsburgh: Pittsburgh, PA, USA, 2014; p. 415. ISBN 978-1-8888603-29-3. [Google Scholar]
  75. Pacheco, J.F.; Contreras, E. Manual Para La Evaluación Multicriterio Para Programas y Proyectos; CEPAL, Ed.; United Nations CEPAL: Santiago de Chile, Chile, 2008; p. 111. ISBN 978-92-1-323231-6. [Google Scholar]
  76. MINTIC—Ministerio de Tecnologías de la Información y Comunicaciones de Colombia. Modelo de Medición de Madurez de Ciudades y Territorios Inteligentes Para Colombia; MINTIC: Bogotá, Colombia, 2021; pp. 1–36. [Google Scholar]
  77. Departamento Nacional de Planeación—DNP. Sistema de Ciudades: Una Política Nacional Para El Sistema de Ciudades Colombiano Con Visión a Largo Plazo; Departamento Nacional de Planeación—DNP: Bogotá, Colombia, 2014; p. 154. [Google Scholar]
  78. Departamento Administrativo Nacional de Estadística. Proyecciones y Retroproyecciones de Población Municipal Para El Periodo 1985-2019 y 2020–2035 Con Base En El CNPV 2018; Departamento Administrativo Nacional de Estadística: Bogotá, Colombia, 2023. [Google Scholar]
  79. Romero Torres, J.; Sánchez, N.; Bautista Lara, E. Percepción de La Satisfacción Del Servicio En El Transporte Público Solo Para Mujeres. Rev. Transp. Territ. 2016, 164–182. [Google Scholar] [CrossRef]
  80. Agencia Nacional de Seguridad Vial Observatorio Nacional de Seguridad Vial. Available online: https://ansv.gov.co/es/observatorio/estadísticas (accessed on 13 December 2022).
  81. Departamento Administrativo Nacional de Estadística Censo Nacional de Población y Vivienda. 2018. Available online: https://www.dane.gov.co/index.php/estadisticas-por-tema/demografia-y-poblacion (accessed on 20 December 2022).
  82. Alcaldía de Ibagué. Decreto 0835 de 2022 Plan Maestro de Movilidad y Espacio Público de Ibagué; Alcaldía de Ibagué: Ibagué, Colombia, 2022; Volume 0835–2022, p. 8. [Google Scholar]
  83. Alcaldía de Tunja. Plan de Ordenamiento Territorial de Tunja; Alcaldía de Tunja: Tunja, Colombia, 2022. [Google Scholar]
  84. Goss-Sampson, M. Análisis Estadístico Con JASP: Una Guía Para Estudiantes; Universitat Oberta de Catalunya: Barcelona, Spain, 2019; p. 132. [Google Scholar]
  85. Ventura-León, J.; Caycho-Rodriguez, T. El Coeficiente Omega: Un Método Alternativo Para La Estimación de La Confiabilidad. Rev. Latinoam. Cienc. Soc. Niñez Juv. 2017, 15, 625–627. [Google Scholar]
  86. Campo-Arias, A.; Oviedo, H. Propiedades Psicométricas de Una Escala: La Consistencia Interna. Rev. Salud Pública 2008, 10, 831–839. [Google Scholar] [CrossRef]
  87. Rico Ospina, L.P. Estudio de Emisiones de Gases de Efecto Invernadero Relacionadas Con La Implementación de Autobuses Eléctricos En La Flota de Transporte Urbano Colectivo de La Ciudad de Ibagué. Master´s Thesis, Universidad Nacional de Colombia, Bogotá, Colombia, 2021. [Google Scholar]
  88. Sheller, M.; Urry, J. The New Mobilities Paradigm. Environ. Plan. A 2006, 38, 207–226. [Google Scholar] [CrossRef]
  89. Watson, V. Seeing from the South: Refocusing Urban Planning on the Globe’s Central Urban Issues. Urban Stud. 2009, 46, 2259–2275. [Google Scholar] [CrossRef]
  90. Oviedo Hernandez, D.; Dávila, J.D. Transport, Urban Development and the Peripheral Poor in Colombia—Placing Splintering Urbanism in the Context of Transport Networks. J. Transp. Geogr. 2016, 51, 180–192. [Google Scholar] [CrossRef]
  91. Dimitriou, H.T. Towards a Generic Sustainable Urban Transport Strategy for Middle-Sized Cities in Asia: Lessons from Ningbo, Kanpur and Solo. Habitat Int. 2006, 30, 1082–1099. [Google Scholar] [CrossRef]
Figure 2. Evaluation model for sustainable and smart urban mobility.
Sustainability 17 04684 g002
Figure 3. Evaluation of sustainable and intelligent mobility by citizen perception in Ibagué and Tunja.
Sustainability 17 04684 g003
Figure 4. Evaluation of sustainable and smart mobility by measuring authority and online data in Ibagué and Tunja.
Sustainability 17 04684 g004
Figure 5. Evaluation results of citizen-centred sustainable and smart mobility.
Sustainability 17 04684 g005
Figure 6. Maturity level of the study cities.
Sustainability 17 04684 g006
Table 1. Comparative analysis of global mobility assessment models focused on fundamental characteristics, implementation characteristics, and contextual relevance.
Fundamental CharacteristicsImplementation CharacteristicsContextual Relevance
FrameworkOrigin and Institutional BackingGeographic FocusTarget AudienceData RequirementsCitizen Perception IntegrationAdaptability to Data ConstraintsScalability Across City SizesGlobal South AdaptabilityPractical Implementation EvidenceMaturity Assessment Capability
SUTI [56]United Nations, 2017Asian citiesCity planners, local authoritiesHighLimited (some satisfaction surveys)Limited adaptabilityFocused on Asian citiesLimited (Asian focus)Applied in Asian citiesLimited (project assessment focus)
SUMI [57]European Commission, 2017European Union citiesMunicipal authorities, E.U. institutionsVery high (detailed transport data)Limited (some satisfaction surveys)Low (designed for data-rich environments)Better for larger citiesLimited (designed for E.U. context)Extensive in E.U.Moderate (benchmarking capability)
ISO 37120 [58]International Organization for Standardization, 2018Global citiesMunicipal governments, standard bodiesHigh (standardized data)Not includedLow (rigid requirements)Adaptable but resource-intensive for small citiesModerate (global standard)Global application but limited in developing regionsLimited (certification levels only)
Transport System Indicators [42]Academic research, 2019Developed countriesStakeholdersHighNot includedLowMedium to large citiesStrong (global application)Not includedNot included
ITDP Indicators [59]Institute for Transportation and Development Policy, 2019Global citiesUrban planners, developers, municipalitiesModerate (focused on built environment)Not includedModerate (visual assessments possible)Applicable to neighbourhoods in any size cityStrong (global application)Limited to U.S. citiesNot included
WBCSD Sustainable Mobility 2.0 [60]World Business Council for Sustainable Development, 2015Global citiesBusinesses, city officialsHighLimited (some satisfaction surveys)LowLarger city focusModerateNot includedLimited (targets without stages)
Table 2. Comparative analysis of global mobility assessment models centred on structural elements and content focus.
Structural ElementsContent Focus
FrameworkDimensional StructureAssessment MethodologyWeighting ApproachEnvironmental DimensionSocial DimensionEconomic DimensionGovernance DimensionSmart/Technological Integration
SUTI [56] 4 dimensions (economic, environmental, social, transport system)Quantitative metricsEqual weightingModerate (air quality, GHG emissions)Strong (access, safety)Limited (operational metrics)Not includedNot included
SUMI [57]9 areasPrimarily quantitativeTheme-based weightsStrong (emissions, energy, noise)Moderate (accessibility, safety)Moderate (congestion costs)Limited to planning aspectsModerate (ITS, shared mobility)
ISO 37120 [58]19 themes (transport is one section)Standardized quantitative metricsNo explicit weightingModerate (air quality, GHG, noise)Moderate (standard safety metrics)Limited (operational metrics)Not included in transportLimited technical indicators
Transport System Indicators [42]3 pillars (economic, environmental, social)QuantitativeNo explicit weightingStrong (emissions, noise, energy)Limited (population characteristics)Moderate (transport cost, subsidies)Limited governance considerationsMinimal technology focus
ITDP Indicators [59]3 categories (proximity to transit, accessibility, and city characteristics)Point-based scoring systemVaried points per metricModerate (walking, biking)Strong (walkability, accessibility)Moderate (low-income households rapid or frequent transit)Not includedMinimal technology focus
WBCSD Sustainable Mobility 2.0 [60]4 areasPoint-based scoring systemEqual weightingStrong (emissions, energy, GHG)Strong (access, safety)Strong (productivity, economic opportunity)Implicit in implementationModerate (optimized utilization)
Table 3. Weighting of the four dimensions (n = 16).
DimensionPriorityRank
Social34.1%1
Governance23.9%2
Environmental23.6%3
Economic18.5%4
Table 4. The weighting of the eight sub-dimensions and 36 indicators (n = 16).
DimensionSubdimensionPriorityRankIndicatorsPriorityRank
Social Affordability19.9%1
Length of pedestrian roads14.9%2
Modal share14.2%3
Livability71.9%1Availability of public spaces13.6%4
Length of public transport roads13.4%5
Length of bike lanes12.0%6
Population density11.9%7
Social Universal accessibility31.9%1
Gender Perspective28.1%2Safe mobility31.7%2
Care mobility22.7%3
Night mobility13.7%4
Governance Integrated and inclusive planning37.3%1
Participatory Mobility Planning75.5%1Equitable and participatory mobility24.6%2
Citizen monitoring and observatories22.5%3
Participatory budget15.7%4
Governance Advanced transport planning based on updates39.8%1
Smart Mobility24.5%2Real-time measurement and open data35.0%2
Mobility technology applications available25.2%3
EnvironmentalGlobal Environment61.2%1Climate change adaptation measures55.5%1
Greenhouse gas (GHG) inventor44.5%2
Environmental Energy efficiency policies20.3%1
Air quality index15.9%2
Air quality standards14.53
Environmental Quality38.8%2Green areas14.2%4
Regulations on noise pollution12.1%5
Smart technologies in transport12.0%6
Natural–historical–cultural heritage preservation11.0%7
Economic Reduced traffic deaths49.4%1
Security60.0%1Reduced traffic accidents35.2%2
Reduced crime rate in transport15.4%3
Economic Public subsidies to the transport system25.6%1
Clean energy in public transport19.4%2
Operational Performance40.0%2Vehicles with zero or low emissions17.4%3
Average age of the public transport fleet13.0%4
Last-mile green logistics12.3%5
Public transport fleet size12.3%6
Table 5. Description of maturity level.
Maturity LevelLevel 1Level 2Level 3Level 4Level 5
By citizen perceptionCitizens perceive that the indicators used to evaluate the city’s mobility have worsened and/or affected their quality of life.Citizens do not observe any progress in the indicators used to evaluate the city’s mobility.
At least two assessed dimensions are noted, and the evaluation score is lower than 3.
Citizens perceive a modest improvement in the metrics utilized to assess the city’s mobility.
An evaluation exceeding 3 is achieved in a minimum of two of the assessment dimensions.
Citizens observe improvements in mobility assessment indicators; however, these advancements do not directly influence their quality of life.
A minimum score of 4.0 must be achieved in two or more evaluated dimensions.
Citizens perceive significant progress in the indicators for evaluating the city’s sustainable and intelligent mobility, which is evidenced in its quality of life.
An evaluation higher than 4.0 is obtained in the four dimensions evaluated.
By measuring resultsThe evaluation indicators show poor planning and management of city mobility, which worsens the associated problems.The evaluation indicators show the absence of sustainable and intelligent criteria in the planning and management of city mobility.Evaluation indicators show little significant progress towards achieving sustainable and intelligent mobility. Its results are not enough to solve the associated problems.Evaluation indicators demonstrate considerable progress in planning and managing sustainable and intelligent urban development mobility.The evaluation indicators show that the pillars of sustainability and citizen participation support the planning and management of urban mobility.
GeneralVery lowLowMediumHighVery high
Table 6. Overview of key features of the proposed model.
CharacteristicProposed Model
Fundamental CharacteristicsOrigin and Institutional BackingAcademic research, 2023
Geographic FocusGlobal South cities
Target AudienceCity officials, planners, citizens
Structural ElementsDimensional Structure4 dimensions (environmental, social, economic, governance)
Assessment MethodologyMixed methods (quantitative + perception)
Weighting ApproachAHP expert-derived weights
Content FocusEnvironmental DimensionStrong (global + local impacts)
Social DimensionStrong (livability, gender perspective)
Economic DimensionStrong (operational, safety)
Governance DimensionStrong (dedicated dimension)
Smart/Technological IntegrationStrong (smart mobility sub-dimension)
Implementation CharacteristicsData RequirementsModerate
Citizen Perception IntegrationStrong (dedicated perception surveys)
Adaptability to Data ConstraintsHigh (adaptable to available data)
Scalability Across City SizesHigh (adaptable to different city scales)
Contextual RelevanceGlobal South AdaptabilityVery strong (Global South focus)
Practical Implementation EvidenceCase studies in Colombian cities
Maturity Assessment CapabilityStrong (5-level maturity scale)
Disclaimer/Publisher’s Note: The statements, opinions and data contained in all publications are solely those of the individual author(s) and contributor(s) and not of MDPI and/or the editor(s). MDPI and/or the editor(s) disclaim responsibility for any injury to people or property resulting from any ideas, methods, instructions or products referred to in the content.

