1. Introduction
China’s accelerated urbanization and motorization have precipitated sustained growth in private vehicle ownership. However, systemic deficiencies in the coordinated planning, construction, and governance of parking infrastructure have perpetuated a structural supply–demand imbalance. This phenomenon ultimately validates the “Downs’s Law” paradigm [
1], characterized by a self-reinforcing cycle of “parking scarcity → infrastructure expansion → recurrent scarcity”. As a critical transportation policy, parking allocation criteria regulate the minimum parking requirements for urban developments to ensure supply adequacy. Yet, the rational implementation of such criteria has remained a persistent challenge in planning practice. Shoup previously identified excessive standards as catalysts for traffic congestion, car dependency, and urban sprawl [
2]. Empirical evidence from Pasadena’s historical downtown further demonstrates how parking provision standards significantly influence central urban decay/revitalization dynamics [
3].
Public transportation accessibility constitutes a critical dimension influencing parking demand and supply. To advance transit-oriented development (TOD) and balance automobile–transit resource allocation, academic research and planning practices globally have explored parking provision standard reductions. Li et al. [
4], through interpreting China’s Urban Parking Planning Code, proposed reducing parking requirements in central urban areas and transit-rich zones for travel demand management. Zhu et al. [
5] developed optimization methods for superhighrise-buildings’ parking standards based on public transportation accessibility and service capacity assessments. Pan et al. [
6] documented UK cases, where the maximum parking provisions are scaled according to public transportation accessibility tiers. “The London Plan 2021” further institutionalized this approach by establishing a correspondence matrix between parking standards and public transportation accessibility levels (PTALs) [
7], advocating car-free policies (zero-parking provisions) in high-PTAL areas.
The implementation of parking allocation reduction primarily targets areas within distinct parking management zones and surrounding metro stations, with actual reduction ratios converging within a narrow range (typically 10–30%). Regarding zonal control, Deng et al. [
8] established parking subzones based on public transportation accessibility metrics measured at the parcel scale through a public transportation convenience assessment model. Zhang et al. [
9] emphasized that zoning principles should integrate public transportation service-level evaluations, as reflected in the revised Guangzhou Parking Allocation Standards for Construction Projects. Proximity to metro stations significantly reduces parking demand for adjacent buildings compared to those in other areas, attributable to enhanced metro ridership potential [
10]. Tang et al. [
11] developed a TOD composite index quantifying nodes, places, and linkage dimensions, subsequently proposing a computational framework to determine parking allocation adjustments for station-adjacent developments. Many Chinese cities have incorporated parking allocation reductions for public buildings near metro stations into their regulatory documents (
Table 1). However, after these standards were publicly announced and implemented, no explanations were provided regarding their data sources or sample representativeness, leading to blind replication across cities and the eventual homogenization of indicators. Furthermore, reduction coefficients derived from parking supply–demand surveys solely focus on parking generation rates, relying on oversimplified calculation methods without rigorous analytical validation. Therefore, enhancing the scientific rigor and methodological robustness of reduction factor calculations is imperative.
In summary, although the concept of optimizing parking allocation standards according to public transportation accessibility has gained broad recognition, the determination of reduction coefficients remains theoretically underdeveloped. Although numerous scholars have proposed specific methodological models, their practical applicability is often compromised by excessive complexity or data scarcity, resulting in the absence of a scientific, concise, and transparent computational framework.
To address this gap, this study introduces a reduction coefficient estimation method grounded in public transportation accessibility (measured as public transportation travel time). Utilizing residents’ travel survey data, we construct a multinomial logit model and incorporate economic analysis approaches from parking management research [
12]. The cross-elasticity of the automobile travel probability relative to the public transportation travel time serves as the pivotal mechanism for translating accessibility gains to parking reductions. An empirical analysis is conducted in Nanjing’s central urban area to validate this methodology. This research provides a referential framework for formulating parking allocation policies for public buildings, facilitating the rational allocation of urban transportation resources and advancing transit-oriented urban development.
2. Materials and Methods
To ensure the scientific rigor and validity of the conclusions, this section delineates the study area and verifies the reliability and applicability of the data. The central urban area of Nanjing is designated as the primary empirical research site, with its spatial boundaries and key characteristics explicitly defined. Concurrently, the data sources—including mobile phones’ signaling data, route-planning data, and household travel survey data—are thoroughly documented, with their credibility and usability rigorously validated. This establishes a robust foundation for subsequent calculations of parking allocation reduction coefficients.
2.1. Study Area
Nanjing, a mega-city in the Yangtze River Delta, serves as the capital of Jiangsu Province and is a nationally designated historical and cultural city. As of 2022, the municipality administers eleven urban districts and one national-level new area (Jiangbei New Area), encompassing ninety-five subdistricts and six towns.
This study focuses on Nanjing’s central urban area, delineated in the drafted Nanjing Territorial Spatial Planning (2021–2035), comprising the traditional Jiangnan core and the emerging Jiangbei new core (
Figure 1). Spanning approximately 867 km
2, this region functions as Nanjing’s primary urban hub, accommodating 7.6 million permanent residents in 2022—80% of the city’s total population. Within the study area, 187 metro stations are operational (153 in Jiangnan and 34 in Jiangbei). Although current the bus-stop coverage remains robust, the metro network is undergoing rapid expansion, projected to reach 55% station coverage within an 800 m radius by 2035.
2.2. Data and Processing
- (1)
Mobile phones’ signaling data: This study utilizes mobile phones’ signaling data collected by China Unicom in June 2019. The raw data were expanded using the operator’s proprietary upscaling algorithm, with the identified population total demonstrating less than 5% deviation from Nanjing’s Seventh National Population Census data. The consistency with actual population distribution patterns confirms the research reliability of the identification results.
The mobile phones’ signaling data include identifiers (IDs) and origin–destination (OD) point coordinates. We mapped the OD coordinates to trips between 500 m × 500 m grid cells and aggregated inter-grid trip volumes. This process generated a grid-based spatial distribution of trip origins, destinations, and corresponding volumes across the central urban area of Nanjing.
- (2)
Path-planning data: These data were employed for public transportation accessibility calculations. Compared to conventional network-distance-based measurements performed based on vector maps and assumed velocities, API-derived travel times demonstrate enhanced accuracy by incorporating walking-to-station durations and waiting times [
13].
In this study, grid cell centroids were designated as origin and destination (OD) points. Their coordinates were input into Amap’s route-planning API to retrieve public transportation travel times between centroids and corresponding trip volumes within Nanjing’s central urban area from May 20 to 24, 2024.
- (3)
Household travel survey data. This research incorporates Nanjing’s 2018–2019 Household Travel Survey data, comprising two primary components: daily travel diaries and individual characteristic records. The former documents residents’ daily trip frequencies, OD locations, departure/arrival times, and transportation modes. The latter contains socioeconomic attributes, including gender, age, occupation, educational attainment, and monthly income, collectively forming a dataset of approximately 30,000 travel entries.
3. Methods
This section establishes a methodological framework to achieve a scientifically rigorous estimation of parking allocation reduction coefficients based on public transportation accessibility. First, a weighted-average accessibility model is introduced to precisely quantify public transportation accessibility. Subsequently, a multinomial logit model is constructed to analyze determinants influencing residents’ travel mode choices. Finally, the concept of the cross-elasticity of demand is integrated to establish a quantitative linkage between variations in the public transportation travel time and shifts in private-car-travel probability, thereby providing the analytical foundation for determining parking reduction coefficients and forming a comprehensive methodological pathway.
3.1. Weighted-Average Accessibility Model
The weighted-average travel time accessibility metric, initially proposed by Javier Gutiérrez in 1996 [
14], calculates the average travel time for each origin (O) by weighting trips to different destinations (Ds) based on their corresponding trip volumes. This model quantifies the average travel time cost for residents from a given origin to reach various destinations and has been widely applied in studies evaluating the impact of high-speed rail on regional accessibility [
15], as expressed in Equation (1).
where
is the value of the accessibility, expressed through the weighted-average travel time;
is the public transportation travel time from grid cells
to
, retrieved via Amap API’s route-planning interface; and
is the trip volume from grid cells
to
, derived from mobile phones’ signaling data.
In this study, public transportation travel times between grid cells were calculated using Amap’s route-planning API, which incorporates real-time traffic conditions, while inter-grid origin–destination trip volumes were processed from anonymized mobile phones’ signaling data through spatial aggregation algorithms. The calculated public transportation accessibility, represented by the weighted-average travel time, inversely correlates with accessibility (i.e., lower values indicate higher accessibility). Compared to traditional accessibility metrics based on spatial separation, this model more accurately reflects residents’ perceived travel experiences in real-world scenarios. Consequently, it provides a scientific foundation for implementing differentiated parking allocation standards in urban management.
3.2. Multinomial Logit Model
This study employs a multinomial logit model (MNL) to examine the probability of residents with varying socioeconomic attributes and travel characteristics selecting distinct travel modes. The dependent variable (travel mode) was categorized into five classes: walking (
), non-motorized transportation (
), public transportation (
), other modes (
), and private cars (
). The household travel survey data encompass various indicators, from which those closely relevant to this study were selected. In the socioeconomic attribute section, variables potentially influencing travel choices—particularly private car and public transit usages—were identified. Binary variables included gender, driver’s license possession, IC card possession, and household head status, while categorical variables comprised age, educational attainment, occupation, and travel purpose. Within travel behavior features, key cost-related metrics were prioritized, including travel cost and travel time. The independent variables are detailed in
Table 2.
The critical step in the MNL estimation involves the selection of the base category, as all the coefficients are estimated relative to this reference. Using private cars (
) as the base category, independent categorical variables were modeled, with their first category serving as the reference level, as formalized in Equation (2). This equation expresses the multivariate linear relationship between the natural logarithm of the odds ratio (for selecting alternative travel modes versus the private car mode) and the explanatory variables.
where
is the vector of the independent variables,
is the intercept term for the category,
is the kth independent variable (k = 1, 2, … 10), and
is the regression coefficient of the kth variable for category j.
Based on Equation (2), the probability of residents choosing public transportation is expressed in Equation (3), while the probability of selecting the private car mode is formulated in Equation (4). Through partial-derivative analysis in Equation (4), the cross-elasticity of the private car usage probability with respect to the public transportation travel time can be quantified, reflecting behavioral responses to public transportation service changes.
3.3. Cross-Elasticity of Demand
The cross-elasticity of demand, an economic metric, quantifies the percentage change in the quantity demanded/supplied of one commodity in response to a 1% price variation of a substitute or complementary good. Extending this concept to travel behavior, the cross-elasticity of residents’ travel demand is defined as the percentage change in the probability of selecting a specific travel mode induced by a 1% alteration in a determinant of an alternative mode [
16]. Based on the MNL framework, the cross-elasticity (
) of the private car usage probability with respect to the public transportation travel time (specifically, x
10 in mode
) can be formulated as in Equation (5).
Assuming all the other factors remain constant, the cross-elasticity of the private car usage probability
with respect to the public transportation travel time, x
10 (specifically in mode
), can be derived via the chain rule for the partial derivatives of composite functions, ultimately simplifying to Equation (6) [
17].
4. Results
4.1. Estimation of Parking Allocation Reduction Coefficients for Nanjing’s Central District
Building on the methodological framework and data foundation established in the preceding two sections, this section estimates parking allocation reduction coefficients for the central urban area of Nanjing. First, the weighted-average accessibility model is applied to calculate public transportation accessibility metrics, followed by comparative analysis to refine the parking zoning scheme. Then, by leveraging the multinomial logit model and cross-elasticity theory, reduction coefficients for Zone I and Zone II are derived using Zone III as the baseline. These results provide critical parameters for the precise allocation of urban parking resources.
4.1.1. Parking Zone Optimization Based on Public Transportation Accessibility
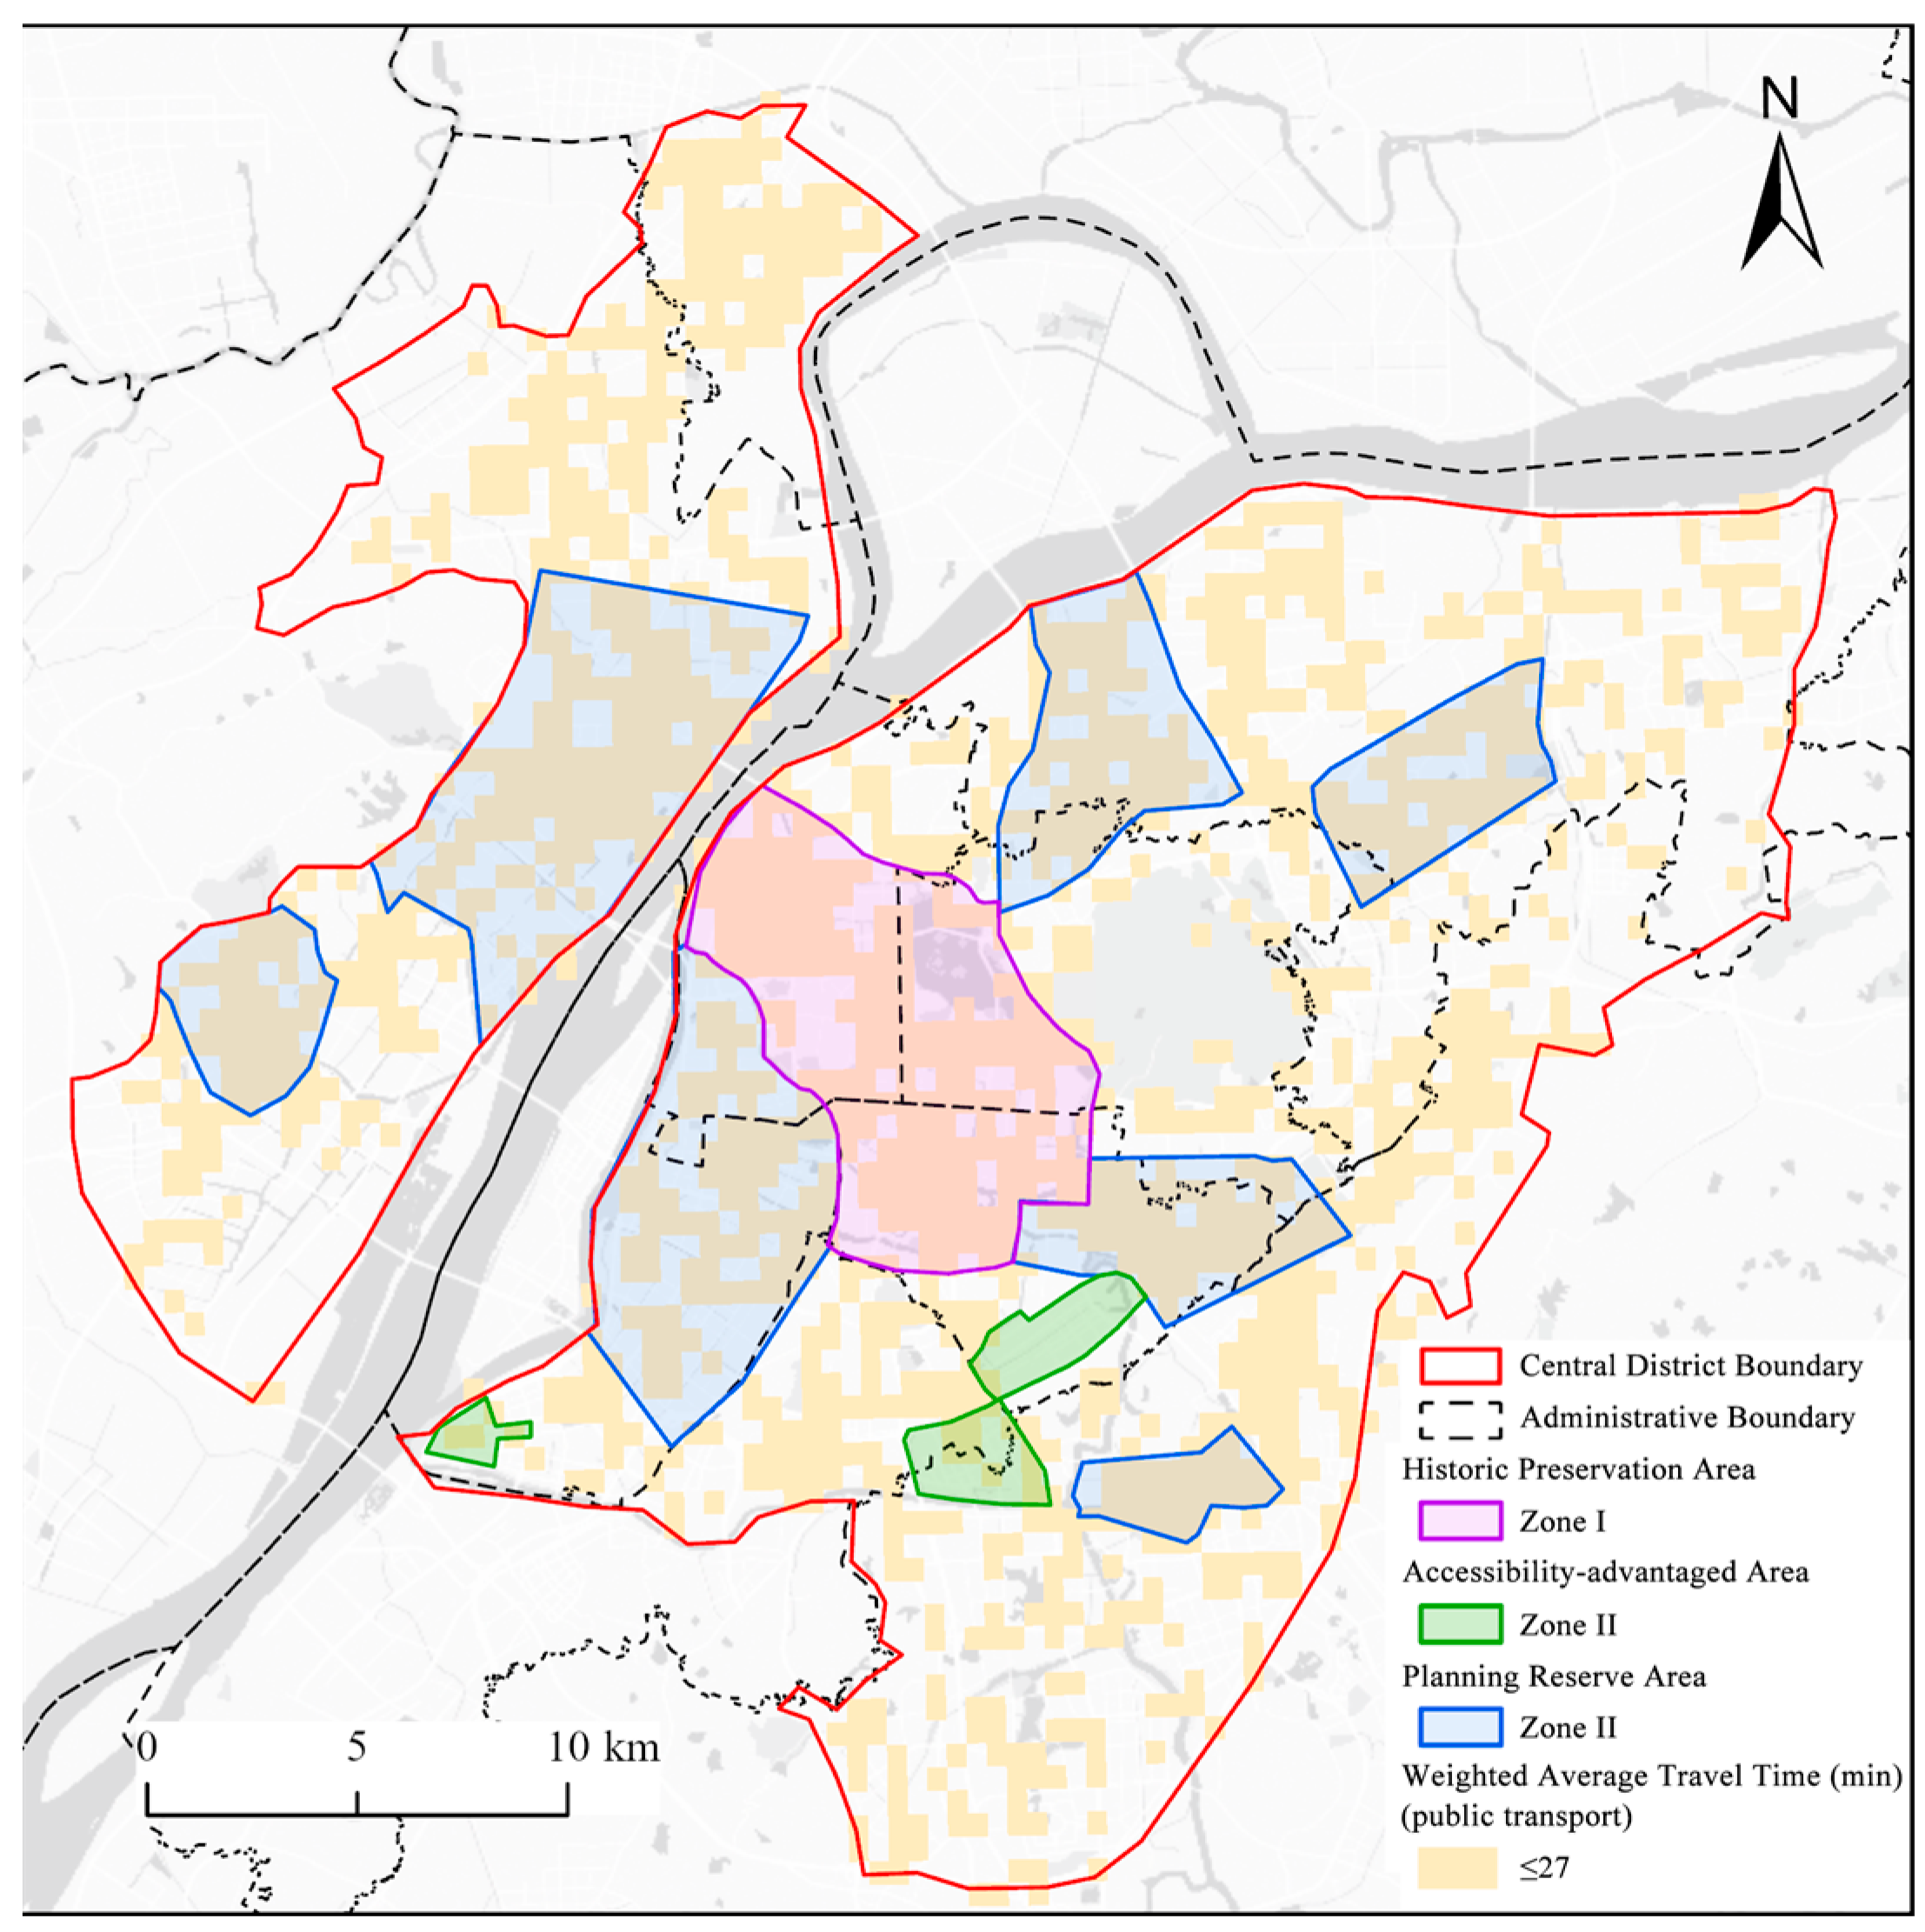
The weighted-average public transportation travel time for each grid cell within the study area was calculated as a proxy for public transportation accessibility, following Javier Gutiérrez’s method. A comparative analysis was conducted on the spatial distribution of the accessibility results and the current parking management zoning scheme (
Figure 1). Guided by the public transportation priority strategy, areas with higher public transportation accessibility should implement parking allocation reduction policies to limit private car usage by decreasing the parking supply. The overall analysis indicates that public transportation accessibility in the study area exhibits a spatial pattern characterized by
Higher accessibility in central districts and along metro corridors;
Lower accessibility in peripheral areas;
Relatively modest regional disparities.
Although the current Zone I, under the existing guidelines, substantially overlaps with high-accessibility areas, this classification demonstrates incomplete coverage and overly simplistic hierarchical differentiation.
This study optimizes the parking zoning scheme by integrating land-use dynamics and transportation conditions, utilizing a 27 min threshold (the 35th percentile) for accessibility stratification as follows:
Hierarchy Enrichment: Drawing on heritage preservation practices from Beijing and other historical Chinese cities, the Ming-City-Wall-enclosed historical preservation zone (with a moderate expansion) is designated as Zone I. Adjacent qualified areas become Zone II, with the remaining central urban areas as Zone III and extra-urban regions as Zone IV;
Subzone Refinement: Zone II is subdivided into planning reserve zones and accessibility-advantaged zones. Forward-looking parking allocation standards are applied to emerging development clusters to foster transit-oriented growth;
Boundary Adjustment: The current Zone I is expanded to include the Jiangbei Research and Innovation Park, from the Jiangbei Core Area to the High-Tech Zone, the Jianye Hexi Central District, Jiangning Dongshan, and Xianlin. The eastern and northern districts of Nanjing are upgraded to Zone II according to improved accessibility metrics.
4.1.2. Technical Workflow for Parking Allocation Reduction Estimation
Parking allocation reduction criteria in high-accessibility public transportation zones fundamentally induce modal shifts by decreasing the parking supply to diminish private cars’ convenience, thereby transitioning a portion of travelers to public transport. This behavioral shift is preconditioned on superior public transportation accessibility, which ensures feasible alternatives to car usage.
Stata 17.0 statistical software was used to analyze household travel survey data to estimate parameters for the MNL model of the travel mode choice. The regression coefficients of the independent variables are presented in
Table 3, quantifying their impacts on modal selection probabilities.
As shown in
Table 3, the travel time variable (x
10) exhibits statistical significance across all the travel modes. Substituting the regression coefficients into Equation (6), we calculated the cross-elasticity of the private car usage probability with respect to the public transportation travel time. This metric indicates that relative to the current average public transportation travel time, a 1% reduction in the public transportation travel time corresponds to a 0.628% decrease in the private car usage probability.
The elasticity’s magnitude varies at different baseline-travel-time levels. For instance, when the average public transportation travel time is reduced to 90% of the current level (T = 0.9 T), a further 1% reduction in travel time yields a 0.683% decline in the car usage probability. Similar calculations apply in other travel-time scenarios.
Table 4 further quantifies the probabilistic shifts in private car usage at various public transportation travel-time levels, as derived using the MNL model.
The reduction in the private-car-travel probability can theoretically be approximated as the parking allocation reduction ratio. This calculation involves three sequential steps as follows:
Accessibility Reduction Ratio: The percentage reduction in the public transportation travel time (accessibility metric) is computed for the target zones relative to the regional average.
Probability Conversion: The cross-elasticity derived from the demand’s elasticity analysis is applied to translate the travel time reduction to the decreased private car usage probability (Pr) for target zones, as formalized in Equation (7).
Standard Adjustment: The parking allocation reduction ratio (R) is determined by comparing Pr with the regional average car usage probability, as expressed in Equation (8), as follows:
where
is the average public transportation accessibility in target reduction zones,
is the average public transportation accessibility in baseline zones,
is the cross-elasticity coefficient corresponding to
, and
is the private-car-travel probability associated with
.
It should be noted that Equation (7) is derived from arc elasticity principles, and Equation (8) remains valid only for modest public transportation accessibility reductions (typically ≤10%) in target zones. As demonstrated in
Table 4, the cross-elasticity varies significantly across accessibility levels. Consequently, Equation (8) introduces substantial errors when handling accessibility reductions exceeding 10%. Drawing on empirical research thresholds, this study adopts a 10% accessibility reduction ceiling for the direct application of Equation (8). When the accessibility reduction exceeds 10%, the error introduced by Equation (8) becomes significant compared with the values in
Table 4, which shows the average public transportation accessibility levels and private-car-travel probabilities at different reduction ratios, as calculated using the MNL model for parking allocation.
where
is the value that is the closest to the specified percentages (90%, 80%, 70%, and 60%),
is the cross-elasticity coefficient corresponding to
, and
is the private-car-travel probability associated with
, as shown in
Table 4.
4.2. Case Study of Application of Parking Allocation Reduction in Nanjing’s Central District
This section focuses on the practical applications of parking allocation reduction policies. First, regarding zonal parking reductions, this study defines the reduction margins for the minimum parking requirements in Zone I and Zone II relative to Zone III baselines. Second, for parking reductions near metro stations, the proportional reductions in parking provision standards for public buildings are calculated across varying distance thresholds (e.g., 100 m, 300 m, and 500 m). Finally, a comprehensive framework is proposed to avoid overlapping reductions by integrating the zonal classifications and distance thresholds of metro stations, supplemented by a grid-scale reduction calculation method to provide holistic decision-making support for urban parking planning practices.
4.2.1. Parking Zone Reduction Implementation
To ensure methodological rigor, this study excluded grid cells covering natural features (e.g., Tzu-chin Mountain, Xuanwu Lake, and Qinhuai River) and undeveloped peripheral areas within the central urban area. The parking zones were optimized, as shown in
Figure 2. For analytical coherence, Zone III (non-core areas within the central urban area) was designated as the baseline, assuming its parking allocation standards reflect the regional average. The reduction coefficients for Zones I and II (accessibility-advantaged subzones, excluding planning reserve areas) were calculated based on their public transportation accessibility reductions relative to the baseline.
Using Equation (9), we quantified the parking allocation reductions across all three zones (
Table 5). The results indicate that the lower limits of the parking allocation standards in Zone I (historical preservation areas) and Zone II (accessibility-advantaged areas), as shown in
Figure 2, should be reduced by 10.6% and 7.5% compared to those in Zone III. Notably, although many cities worldwide implement dual parking allocation controls (upper and lower limits), the determination of upper bounds falls beyond this study’s scope.
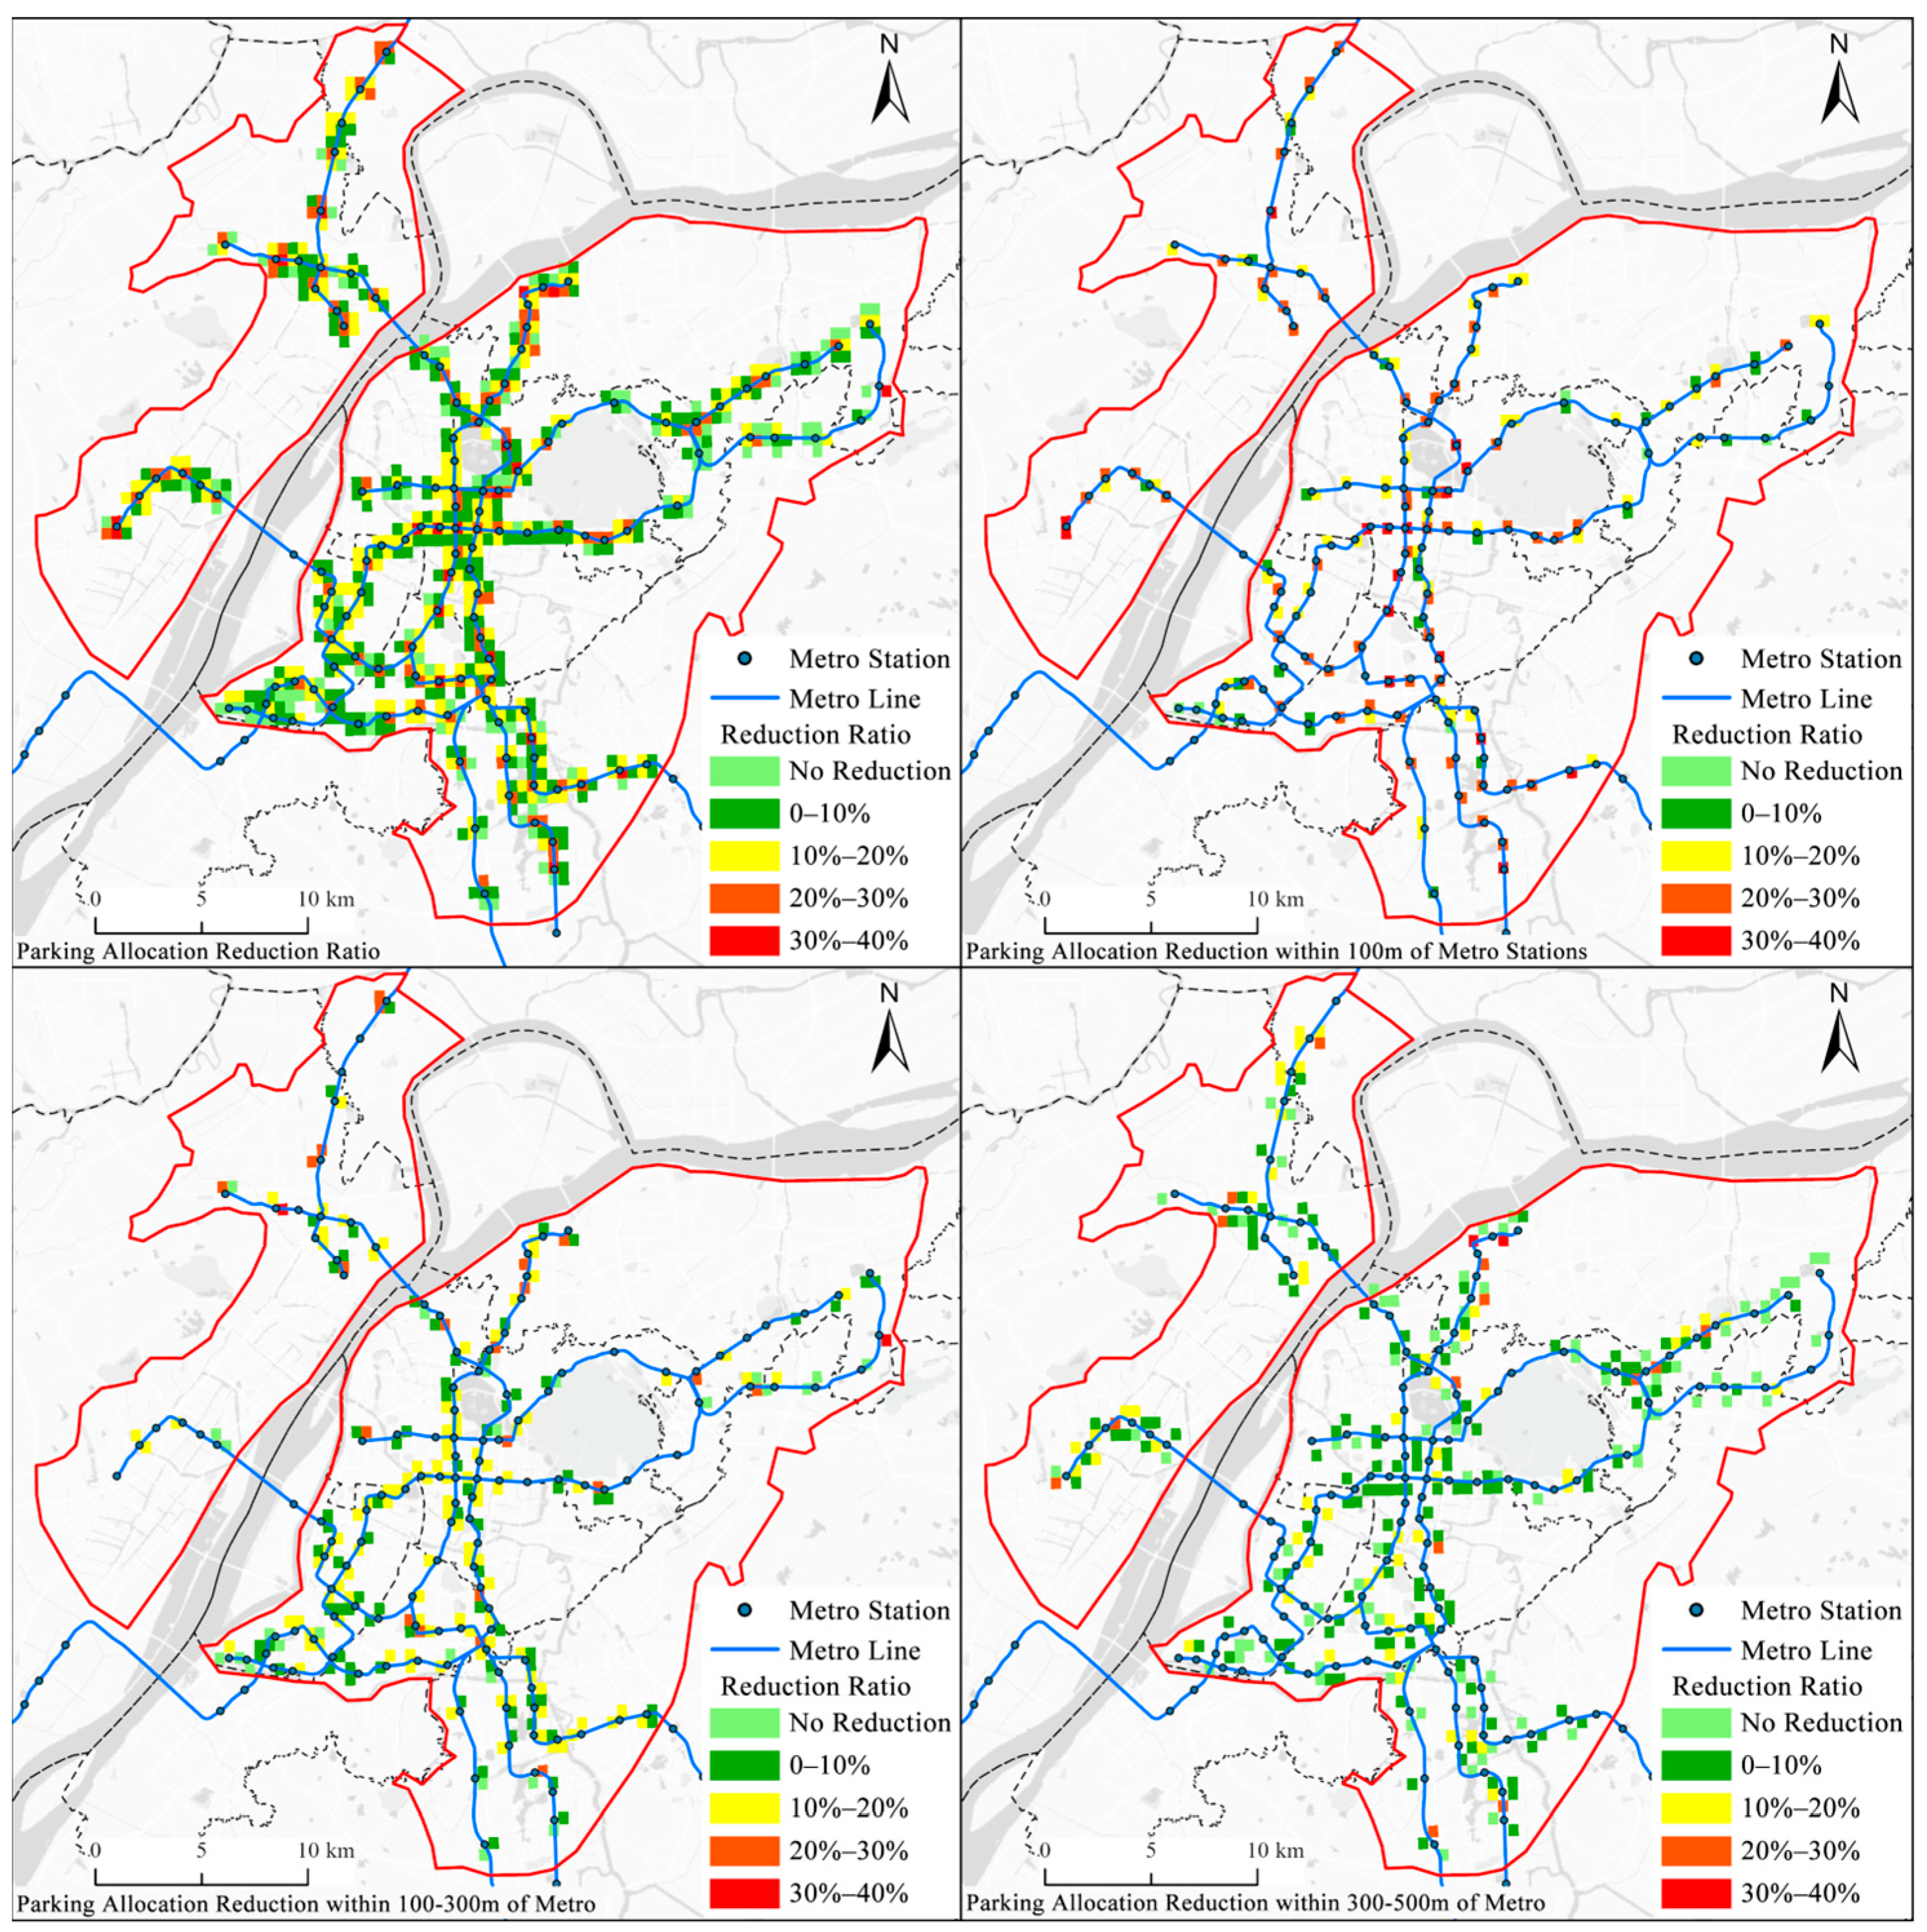
4.2.2. Around Metro Stations
The areas around metro stations are the main focus for parking allocation reduction because of their high levels of public transportation accessibility. By reducing the number of parking spaces, the usage rate of private cars can be decreased, thereby encouraging residents to opt more for public transportation and other eco-friendly modes of travel. In this study, thresholds of 100 m, 300 m, and 500 m were used to calculate the reduction ratios of the average public transportation accessibility for grids within these distances compared to the central urban area’s average public transportation accessibility. Based on this, the parking allocation reduction ratios for the different thresholds were estimated, offering a reference for setting the reduction ratios of parking allocation standards around metro stations. To maintain data consistency, this research focused on the metro lines and stations operational in Nanjing as of June 2019. After the calculations, it was recommended that the parking allocation standards for public buildings within 100 m, 300 m, and 500 m around metro stations in Nanjing be reduced by 17%, 12%, and 8%, respectively, as shown in
Table 6.
4.2.3. Parking Allocation Reduction Around Metro Stations in the Different Zones
Section 4.2.1 and
Section 4.2.2 present parking allocation reduction coefficients estimated for the different parking zones according to public transportation accessibility and for areas within 100 m, 300 m, and 500 m of metro stations without zonal differentiation. Both methods are widely adopted in Chinese cities with metro systems. However, applying them together can cause double counting in the reductions. For example, areas in proximity to metro stations in Zone I show two reductions by meeting both Zone I and metro proximity criteria. To solve this problem, an integrated approach, considering both zoning and distances from metro stations, is proposed for determining the reduction coefficients.
Using the reduction approach based on Zone III, as discussed in
Section 4.1, and the average public transportation accessibility of Zone III (29.8 min) as a benchmark, this study calculates the average accessibilities within the different distance thresholds of metro stations across the various zones. It then translates these to parking allocation reductions based on travel time reductions (
Table 7). The results show that in Zone I, parking allocation reductions around metro stations are 20.33%, 14.80%, and 10.63% at 100 m, 300 m, and 500 m, respectively; in Zone II, they are 16.70%, 12.66%, and 9.85%; and in Zone III, they are 16.23%, 10.65%, and 6.58%. The current standards specify a 20% reduction within 100 m and a 10% reduction within 300 m of metro stations in Zone I and a 10% reduction within 100 m in Zone II. Compared to these reductions, the accessibility-based reductions are slightly higher than but generally close to them, especially the 100 m reduction in Zone I. This implies that with zoning integration, parking allocation reductions in Zone I can be roughly 2% higher than the standard reductions (
Table 6) per level, while Zone II can use the standard values, and Zone III should be 2% lower than the standard values. These findings also back the necessity and validity of extending the reduction range to 500 m.
The integrated estimation of parking allocation reduction ratios, considering both zoning classifications and proximity to metro stations, provides quantitative support for the current urban policy frameworks. Although cities worldwide adopt such categorical management approaches because of policy continuity, administrative practicality, and cost constraints, scientific and refined transportation governance demands context-specific strategies. To advance precision, this study further calculates grid-level parking allocation reduction ratios based on public transportation accessibility advantages within specific metro station buffers, enabling hyper-localized policy implementation (
Figure 3). This grid-scale approach accounts for inter-zonal heterogeneity and can be operationalized according to management precision requirements.
5. Discussion
This study explores the application of public transportation accessibility metrics in optimizing parking allocation standards. Although the study area (Nanjing’s Central District) exhibits unique characteristics, such as commuter traffic concentrated along north–south cross-river corridors, the evaluation framework developed in this research can be applied to any urban context. The key findings regarding the calculation method for parking allocation reduction coefficients remain applicable to other similar cities. These coefficients can be tailored to urban characteristics, using household travel surveys and mobile phones’ signaling data to formulate city-specific parking allocation policies. Future applications of this framework to broader contexts or cities will further enhance the applicability and universality of the methodology. However, certain limitations arising from data constraints and the research scope should be acknowledged, warranting further investigation in future studies.
Although this paper employs multi-source big data, the datasets are not without imperfections. The mobile phones’ signaling data, provided by China Unicom, are not a complete sample but, rather, an expanded dataset subject to market-share limitations, which may introduce minor inaccuracies. Additionally, because mobile-signaling data do not include travel-mode information, the public transportation mode’s share used in the bus network optimization analysis had to be estimated based on distance-decay curves of the modal preference and calibrated using survey data from the Nanjing Transportation Annual Report. These data limitations may partially affect the precision of the findings, necessitating further validation with more robust datasets in the future.
This study primarily focuses on the role of accessibility metrics in parking allocation standard formulation. However, cities function as complex adaptive systems, where transportation challenges are influenced by multifaceted and interconnected factors. For instance, parking management requires integrated approaches involving planning policies, travel demand management, and market-based mechanisms. Although this research conducts an empirical analysis of Nanjing’s urban core, it is important to recognize that each city possesses unique characteristics requiring context-specific solutions.
The cross-elasticity of the public transportation travel time over the private-car-travel probability is essential for the reduction coefficient estimation. However, because of data constraints, the residents’ travel survey data that were used are outdated, limiting their ability to explain post-pandemic travel characteristics and inter-city travel heterogeneity. Nevertheless, a 2024 study focusing on the Greater Toronto Area revealed, through transition analysis between distinct time periods, that post-pandemic behavior in private car travel aligned almost identically with pre-pandemic behavioral patterns [
18], thereby partially validating the applicability of the reduction coefficients estimated in this research. Future research can apply this framework to more cities to verify the method’s effectiveness and enhance the universality of the calculated parking allocation reduction coefficients.
Moreover, in the context of public transportation operations, network optimization and accessibility represent only a subset of the broader system. This study should, thus, be viewed as a preliminary exploration—“observing a leopard through a bamboo tube, catching only a glimpse”—with ample room for deeper and more comprehensive investigations in future research.
6. Conclusions
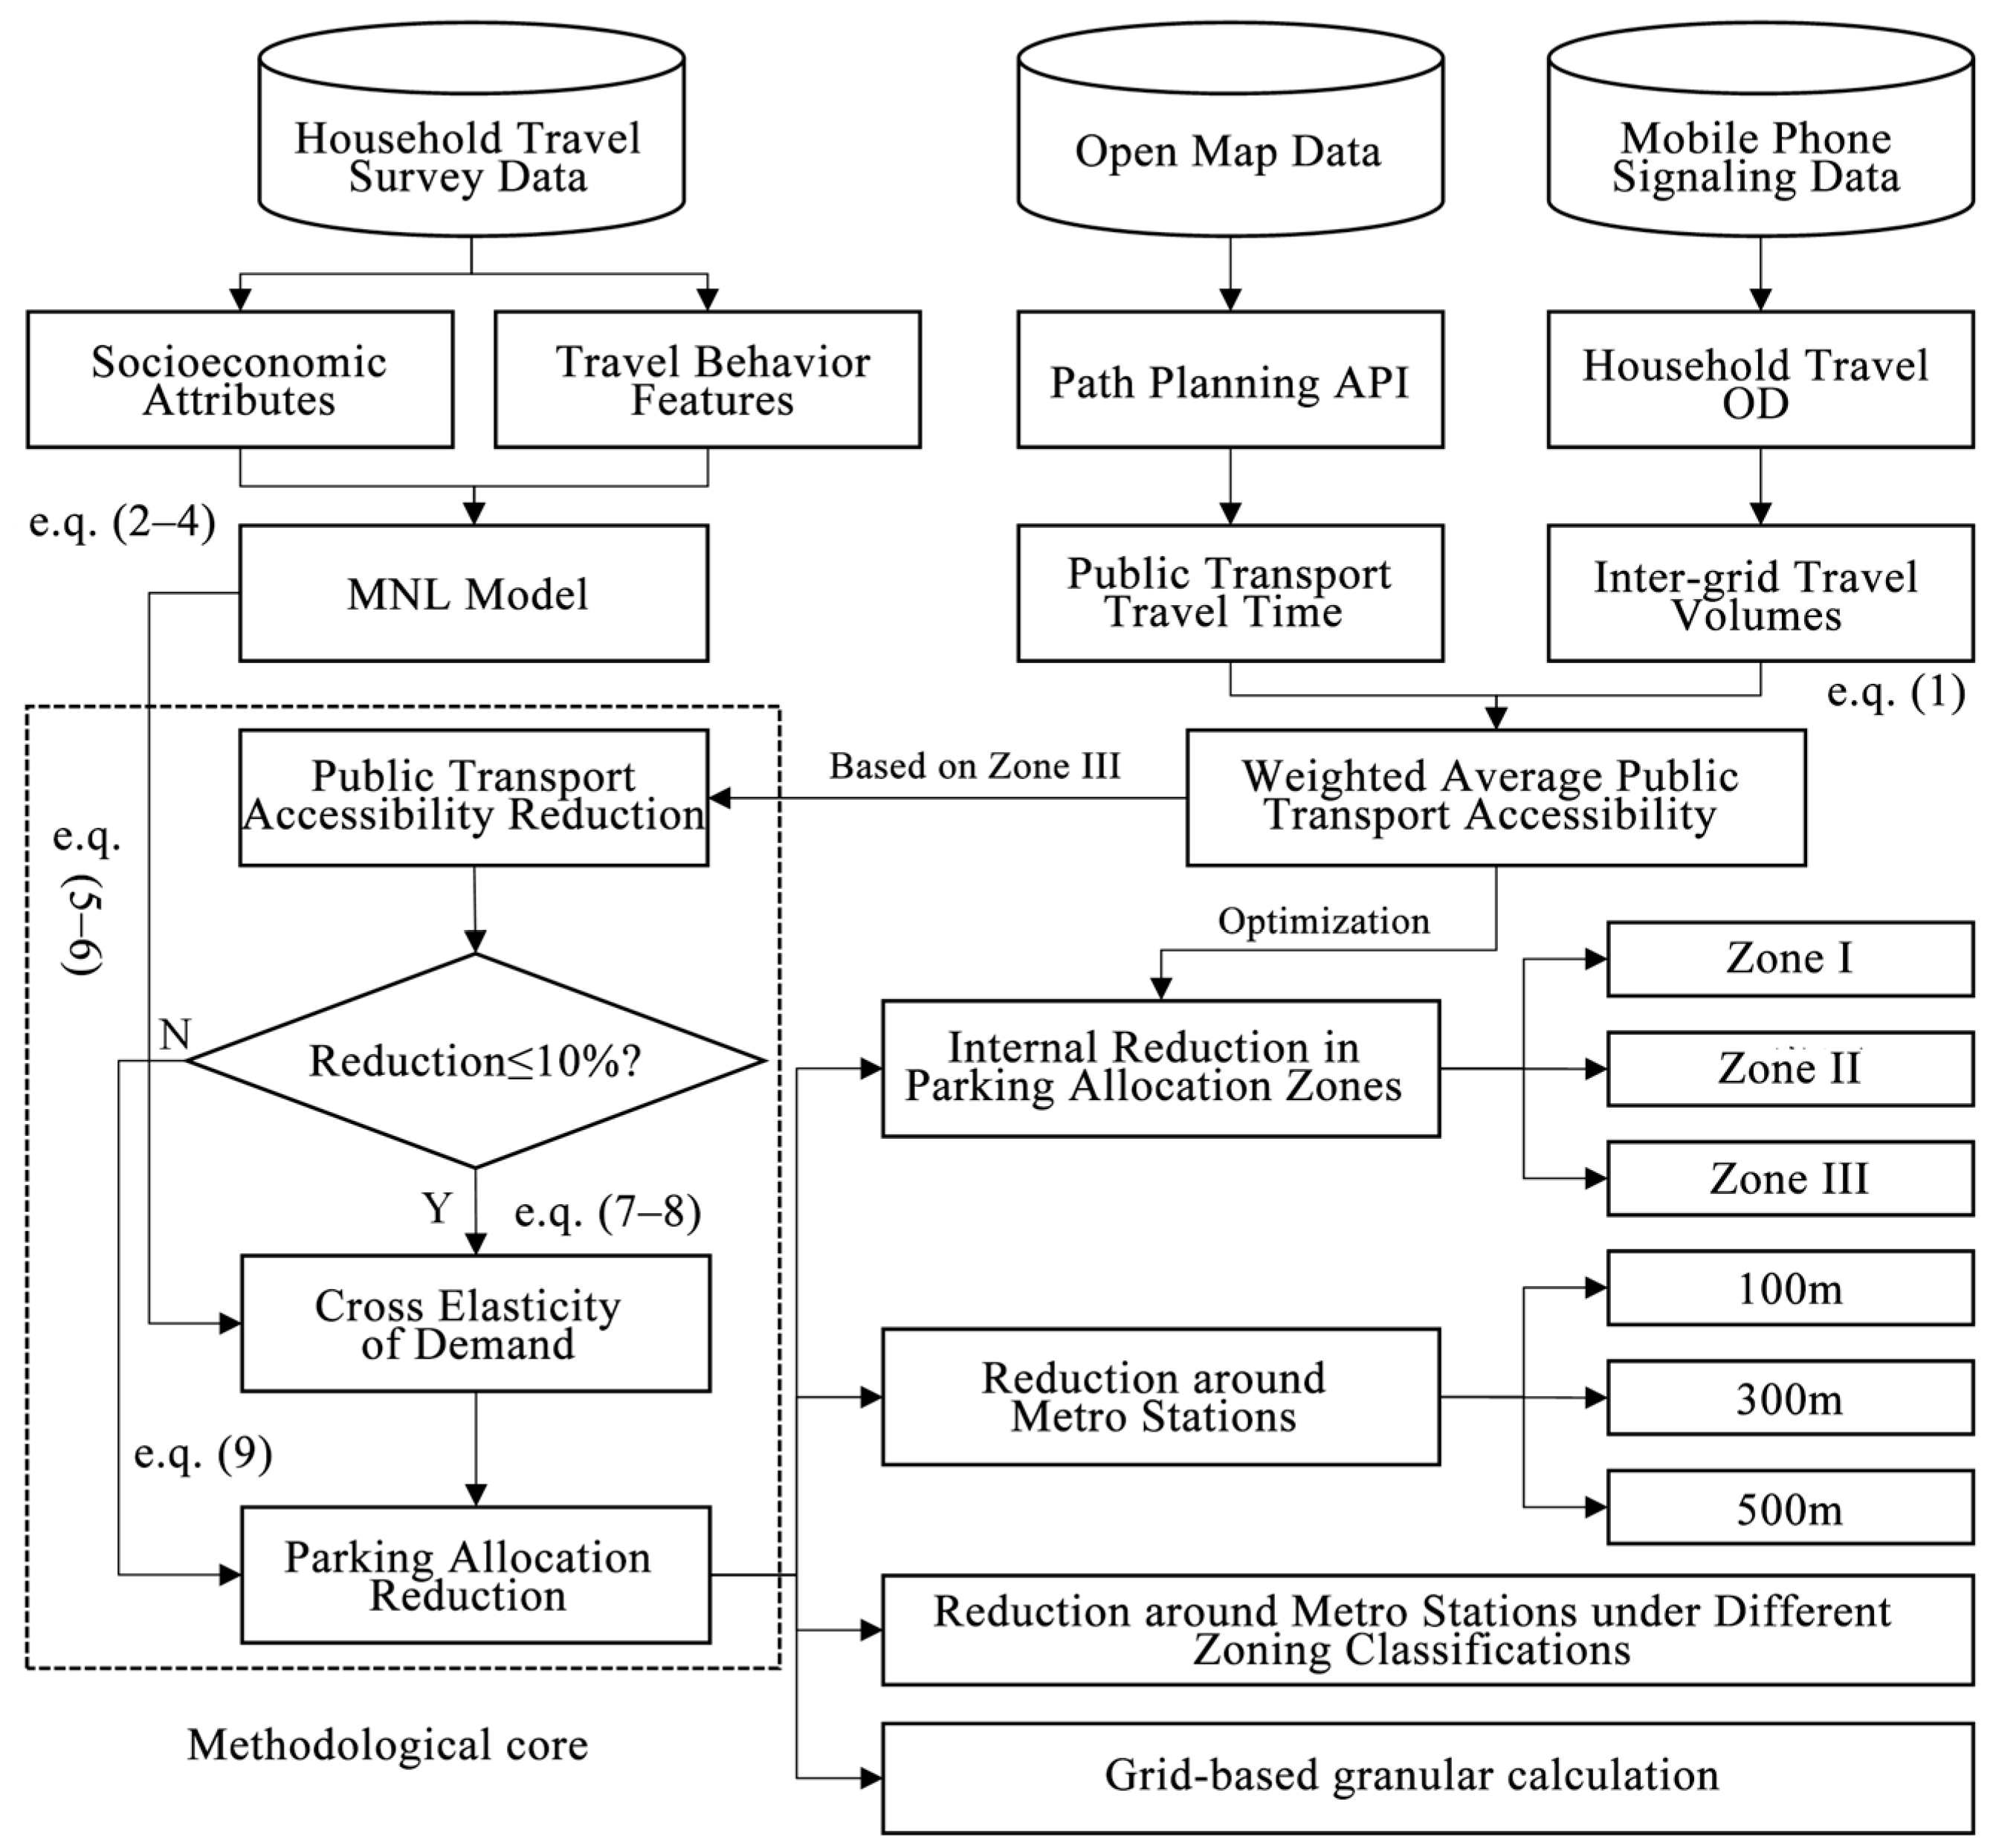
Parking allocation, as a pivotal urban-transportation-planning tool, critically influences spatial efficiency, promotes green mobility, alleviates congestion, and facilitates TOD. This study presents a parking-allocation-reduction-coefficient estimation method based on public transportation accessibility, establishing the overall calculation process shown in
Figure 4.
First, the parking management zones in the current standards are optimized using bus accessibility evaluation results. The optimized scheme sets historical preservation areas as Zone I, public transportation accessibility-advantaged subzones and some planning reserve areas as Zone II, and other central urban zones as Zone III. Second, a calculation method for parking allocation reduction coefficients is proposed. It uses time-based public transportation accessibility reduction and the cross-elasticity of the public transportation travel time over the private-car-travel probability to link time reduction to parking reduction. Lastly, using Nanjing’s central urban area as a case study, the parking allocation standards for different parking zones around metro stations and in combined scenarios are analyzed. The results show the following:
With Zone III as the benchmark, Zones I and II should have parking allocations reduced by 10.6% and 7.5%;
In Nanjing’s central urban area, parking allocations for public buildings within 100 m, 300 m, and 500 m of metro stations are reduced by 17%, 12%, and 8%;
Considering these two factors enables the comprehensive estimation of parking reduction coefficients for each grid around metro stations. Generally, in Zone I, the reduction can be roughly 2% higher than the standard values per level. In Zone II, the standard values can be applied. And in Zone III, the reduction can be 2% lower than the standard values per level.
Author Contributions
Conceptualization, methodology, experimental design, software, validation, supervision, and writing—review and editing, F.S.; investigation, methodology, software, and writing—original draft, W.Z.; formal analysis and writing—review and editing, P.Z.; validation and writing—review and editing, S.Y. All authors have read and agreed to the published version of the manuscript.
Funding
This research was funded by the National Natural Science Foundation of China (52278065, 51778277).
Institutional Review Board Statement
Not applicable.
Informed Consent Statement
Not applicable.
Data Availability Statement
The data can be obtained from the corresponding author.
Conflicts of Interest
Author Shuo Yang was employed by Nanjing Recube Investment Consulting Co., Ltd. The remaining authors declare that the research was conducted in the absence of any commercial or financial relationships that could be construed as a potential conflict of interest.
References
- Downs, A. The Law of Peak-Hour Expressway Congestion. Traffic Q. 1962, 16, 393–409. [Google Scholar]
- Manville, M.; Shoup, D. Parking, people, and cities. J. Urban Plan. Dev. 2005, 131, 233–245. [Google Scholar] [CrossRef]
- Wang, X.; Yuan, Q.; Liu, Z.; Shao, Y. Parking Reform Revitalized the Old Downtown: A Case Study of Pasadena in the U.S. Urban Transp. China 2020, 18, 58–64. [Google Scholar] [CrossRef]
- Li, S.; Zhang, X.; Wang, Y. Interpretation of Code for Urban Parking Plan. Urban Transp. China 2017, 15, 95–100. [Google Scholar] [CrossRef]
- Zhu, Z.; Zeng, J.; Zhang, S.; Chen, H. A Computation Method of Parking Allocation for Super High-rise Buildings: A Case Study of Xi’an. J. Transp. Inf. Saf. 2016, 34, 50–56. [Google Scholar] [CrossRef]
- Pan, X.; Qin, H.; Guan, H.; Xiao, Q. Preliminary Study on Foreign Parking Standards’ Setting Ideology. Urban Plan. Int. 2010, 25, 100–103. [Google Scholar] [CrossRef]
- Zhou, H.; Li, J.; Li, Y.; Wang, F.; Zhao, C. Application of London Public Transport Accessibility Levels (PTALs) Technology and Its Exploration in China. Urban Plan. Int. 2023, 38, 126–136. [Google Scholar] [CrossRef]
- Deng, M.; Zuo, L. Research on Parking Zoning Based on Evaluation of Public Transport Convenience. J. Transp. Eng. 2018, 18, 58–64. [Google Scholar] [CrossRef]
- Zhang, H.; Xie, Z.; Feng, X.; Duan, Y. Optimization Practice of Motor Vehicle Parking Allocation Standards in Guangzhou under the Background of Rebound in Automobiles Growth. Commun. Shipp. 2024, 11, 82–86. [Google Scholar] [CrossRef]
- Wang, B. A Review of On-Site Parking Requirements Implemented in Guangzhou. Urban Transp. China 2007, 5, 61–65. [Google Scholar]
- Tang, X.; Yin, C.; He, P.; Shan, T.; Li, G. Dynamics of TOD Comprehensive Index of the Rail Transit Stations on the Parking Construction Quota for Surrounding Office Buildings. Sci. Technol. Eng. 2024, 24, 3861–3868. [Google Scholar] [CrossRef]
- Wang, Y.; Ye, X.; Li, M.; Chen, J.; Yan, X. Study on Shared Parking Dynamic Pricing Method Based on Price Elasticity and Behavior Choice. J. Highw. Transp. Res. Dev. 2022, 39, 196–203. [Google Scholar] [CrossRef]
- Ma, X.; Ren, F.; Du, Q.; Liu, P.; Li, L.; Xi, Y.; Jia, P. Incorporating Multiple Travel Modes into a Floating Catchment Area Framework to Analyse Patterns of Accessibility to Hierarchical Healthcare Facilities. J. Transp. Health 2019, 15, 100675. [Google Scholar] [CrossRef]
- Gutiérrez, J.; González, R.; Gómez, G. The European high-speed train network: Predicted effects on accessibility patterns. J. Transp. Geogr. 1996, 4, 227–238. [Google Scholar] [CrossRef]
- Luo, P.; Xu, Y.; Zhang, N. Study on the Impacts of Regional Accessibility of High Speed Rail-A Case Study of Nanjing To Shanghai Region. Econ. Geogr. 2004, 24, 407–411. [Google Scholar] [CrossRef]
- Qin, P.; Chen, Y.; Xu, J.; Wang, L. Travel Behavior Analysis for the Residents in Beijing: Value of Time and Travel Demand Elasticity Estimates. Econ. Geogr. 2014, 34, 17–22. [Google Scholar] [CrossRef]
- Ni, Y.; Xue, Y.; Liu, T.; Gong, L.; Zhou, X. Study of Disaggregate-elasticity Model for Bus Travel Demand Analysis. J. Wuhan Univ. Technol. (Transp. Sci. Eng.) 2014, 38, 442–445. [Google Scholar] [CrossRef]
- Ong, F.; Loa, P.; Habib, K.N. A behavioural analysis of post-pandemic modality profiles for non-commuting trips in the greater Toronto Area. Travel Behav. Soc. 2024, 34, 100690. [Google Scholar] [CrossRef]
| Disclaimer/Publisher’s Note: The statements, opinions and data contained in all publications are solely those of the individual author(s) and contributor(s) and not of MDPI and/or the editor(s). MDPI and/or the editor(s) disclaim responsibility for any injury to people or property resulting from any ideas, methods, instructions or products referred to in the content. |
© 2025 by the authors. Licensee MDPI, Basel, Switzerland. This article is an open access article distributed under the terms and conditions of the Creative Commons Attribution (CC BY) license (https://creativecommons.org/licenses/by/4.0/).


