Article

The Development of Agricultural Drought Monitoring and Drought Limit Water Level Assessments for Plateau Lakes in Central Yunnan Based on MODIS Remote Sensing: A Case Study of Qilu Lake

1
Yunnan Water Resources and Hydropower Survey, Design and Research Institute, Kunming 650021, China
2
College of Water Conservancy, Yunnan Agricultural University, Kunming 650201, China
3
National Key Laboratory of Water Resource Engineering and Management, Wuhan University, Wuhan 430072, China
4
Changjiang River Scientific Research Institute of Changjiang Water Resources Commission, Wuhan 430010, China
*
Author to whom correspondence should be addressed.
Sustainability 2025, 17(10), 4662; https://doi.org/10.3390/su17104662
Submission received: 7 March 2025 / Revised: 9 May 2025 / Accepted: 12 May 2025 / Published: 19 May 2025

Abstract

:
This study focuses on Qilu Lake to study how to mitigate the impacts of seasonal droughts and provide technical support for drought resistance decision-making in low-latitude plateau lake basins. Using the Standardized Precipitation Index (SPI), the Vegetation Condition Index (VCI), and the Temperature Condition Index (TCI) as bases, in this study, the applicability of the vegetation health index (VHI) within the basin is investigated, and the optimal weight distribution between the Vegetation Condition Index (VCI) and the Temperature Condition Index (TCI) in the VHI is determined. The VHI is then applied to analyze the correlation between drought frequency and severity within the basin. The results indicate that the method is most effective in assessing agricultural drought in the Qilu Lake Basin when the VCI and TCI are weighted at a 4:6 ratio, optimizing the VHI’s evaluative performance. The drought limit water levels of lakes are further divided into short- and long-term drought limit water levels. The short-term drought limit water level is divided into the drought warning water level and the drought emergency water level. The drought warning water level (corresponding to moderate drought conditions, with a frequency of P = 75%) ranges from 1794.53 m to 1795.11 m, while the drought emergency water level (corresponding to extreme drought conditions, with a frequency of P = 95%) ranges from 1793.94 m to 1794.31 m. These levels are set to meet the emergency water demand during droughts in the basin. The long-term drought limit water levels are calculated by accumulating the water deficits of various sectors within the watershed under different agricultural drought conditions, based on the short-term drought limit water levels. By setting the drought limit water level using this method, as well as considering the original water regulation capacity of the lake resources, when the watershed experiences drought, the scheduling method based on this drought limit water level can better alleviate the water supply pressure on various sectors in the local area.

1. Introduction

Drought is characterized by an imbalance between water supply and demand caused by prolonged periods of little or no rainfall within a region [1,2]. Due to its extended duration and widespread impact, drought significantly affects agriculture, ecosystems, and society, posing threats to ecological stability and food security, making it one of the most destructive natural disasters [3,4]. The increasing frequency and severity of droughts have led to substantial economic losses globally, drawing significant attention from the international community [5,6,7,8]. In China, the intensity and frequency of droughts have also risen, with regions such as the Yangtze River Basin, Yellow River Basin, Northeast China, and the Yunnan–Guizhou Plateau experiencing various degrees of persistent regional droughts, resulting in considerable economic losses [9,10,11,12].
Currently, the impacts of drought are primarily addressed through monitoring and early warning systems, risk assessments, risk mitigation, and response strategies [13]. Various drought indices have been proposed both domestically and internationally to capture changes in drought severity [14]. Traditional methods for assessing meteorological drought rely heavily on precipitation levels to describe changes in drought intensity [15], such as the SPI [16] and the precipitation anomaly percentage (Pa) [17]. However, these methods do not account for other meteorological factors, such as evapotranspiration [18]. To address these limitations, the Palmer drought severity index (PDSI) [19] and the standardized precipitation evapotranspiration index (SPEI) [20,21] were developed to estimate the potential impacts of meteorological drought across various time scales. Given the complexity of drought causes and mechanisms, meteorological drought indices have continued to evolve, with a focus on multi-factor and composite drought indices [22,23,24]. For example, the meteorological drought composite index (MCI) [25] is based on the Standardized Precipitation Index, the relative humidity index, and the standardized weighted precipitation index. The multivariate integrated drought index (MIDI) [26], which couples four drought indices using variable fuzzy set theory and entropy weighting methods, has also been developed. In terms of hydrological drought indices, the standardized streamflow index (SSI) [27], based on streamflow data, and the standardized runoff index (SRI) [28], based on runoff data, are frequently used in combination with other drought indices. Due to a decrease in precipitation, moisture deficiency has exacerbated and has led to a decline in soil moisture content, rendering it insufficient to support plant growth and triggering agricultural droughts [29,30]. Initially, studies on agricultural droughts relied on hydrological models to simulate soil moisture, utilizing indices such as the Standardized Soil Moisture Index (SSMI) [31], the soil moisture deficit index (SMDI) [32], and the Integrated Surface Drought Index (ISDI) [33]. With the advancement of remote sensing technology, agricultural drought research has increasingly incorporated vegetation greenness monitoring [34]. Among the various indices employed for remote sensing assessments, the normalized difference vegetation index (NDVI) [35] has emerged as the most widely used. This has given rise to an array of derivative remote sensing indices, including the temperature–vegetation drought index (TVDI) [36], the VCI [37], and the scale drought condition index (SDCI) [38]. These sophisticated tools have enhanced our ability to monitor and assess agricultural drought conditions, offering valuable insights into the complex interactions between climatic variables and agricultural productivity.
In the wake of regional drought events, mitigating and addressing the impacts of drought-related disasters has become an imperative task. The engineering measures [39] for drought resistance primarily encompass the construction of reservoirs, the implementation of inter-basin water transfer projects, and the development of regional water networks, all aimed at alleviating the challenges posed by drought conditions [40,41]. China has established numerous reservoir clusters within the basins of major rivers, such as the Yangtze River and the Yellow River, to alleviate water supply pressures within these regions. Concurrently, a multitude of interconnected water regulation and storage facilities have been constructed across different areas, enhancing the capacity for water resource management and ensuring a reliable water supply [42]. These strategic initiatives not only serve to bolster resilience against drought impacts but also promote sustainable water usage practices, reinforcing the nation’s commitment to effectively managing its water resources amidst increasing climate challenges [43,44,45]. Non-engineering measures encompass a range of strategies, including monitoring and forecasting, the coordinated operation of reservoir clusters, optimizing water supply, adjusting crop planting structures, implementing production restrictions, and reducing water demand [46]. Among these, drought warning water levels are critical indicators for assessing drought conditions in rivers, lakes, and reservoirs, as well as for initiating emergency drought response protocols [47,48].
Currently, research on drought warning water levels in low-latitude plateau lakes remains relatively scarce [49]. Previous studies on drought limit water levels have only relied on inflow runoff and changes in water usage demands across various industries within the watershed. Drought limit water levels, as a management indicator for addressing drought conditions after water shortages occur in the region, should also fully consider the impact of multiple factors on lake water levels. In the study area, agricultural irrigation is the primary water use within the watershed. Therefore, it is necessary to conduct research on the drought limit water levels by combining the inflow process of the lake watershed and the water usage of various industries within the watershed while also taking into account the different levels of agricultural drought within the watershed. The drought limit water level is mainly divided into two issues: the short-term drought limit water level, which corresponds to the short-term water resource shortage caused by reduced inflow, and the long-term drought limit water level, which addresses the agricultural drought issues caused by a long-term reduction in inflow. Based on factors such as rainfall, evaporation, runoff, water usage for living, production, and ecology in the watershed, the short-term drought limit water levels of the lake are analyzed and determined. Different levels of agricultural drought are classified according to the agricultural drought index (VHI), and they are correlated with short-term drought limit water levels. The long-term drought limit water levels for Qilu Lake during severe drought are proposed. By combining these analyses, the drought limit water levels of the lake are determined under different water inflow frequencies and various levels of drought. Furthermore, this assessment integrates meteorological, hydrological, and management factors to evaluate the rationality of the agricultural drought conditions and the corresponding drought warning water level results. This comprehensive approach aims to provide scientifically robust technical support for drought-related decision-making and emergency management throughout the entire basin.

2. Research Area and Data

2.1. Overview of the Research Area

The Qilu Lake Basin is situated within Tonghai County, Yuxi City, Yunnan Province (Figure 1). Influenced by a monsoon climate, the region exhibits distinctive characteristics typical of a low-latitude plateau monsoon climate, including minimal seasonal temperature variations, significant diurnal temperature fluctuations, well-defined wet and dry seasons, concurrent rainfall and heat, and pronounced vertical differences. The average annual rainfall in this area is approximately 880.9 mm, with substantial intra-annual variability; notably, the cumulative precipitation during the dry season from December to May amounts to only 201.8 mm. This basin is part of the Pearl River–Xijiang River system, with Qilu Lake classified as a tectonic fault lake. The lake itself is elongated in a southeast-to-west orientation, and it is surrounded by higher terrain, with its central region being lower. The operational water level of the lake fluctuates between 1793.92 and 1796.62 m, boasting an average depth of 4.03 m and a maximum depth of 6.8 m, resulting in a total storage capacity of 149 million cubic meters [50]. The basin is characterized by four primary inflow rivers, namely, the Hongqi River, the Zhewan River, the Zhonghe River, and the Daxin River, accompanied by numerous seasonal streams and tributaries. The total area of the Qilu Lake Basin is approximately 359 square kilometers, with elevations ranging from 1333 m to 2424 m. It includes seven townships (and streets), namely Xiushan, Sijie, Nagu, Jiulong, Hexi, Yangguang, and Xingmeng, collectively housing a population of around 310,000. The region encompasses approximately 54,498 acres of arable land primarily dedicated to the cultivation of vegetables, flue-cured tobacco, wheat, corn, and broad beans. It serves as a vital vegetable cultivation base within Yunnan Province’s green development plan for plateau specialty agriculture. The irrigated area primarily consists of 27,743 acres of farmland along the shores of Qilu Lake, with irrigation water sourced from the Hongqi River, Qilu Lake, and shallow groundwater from the basin [51].

2.2. Data Sources

The remote sensing data utilized in this study comprise the NDVI and land surface temperature (LST), both of which were sourced from China’s GaoFen-6 satellite, as well as MODIS data products (MOD13A3 and MOD11A2). The NDVI, calculated using the red and near-infrared bands, reflects the growth status of vegetation and serves as an effective indicator for monitoring vegetation water stress and the progression of agricultural drought conditions. The LST data selected for analysis originate from the MODIS daytime land surface temperature product. Both types of data cover a temporal range from 2001 to 2022; the time resolution is monthly, and the spatial resolution is 1 km × 1 km. Additionally, ground-based hydrological and meteorological observational data, including historical records of rainfall, evaporation, temperature, and runoff within the Qilu Lake Basin, are collected. This historical data primarily span the period from 1965 to 2022 and are recorded on a monthly basis. Furthermore, cumulative resources related to water resource allocation planning and water network engineering are also included to enhance this study’s comprehensive dataset [52].

3. Research Methods

3.1. Vegetation Health Index

In the initial calculation of the VHI, equal weights are assigned to the VCI and TCI, neglecting the varying responses of different vegetation types to temperature across different study areas. Therefore, in this study, Pearson correlation analysis is used to reassess the weights of the TCI and VCI in the VHI, aiming to balance the relationship between the VCI, TCI, and VHI during the study period. Additionally, hydro-meteorological factors are introduced to further verify the accuracy of this balance, thereby determining the most suitable VHI for the study area. The SPI is a crucial metric that characterizes the probability of precipitation occurrence over specific time periods. It can delineate various drought intensities across different time scales, making it widely applicable in drought monitoring. The SPI is represented with different durations: SPI-1 signifies a one-month time scale, which is typically associated with meteorological drought, while SPI-3 and SPI-6 are generally utilized to examine agricultural drought scenarios. Additionally, the VCI and TCI are derived by normalizing NDVI and LST data over specific time frames against historical averages. This process yields insights into the relative drought conditions during those periods. This study combines both indices through a weighted approach to derive the VHI. This composite index provides a more nuanced understanding of vegetation health and agricultural drought conditions within the region (Table 1) [53,54].
V C I = N D V I i N D V I min N D V I max N D V I min
T C I = L S T max L S T i L S T max L S T min
V H I = α V C I + ( 1 α ) T C I
In the equations, NDVIi and LSTi represent the NDVI and LST values for the current period. NDVImin and LSTmin denote the minimum NDVI and LST values for the same period, while NDVImax and LSTmax illustrate the maximum NDVI and LST values for that timeframe. The variable α signifies the weighting factor, which is typically set to 0.5. However, to account for regional differences, it is essential to determine the most suitable weighting factor for specific areas based on local conditions and characteristics.

3.2. Determination Method for Drought Limit Water Levels

The determination of the drought limit water levels for the lake must comprehensively consider several critical factors, including the unique characteristics of the lake, ecological conditions, economic and social water demands, inflow and outflow balances, and effective lake management strategies. The drought limit water levels are required to adhere to the prescribed water resource allocation plans, ensuring that the variations in water demand across different sectors are met during non-flood periods or dry years. In this study, the drought limit water level is first determined using hydrological factors, which refer to a reduction in the short-term water inflow into the watershed, leading to water scarcity within the watershed and a decrease in lake water levels. Water inflow processes with frequencies of 75% and 95% are set, corresponding to moderate drought years and extreme drought conditions, respectively. The drought warning level and the drought safeguard level are calculated separately. Calculations are performed using the ecological water level of the lake, external water demand from the lake, inflow runoff into the lake, and evapotranspiration within the watershed.
When the long-term inflow into the watershed is below normal levels, water levels continue to drop, and the watershed faces higher drought risks, so the existing water supply strategies cannot meet the water demands for domestic use and irrigation. Under such circumstances, it is necessary to comprehensively consider the impact of drought factors on the watershed and calculate different drought limit water levels based on different risk scenarios in typical years. Specifically, in this study, the water shortages of various sectors within the watershed under different agricultural drought conditions are used to calculate the drought limit water levels under these different agricultural drought conditions. Therefore, the first step is to identify the agricultural drought situation within the watershed. Based on the intensity of the agricultural drought, the corresponding drought limit water levels are calculated.
When calculating the drought limit water levels, the impact of agricultural drought should be considered by selecting typical years with the maximum disruption to water supply due to water shortages at different drought levels, ensuring that daily water supply needs are met. For the selection of hydrological years, typical years with inflow frequencies of P = 75% and P = 95% are used. Different levels of agricultural drought are categorized into four levels: mild drought, moderate drought, severe drought, and extreme drought. At a hydrological frequency of P = 75%, the drought limit water levels are calculated and analyzed for mild, moderate, severe, and extreme drought levels, while at a hydrological frequency of P = 95%, the drought levels should be set to a higher level because this level has already significantly affected the water demand of various industries within the watershed.
Z 75 , t = Z ( V ( Z e , 75 , t + max ( W 75 , t R 75 , t + E 75 , t , 0 ) )
Z 95 , t = Z ( V ( Z e , 95 , t + max ( W 95 , t R 95 , t + E 95 , t , 0 ) )
Z 75 , t M i = Z 75 , t + Z ( w s M i ) Z 75 , t M o = Z 75 , t + Z ( w s M o ) Z 75 , t S e = Z 75 , t + Z ( w s S e ) Z 75 , t E x = Z 75 , t + Z ( w s E x )
Z 95 , t M i = Z 95 , t + Z ( w s M i ) Z 95 , t M o = Z 95 , t + Z ( w s M o ) Z 95 , t S e = Z 95 , t + Z ( w s S e ) Z 95 , t E x = Z 95 , t + Z ( w s E x )
In this equations, Ze,75,t and Ze,95,t denote the water levels calculated for the t-th month under hydrological frequencies of P = 75% and P = 95%, respectively. Ze,75,t and Ze,95,t represent the ecological water levels determined for the t-th month corresponding to the same hydrological frequencies of P = 75% and P = 95%. V(∙) is the lake’s water level–volume conversion curve, a function that translates water levels into their corresponding volumes. Wp = 75%,t and Wp = 95%,t indicate the external water demands on the lake for the t-th month at hydrological frequencies of P = 75% and P = 95%, respectively. Rp = 75%,t and Rp = 95%,t refer to the inflow runoff into the lake for the t-th month at the aforementioned hydrological frequencies. Ep = 75%,t and Ep = 75% represent the rates of evapotranspiration from the lake surface for the t-th month, corresponding to P = 75% and P = 95%, respectively. Z(∙) serves as the volume–water level conversion function, facilitating a detailed analysis of the link between the water levels and the lake’s storage capacity. ws serves as the water shortage variable in various sectors within the watershed under different levels of agricultural drought. Mi, Mo, Se, and Ex separately represent mild drought, moderate drought, severe drought, and extreme drought.
Analysis of the Rationality of Drought Limit Water Levels and Adjustment and Determination of Drought Warning Water Levels: The establishment of drought warning water levels requires not only a foundational calculation but also necessary adjustments that account for external inflow from surrounding watersheds, as well as the specific management criteria associated with the lake’s operational requirements. Fundamentally, the drought warning water level must remain within defined parameters: it can neither exceed the flood control level established for the wet season nor fall below the minimum operational water level necessary for sustaining ecological balance and resource management. In the analysis of the rationality of drought limit water levels, it is essential to incorporate actual drought statistical data and water allocation rules for a reasonable analysis and optimization adjustment of the drought limit water levels. A comparative analysis should be conducted to evaluate the improvement in water supply during typical drought years before and after the establishment of the drought limit water levels (Figure 2).

4. Results and Analysis

4.1. Subsection

In this study, the SPI was analyzed and calculated at three times scales: SPI-1, SPI-3, and SPI-6. The objective was to determine the optimal weight distribution of the VCI and TCI within the VHI to assess its adaptability for drought monitoring in the Qilu Lake Basin. Pearson correlation analysis was used to assess the Pearson correlation coefficients between these three indices, as well as between VHI-VCI and VHI-TCI. The findings indicated that variations in weight factors resulted in notable differences in the VHI’s correlation with the various SPI values. Overall, SPI-3 had the highest correlation coefficient of 0.632, and the average values of VHI-VCI and VHI-TCI with different weight factors were compared and analyzed. When the weight was 0.4, the correlation between the VHI and SPI-3 was the highest, and the average values of VHI-VCI and VHI-TCI were the highest, as illustrated in Figure 3. Consequently, after calculating the VHI for the Qilu Lake Basin, we proposed an optimal configuration of weight factors: the VCI was assigned a weight of 0.4, while the TCI was given a weight of 0.6. This configuration was deemed the most suitable for generating an agricultural drought monitoring index (VHI) tailored to the specific conditions of the Qilu Lake Basin. At the same time, SPI-3 was selected for an in-depth analysis of the drought conditions in the Qilu Lake Basin. As the weight factor α continued to change, there were also certain differences in the correlation between the VHI and multi-scale SPI. The varying weight ratios of the VCI and TCI can influence the performance of the VHI in drought monitoring. By comparing the Pearson correlation coefficients of VHI-VCI and VHI-TCI, it was found that the correlation of VHI-VCI was lower than that of VHI-TCI, indicating that the TCI has a more significant impact on the VHI.
Utilizing concurrent rainfall observation data from the Tonghai Meteorological Station within the Qilu Lake Basin, we plotted the trend lines for SPI-3 and the VHI from 2001 to 2022, as illustrated in Figure 4. Both indices demonstrated notable similarities in the timing and intensity of drought occurrences. Further analysis of the monthly distribution of SPI-3 for the years 2001 to 2022 indicated that the majority of periods showed no drought activity, accounting for approximately 67.82%. The occurrences of mild drought, moderate drought, severe drought, and extreme drought were represented by proportions of 13.25%, 9.46%, 6.44%, and 3.03%, respectively, suggesting a relatively low probability of significant drought events. In parallel, an evaluation of the VHI indicated that the duration of non-drought conditions comprised about 68.19% of the analyzed period. In the VHI analysis, the percentages for mild drought, moderate drought, severe drought, and extreme drought were found to be 15.53%, 7.95%, 6.06%, and 2.27%, respectively. The close alignment of these results suggests that the weight distribution employed in calculating the VHI can be effectively utilized for monitoring agricultural drought conditions within the Qilu Lake Basin. This finding underscores the potential for employing a combined approach to drought assessment, enhancing the prediction and management of agricultural resources in the region.

4.2. Seasonal Variation Characteristics of VHI for Drought Assessment

4.2.1. Monthly Variability Characteristics of VHI

As illustrated in Figure 5, an analysis of the monthly variations in the VHI and SPI-3 from 2001 to 2022 revealed a cyclical pattern of mild and severe drought conditions. Key observations included the following: Drought Dynamics: The period from 2001 to 2022 was marked by alternating instances of mild and intense drought. Notably, November 2009 witnessed the lowest VHI value, indicating the highest severity of agricultural drought during this time span. This month also coincided with the minimum SPI-3 value, establishing November 2009 as the driest month since 2001. Peaks and Valleys: the highest recorded VHI occurred in June 2004, coinciding with the least severe agricultural drought conditions. Seasonal Patterns: Typically, the VHI reached its nadir during the dry months of December to February when precipitation is scarce. Conversely, SPI-3 exhibited its minimum values predominantly in November or December. In terms of maxima, both the VHI and SPI-3 generally peaked during the monsoon season, predominantly in August or September. Interannual Variability: There were significant variations in the VHI between different months, reflecting diverse drought intensities. Furthermore, the VHI values for the same month across different years exhibited notable discrepancies, emphasizing the variability of drought conditions each year.
Under normal conditions without drought, the water level of Qilu Lake followed an annual variation pattern: the water level increased month by month from June to October, reaching its highest point; then, it decreased month by month until it reached its lowest point in May, forming an annual cycle. Two significant decreases in the water level of Qilu Lake occurred during 2009–2013 and 2019–2020, both of which were due to extremely severe droughts within the watershed, with relatively low levels of the VHI and SPI-3.

4.2.2. Seasonal Variation Characteristics of VHI

To analyze the seasonal variations in the VHI, we categorized the year into four distinct seasons: spring (March to May), summer (June to August), autumn (September to November), and winter (December to February), as illustrated in Figure 4. The figure indicates that the agricultural drought intensity across these four seasons has exhibited relatively stable fluctuations without remarkable trends over the last two decades. Drought Probability: Overall, both spring and winter showed comparatively lower VHI values, which correlate with a high probability of drought occurrence. These two seasons also displayed significant variability, making them susceptible to extreme weather events. Particularly noteworthy is the winter of 2009, during which the VHI plummeted to its lowest value, indicating severe agricultural drought conditions. Low Drought Frequency in Summer and Autumn: Conversely, the summer and autumn seasons demonstrated a generally lower frequency of agricultural drought events, reflecting better vegetation health during these periods. In summary, the analysis revealed a pronounced seasonality in agricultural drought conditions within the Qilu Lake Basin. During spring and winter, the severity of agricultural drought is exacerbated by rising temperatures and a misalignment in the seasonal distribution of precipitation. Conversely, summer and autumn benefit from increased rainfall intensity, contributing to over 70% of the annual precipitation. This results in comparatively milder agricultural drought conditions during these seasons [55].

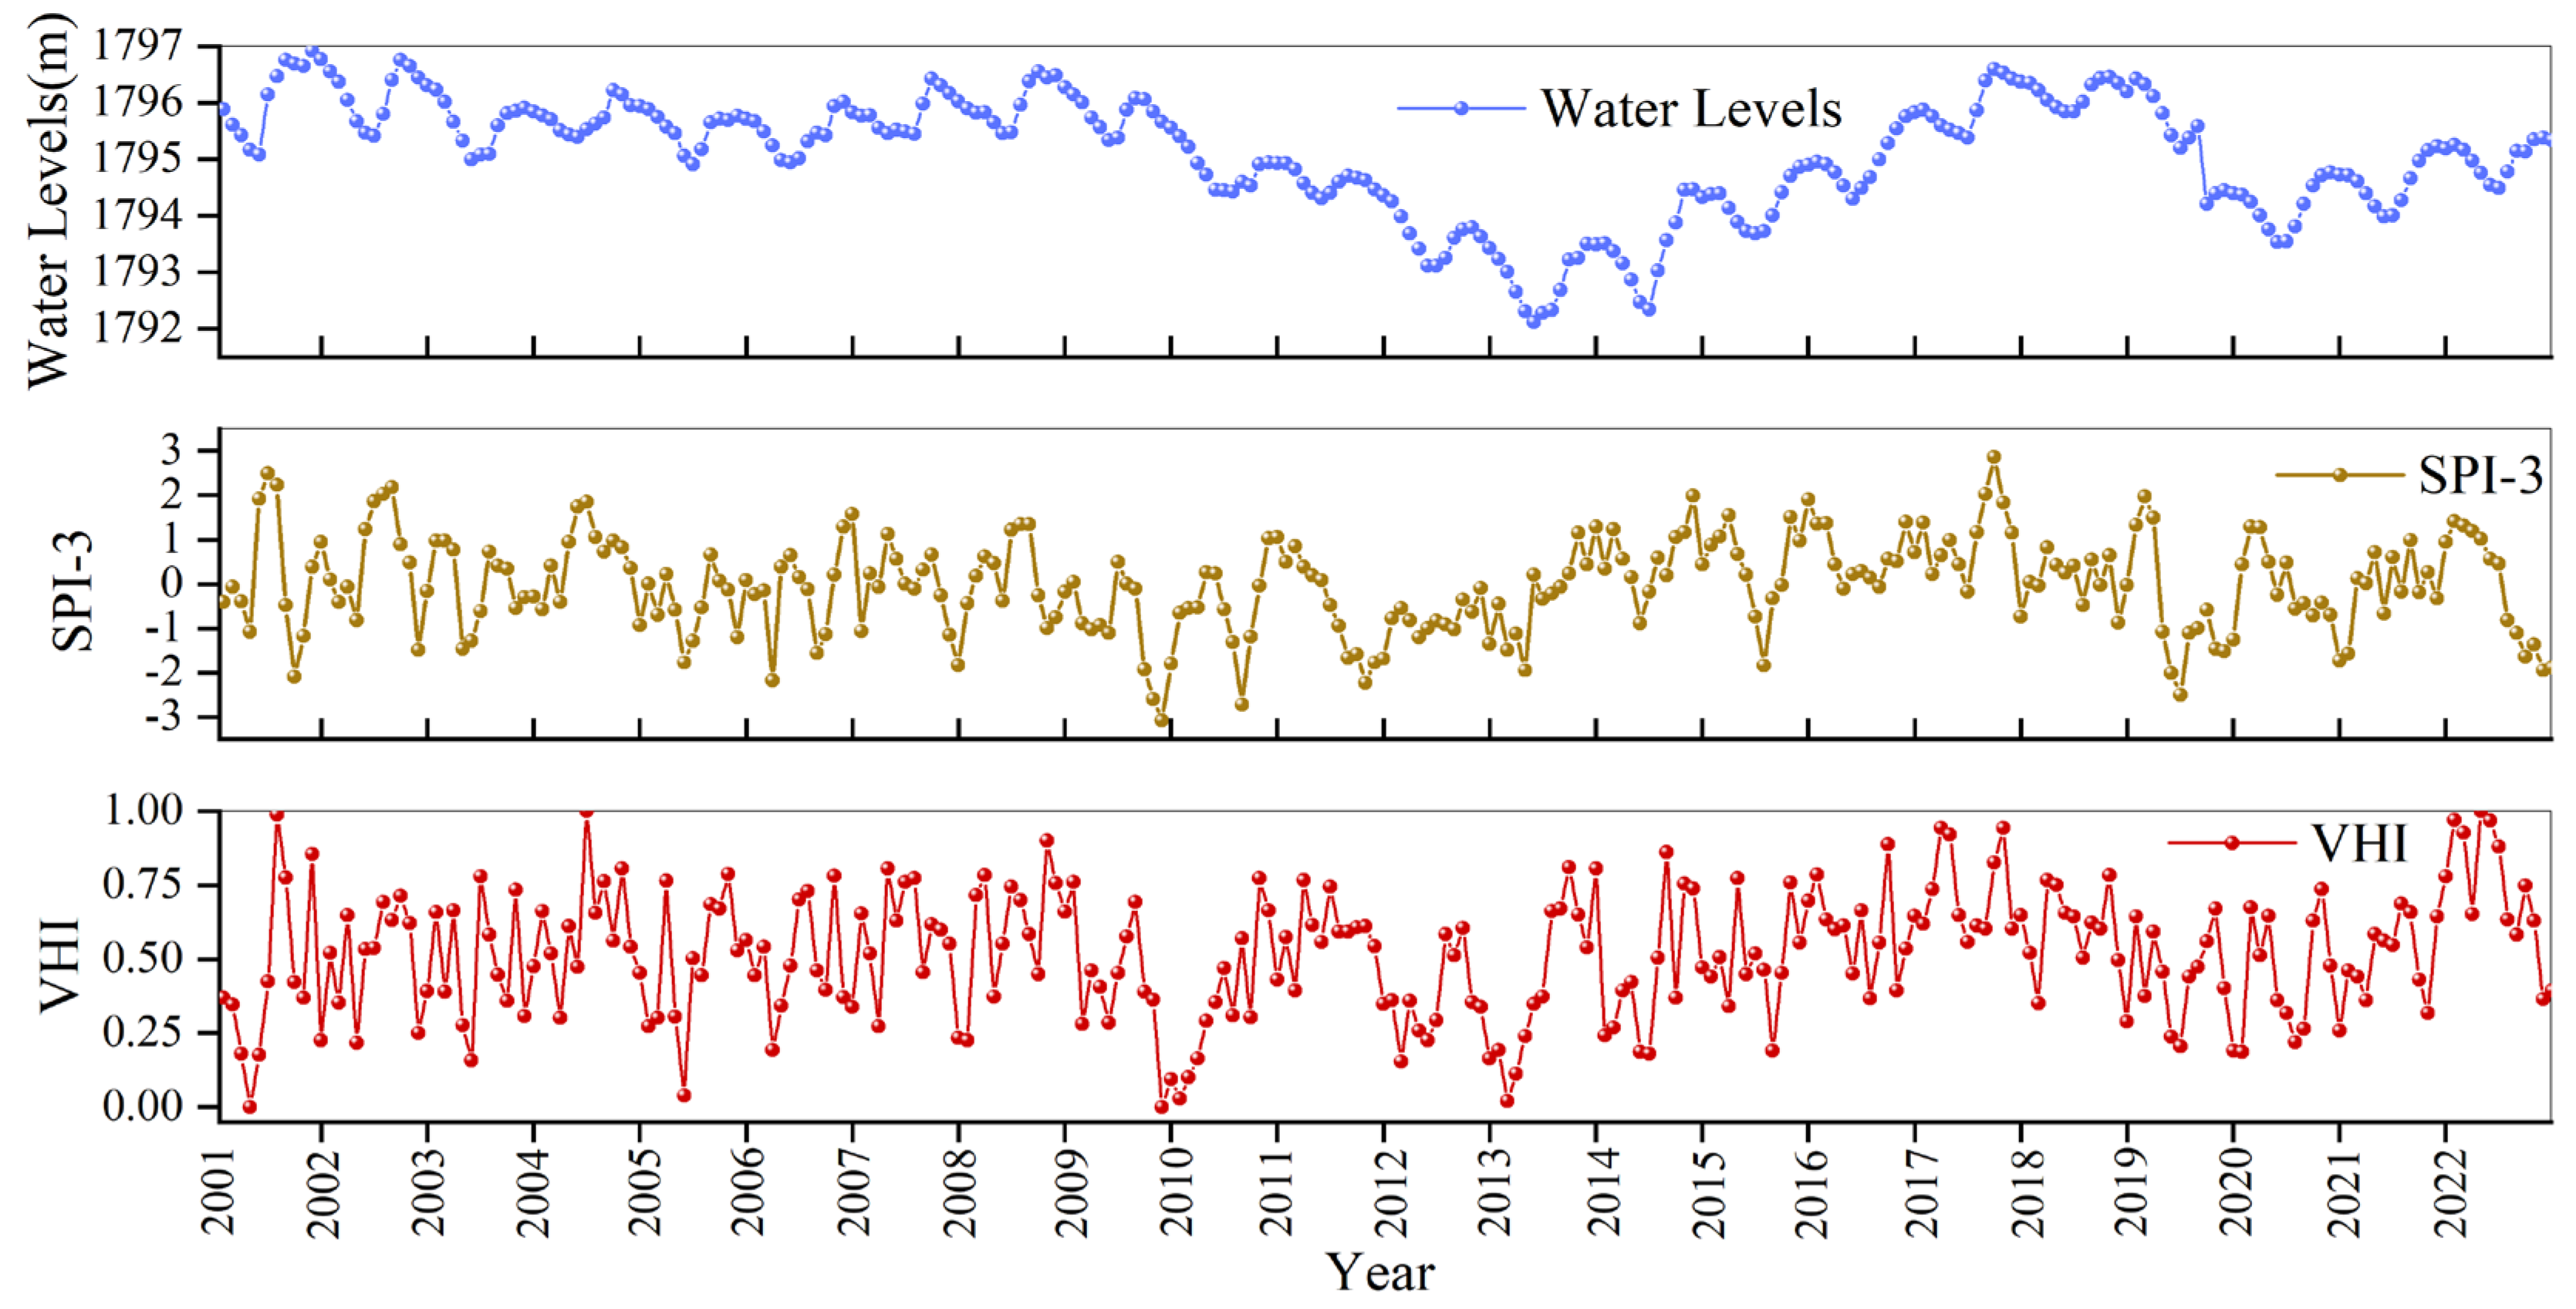
4.2.3. Interannual Variation Characteristics of VHI

As illustrated in Figure 4, the VHI in the study area basin indicates a relative alleviation of agricultural drought conditions. However, notable interannual variability exists within the VHI values. Key observations include the following: Variability in Specific Years: The years 2008 and 2017 recorded higher VHI values, correlating with milder agricultural drought conditions during those periods. In contrast, the years 2009, 2010, 2012, and 2019 saw the overall VHI values reach their lowest points, reflecting severe agricultural drought. Meteorological Influences: The pronounced drought conditions in these years could primarily be attributed to abnormally high temperatures coupled with below-average precipitation. Notably, rainfall levels in these four years were significantly lower than in other years. Drought Severity Timeline: In the four-year span from 2009 to 2012, three of those years experienced considerable drought. Although 2011 exhibited relatively less severe drought conditions, this was due to the alleviation of drought in the winter of 2010 and the spring of 2011, which improved agricultural conditions. However, following the autumn of 2011, the VHI declined, leading to intensified drought conditions that persisted until the end of 2012 [4].
Figure 4. Monthly variations in the SPI-3, VHI, and water levels in the Qilu Lake Basin (2001–2022).
Sustainability 17 04662 g004

4.3. Calculation of Drought-Resistant Water Level Factors for the Lake

4.3.1. Determination of Ecological Water Level for Qilu Lake

First, using on-site measurement data from the Qilu Lake water level monitoring stations, we conducted a frequency analysis of the monthly average water levels. We employed P-III-type theoretical curve fitting to obtain the monthly average water levels at frequencies of P = 75% and P = 95%.
Second, we utilized data on the lake surface area F and water level Z of Qilu Lake to construct a relationship curve that illustrates the change rate of the lake surface area dZ/dF in relation to the water level Z. The maximum point of this relationship curve corresponds to a water level of 1793.47 m, which closely approximates the lake’s natural minimum water level. Accordingly, by applying the morphological method, we established the ecological water level for Qilu Lake to be Z2 = 1793.47 m.
Third, fish play a crucial role in the lake ecosystem and are particularly sensitive to low water levels. Therefore, if we assume that the ecological water level required for fish self-regulation is met, then it stands to reason that the ecological requirements for other biological species will also be fulfilled. Over the past 30 years of operational management practices, it has been observed that, during drought conditions, Qilu Lake maintains the minimum operating water level that accommodates the survival needs of fish. Consequently, the minimum spatial requirement for fish survival was established to be Z3 = 1793.92 m.
Fourth, natural low water levels typically induce disturbances within the ecosystem that remain within its elastic range and do not compromise ecological stability. We defined the average water level during the driest years as the average water level for the driest month, which yielded Z4 = 1792.84 m for Qilu Lake.
Finally, from the perspective of aquatic ecological safety, we adopted the maximum value obtained from four methodologies—hydrological frequency analysis, morphological analysis, the biological space method, and the average water level for the driest month—as the ecological water level for the lake, as detailed in Figure 5.
Figure 5. Monthly ecological water level design results at different frequencies (m).
Sustainability 17 04662 g005

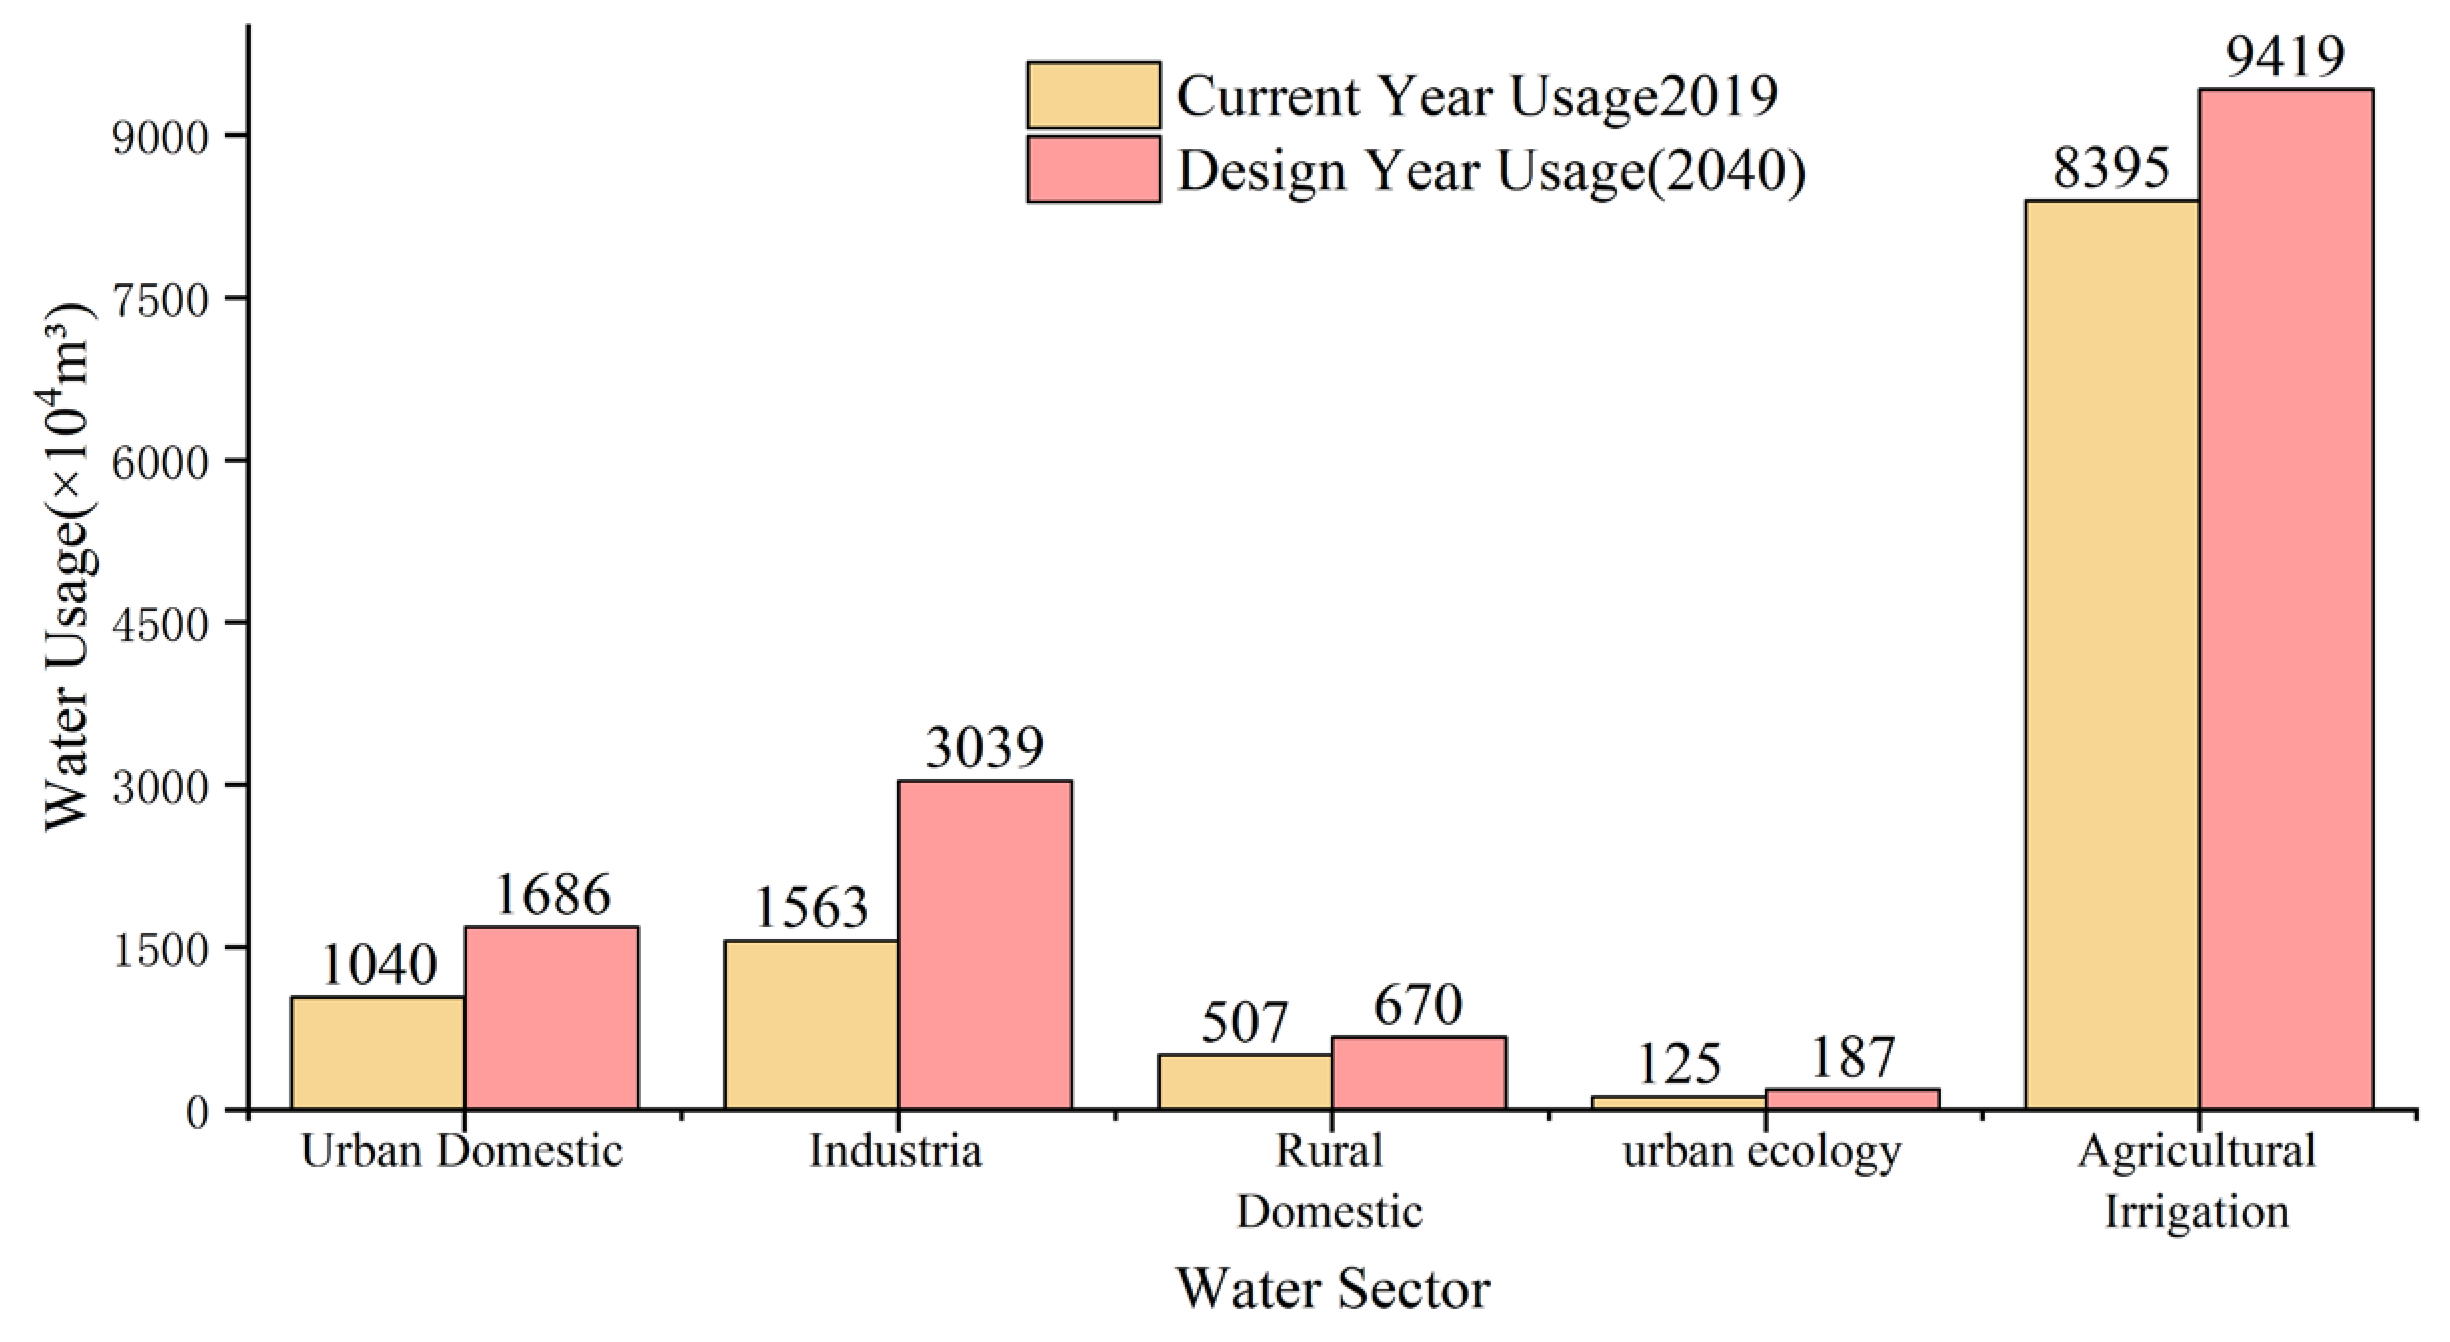
4.3.2. External Water Demand for the Lake

External water demand encompasses various uses, mainly including water for urban and rural household consumption, industrial requirements, agricultural irrigation, and ecological needs for urban areas. It is determined on a monthly basis according to the actual situation using the results of the water resource allocation planning of the second phase of the Central Yunnan Water Diversion Project. Agricultural irrigation water demand fluctuates significantly due to variations in precipitation frequency and seasonal changes, exhibiting considerable intra-annual variability. In contrast, urban and rural domestic water usage, as well as industrial water consumption, remains relatively consistent throughout the year. Moreover, external water demand from the lake is influenced by socio-economic development. While the watershed contains some reservoirs, their capacities are limited. These reservoirs serve primarily to supply water for urban and rural households, industrial activities, and ecological needs within urban environments. Agricultural irrigation largely relies on water sourced from the Hongqi River and the lake itself. The distribution of water usage across various sectors within the Qilu Lake Basin under the water resource planning allocation scheme is summarized in Figure 6.

4.3.3. Calculation of Inflow Runoff to the Lake

Using measured data on Qilu Lake’s inflow, rainfall, and runoff, we retroactively calculated the monthly inflow runoff series from 1965 to 2022. This analysis provides critical insights into the hydrological dynamics impacting the lake, enabling a better understanding of the hydrological trends over the decades.

4.3.4. Calculation of Lake Surface Evaporation

Based on actual observational data, we performed a frequency analysis of the average monthly evaporation rates for Qilu Lake. Utilizing a P-III-type curve fitting technique, we obtained the monthly average evaporation rates across various frequencies within the basin. These data are essential for assessing the water balance of the lake, helping to inform effective water management strategies.

4.4. Revision and Determination of Drought Limit Water Levels

Qilu Lake is a natural lake with a sustainable water supply capacity. The monthly drought limit water levels are calculated according to Formulas (4) and (5), as presented in Table 2.
The short-term drought limit water levels must not exceed the flood limit water level and cannot fall below the minimum operating water level. The revised drought limit water levels are illustrated in Figure 7.
From Figure 7, it is evident that the drought alarm water level consistently exceeds the minimum ecological water level of the lake across different months. This indicates that the drought alarm water level is fully capable of meeting the various needs related to the ecological restoration of the lake and watershed water resource allocation planning, thus ensuring water supply safety. There is a pronounced seasonal variation in both the drought alarm and drought conservation water levels. During spring and winter, the reduction in rainfall and runoff results in a heavy reliance on water drawn from the lake for agricultural production. Consequently, the demand for lake water increases, leading to a corresponding rise in the drought limit water levels. In contrast, during summer and autumn, ample rainfall reduces the demand for lake water, causing the drought limit water levels to decline. It is noteworthy that, regardless of seasonal fluctuations, the minimum value of the drought limit water levels never falls below the lake’s minimum operating water level, thereby ensuring the stability and safety of water level management in the lake.
When the watershed suffers from prolonged drought, different drought limit water levels should be implemented for different levels of agricultural drought. The changes in water levels are a continuous process and exhibit randomness; thus, lake water levels in different months and at different levels of agricultural drought are not fixed values but rather exist within a variable range of upper and lower limits. Therefore, a segmented dynamic control approach should be primarily adopted. The drought limit water levels for specific points in the lake under different inflow frequencies and different drought levels should be calculated according to Formulas (6) and (7) (selecting the maximum VHI values for each drought level: mild drought VHI = 0.3, moderate drought VHI = 0.2, severe drought VHI = 0.1, and extreme drought VHI = 0); however, there are still differences within the same agricultural drought levels. A polynomial equation is selected to fit the relationship between the drought index VHI and the lake drought limit water levels, resulting in the drought limit water levels of the lake for different inflow frequencies and different drought levels. January is taken as an example, as shown in Formula (8):
P 95 % ( U p p e r   S u p p l y   L i m i t ) 1 ( y 1794.29 ) y = 0.0714 x 2 0.7986 x + 1794.6 ( 0 < x 0.4 , 1794.29 < y 1794.6 ) 95 % > P 75 % ( L o w e r   S u p p l y   L i m i t ) 1 ( 1794.6 < y 1795.01 ) y = 0.0714 x 2 0.4986 x + 1795.2 ( 0 < x 0.4 , 1795.01 < y 1795.2 ) P < 75 % ( N o   S u p p l y   L i m i t ) 1 ( y > 1795.2 )
In this equation, X is the VHI. When the VHI is higher than 0.4, there is no agricultural drought in that month, so it is not considered. Y is the lake water level.
In order to scientifically use the lake for drought resistance, alleviate the contradiction between the supply and demand of water resources, and better meet the needs of daily work, the drought limit water levels should be controlled. The operating rules under the short-term drought limit water levels of Qilu Lake are as follows: (1) When the lake water level is above the drought alarm water level, as illustrated in Interval (1) of Figure 7, there will be no restrictions on water supply to the lake. (2) When the lake water level is below the drought alarm water level but above the drought conservation water level, as shown in Interval (2) of Figure 7, water consumption across various sectors within the watershed should be reduced according to a lower supply adjustment coefficient. (3) When the lake water level is below the drought conservation water level, as depicted in Interval (3) of Figure 7, water consumption across various sectors should be curtailed based on a higher supply adjustment coefficient. The operating rules for the drought limit water levels of Qilu Lake under long-term drought conditions are as follows: Taking January as an example, when both water resource shortages and agricultural drought occur simultaneously in the watershed, the drought limit water levels under different drought levels are calculated using inflow frequencies and corresponding VHI values according to Formula (8). Additionally, as indicated in Formula (8), different restrictions on water supply for the watershed are implemented under varying conditions. The adjustment coefficients for the water supply at the drought limit water levels of Qilu Lake are shown in Table 3.

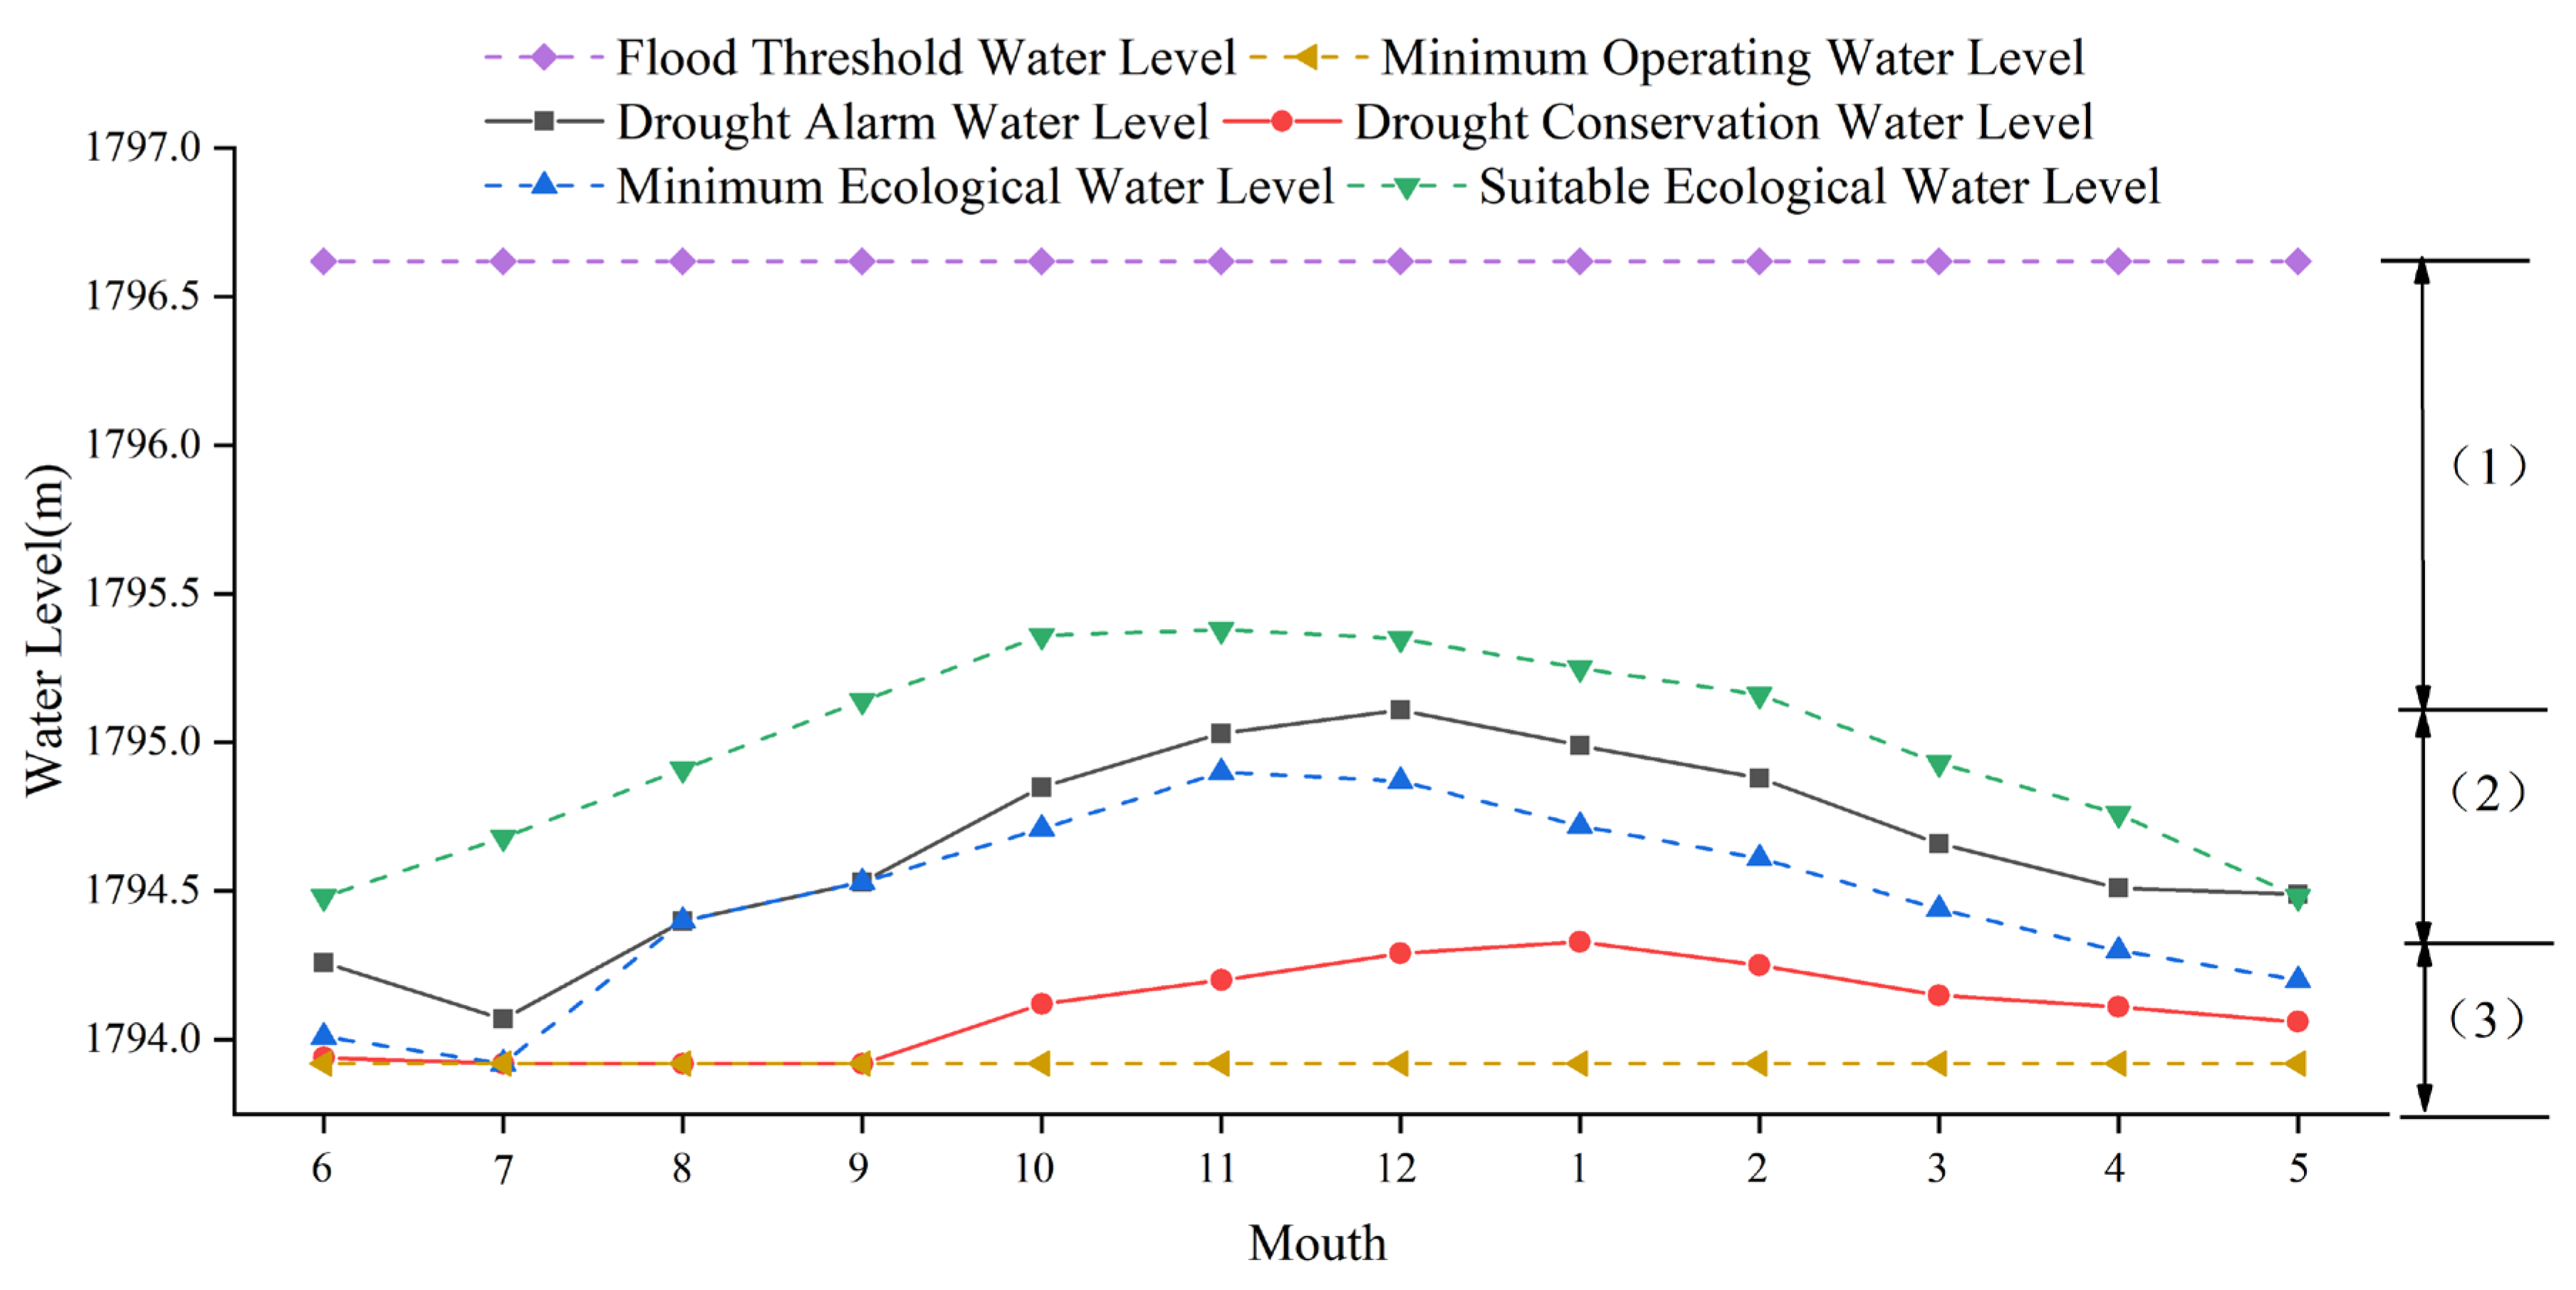
4.5. Rationality Analysis of Drought Limit Water Levels

The current water resources utilization pattern was used to analyze the rationality of drought limit water levels. This analysis focused on the hydrological years of 2009 and 2012 (from June 2009 to May 2013), which are characterized as typical consecutive drought years. According to the measured runoff data of the Qilu Lake Basin covering more than 60 years (1965–2022), both 2011 and 2012 were marked by exceptionally low water availability, representing the two consecutive years with the least inflow. In this section, the water deficit during these consecutive drought years is examined, and its fluctuations are analyzed.
Currently, the Central Yunnan Water Diversion Project is not supplying water for agricultural and industrial production, daily life, or the ecological replenishment of this watershed. Relying only on the ability of the lake to combat drought is quite limiting. Under moderate drought conditions, the lake can still play a certain regulatory role; however, under extreme drought conditions, its ability to resist drought is almost completely lost. Since June 2009, no water intake restrictions have been imposed. This has led to a growing disparity between the water supply and demand, resulting in widespread water scarcity. Notably, out of the analyzed period, only twelve months experienced inflow runoff exceeding the external water consumption of the lake. As illustrated in Figure 8, the most severe monthly deficit reached an alarming 14.93 million cubic meters. Prior to adjusting the water supply regulations, Qilu Lake’s water level fell below the minimum operating level for 15 months across the four consecutive drought years.
Following the implementation of the drought threshold management rules, when the lake water level drops below the drought alarm water level, agricultural irrigation water consumption is reduced to prioritize essential water needs in other sectors. Furthermore, when the water level falls below the drought conservation water level, agricultural irrigation is further curtailed, along with a modest reduction in water use for urban and rural living, industrial applications, and ecological needs. Following the adjustment of the drought limit water levels, as illustrated in Figure 8, during the prolonged dry spell, the water deficit in certain months was alleviated, allowing for the assurance of sufficient water for daily living and production needs.
The establishment of drought limit water levels primarily aims to secure water supply for urban and rural living and industrial sectors. By initiating reductions in agricultural irrigation during the early phases of drought, priority water resources are reallocated to higher-priority sectors, thereby allowing irrigation to focus solely on critical growth periods. This approach mitigates the severity of water shortages in subsequent months, ultimately alleviating the strained water supply situation in the watershed during special drought years.

5. Conclusions

In this study, the agricultural drought conditions in Qilu Lake watershed were assessed using the VHI and SPI; additionally, the drought limit water levels for the lake were determined, and water resource management strategies for different water levels were formulated. The following conclusions were drawn:
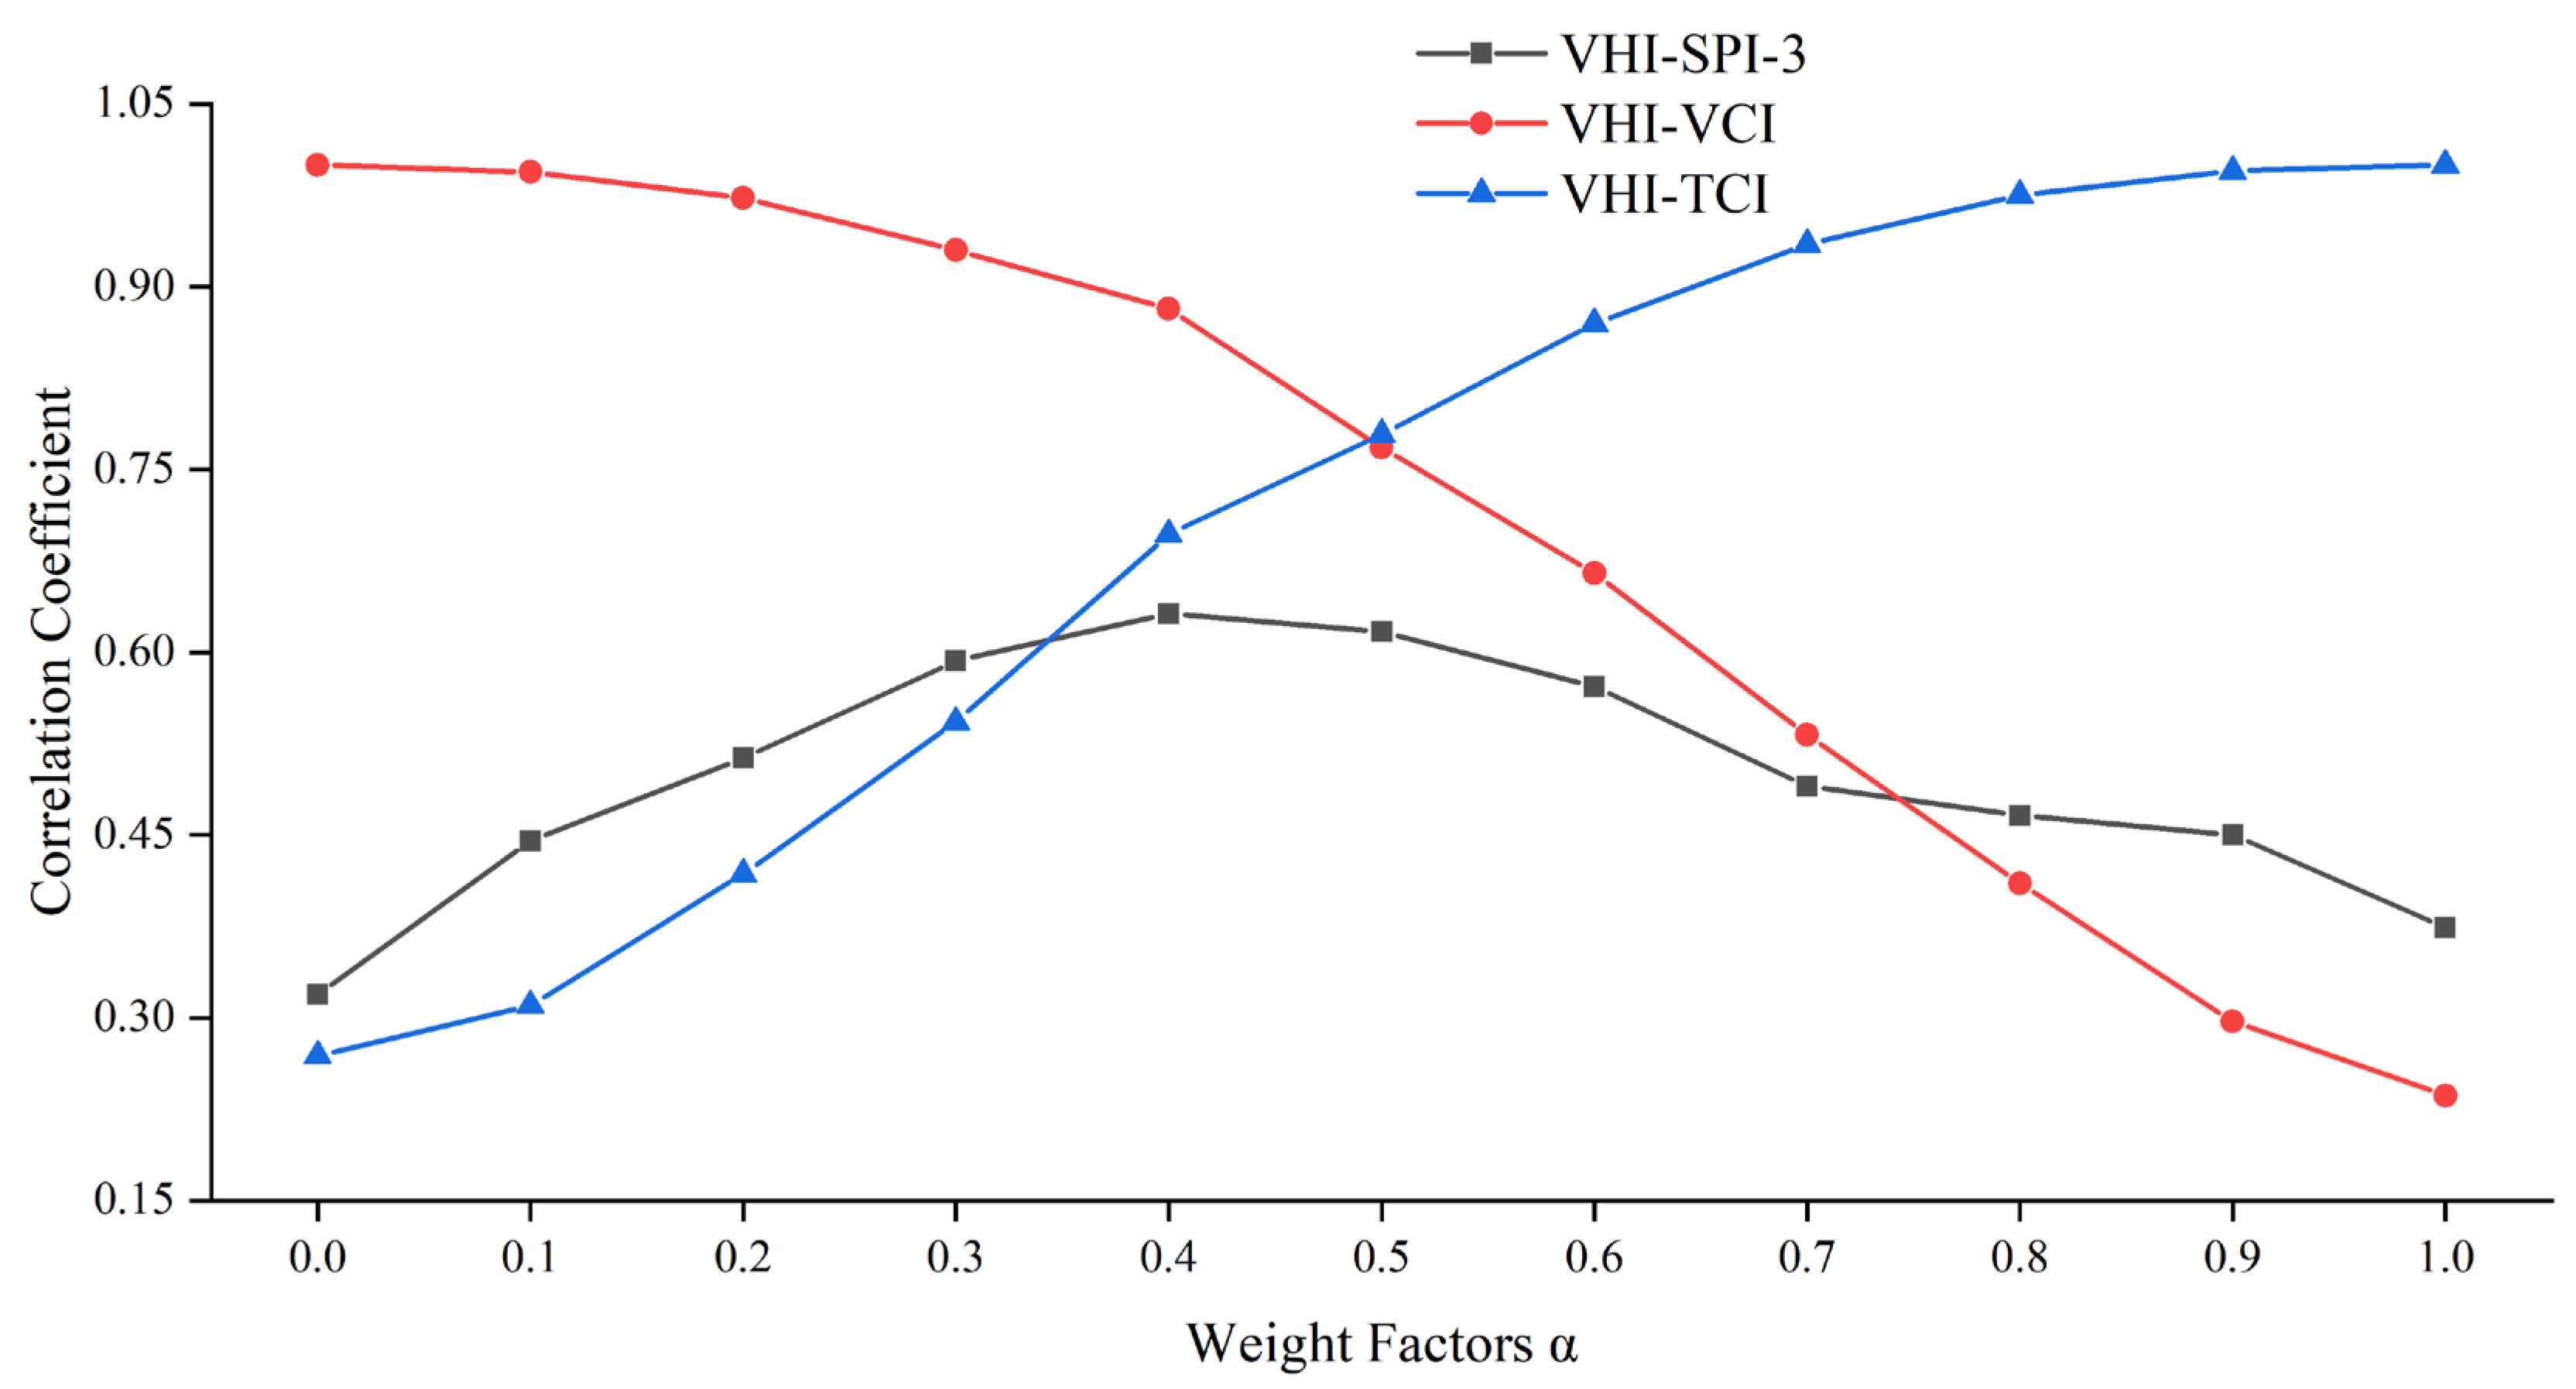
  • Adaptation of VHI: By utilizing hydrometeorological data and satellite remote sensing information and allocating the VCI and TCI a weight ratio of 4:6, the VHI effectively reflected the variations in vegetation growth conditions and surface temperatures within the Qilu Lake watershed. Moreover, the correlation between the TCI and VHI was stronger than that between the VCI and the VHI. A comparison of the SPI at various scales revealed that the VHI demonstrated the best adaptability when associated with SPI-3.
  • Seasonal Drought Patterns: Drought occurrences in the Qilu Lake watershed exhibit distinct seasonal characteristics; spring and winter experience higher frequencies, while summer and autumn experience lower frequencies, consequently reducing associated drought risks. In terms of interannual variations, the period from 2009 to 2012 displayed marked drought phenomena, with three of those years experiencing severe drought conditions. The intensity of agricultural drought peaked in 2009, while the duration of agricultural drought was the longest in 2012.
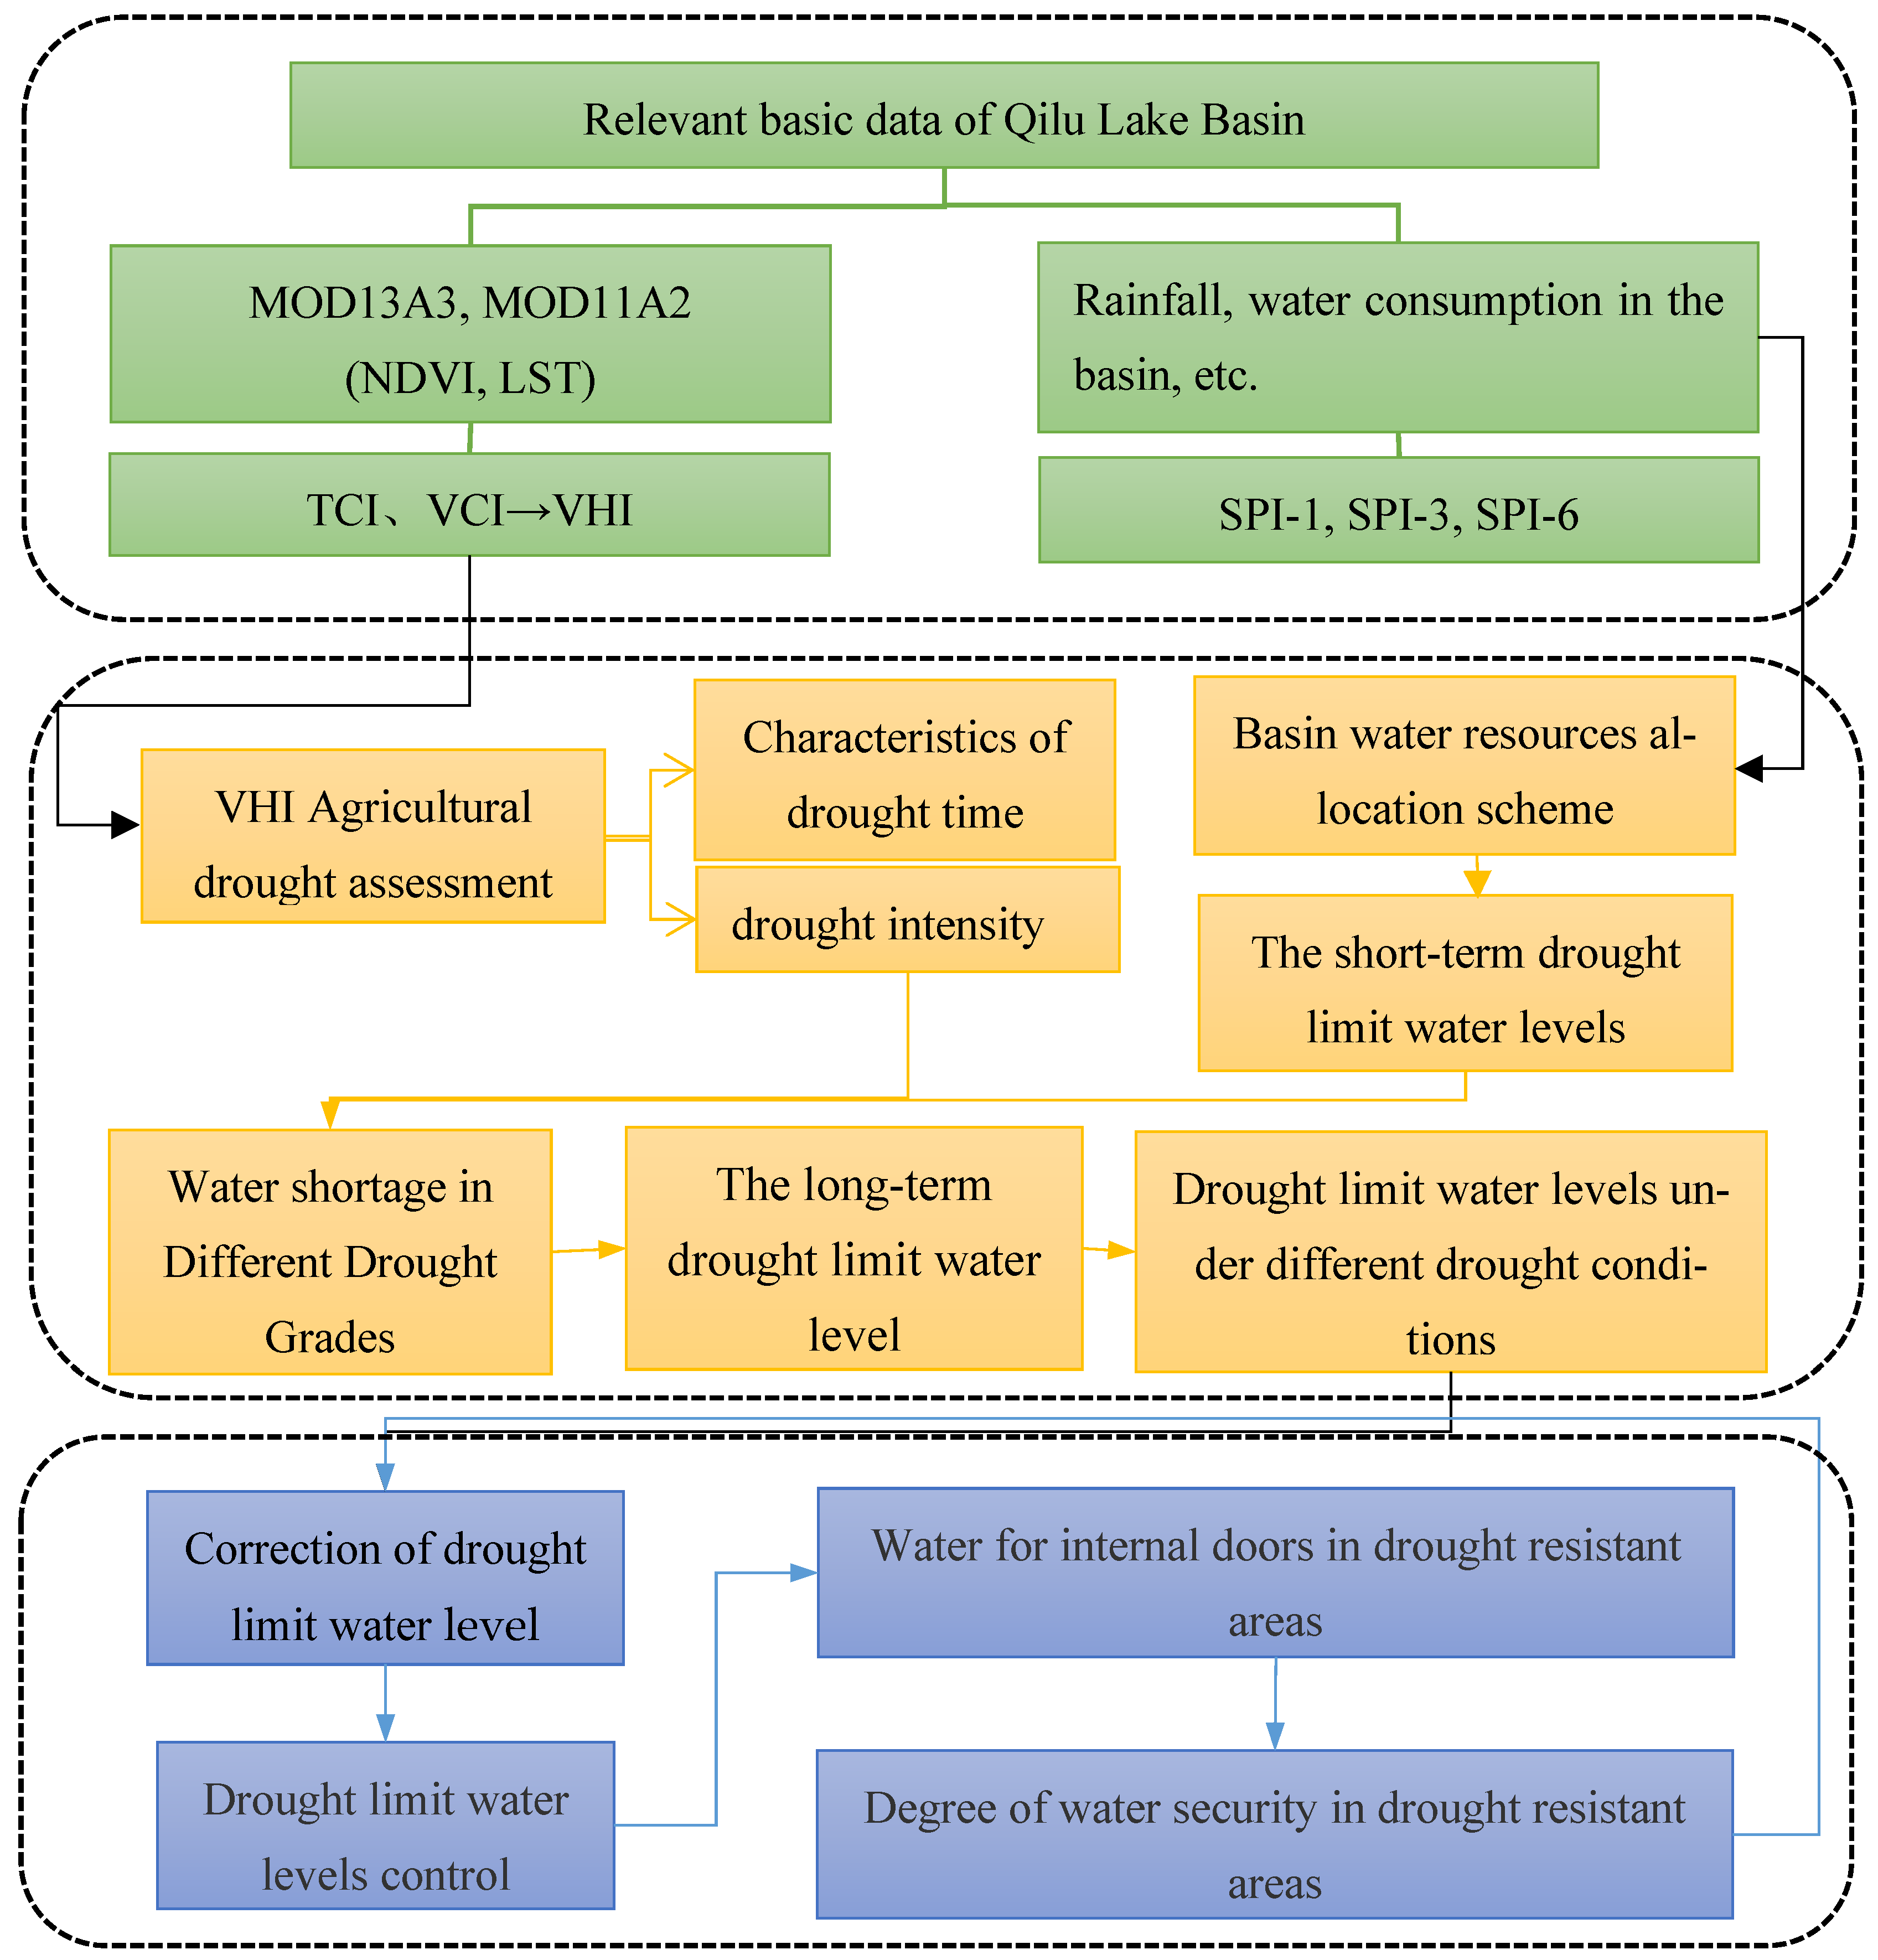
  • In response to the situation after the occurrence of drought, a comprehensive analysis of the watershed’s hydrological conditions, variations in water usage, and agricultural drought was conducted. The drought limit water levels of Qilu Lake were categorized into long- and short-term conditions. The short-term drought limit water levels were further divided into drought warning water levels (corresponding to an inflow frequency of P = 75%), which ranged from 1794.53 m to 1795.11 m, and drought protection water levels (corresponding to an inflow frequency of P = 95%), which fell within the range of 1793.94 m to 1794.31 m. The long-term drought limit water levels were established by adding the water shortages from various sectors, which were caused by different intensities of agricultural drought, to the short-term drought limit water levels. This setting was designed to meet the emergency water supply needs for drought resistance within the watershed. Based on the water resource allocation rules within the watershed, the rationality of the drought limit water levels was examined. On this basis, water resource management strategies targeting lake water levels under different drought conditions were proposed to address the drought situation within the watershed.
Discussion: In this study, agricultural drought conditions in the low-latitude plateau lake watershed were analyzed, utilizing the VHI to discuss its applicability within the research area. However, the suitability of other drought indices in this region was not explored. Similarly, while the VHI reflects the relationship between vegetation growth and temperature, it does not account for other influencing factors. The growth of vegetation is affected by a multitude of conditions, which introduce certain limitations. Further research is required to uncover these complexities and integrate them into the determination of drought limit water levels. The weights of the VCI and TCI in the VHI were optimized using historical data only, and changes in drought frequency and intensity under the background of future climate warming were not fully considered, limiting the long-term applicability of the model. The study area is within the water supply scope of the Central Yunnan Water Diversion Project, and the basin’s ability to regulate water resources has been significantly improved since the introduction of the water supply. Previous studies have shown that although Dianchi, Erhai, Qilu, Yangzonghai, Fuxian, and Yilong Lakes on the central Yunnan Plateau belong to different watershed systems, they are located in the convergence area of warm and humid airflows from the summer southeast monsoon and southwest monsoon. The trends in precipitation and runoff show similar patterns of increasing or decreasing. Therefore, after diverting the water from the Central Yunnan Water Diversion Project to the Qilu Lake watershed, it will be necessary to reassess and adjust the drought limit water levels of these plateau lakes. Considering the improvement in the watershed’s water capacity, it is important to comprehensively consider factors such as climate change, changes in water demand, and ecological protection goals so as to appropriately raise the drought limit water levels of the lakes. There are more than 50 natural lakes on the Yunnan–Guizhou Plateau, and this method can also be applied to establish drought limit water levels for other plateau lake watersheds. This will not only help to test the general applicability of the method but will also provide valuable management strategy references for these regions.

Author Contributions

Investigation, J.C. (Jing Chen); Resources, J.C. (Jinming Chen); Data curation, J.O.; Writing—original draft, K.G.; Writing—review & editing, Y.Z.; Supervision, S.G. All authors have read and agreed to the published version of the manuscript.

Funding

The authors gratefully acknowledge the financial support from the National key Research and Development Program of China (No. 2021YFC3000205-06), the Demonstration Project of Comprehensive Government Management and Large-Scale Industrial Application of the Major Special Project of CHEOS (No. 89-Y50G31-9001-22/23-05), and the High-Level Talents and Innovative Teams in Yunnan Province (No. 2018HC024).

Institutional Review Board Statement

Not applicable.

Informed Consent Statement

Not applicable.

Data Availability Statement

The original contributions presented in the study are included in the article; further inquiries can be directed to the corresponding author.

Acknowledgments

Thanks to Qian Tanghui from Yunnan Normal University for his help and guidance in the processing and analysis of high scores and other remote sensing data in this study.

Conflicts of Interest

The authors declare no conflict of interest.

References

  1. Christian, J.I.; Martin, E.R.; Basara, J.B.; Furtado, J.C.; Otkin, J.A.; Lowman, L.E.L.; Hunt, E.D.; Mishra, V.; Xiao, X. Global projections of flash drought show increased risk in a warming climate. Earth Environ. 2023, 4, 165. [Google Scholar] [CrossRef]
  2. Spinoni, J.; Naumann, G.; Vogt, J.V. Pan-European seasonal trends and recent changes of drought frequency and severity. Glob. Planet. Change 2017, 148, 113–130. [Google Scholar] [CrossRef]
  3. Osmani, S.A.; Baik, J.; Narimani, R.; Kim, J.-S.; Jun, C. Quantification of interactions among agricultural drought indices within Köppen–Geiger climate zones in Bangladesh. Agric. Water Manag. 2024, 302, 108952. [Google Scholar] [CrossRef]
  4. Qian, T.; Shi, Z.; Gu, S.; Xi, W.; Chen, J.; Chen, J.; Bai, S.; Wu, L. A Water Shortage Risk Assessment Model Based on Kernel Density Estimation and Copulas. Water 2024, 16, 1465. [Google Scholar] [CrossRef]
  5. Cook, B.I.; Mankin, J.S.; Marvel, K.; Williams, A.P.; Smerdonand, J.E.; Anchukaitis, K.J. Twenty-First Century Drought Projections in the CMIP6 Forcing Scenarios. Earth Future 2020, 8, e2019EF001461. [Google Scholar] [CrossRef]
  6. Dilling, L.; Daly, M.E.; Kenney, D.A.; Klein, R.; Miller, K.; Ray, A.J.; Travis, W.R.; Wilhelmi, O. Drought in urban water systems: Learning lessons for climate adaptive capacity. Clim. Risk Manag. 2019, 23, 32–42. [Google Scholar] [CrossRef]
  7. Lukk, A.K.; Lusardiand, R.A.; Willis, A.D. Water Management for Conservation and Ecosystem Function: Modeling the Prioritization of Source Water in a Working Landscape. J. Water Resour. Plan. Manag. 2023, 149, 5646. [Google Scholar] [CrossRef]
  8. Ziervogel, G.; Ericksen, P.J. Adapting to climate change to sustain food security. WIREs Clim. Chang. 2010, 1, 525–540. [Google Scholar] [CrossRef]
  9. Liu, Z.; Zhou, W.; Wang, X. Extreme Meteorological Drought Events over China (1951–2022): Migration Patterns, Diversity of Temperature Extremes, and Decadal Variations. Adv. Atmos. Sci. 2024, 41, 2313–2336. [Google Scholar] [CrossRef]
  10. Zhang, Q.; Zou, X.; Chen, X.; Zhao, L.; Li, T.; Qian, Z. A New Drought Index Study that Takes into Account a Multi-timescale and the Effects of Evapotranspiration—Taking Yunnan as an Example. Plateau Meteorol. 2022, 41, 909–920. [Google Scholar]
  11. Wu, Z.Y.; Lu, G.H.; Wen, L.; Lin, C.A. Reconstructing and analyzing China’s fifty-nine year (1951–2009) drought history using hydrological model simulation. Hydrol. Earth Syst. Sci. 2011, 15, 2881–2894. [Google Scholar] [CrossRef]
  12. Yu, M.; Li, Q.; Hayes, M.J.; Svoboda, M.D.; Heim, R.R. Are droughts becoming more frequent or severe in China based on the Standardized Precipitation Evapotranspiration Index: 1951–2010? Int. J. Climatol. 2013, 34, 545–558. [Google Scholar] [CrossRef]
  13. Wilhite, D.A.; Sivakumar, M.V.K.; Pulwarty, R. Managing drought risk in a changing climate: The role of national drought policy. Weather Clim. Extrem. 2014, 3, 4–13. [Google Scholar] [CrossRef]
  14. Chiang, F.; Mazdiyasni, O.; Aghakouchak, A. Evidence of anthropogenic impacts on global drought frequency, duration, and intensity. Nat. Commun. 2021, 12, 2754. [Google Scholar] [CrossRef]
  15. Fang, G.; Tu, Y.; Wen, X.; Yan, M.; Tan, Q. Study on the development process and evolution characteristics of meteorological drought in the Huaihe River Basin from 1961 to 2015. J. Hydraul. Eng. 2019, 20, 598–611. [Google Scholar]
  16. Mannocchi, F.; Todisco, F.; Vergni, L. Evaluating the uncertainty and reliability of standardized indices. Hydrol. Res. 2017, 48, 701–713. [Google Scholar]
  17. Wang, X.; Zhang, Y.; Feng, X.; Feng, Y.; Xue, Y.; Pan, N. Analysis and application of drought characteristics based on run theory and Copula function. Trans. Chin. Soc. Agric. Eng. 2017, 33, 206–214. [Google Scholar]
  18. Laimighofer, J.; Laaha, G. How standard are standardized drought indices? Uncertainty components for the SPI & SPEI case. J. Hydrol. 2002, 613, 128385. [Google Scholar]
  19. Zhu, Y.; Liu, Y.; Ma, X.; Ren, L.; Singh, V.P. Drought Analysis in the Yellow River Basin Based on a Short-Scalar Palmer Drought Severity Index. Water 2018, 10, 1526. [Google Scholar] [CrossRef]
  20. Mirgol, B.; Nazari, M.; Etedali, H.R.; Zamanian, K. Past and future drought trends, duration, and frequency in the semi-arid Urmia Lake Basin under a changing climate. Meteorol. Appl. 2021, 28, e2009. [Google Scholar] [CrossRef]
  21. Spinoni, J.; Barbosa, P.; De Jager, A.; McCormick, N.; Naumann, G.; Vogt, J.V.; Magni, D.; Masante, D.; Mazzeschi, M. A new global database of meteorological drought events from 1951 to 2016. J. Hydrol. Reg. Stud. 2019, 22, 100593. [Google Scholar] [CrossRef] [PubMed]
  22. Li, J.; Wu, X.; Wang, Z.; Yin, J.; Chen, X. Changes of drought characteristics in future in Pearl River Basin describing by a new comprehensive standardized drought index. J. Hydraul. Eng. 2021, 52, 486–497. [Google Scholar]
  23. Rajsekhar, D.; Singh, V.P.; Mishra, A.K. Multivariate drought index: An information theory based approach for integrated drought assessment. J. Hydrol. 2015, 526, 164–182. [Google Scholar] [CrossRef]
  24. Shah, D.; Zhao, G.; Li, Y.; Singh, V.P.; Gao, H. Assessing global reservoir-based hydrological droughts by fusing storage and evaporation. Geophys. Res. Lett. 2024, 51, e2023GL106159. [Google Scholar] [CrossRef]
  25. Chen, J.; Sun, H.; Wang, J.; Liao, W.; Chen, H. Improvement of comprehensive meteorological drought index and its applicability analysis. Trans. Chin. Soc. Agric. Eng. 2020, 32, 71–77. [Google Scholar]
  26. Chang, J.; Li, Y.; Wang, Y.; Yuan, M. Copula-based drought risk assessment combined with an integrated index in the Wei River Basin, China. J. Hydrol. 2016, 540, 824–834. [Google Scholar] [CrossRef]
  27. Seiler, R.A.; Hayes, M.; Bressan, L. Using the standardized precipitation index for flood risk monitoring. Int. J. Climatol. 2022, 22, 1365–1376. [Google Scholar] [CrossRef]
  28. Leng, J.; Ma, K.; Gu, S.; Zhang, K.; He, D. A non-stationary impactquant framework for assessing the human activity impacts on hydrological drought in the Upper Red River. Atmos. Res. 2024, 304, 107419. [Google Scholar] [CrossRef]
  29. Yang, N.; Deng, S. Research Progress in Agricultural Drought Monitoring Based on Multi-source Information. J. Catastrophol. 2024, 39, 125–135. [Google Scholar]
  30. Wen, W.; Timmermans, J.; Chen, Q.; van Bodegom, P.M. Evaluating crop-specific responses to salinity and drought stress from remote sensing. Int. J. Appl. Earth Obs. Geoinf. 2023, 122, 103438. [Google Scholar] [CrossRef]
  31. Xu, Y.; Wang, L.; Ross, K.W.; Liu, C.; Berry, K. Standardized Soil Moisture Index for Drought Monitoring Based on SMAP Observations and 36 Years of NLDAS Data: A Case Study in the Southeast United States. Remote Sens. 2018, 10, 301. [Google Scholar] [CrossRef] [PubMed]
  32. Martínez-Fernández, J.; González-Zamora, A.; Sánchez, N.; Gumuzzio, A. A soil water based index as a suitable agricultural drought indicator. J. Hydrol. 2015, 522, 265–273. [Google Scholar] [CrossRef]
  33. Zhou, L.; Wu, J.; Zhang, J.; Leng, S.; Liu, M.; Zhang, J.; Zhao, L.; Zhang, F.; Shi, Y. The Integrated Surface Drought Index (ISDI) as an Indicator for Agricultural Drought Monitoring: Theory, Validation, and Application in Mid-Eastern China. IEEE J. Sel. Top. Appl. Earth Obs. Remote Sens. 2013, 6, 1254–1262. [Google Scholar] [CrossRef]
  34. Lv, X.R.; Yin, X.T.; Gong, A.D.; Wang, Q.F.; Li, J.; Zhang, H. Temporal and spatial analysis of agricultural drought in yunnan province based on vegetation condition Index. J. Geo-Inf. Sci. 2016, 18, 1634–1644. [Google Scholar] [CrossRef]
  35. Fontana, F.M.A.; Coops, N.C.; Khlopenkov, K.V.; Trishchenko, A.P.; Riffler, M.; Wulder, M.A. Generation of a novel 1km NDVI data set over Canada, the northern United States, and Greenland based on historical AVHRR data. Remote Sens. Environ. 2012, 121, 171–185. [Google Scholar] [CrossRef]
  36. Li, C.; Adu, B.; Wu, J.; Qin, G.; Li, H.; Han, Y. Spatial and temporal variations of drought in Sichuan Province from 2001 to 2020 based on modified temperature vegetation dryness index (TVDI). Ecol. Indic. 2022, 139, 108883. [Google Scholar] [CrossRef]
  37. Bokusheva, R.; Kogan, F.; Vitkovskaya, I.; Conradt, S.; Batyrbayeva, M. Satellite-based vegetation health indices as a criteria for insuring against drought-related yield losses. Agric. For. Meteorol. 2016, 220, 200–206. [Google Scholar] [CrossRef]
  38. Rhee, J.; Im, J.; Carbone, G.J. Monitoring agricultural drought for arid and humid regions using multi-sensor remote sensing data. Remote Sens. Environ. 2010, 114, 2875–2887. [Google Scholar] [CrossRef]
  39. Xia, J.; Chen, J.; She, D. Impacts and countermeasures of extreme drought in the Yangtze River Basin in 2022. J. Hydraul. Eng. 2022, 53, 1143–1153. [Google Scholar]
  40. Dorsey, J.H. Improving water quality through California’s Clean Beach Initiative: An assessment of 17 projects. Environ. Monit. Assess. 2009, 166, 95–111. [Google Scholar] [CrossRef]
  41. Fang, D.; Fath, B.D.; Chen, B.; Scharler, U.M. Network environ analysis for socio-economic water system. Ecol. Indic. 2014, 47, 80–88. [Google Scholar] [CrossRef]
  42. Guo, S.; Liu, P.; Wang, J.; Zhou, Y. Revisiting necessity and feasibility for dynamic control of reservoir water level during flood season. J. Hydraul. Eng. 2023, 54, 1–12. [Google Scholar]
  43. Candido, L.A.; Coêlho, G.A.G.; de Moraes, M.M.G.A.; Florêncio, L. Review of Decision Support Systems and Allocation Models for Integrated Water Resources Management Focusing on Joint Water Quantity-Quality. J. Water Resour. Plan. Manag. 2022, 148, 03121001. [Google Scholar] [CrossRef]
  44. Chen, J.; Yang, X.; Dao, H.; Gu, H.; Chen, G.; Mao, C.; Bai, S.; Gu, S.; Zhou, Z.; Yan, Z. Analyses on Characteristics of Spatial Distribution and Matching of the Human–Land–Water–Heat System on the Yunnan Plateau. Water 2024, 16, 867. [Google Scholar] [CrossRef]
  45. Yong, Z.; Hao, W.; Hao, M.; Guohua, H.; Fan, H. Conception of China’s Double T-shaped water network economic pattern construction. J. Hydraul. Eng. 2022, 53, 1271–1279+1290. [Google Scholar]
  46. Chen, J.; Guo, S.; Li, Y.; Liu, P.; Zhou, Y. Joint Operation and Dynamic Control of Flood Limiting Water Levels for Cascade Reservoirs. Water Resour. Manag. 2013, 27, 749–763. [Google Scholar] [CrossRef]
  47. Luo, C.; Ding, W.; Zhang, F.; Yan, D.; Yan, Z.; Zhou, H. Research on the design and control of grading and staged drought-limited water level for reservoir. J. Hydraul. Eng. 2022, 53, 348–357. [Google Scholar]
  48. Zhou, J.; Lu, Z.; Lou, S.; Huang, W.; Xiao, W.; Wu, H. A method for determining and dynamic controlling the limit water level of lakes by classification and stages. J. Hydraul. Eng. 2022, 53, 127–138. [Google Scholar]
  49. Ge, Q.; Gu, S.; Wang, L.; Chen, G.; Chen, J. Optimal Determination and Dynamic Control Analysis of the Graded and Staged Drought Limit Water Level of Typical Plateau Lakes. Water 2023, 15, 2580. [Google Scholar] [CrossRef]
  50. Nanjing Institute of Geography & Limnology, Chinese Academy of Sciences. Research Report of Chinese Lakes; Science Press: Beijing, China, 2019. [Google Scholar]
  51. Zhang, T.; Wang, F.; Yang, X.; Ma, P.; Gu, S.; Bai, S.; Li, Y. Identification and remediation countermeasures of the Agriculture water problem in Qilu lake basin. IOP Conf. Ser. Earth Environ. Sci. 2019, 376, 012063. [Google Scholar] [CrossRef]
  52. Chen, J.; Zhang, T.; Gu, S. Study on Encounter of Runoff Abundance and Scarcity BetweenSource Area and Receiving Area of the Central YunnanIrrigation Project and the Hydrological Drought. Water Resour. Power 2024, 42, 23–27. [Google Scholar]
  53. Bento, V.A.; Gouveia, C.M.; DaCamara, C.C.; Libonati, R.; Trigo, I.F. The roles of NDVI and Land Surface Temperature when using the Vegetation Health Index over dry regions. Glob. Planet. Chang. 2020, 190, 103198. [Google Scholar] [CrossRef]
  54. Zeng, J.; Zhang, R.; Qu, Y.; Bento, V.A.; Zhou, T.; Lin, Y.; Wu, X.; Qi, J.; Shui, W.; Wang, Q. Improving the drought monitoring capability of VHI at the global scale via ensemble indices for various vegetation types from 2001 to 2018. Weather. Clim. Extrem. 2022, 35, 100412. [Google Scholar] [CrossRef]
  55. Gui, L.; Jiang, X.; Chen, J.; Yu, P.; Gu, S.; Chen, Y.; Chen, Y. Shoreline delimited and management of Qilu lake based on the river (lake) chief system. China Rural Water Hydropower 2022, 6, 8–15. [Google Scholar]
Figure 1. Geographical location map of the Qilu Lake Basin.
Sustainability 17 04662 g001
Figure 2. Design process for drought warning water levels in the Qilu Lake Basin.
Sustainability 17 04662 g002
Figure 3. Correlation between the VHI and SPI-3, the TCI, and the VCI under different weight factors.
Sustainability 17 04662 g003
Figure 6. Water usage by sector in the basin for current year and design year.
Sustainability 17 04662 g006
Figure 7. Revised short-term drought limit water levels and lake operating water level.
Sustainability 17 04662 g007
Figure 8. Changes in the water levels of Qilu Lake in each month before and after setting the drought limit water levels under the current conditions.
Sustainability 17 04662 g008
Table 1. Drought period classification according to the SPI and VHI.
CategorySPIVHIPrecipitation (mm/mouth)
Wet≥−0.5≥0.4≥43.4
Mild drought−1~−0.50.3~0.426.7~43.4
Moderate drought−1.5~−10.2~0.315.7~27.6
Severe drought−2~−1.50.1~0.27.54~15.7
Extreme drought<−2<0.1<7.5
Table 2. Monthly drought limit water level design results at different frequencies (m).
Month January February March April May June
Drought Alarm Water Level (P = 75%)1794.991794.881794.661794.511794.291794.06
Drought Conservation Water Level
(P = 95%)
1794.331794.251794.151794.111794.061793.94
MonthJulyAugustSeptemberOctoberNovemberDecember
Drought Alarm Water Level (P = 75%)1793.971794.401794.531794.851795.031795.11
Drought Conservation Water Level
(P = 95%)
1793.921793.921793.921794.121794.201794.29
Table 3. Water supply adjustment coefficients under drought limit water levels.
Urban DomesticIndustrialEcological Water UseAgricultural Irrigation
Drought Alarm Water Level
(Lower Supply Limit)
1110.8
Drought Conservation Water Level
(Upper Supply Limit)
0.90.80.750.5
Disclaimer/Publisher’s Note: The statements, opinions and data contained in all publications are solely those of the individual author(s) and contributor(s) and not of MDPI and/or the editor(s). MDPI and/or the editor(s) disclaim responsibility for any injury to people or property resulting from any ideas, methods, instructions or products referred to in the content.

