1. Introduction
Urban rail transit (URT) systems form the backbone of contemporary urban transportation, recognized widely for their substantial transport capacity, high operational efficiency, and extensive network coverage [
1]. Beyond their roles in alleviating urban traffic congestion, reducing energy consumption, and mitigating noise pollution [
2], URT systems significantly shape urban spatial structures and promote compact urban development, particularly in metropolitan regions and urban agglomerations [
3,
4]. Given the rising urgency to address global urban sustainability and carbon neutrality targets, optimizing URT operations has become essential for realizing broader environmental and socio-economic sustainability objectives.
Despite these acknowledged benefits, URT systems worldwide continue to face substantial operational challenges. In China, temporal and spatial imbalances in passenger demand, coupled with inefficient train scheduling practices, have led to increased operational costs, reduced passenger convenience, and heavier travel burdens. Similar issues occur in developed countries, where fluctuating passenger flows frequently disrupt service regularity, exacerbate station overcrowding, and undermine overall transit system resilience [
5,
6]. With ongoing urbanization and increasing reliance on public transportation, particularly under policy frameworks emphasizing sustainability, the need for timely, effective, and adaptive operational strategies has become increasingly urgent.
Existing research has made significant strides in aligning passenger demand with service provision, yet critical gaps remain. Many studies focus on multi-objective formulations, mixed operation strategies, and heuristic algorithms; however, traditional approaches often exhibit limited solution accuracy and computational efficiency [
7]. For instance, commonly employed bi-objective models are typically sensitive to weighting schemes for competing objectives and seldom adequately capture the spatiotemporal unevenness inherent in passenger flows. These limitations underscore the need for innovative models and solution methodologies capable of comprehensively addressing the complexities of real-world URT operations.
To fill the research gap, this study develops a novel multi-objective optimization model designed explicitly for URT service planning, concurrently minimizing passenger waiting times, reducing total train mileage, and optimizing passenger load distribution along the line. To efficiently solve the proposed model, we introduce an advanced swarm-intelligence heuristic—namely, the Pelican Optimization Algorithm (POA)—to jointly optimize short-turn and full-length train operation strategies. To our knowledge, this research constitutes the first attempt to apply and adapt the POA within an urban rail transit optimization context. A case study conducted on a busy metro line validates the effectiveness, robustness, and practical applicability of the proposed model and algorithm. Overall, the developed framework not only effectively mitigates conflicts between passenger service quality and operational costs but also provides transit agencies with a flexible and adaptive decision-support tool, thereby significantly contributing to the sustainable development of urban rail transit systems.
2. Literature Review
Given the uneven temporal and spatial distribution of passenger flows, urban rail transit systems frequently face issues such as imbalanced train loads, inefficient resource utilization, peak-hour congestion, and off-peak capacity wastage. In response, researchers have primarily focused on three aspects: multi-objective optimization and integrated system optimization, train operation strategy optimization, and advanced solution algorithms and methodologies.
- (1)
Multi-objective optimization and integrated system optimization
To address uneven passenger distribution and inefficient resource utilization in urban rail transit systems, substantial research has been conducted on multi-objective optimization and integrated system optimization. Zhang et al. [
1] developed a simulation-based optimization framework using Simultaneous Perturbation Stochastic Approximation (SPSA), significantly reducing passenger waiting times through improved timetable coordination. Li et al. [
8] proposed train rescheduling models to enhance system resilience, effectively mitigating station congestion during disruptions. Lu et al. [
9] investigated cascading failure propagation considering passenger spatiotemporal heterogeneity, suggesting network topology adjustments to improve resilience.
Accurate passenger flow predictions are crucial to support optimization strategies. Liu et al. [
10] introduced a hybrid model combining ridge regression and LSTM, significantly enhancing forecasting accuracy, which supports operational decision-making. Dong et al. [
11] proposed a collaborative energy-saving control using the Dragonfly Reinforcement Learning-Driven Algorithm (DRLDA), effectively reducing energy consumption and passenger waiting times. Liu et al. [
12] emphasized the importance of integrating train scheduling with passenger flow controls, significantly reducing platform congestion.
Moreover, understanding passenger behavior in complex networks further supports system-level optimization. Shih et al. [
13] proposed a non-compensatory path-choice model to capture transfer passengers’ route decisions realistically, providing insights into passenger distribution patterns essential for effective operation planning.
Despite these advances, current research often overlooks network-level interactions and passengers’ dynamic behavioral responses in real-time conditions, thus limiting the practical applicability of models. Future studies should incorporate these aspects to achieve more robust and adaptive URT optimizations.
- (2)
Train operation strategy optimization
Train operation strategy optimization in URT primarily encompasses four areas: routing schemes, departure frequency optimization, train marshalling schemes, and stop-skipping strategies. Among these, departure frequency optimization is typically integral to almost all optimization approaches due to its direct impact on passenger waiting times and operational costs. Conversely, train marshalling schemes and stop-skipping strategies are highly dependent on specific line conditions, thus these are beyond the scope of this review.
Routing scheme optimization is a crucial strategy for improving operational flexibility and efficiency. Yang L et al. [
7] introduced an integrated optimization model combining train timetabling and flexible train composition for Y-type URT lines. Their dynamic coupling and decoupling approach allowed better adaptation to varying passenger demand patterns, significantly enhancing service levels and reducing fleet size. He P et al. [
14] developed a local line optimization model focusing on passenger flow allocation, proposing a short-turn service strategy to address uneven demand distribution. This approach effectively balanced passenger loads and improved resource utilization.
Zhang et al. [
15] developed an integrated operation mode combining express/local and short-turning strategies, significantly reducing passenger waiting times and operating costs during peak periods. Additionally, He et al. [
16] utilized a Genetic Algorithm to optimize short-turn routing, effectively reducing congestion and waiting times by identifying optimal turnaround locations and frequency splits. Similarly, Li et al. developed an integer linear programming model for real-time timetabling on Y-type urban rail lines, incorporating virtual coupling operations to enhance scheduling flexibility and vehicle circulation efficiency [
17]. Yin et al. [
18] optimized short-turn and full-length service operations based on controlling train load factors, effectively mitigating crowding during peak hours and balancing train loads along the line.
In terms of departure frequency optimization, Wen et al. [
19] applied an Advantage Actor-Critic deep reinforcement learning approach to real-time scheduling, dynamically adjusting train dispatch frequencies according to real-time passenger flows. This method improved operational responsiveness and significantly decreased passenger waiting times, reflecting the importance and effectiveness of dynamic frequency optimization strategies.
Due to their strong dependence on specific operational contexts and infrastructure constraints, train marshalling schemes [
20,
21] and stop-skipping strategies [
22,
23,
24] are acknowledged but excluded from detailed discussion in this review.
Overall, routing scheme optimization and departure frequency optimization represent effective strategies to improve operational flexibility, efficiency, and passenger service quality under dynamic URT conditions. However, future research should also address context-specific constraints to enhance the practical applicability of optimization solutions.
- (3)
Advanced solution algorithms and methodologies
Heuristic algorithms have become standard approaches for solving complex optimization problems in URT operations due to their computational efficiency and adaptability. Traditional heuristic algorithms, such as Genetic Algorithms and Particle Swarm Optimization, have been extensively applied. He et al. [
16] employed a GA to optimize short-turn routing schemes, effectively alleviating congestion during peak hours. Similarly, Wei et al. [
25] utilized PSO for Y-type routing optimization, achieving rapid convergence and significantly improving service levels.
Recognizing certain limitations in traditional heuristic methods, recent studies have increasingly adopted improved or hybrid heuristic approaches. Wang et al. [
26] introduced the Arctic Puffin Optimization (APO), a bio-inspired metaheuristic algorithm inspired by puffin foraging behaviors, demonstrating superior global optimization capability across complex engineering problems. Gao et al. [
27] combined the Non-dominated Sorting Genetic Algorithm II (NSGA-II) with gradient-projection methods to simultaneously optimize line planning and timetabling, achieving a favorable balance between passenger satisfaction and operational efficiency. Furthermore, Bai and Zhang [
28] developed an Adaptive Large Neighborhood Search (ALNS) algorithm integrated with virtual coupling technology for optimizing skip-stop scheduling, significantly improving passenger travel times and operational flexibility.
Recently, the Pelican Optimization Algorithm (POA), another novel heuristic inspired by natural pelican foraging strategies, has gained significant attention. Initially proposed by Trojovský and Dehghani [
29], the POA demonstrated strong performance across benchmark and engineering optimization problems. Subsequently, Qiu et al. [
30] enhanced the POA with multiple strategies, including chaotic disturbances and mutation mechanisms, significantly improving its performance in UAV path-planning applications. Song et al. [
31] further improved the POA by introducing chaotic interference factors and mathematical function perturbations, preventing premature convergence and enhancing search accuracy. Ge et al. [
32] proposed a hyperchaotic map integration within the POA, effectively maintaining population diversity and increasing the ability to escape local optima. Additionally, Zhang et al. [
33] validated an improved POA combined with symmetric cross-entropy for multi-threshold color image segmentation, confirming its broad applicability and robustness. The progression from traditional heuristics towards hybrid and novel bio-inspired algorithms illustrates an ongoing trend toward more effective, adaptive, and robust solution methodologies in URT optimization research.
In summary, the current demand for train operation scheme optimization in URT systems emphasizes rapid responsiveness and flexibility to accommodate multiple objectives under varying scenarios. To address these requirements, this study proposes a multi-objective optimization model aiming at minimizing passenger average waiting time, reducing train operational mileage, and achieving balanced passenger load distribution along the rail line. An improved Pelican Optimization Algorithm (POA) is employed and enhanced to effectively solve the developed model, ensuring optimal and adaptable operation schemes for dynamic passenger demands.
3. Problem Description
3.1. Problem Background
The train operation plan serves as a fundamental element in organizing urban rail transit systems, requiring a careful balance between transport capacity and passenger demand. With the continuous expansion of urban rail transit networks, passenger flow patterns have become increasingly diverse and complex, making it challenging for a uniform operational model to accommodate varying demands effectively. Due to significant spatial and temporal imbalances in passenger flow distributions, developing targeted operational strategies tailored to the distinct characteristics of individual lines and their specific passenger demand conditions has become essential.
Typically, urban rail transit lines employ a single operational mode, where the maximum sectional passenger flow dictates departure frequency. However, for common line types such as diametrical and radial configurations, passenger demand is typically much higher in central urban areas compared to suburban segments. Under traditional operational practices, such demand disparities lead to overcrowding and excessively high-load factors within central sections during peak hours, whereas suburban segments suffer from underutilization, resulting in wasted capacity and inefficiencies.
Therefore, optimizing mixed short-turn and full-length operational strategies becomes crucial for fully utilizing train capacity and effectively accommodating the heterogeneous passenger demand across different line segments.
In this study, the operational characteristics of the Nanjing Metro system are employed as a representative case for analysis and discussion. As of November 2023, the Nanjing urban rail transit network comprises 12 operational lines, namely Lines 1, 2, 3, 4, 7, 10, S1, S3, S6, S7, S8, and S9, all utilizing standard metro-type systems. These lines collectively serve 226 stations (including transfer stations counted multiple times) and cover approximately 473 km, constituting an extensive transit network spanning all 11 administrative districts of Nanjing, as well as Jurong City.
Currently, most lines operate under either a single-route service pattern or a combination of single-route and mixed short-turn/full-length service modes. The specific operational modes employed on each line are summarized in
Table 1.
As indicated in
Table 1, even in major metropolitan areas such as Nanjing, where operational pressures are substantial, metro systems generally adopt relatively homogeneous service patterns. Although this operational uniformity enhances system stability, facilitates comprehensive scheduling, and supports consistent all-day service plans, it may not adequately address load imbalances observed across different line segments. Additionally, maintaining uniformly high service levels under these operational schemes can increase costs and limit flexibility in responding effectively to unforeseen circumstances. The subsequent sections of this study aim to analyze these issues further and propose more adaptable operational strategies specifically designed to reflect actual passenger flow patterns.
3.2. Mixed Operation of Short-Turn and Full-Length Services
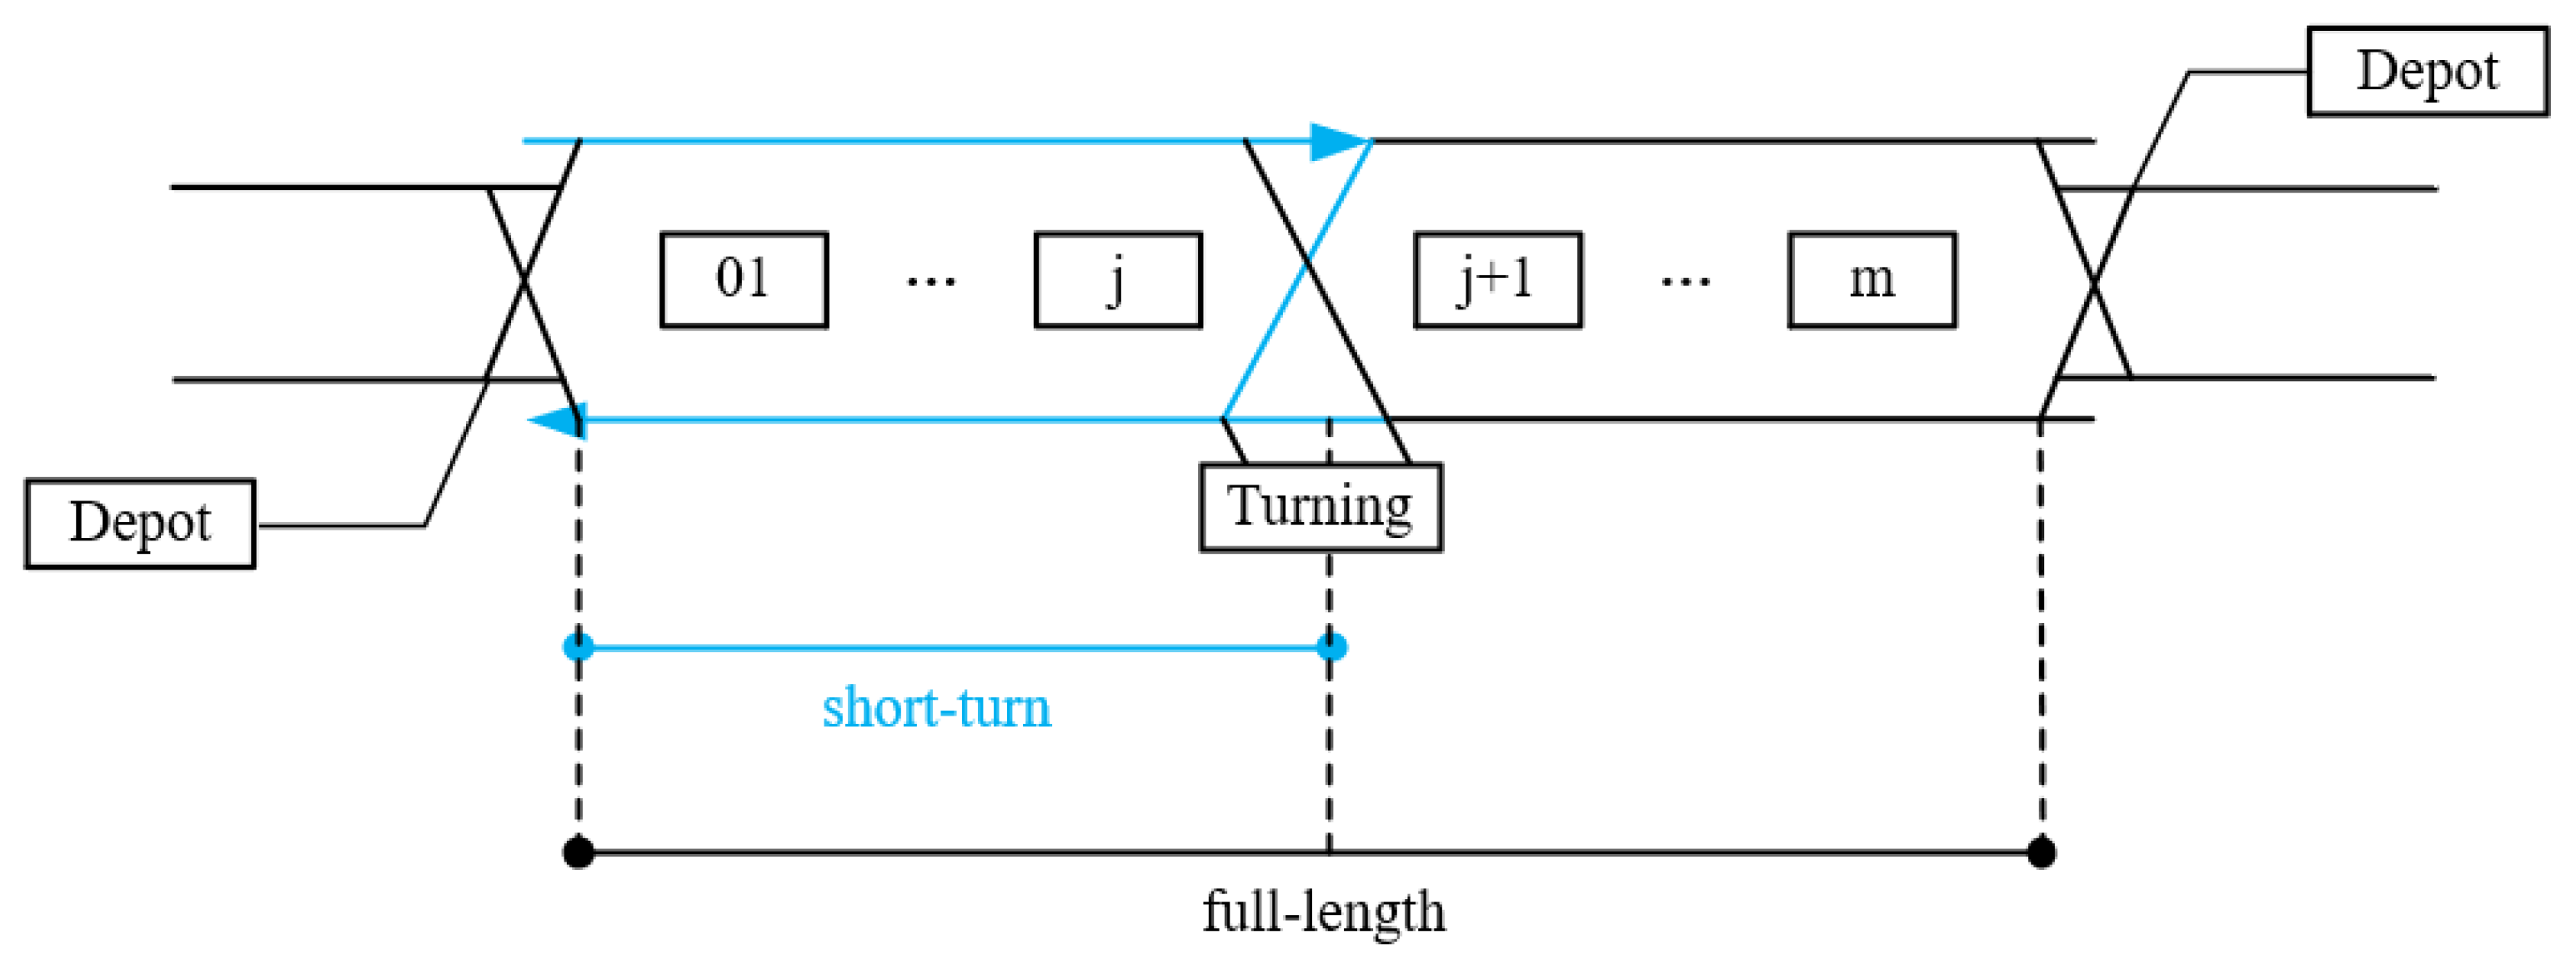
Short-turn operation is a strategic approach designed to address high passenger demand in specific segments of an urban rail line by allowing certain trains to turn back at intermediate stations instead of running the entire route. This method increases service frequency in high-demand sections while minimizing unnecessary operations in lower-demand segments, thus enhancing the overall efficiency of train resource utilization.
Typically, short-turn services overlap with full-length operations in sections characterized by higher passenger volumes, as illustrated in
Figure 1. For instance, the segment from Station 1 to Station J may serve as a short-turn route, with trains terminating at the designated intermediate turn-back station (Station J). In contrast, full-length services cover the entire route from Station 1 to the terminal Station N. Short-turn services may share the same origin station as full-length routes, terminating earlier along the line, or alternatively, they may operate between completely independent start and end points.
Compared to traditional single-route operations, the implementation of mixed short-turn and full-length service models allows for increased train frequency within high-demand segments without necessitating additional rolling stock, thereby effectively reducing overall passenger waiting times. However, this operational strategy may result in longer travel times for passengers whose journeys extend beyond the short-turn service areas or involve transfers between different train service types. Additionally, the deployment of short-turn services necessitates intermediate stations equipped with appropriate turn-back infrastructure, potentially increasing both construction and operational costs.
Full-length trains typically operate along the entire length of the transit line, effectively serving passengers undertaking long-distance travel from origin to terminal stations and meeting comprehensive end-to-end travel demand. In contrast, short-turn trains primarily serve segments experiencing higher passenger volumes, often bypassing less congested peripheral sections to enhance operational efficiency. During peak travel periods, short-turn operations are particularly effective in accommodating concentrated passenger demand within core segments, mitigating congestion in heavily utilized areas. By focusing service capacity on sections with the highest passenger loads, short-turn operations efficiently address peak-hour commuting demands and significantly alleviate overcrowding.
The mixed operation of short-turn and full-length train services is particularly suitable for transit lines exhibiting the following passenger flow characteristics:
High-demand sections: certain segments along the line experience significantly higher passenger volumes, usually concentrated around major transportation hubs or key interchange stations.
Uneven passenger distribution: passenger demand intensity varies considerably across different segments of the line, resulting in clearly distinguishable peak and off-peak sections.
Mixed travel demand: the transit network simultaneously serves short-distance commuters concentrated within core urban areas and long-distance passengers traveling across the entire length of the line.
Figure 2 provides a detailed illustration of the sectional passenger flow along Nanjing Metro Line 1 during the morning peak hour (08:00–09:00). The horizontal axis represents the sequential track sections between stations, while the vertical axis indicates the passenger flow in units of persons per hour (pax/h). The chart clearly reveals a pronounced tidal pattern in passenger movement.
In the upward direction (represented in blue), passenger flow increases steadily from the initial sections, peaking around sections 13–14. This pattern reflects the typical inbound commute toward central business districts. Conversely, in the downward direction (in red), the flow begins to rise significantly after section 10 and reaches its maximum at section 21, indicating a concentration of passengers traveling out of the central area.
Notably, there is a marked asymmetry between the two directions, with the downward flow exhibiting higher peak values in the later sections of the line. This imbalance underscores the need for differentiated train service strategies—such as implementing short-turn services—to better match train capacity with spatial variations in demand and improve operational efficiency during high-load periods.
3.3. Load Balancing Based on Passenger Demand Characteristics
The maximum sectional passenger flow observed during peak hours is a fundamental criterion for determining the operational scale of urban rail transit systems. It is critical for guiding decisions related to vehicle selection, operational planning, and the establishment of infrastructure design standards. Typically, departure frequencies are determined using the maximum sectional flow method. To ensure efficient and safe operation, the ratio of the maximum sectional passenger flow to the available transport capacity—commonly referred to as the load factor—should generally be maintained below 1.
where
—load factor
—maximum sectional passenger flow (passengers/hour)
—train departure frequency (trains/hour) on the analyzed section
—train capacity (passengers/train)
Simultaneously, the decision to implement mixed short-turn and full-length service operations in urban rail transit systems largely depends on the extent of passenger flow imbalance across different line segments. A critical metric for evaluating this imbalance is the sectional imbalance coefficient, which quantifies the uneven distribution of passenger demand along the transit route. Specifically, the sectional imbalance coefficient is defined as the ratio of the maximum sectional passenger flow in a particular direction to the average passenger flow across all sections in the same direction within a specified period.
—sectional imbalance coefficient
—passenger flow on section (passengers/hour)
—total number of sections
A higher sectional imbalance coefficient signifies greater disparities in passenger demand among different line segments, thereby making the implementation of mixed short-turn and full-length service operations more advantageous. Conversely, a lower imbalance coefficient indicates a relatively uniform passenger flow distribution, typically favoring a single-route operation mode. Generally, when the imbalance coefficient surpasses the threshold value of 1.5, the line is deemed suitable for deploying mixed operational strategies. However, passenger flow imbalance alone constitutes a necessary but insufficient condition for implementing such strategies; additional considerations, such as operational economics and engineering feasibility, must also be carefully evaluated.
In summary, this section has analyzed the fundamental factors influencing train operation planning in urban rail transit, encompassing passenger demand characteristics, operational constraints, and the spatial distribution of passenger flow. These insights provide an essential foundation for developing the optimization model described in the subsequent section.
4. Modeling
4.1. Basic Assumptions
Based on the characteristics of mixed short-turn and full-length operational models, this study makes the following assumptions:
Passenger arrivals at stations follow a uniform distribution, and all passengers board the first available train serving their intended destination without retention or deliberate waiting behavior.
Passenger flows within the segments served by short-turn operations are proportionally allocated according to the departure frequency ratio between full-length and short-turn trains.
Full-length and short-turn trains operate on independent rolling stock cycles, with the total number of operating trains constrained by the available rolling stock capacity of the line.
Train operations are assumed to be unaffected by external disturbances; trains in both directions run at consistent speeds without experiencing delays or interruptions.
The proposed optimization model for short-turn and full-length service operations is established at the planning and design stage. It is assumed that both the origin and terminal stations of short-turn services possess adequate turn-back facilities, with a constant and identical turnaround time at all designated turn-back stations.
All trains operate with a consistent station-to-station stopping pattern; scenarios involving train overtaking are excluded from consideration.
The number of cars per train set is identical for both full-length and short-turn train services.
This study assumes that passenger arrivals at stations follow a uniform distribution within the analysis time interval (e.g., peak hour). This assumption is commonly adopted in urban transit modeling literature due to its analytical simplicity and tractability, particularly in frequency-based operation models. The uniform arrival hypothesis reflects typical peak-period demand characteristics, where passenger arrivals are steady and continuous due to high trip volumes and consistent commuting patterns. Moreover, such a simplification avoids the need for complex arrival rate modeling, which may not significantly affect system-level performance indicators like average waiting time, especially under high-frequency service conditions where trains arrive every few minutes.
4.2. Optimization Objectives
Urban rail transit operations primarily involve two principal stakeholders: passengers and transit operating companies. Passengers generally prefer shorter headways to reduce waiting times and enhance travel comfort, whereas transit operators typically prefer longer intervals to decrease operational costs. This divergence results in an inherent conflict of interest between these two stakeholders. Consequently, traditional optimization methods frequently adopt bi-objective models aimed at simultaneously minimizing passenger travel costs and operational expenditures. Although some existing studies on mixed short-turn and full-length operational strategies consider load balancing, such considerations are usually incorporated through hierarchical modeling or embedded constraints. To address these limitations, this study explicitly integrates load balancing as a distinct optimization objective, thereby establishing a comprehensive tri-objective optimization framework.
- (1)
Passenger Travel Costs
Passenger travel costs typically comprise two main components: in-vehicle travel time and waiting time. Given the assumption that all trains operate at a constant speed and consistently follow a station-to-station stopping pattern, the in-vehicle travel time remains fixed and is therefore excluded from further analysis in this study. Under the assumption of uniformly distributed passenger arrivals, passenger waiting time is directly proportional to overall travel costs. Consequently, minimizing average passenger waiting time serves as a suitable proxy objective for minimizing total passenger travel costs.
Consider an urban rail transit line, whose operational layout is illustrated in
Figure 3. The line consists of
N stations, with trains running in the upward direction (from Station 1 to Station
N) denoted as
d = 1, and in the downward direction as
d = 2. Full-length trains traverse the entire line from Station 1 to Station
N and then turn back, whereas short-turn trains serve a partial segment only, operating between Station
S0 and Station
S1 before returning. The departure frequencies of full-length and short-turn trains are denoted by
and
, respectively. The shared operation segment between both services is referred to as
M2, while the segment exclusive to full-length trains is denoted as
M1.
In the implementation of the short-turn and full-length service model on an urban rail transit line, passengers whose origin and destination (OD) both lie within section M1 are assumed to travel exclusively on full-length trains. Accordingly, their average waiting time is determined solely by the departure frequency of full-length services.
In section M2, where both full-length and short-turn trains operate concurrently, the combined departure frequency equals the sum of the full-length frequency () and the short-turn frequency (). Passengers whose entire OD pair falls within this shared section are assumed to board the first available train of either type.
For cross-segment passengers—those whose OD pair spans beyond the short-turn section—such as traveling from a short-turn station to a terminal station, transfers at the boundary station (e.g., S1) may be possible in real-world scenarios. However, from the perspective of average waiting time, these passengers still rely on full-length trains to complete their journey. Thus, their average waiting time is equivalent to that of passengers using only full-length services.
Given that trains operate at short and regular intervals, and under the assumption of uniformly distributed passenger arrivals, the average waiting time is approximated as half the departure interval. For passengers entirely within the short-turn section, their expected waiting time is based on the combined frequency of both services, i.e., .
The average waiting time for passengers whose entire OD pair falls within the short-turn section is given by the following:
where the passenger flow demand for short-turn services, i.e., OD pairs entirely within the short-turn section is calculated as follows:
Where
represents the total passenger flow demand for the short-turn section, calculated as follows:
where
represents the number of passengers traveling from station
to station
, with both stations located inside the short-turn section
.
In contrast, full-length passengers are those whose travel involves at least one station outside the short-turn section (i.e., either origin or destination lies beyond
). Their total passenger demand is represented as follows:
Accordingly, the average waiting time for full-length passengers is calculated based solely on the full-length service frequency:
The total waiting time for all passengers traveling in the upward direction, including both short-turn and full-length travelers, is therefore as follows:
where
and
denote the short-turn and full-length passenger demands, respectively, in the upward direction (e.g., south to north).
The factor 60 is used to convert hourly frequencies to per-minute average waiting times.
Similarly, the total waiting time for all passengers traveling in the downward direction is expressed as follows:
where
and
correspond to the short-turn and full-length demands in the downward direction (e.g., north to south).
The optimization objective is to minimize the overall total passenger waiting time across both directions:
This objective function serves as one of the key components in the multi-objective optimization framework, guiding the allocation of short-turn and full-length services to best accommodate varying passenger distributions and reduce system-wide waiting costs.
- (2)
Operating Costs
Operating costs associated with urban rail transit operations typically include two primary components: fixed costs and variable costs [
11]. Fixed costs generally encompass expenditures for rolling stock procurement and construction of necessary turn-back facilities. However, since this study emphasizes operational optimization within existing infrastructure conditions, and considering that fixed costs significantly differ from dynamic operational expenses, the costs related to new rolling stock acquisition and infrastructure construction are excluded from this analysis.
In previous research, variable operating costs have typically been evaluated based on factors such as total train mileage, energy consumption, and operational time. Given that this study specifically targets peak-hour operations with a focus on ensuring service quality and balancing passenger load distributions, total train mileage is adopted as the principal metric to quantify operational costs.
Accordingly, for both full-length and short-turn services, the mileage per train trip is calculated by summing the distances between consecutive stations along their respective routes.
where
denotes the total distance of a full-length trip, and
is the distance between station
and station
on the full-length route.
where
denotes the trip mileage of a short-turn train, covering only the section from station j to station m.
Therefore, the total train mileage is calculated as follows:
- (3)
Load Balancing
In the implementation of mixed short-turn and full-length operational strategies, differences in departure frequencies between these two service types may lead to load factor imbalances within the shared operational segments. Such imbalances can adversely affect service quality. On the one hand, inconsistent service frequencies may decrease passenger satisfaction; on the other hand, uneven occupancy rates can result in certain trains becoming overcrowded, while others remain underutilized, thus causing inefficient use of transit capacity. Therefore, from an operational perspective, minimizing disparities in sectional load factors while adequately satisfying overall passenger demand is critically important.
Building upon the preceding analysis, the proposed model seeks to enhance load factor balancing between full-length and short-turn train services within their shared segments. For each segment, the degree of imbalance is quantified as the squared difference between load factors of the two operational types. Consequently, the optimization objective is formulated to minimize the total squared deviations of load factors across all relevant segments.
The load factor balance objective is defined as follows:
where
is the load factor in section i in the upward direction, so as
in downward direction, and
the average load factor over all sections.
The load factor for the upward direction in section i is calculated as follows:
and the load factor in section i of the full-length zone in the downward direction is calculated as follows:
where
represents the total passenger flow in section
i, and
C is the train capacity.
Similarly, the load factor in section i of the short-turn zone in both direction is calculated as follows:
Due to the significant asymmetry in directional passenger flows caused by tidal demand patterns, the model evaluates load factor balance separately for the upward and downward directions.
In summary, the load balancing objective is formulated as follows:
Combining all objectives, the final multi-objective function is formulated as follows:
4.3. Constraints
Considering practical operational requirements, the following constraints are incorporated into the optimization model to ensure adequate service quality, operational feasibility, and adherence to resource limitations under the proposed mixed short-turn and full-length operation strategy.
Minimum departure frequency constraint: to maintain acceptable service quality and attract sufficient ridership, the departure intervals for both full-length and short-turn trains must not exceed the predefined maximum allowable interval.
Maximum departure frequency constraint: to comply with the upper limit of the line’s capacity, the combined departure interval of both train types must not fall below a minimum threshold.
Capacity assurance constraint: to prevent passenger retention and ensure sufficient transport capacity, the passenger load on each section must not exceed the available capacity per unit time.
Turn-back station position constraint: to ensure operational feasibility, the starting and ending stations of short-turn services must be stations with turn-back capabilities.
Short-turn coverage constraint: to avoid overly short short-turn routes and ensure that high-demand areas are sufficiently covered, the short-turn section must account for a minimum proportion of total passenger flow.
Train turnover constraint: The total number of trains in operation must not exceed the available rolling stock. The turnover time for each train type is calculated based on cumulative travel times.
: round-trip time for a full-length train:
: round-trip time for a short-turn train:
where
is travel time between station
i and
i + 1.
This section formulates the mathematical constraints essential for optimizing a mixed short-turn and full-length service operational plan. These constraints ensure the minimization of passenger waiting times, the reduction of operational mileage, and improved load factor balancing across various segments, all while maintaining high service quality and adhering to practical resource limitations.
5. Improved Pelican Optimization Algorithm
5.1. Algorithm Description
The decision variables in the proposed model include the departure frequencies of full-length and short-turn trains ( and ), as well as the station indices n and m that define the short-turn route boundaries.
Given that the problem is formulated as a multi-objective constrained optimization task, this study employs an Improved Pelican Optimization Algorithm (IPO) based on the original POA framework.
The POA is inspired by the searching and hunting strategies of pelicans, incorporating both exploration (global search) and exploitation (local refinement) phases. While the original POA demonstrates strong local search capabilities and computational efficiency, it may converge prematurely or fail to escape local optima.
To overcome these limitations, this study integrates three enhancement techniques into the POA framework: Tent chaotic mapping for improved population diversity, Cauchy mutation for escaping local optima, and a sparrow vigilance mechanism for adaptive search adjustment. These modifications aim to improve solution accuracy while preserving the algorithm’s fast convergence characteristics.
The proposed algorithm operates in three main stages: population initialization, movement toward prey, and surface skimming.
Assume the optimization variable vector is , with upper and lower bounds . Each individual in the population is initialized as x = L + (U − L) × z, where z is a random decimal vector in the range [0, 1] with d dimensions.
- 2.
Movement Towards Prey:
During each iteration, a pelican is randomly selected as the prey. All other pelicans update their positions based on a comparison between their own fitness and that of the prey. The update rule is as follows:
represents the new position of the j-th dimension for the i-th pelican individual during the movement towards prey phase. Here, σ is a random decimal within the range [0, 1], I is a random integer between 1 and 2, and is the objective function value of the prey.
After calculating the new position during the movement towards the prey phase, the objective function value at the new position is compared with the objective function value at the original position of the pelican. If the new position yields a better objective function value than the original position, the pelican’s position is updated to the new position.
- 3.
Surface Skimming Phase:
After reaching the water surface, pelicans spread their wings and collect prey in their throat pouches. This process enhances the algorithm’s local search capability. The mathematical model for the new position of a pelican during this phase in each iteration is expressed as follows:
represents the new position of each pelican after perturbation in the second phase. Here, t is the current iteration number,
is the maximum number of iterations, β is a random decimal in the range [0, 1], and R is a random integer in the range [1, 2]. As iterations progress,
decreases, resulting in smaller perturbation amplitudes. This reflects the fact that as the iterations approach the global solution, smaller local perturbations are required.
The objective function value at the perturbed new position is then compared with the objective function value at the original position of the pelican. If the new position yields a better objective function value, the pelican’s position is updated to the new position obtained after the movement towards prey phase.
5.2. Algorithm Improvements
The Pelican Optimization Algorithm is enhanced in this study through the following three mechanisms:
- (1)
Tent Chaotic Mapping for Population Initialization
To achieve a more diverse and well-distributed initial population, Tent chaotic mapping is introduced during the initialization phase. The formula is as follows:
represents the j-th dimension of the random vector z used in the initialization of the i-th individual. The z-vector for the first individual is generated randomly, while the rest are iteratively calculated using the equation above.
Additionally, during the movement toward prey phase, a nonlinear weight factor
w is introduced to balance global and local search dynamics:
The movement rule is modified as follows:
The factor w is relatively small at the beginning of iterations to promote global exploration, and gradually increases to support local exploitation as the algorithm converges.
- (2)
Cauchy Mutation Strategy for Enhanced Diversity
In the surface skimming phase, a Cauchy mutation is introduced to improve population diversity. If a pelican’s fitness is better than the population average, it is considered to be in a converging state and a mutation is applied to avoid premature convergence.
Otherwise, the original update rule is used. The mutation rule is defined as follows:
- (3)
Incorporating the Sparrow Alert Mechanism
In the skimming-over-water phase of the Pelican Algorithm, the sparrow alert mechanism is added. By integrating the sparrow alert mechanism, the Pelican Algorithm can achieve faster convergence.
When a pelican senses danger, individuals on the edge of the group will quickly move to a safe area to find better positions, while pelicans located in the center of the population will move randomly to approach other pelicans. The mathematical expressions are as follows:
The algorithm pseudocode is shown in
Table 2.
6. Case Study
In this study, a single metro line, referred to as Line X, is selected for case study analysis. This line is modeled based on the actual structure and operational characteristics of Nanjing Metro Line 1, with certain modifications and anonymization applied due to data confidentiality requirements.
In practical applications, the ratio of passengers utilizing full-length versus short-turn services can be estimated using AFC system data. AFC records contain detailed tap-in and tap-out information that allows for the reconstruction of OD pairs. By identifying whether both the origin and destination stations fall within the short-turn service segment, or if one lies outside, the corresponding passenger flows can be classified accordingly. Although this study uses aggregate passenger flow data to model demand, future extensions may incorporate AFC-derived OD matrices to calibrate and validate the distribution between full-length and short-turn riders with greater precision.
In the proposed multi-objective optimization model, the passenger traveling cost, operating cost, and load balance objectives are simultaneously considered. To avoid the need for pre-assigned fixed weights—which may introduce subjectivity or distort trade-offs among objectives—the model adopts a non-fixed weighting strategy during optimization. Specifically, we apply a dynamic or adaptive weighting mechanism embedded within the IPO algorithm, where the relative importance of each objective is adjusted iteratively based on solution quality and convergence behavior. This approach allows for a more balanced and unbiased exploration of the Pareto front, rather than relying on manually determined constant weights. Future research may explore stakeholder-informed or data-driven weight calibration methods using techniques such as the Analytic Hierarchy Process (AHP) or multi-criteria decision analysis (MCDA) if context-specific priorities are known.
During peak hours, Line X operates using a combination of short-turn and full-length train services, which makes it suitable for evaluating the effectiveness of the proposed optimization model.
As shown in
Figure 4, the stations along Line X are sequentially numbered in the up and down directions. Sections marked in red dotted boxes indicate those with turn-back capability.
In addition to the terminal stations (Stations 1 and 9), intermediate Stations 3, 4, 5 and 6 are also equipped with turn-back facilities, and are therefore considered as candidate nodes for defining the boundaries of the short-turn route.
The basic operational parameters and characteristics of Line X are summarized in
Table 3.
Based on real-world operational conditions, Line X consists of 32 stations, among which 16 stations are equipped with turn-back capabilities, providing sufficient flexibility for implementing short-turn operations. In the optimization model, passenger waiting time is measured in minutes, while train operating distances are calculated in kilometers.
The short-turn coverage threshold (ε) is set to 0.6, meaning that the short-turn route must cover at least 60% of the total sectional passenger flow. This value is selected based on practical operational experience and supported by existing studies in urban rail transit planning. It ensures that the short-turn service effectively alleviates pressure in the most congested segments of the line, without significantly affecting through-passenger service.
In real-world metro operations, short-turn and full-length trains are typically dispatched in integer ratios (e.g., 1:1 or 2:1). This practice facilitates the scheduling of train timetables and ensures operational stability. However, such constraints may limit the potential for optimization.
In this study, we consider two dispatching strategies: Integer-ratio dispatching, which reflects practical operational practices; and Flexible frequency dispatching, where the departure frequencies of short-turn and full-length trains are treated as continuous decision variables.
By comparing the outcomes under these two strategies, the study aims to explore the gap between theoretical optimal solutions and practical implementation, and to provide insights for improving real-world scheduling practices.
Table 4 summarizes three train operation strategies designed for Line X: the Unoptimized Plan, representing the current operation without optimization; the Optimized (I) strategy, where the departure frequencies of full-length and short-turn trains are constrained to an integer ratio; and the Optimized (F) strategy, which allows flexible, non-integer dispatch ratios between the two train types.
The three operational strategies differ significantly in their dispatching structure, frequency ratio, and selection of turn-back stations. The Unoptimized Plan uses a fixed 1:1 dispatch ratio and selects the two terminal stations as turn-back points. The Optimized (I) strategy adopts an integer dispatch ratio (e.g., 3:1) and shifts the short-turn endpoints to better match high-demand zones. The Optimized (F) strategy further refines both the frequency allocation and turn-back station locations by allowing flexible frequency combinations and unconstrained candidate station selection.
These differences reflect the model’s ability to adapt both operational intensity and spatial configuration to the underlying passenger demand patterns. Their impacts on key performance indicators—such as passenger waiting time, total train mileage, and load balancing, are measured.
In actual operation plans, fixed frequencies are often used for scheduling purposes, with departures arranged according to the specified frequencies. This study does not take timetable preparation into account but focuses on finding the optimal departure frequencies and routing schemes. The optimized results are shown in
Table 5.
Based on the results in
Table 5, the Optimized (F) strategy with flexible dispatch ratios yields the best overall performance. Compared to the Unoptimized Plan, it reduces the total passenger waiting time by 4.54%, the train mileage by 5.44%, and improves the objective function value by 5.00%, demonstrating the effectiveness of flexible optimization in addressing demand heterogeneity.
The Optimized (I) strategy, which restricts dispatch ratios to integers, still shows substantial improvements over the unoptimized baseline: a 7.41% reduction in waiting time, a 2.59% decrease in mileage, and a 3.40% improvement in the objective value. However, its load balance index remains higher than that of the flexible strategy, indicating that its ability to evenly distribute passenger loads is relatively limited.
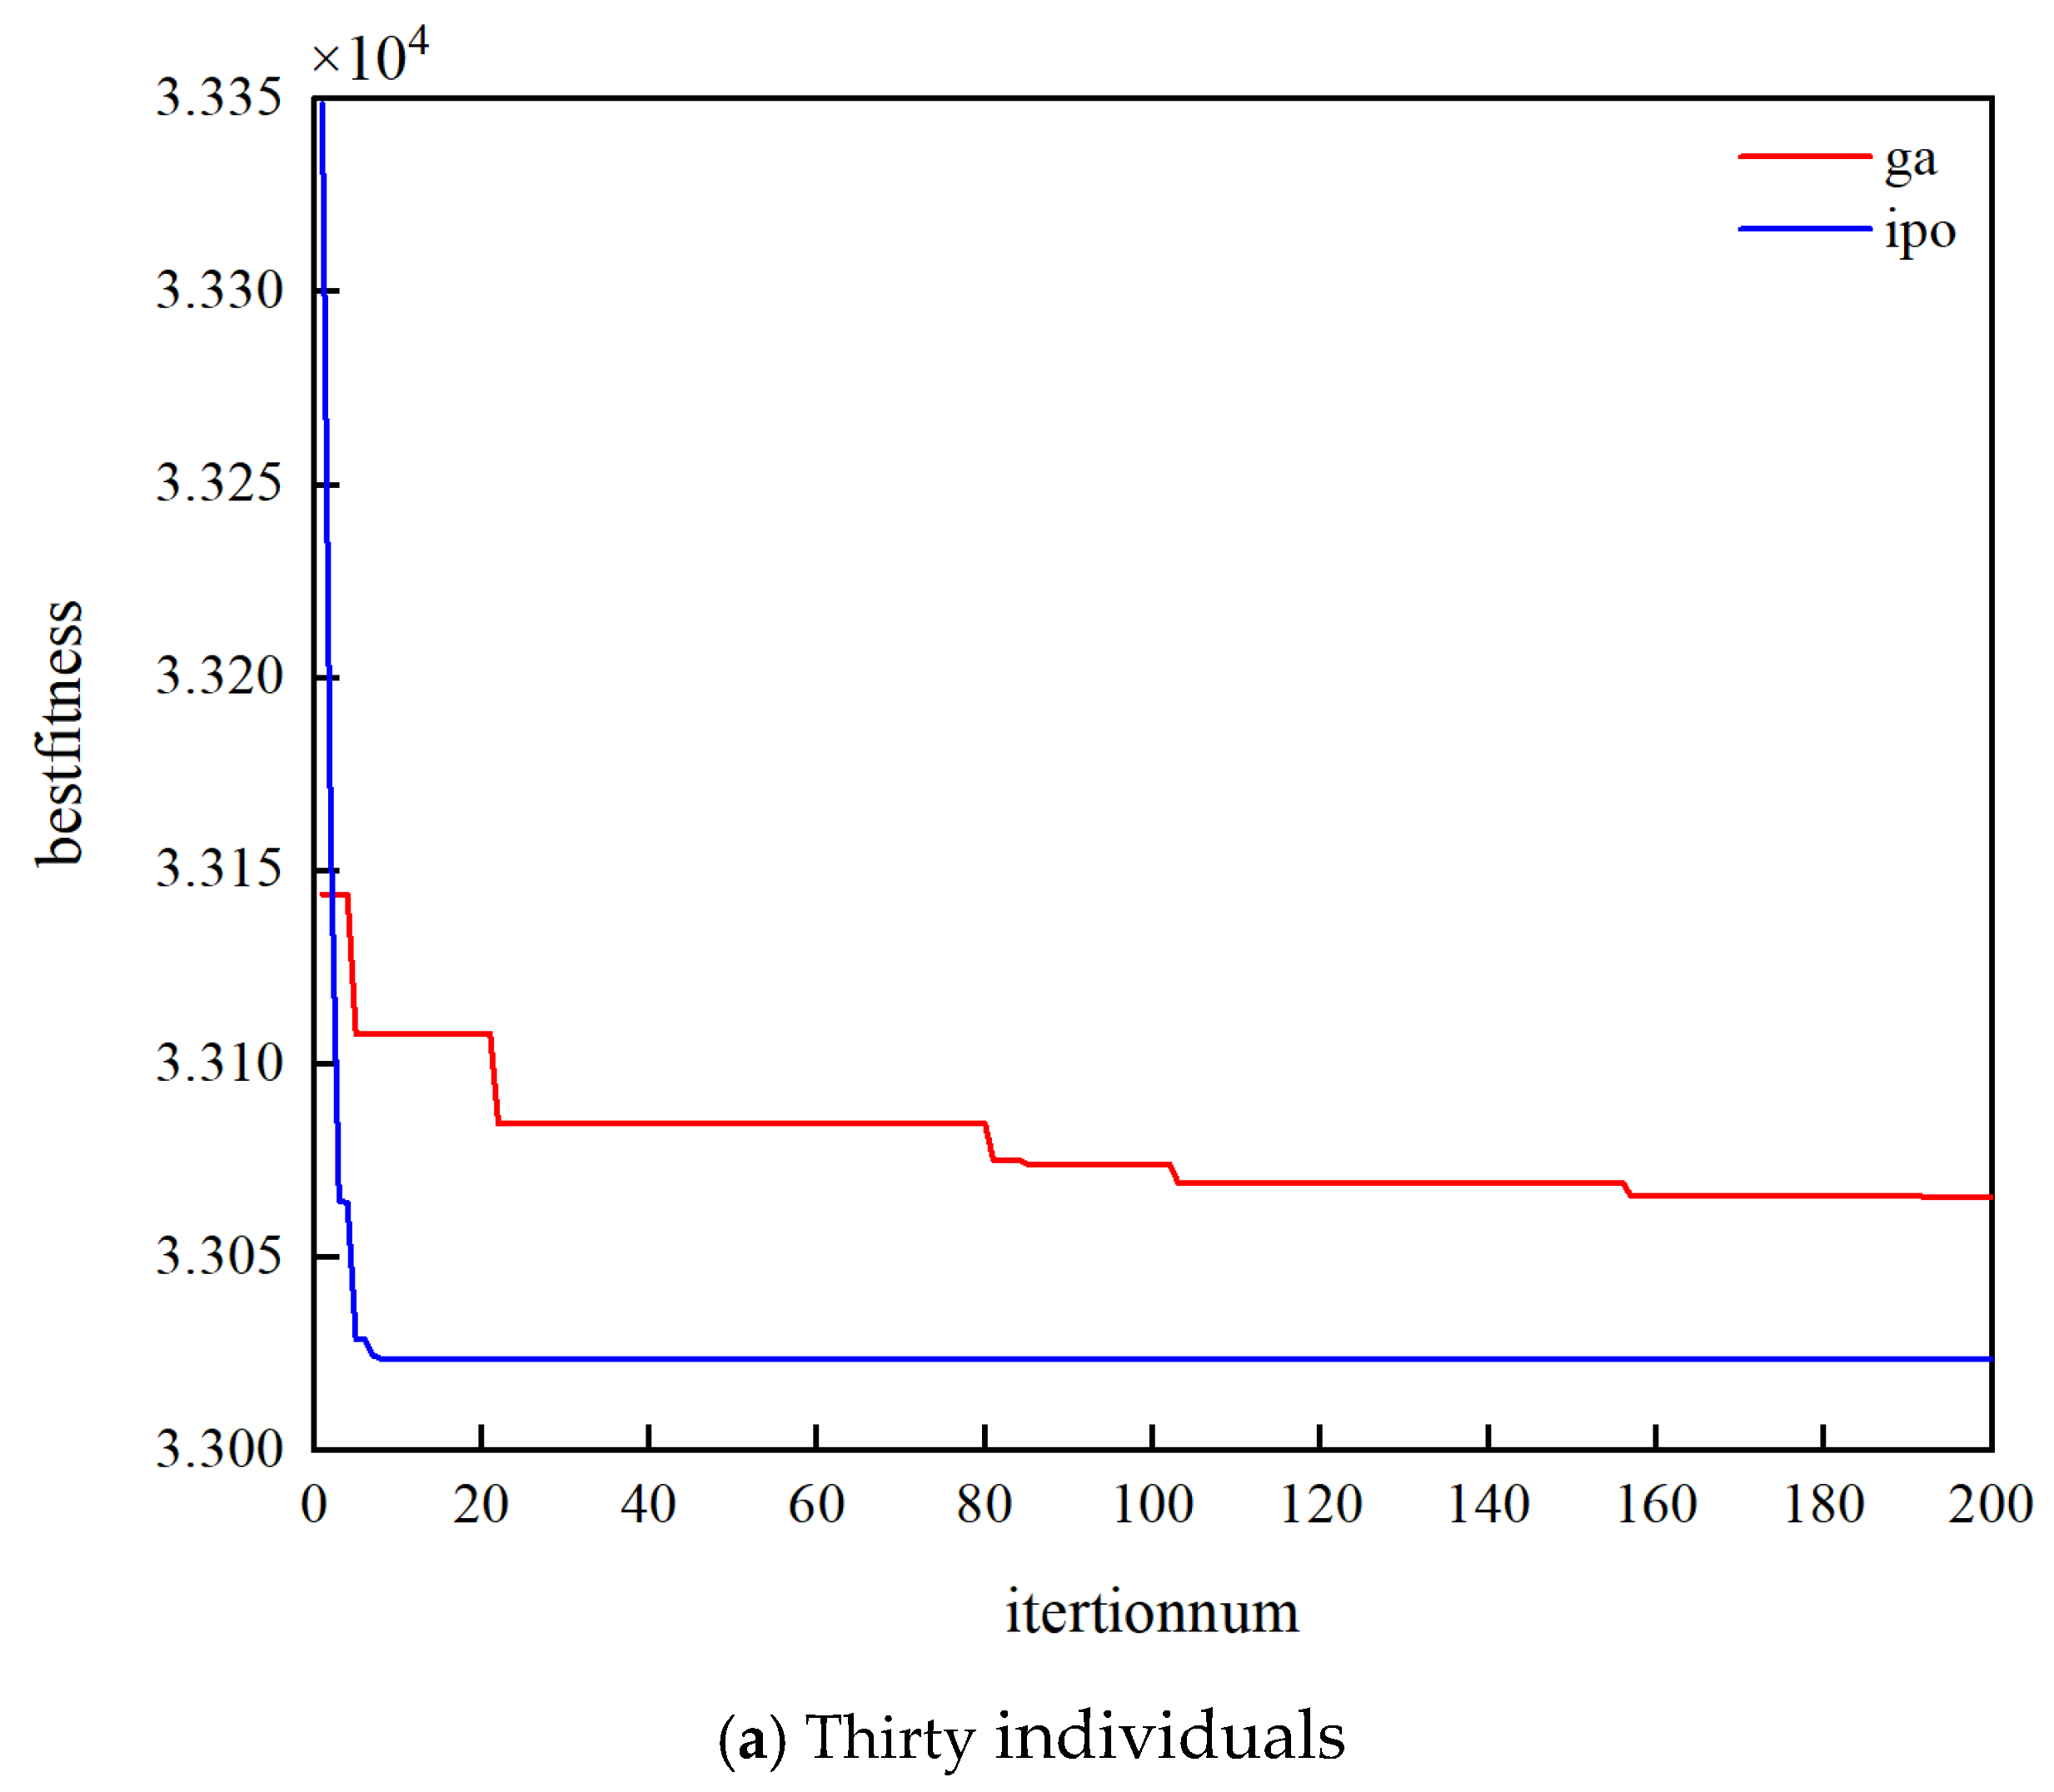
Lastly, the Optimized (F) with Genetic Algorithm (GA) strategy produces results that are close to those of the IPO algorithm, with only minor differences in waiting time, mileage, and load balance index. This confirms the accuracy and robustness of the proposed IPO algorithm, while also showing its advantage in solution quality. In addition to its superior solution accuracy, the IPO algorithm also achieves faster computational speed, making it more practical for real-time or large-scale optimization tasks, shown as
Figure 5:
Figure 5 compares the convergence performance of the IPO algorithm and GA under two different population sizes: 30 individuals in
Figure 5a and 50 individuals in
Figure 5b, both over 200 iterations.
In both scenarios, IPO consistently outperforms the GA in terms of convergence speed and final solution quality. Specifically, the IPO algorithm reaches near-optimal solutions within the first 20–30 iterations, while the GA exhibits a stepwise, slower convergence pattern. This demonstrates the superior efficiency of IPO in exploring the solution space and avoiding premature convergence.
As the population size increases from 30 to 50, both algorithms benefit from slightly smoother convergence curves. However, the final fitness values achieved by IPO remain lower and more stable across both settings, confirming the algorithm’s robustness and scalability. In contrast, the GA’s convergence improves only marginally with a larger population and remains prone to stagnation.
These results validate the effectiveness of IPO not only in achieving high solution accuracy but also in maintaining reliable performance under varying algorithmic parameters.
In addition to the improvements observed in numerical optimization metrics, the proposed model also demonstrates a significant impact on the load factor distribution across the line, as illustrated in
Figure 6. This confirms that the optimization framework contributes not only to global performance but also to the spatial balancing of train capacity utilization.
Figure 6 illustrates the distribution of load factor rates across all sections of the metro line under both optimized and unoptimized dispatching schemes.
Figure 6a presents the results derived from a flexible dispatching strategy that allows non-integer frequency allocations between full-length and short-turn services, while
Figure 6b displays the results under an integer-constrained dispatching strategy, which is more consistent with traditional operational practice.
The vertical axis represents the load factor rate, defined as the ratio of the actual passenger load to the available train capacity in each section. This indicator serves as a key metric to evaluate the efficiency of capacity utilization along the line. The horizontal axis denotes the track section number (from 1 to 31), capturing spatial variations in passenger flow intensity.
Six lines are plotted in each subfigure. The curves labeled “up opt.” and “down opt.” represent the load factor rates in the upward and downward directions, respectively, under the optimized dispatching plan, while “up unopt.” and “down unopt.” indicate the corresponding curves under the baseline (unoptimized) scheme. Additionally, the figure includes two horizontal reference lines, “opt avg.” and “unopt avg.”, denoting the average load factor across all sections in the optimized and unoptimized scenarios, respectively.
As shown in the figure, the optimized dispatching strategy significantly improves the balance of train occupancy across the line. Compared with the baseline scheme, the optimized results demonstrate smoother curves with fewer fluctuations, especially in the core demand segments (sections 10 to 25), where passenger loads are typically highest. The flexible frequency scheme in
Figure 6a further enhances this effect, yielding higher overall load factors and better utilization of train capacity. In contrast, the integer-constrained scheme in
Figure 6b achieves a similar but slightly less uniform performance due to its restricted adjustment flexibility.
Overall, the results confirm that the proposed optimization model effectively aligns service provision with spatially distributed passenger demand, enhancing operational efficiency while avoiding under- or over-utilization in specific segments.
7. Conclusions
This study develops a comprehensive multi-objective optimization framework to effectively address critical operational challenges encountered in urban rail transit (URT) systems, particularly passenger flow imbalance, elevated waiting times, and inefficient capacity allocation. The proposed model simultaneously optimizes short-turn and full-length train operations by targeting three key objectives: minimizing total passenger waiting time, reducing train mileage, and achieving uniform load factors along transit lines. Practical constraints—including dispatch frequency limits, fleet availability, and short-turn operational coverage—are explicitly integrated into the model to ensure practical applicability and feasibility.
To efficiently solve the optimization problem, an Improved Pelican Optimization (IPO) algorithm was developed. The IPO algorithm incorporates advanced techniques such as Tent chaotic mapping to enhance initial population diversity, nonlinear weight tuning to balance convergence dynamics, Cauchy mutation for robust local search capability, and a sparrow-inspired alert mechanism designed to prevent premature convergence. Simulation outcomes indicate that the IPO algorithm significantly outperforms traditional Genetic Algorithms in both convergence speed and quality of obtained solutions.
A detailed case study utilizing data from Nanjing Metro Line 1 validated the practical effectiveness and advantages of the proposed optimization framework. Key findings demonstrate a substantial reduction in total passenger waiting time and operational mileage. Additionally, significant improvements in load factor uniformity along the transit line were observed. Notably, flexible-ratio dispatching strategies, representing theoretically optimal solutions, significantly outperform integer-ratio dispatching schemes that are more reflective of real-world operational constraints. This result underscores the practical potential and value of exploring flexible-ratio scheduling strategies in future operational practice.
However, the frequency-based passenger allocation between short-turn and full-length services employed herein simplifies passenger behavior by assuming that passengers board the first available train. In reality, the passengers’ choices may also depend on perceived crowding, expected waiting times, comfort levels, or access to real-time travel information. These behavioral considerations were not explicitly incorporated into this study but constitute important directions for future research. Employing discrete choice modeling or agent-based simulation methods could provide a more accurate representation of passenger decision-making processes, further enhancing the model’s realism.
Several additional limitations of the current study must be noted. First, the optimization model presented here primarily addresses a single-line context, neglecting potential network-wide interdependency and passenger transfer behaviors. Second, real-time operational disturbances, such as unforeseen delays or demand fluctuations, are not explicitly captured. Third, the model relies on static input data throughout the planning horizon, limiting responsiveness under rapidly evolving conditions.
Future research directions include extending the optimization model to multi-line scenarios and coordinated network-level scheduling. Moreover, integrating real-time passenger demand forecasting to enable dynamic and adaptive scheduling represents another promising avenue. Additionally, incorporating passenger behavioral models to more realistically simulate boarding decisions under variable service conditions could significantly enhance predictive accuracy. Finally, broadening scenario analyses to incorporate peak-demand events such as holidays, special gatherings, or emergencies could further enhance schedule robustness and adaptability.
In summary, the proposed multi-objective optimization model and the advanced IPO algorithm provide a flexible, efficient, and practical tool for optimizing metro scheduling. The framework can assist urban transit agencies in refining service strategies and resource allocation decisions, ultimately contributing to improved passenger experience and enhanced operational sustainability.


