Article

Multi-Objective Optimization and Allocation of Water Resources in Hancheng City Based on NSGA Algorithm and TOPSIS-CCDM Decision-Making Model

1
College of Geology and Environment, Xi’an University of Science and Technology, Xi’an 710054, China
2
Shaanxi Provincial Key Laboratory of Green Coal Development and Geological Guarantee, Xi’an 710054, China
*
Author to whom correspondence should be addressed.
These authors contributed equally to this work.
Sustainability 2025, 17(10), 4616; https://doi.org/10.3390/su17104616
Submission received: 25 February 2025 / Revised: 14 May 2025 / Accepted: 15 May 2025 / Published: 18 May 2025

Abstract

:
Intelligent algorithms and decision models are key tools for improving the efficiency and adaptability of multi-objective optimization and allocation, and for achieving sustainable utilization of water resources. This study takes Hancheng City as a case study to develop a water resource optimization allocation model based on economic, social, and ecological benefits, analyzing and predicting the supply and demand of conventional and unconventional water resources in the study area. The model is solved using the NSGA algorithm, and solutions are screened from the Pareto front using the TOPSIS-CCDM two-level decision model, with the RSR method used for comparative verification. The results show that the schemes II-2022-21 (water shortage of 17,802.35 m3/d, economic benefits of 21,019,556.17 yuan, pollutant emissions of 745.92 tons), II-2027-ACS (shortage of 14,098.76 m3/d, economic benefits of 29,401,252.75 yuan, emissions of 712.07 tons), and II-2032-ACS (shortage of 12,709.33 m3/d, economic benefits of 36,660,367.83 yuan, emissions of 700.96 tons) are in line with the water resource allocation planning for Hancheng City before 2035. These schemes not only meet the regional planning requirements but also maximize economic benefits while minimizing water shortages and pollutant emissions. The study finds that NSGA-II has an advantage in selecting more coordinated schemes, while NSGA-III focuses more on the selectivity of specific targets. Although the TOPSIS-CCDM model performs well in comprehensive evaluation, it also exposes limitations such as sensitivity to data fluctuations and high computational complexity. By developing and applying advanced optimization and decision models, this study provides a scientific water resource allocation scheme for Hancheng City, supporting the sustainable management of regional water resources, and offering a reference for future research in addressing data uncertainties and improving computational efficiency.

Graphical Abstract

1. Introduction

As the global population continues to grow and the economy advances, water scarcity has emerged as one of the most formidable challenges of the 21st century. The United Nations World Water Development Report (2023) indicates that approximately 2 billion people worldwide are facing water scarcity, with the tension between supply and demand most pronounced in arid and semi-arid regions [1]. This issue not only hampers the sustainable development of human society but is also closely linked to economic activities, particularly in resource-driven cities where the conflict between water resources and economic growth is especially evident. Resource-driven cities, such as those in the Appalachian region of the United States (including Kentucky and West Virginia), Saxony in Germany, the Kuzbass area in Russia, and Newcastle in Australia, have seen coal resources play a crucial role in their economic development. However, since these regions are generally not classified as arid or semi-arid, the challenges posed by water pollution in conjunction with the coal chemical economy have been more readily addressed and transformed [2]. In contrast, the northwest region of China, characterized by its geography of being “rich in coal but poor in water”, faces an intensified conflict between urban economic development and environmental sustainability. This region contains 70% of the nation’s coal resources while accounting for only 9.4% of its water resources [3]. Similar geographical resource conflicts are observed globally, such as the impact of land use and water management in the Murray–Darling Basin in Australia [4]. Although coal resources are essential for the economic development of resource-based cities, the environmental challenges they present have significantly hindered the sustainable development prospects of these areas. In this context, unconventional water resources emerge as a vital component, serving as an important complement to conventional water resources in mitigating water scarcity, enhancing the allocation and efficiency of regional water resources, and providing a key solution to these conflicts [5,6].
Mine water serves not only as a byproduct of coal mining but also as a crucial unconventional water resource [7,8]. Research indicates that increasing the reuse rate of mine water, a byproduct of coal mining, by 10% can lead to a 15–27% reduction in freshwater consumption in coal mining regions and a 34% decrease in sewage treatment costs [1,9]. Advances in mine water recycling technology have opened new avenues for resource-based cities. Studies conducted in the Shaanbei Jurassic Coalfield and Henan province demonstrate that implementing a multi-objective optimization model to redistribute regional water resources—predicting mine water inflow, categorizing water quality treatment, and dynamically updating hydrogeological parameters—can increase the reuse rate of mine water from 26% to over 65% and reduce the regional water shortage rate by at least 10% [10,11]. This model employs an enhanced particle swarm algorithm to derive non-inferior solutions, incorporating innovative parameters such as water conservancy.
In resource-based cities, the achievement of sustainable development and ecological protection is contingent upon the optimized allocation of water resources. To effectively design such allocation strategies, a comprehensive assessment of the region’s water resource potential is essential, accompanied by the establishment of a holistic computational framework [12]. Within this framework, appropriate algorithms or analytical techniques must be selected to meet the established objectives.
Research indicates that when confronted with the complexities of multi-objective water resource optimization and allocation, a single mathematical model often proves inadequate [13]. As a result, novel intelligent algorithms have been increasingly utilized for the optimization and allocation of multi-objective water resources, owing to their efficiency in calculating and screening solutions. Genetic Algorithms (GA), an advanced approach derived from traditional genetic algorithms, effectively address the limitations of conventional methods in tackling intricate water resource optimization challenges [14]. The Non-Dominated Sorting Genetic Algorithm (NSGA) has emerged as a prominent technique in the field of resource management, specifically for resolving complex optimization issues.
In 2002, the NSGA-II algorithm gained widespread adoption due to its effectiveness in balancing solution trade-offs [15]. This is exemplified by the Hanjiang River Basin water–energy–food nexus model developed by Deng et al. [16], which achieved Pareto optimality in terms of economic benefits and equity through the use of NSGA-II. By 2014, NSGA-III was developed as an enhancement of NSGA-II, specifically designed to manage computations involving three or more objectives [17,18]. Shortly after its introduction, the improved NSGA-III algorithm was applied to reservoir flood management, demonstrating exceptional performance in maintaining system diversity and optimal adaptability. In the realm of multi-objective water resource allocation, the NSGA series of algorithms has consistently driven paradigm shifts in water resource management [19,20]. However, the convergence challenges faced by NSGA-III in high-dimensional objective spaces remain unresolved, as it struggles to converge in such contexts, thereby limiting its application in complex water resource allocation problems [21].
The introduction of decision models based on preference ranking techniques, such as the Technique for Order of Preference by Similarity to Ideal Solution (TOPSIS), is crucial for enhancing the applicability and decision-making quality of algorithms. An improved TOPSIS model, combined with grey relational analysis, has been utilized to assess the water-carrying capacity of Gansu Province, thereby laying a foundation for its practical application [22]. Furthermore, the integration of the NSGA-III algorithm with TOPSIS has proven effective in exploring solutions that meet estuarine irrigation demands [23]. Over time, certain limitations of TOPSIS have become evident with continuous use, underscoring the necessity to enhance and expand TOPSIS in multi-criteria decision analysis [24]. The TOPSIS model does not fully account for the correlation between indicators and exhibits poor adaptability to dynamically changing data; thus, incorporating a coordination coupling degree model is essential to address the deficiencies of TOPSIS in system coordination analysis [25,26,27]. The Coupling Coordination Degree Measurement (CCDM) model can evaluate the effectiveness of various system coordinations by measuring the interactions and influences among different systems [28]. In research examining the driving mechanisms of water-carrying capacity in the eastern and western regions of China, the coupling coordination model successfully assessed the overall status of water-carrying capacity, demonstrating its practicality [29].
Although NSGA algorithms exhibit significant potential for water resource allocation, they encounter challenges in maintaining the diversity of solution sets in high-dimensional optimization and ensuring applicability in real-world scenarios. To address these issues, this study constructs a hybrid framework of NSGA-II/III-TOPSIS-CCDM, exploring theoretical innovations through a dual-layer optimization–comparison–decision mechanism. The specific contributions of this study include: ① the development of a multi-objective optimization allocation model for water resources between coal mining and urban water use in semi-arid regions; ② the proposal of a practical and effective evaluation system for NSGA multi-algorithm solution sets; and ③ the provision of recommendations for the practical application of NSGA-based multi-objective optimization solutions in water resource management.
Hancheng City, a typical coal resource-based city in the Yellow River Basin of China, exemplifies the common characteristics of global resource-based cities through its “high water consumption–strong industry” development model. Data from 2022 indicate that the city’s coal-related industrial output reached 28.61 billion yuan, accounting for 71% of the industrial value-added [30]. This figure aligns closely with international coal economic zones such as Hunter Valley in Australia, where the coal economy accounts for 68%, and Jharkhand state in India, where it constitutes 64% [31]. Notably, the city’s industrial water use intensity is 40.2 m3 per ten thousand yuan of output value, significantly exceeding the global average for resource-based cities, which is 28.5 m3 per ten thousand yuan [32]. Furthermore, the per capita available water volume in Hancheng (323 m3) is only 76% of that found in the oil- and gas-producing areas of Saudi Arabia [33]. A particularly striking contrast is observed between its mine water production (80 million m3) and utilization rate (35%), which precisely illustrates the “resource curse” dilemma faced by global coal cities. For instance, mine water utilization rates in the Appalachian region of the United States have long remained between 30–40% [34], while in the Mpumalanga province of South Africa, it is even lower than 28% [35]. This tripartite contradiction among ecology, economy, and resources, formed along the crucial water system of the Yellow River, provides an excellent micro-laboratory for studying the sustainable development of global resource-based cities.

2. Data and Methods

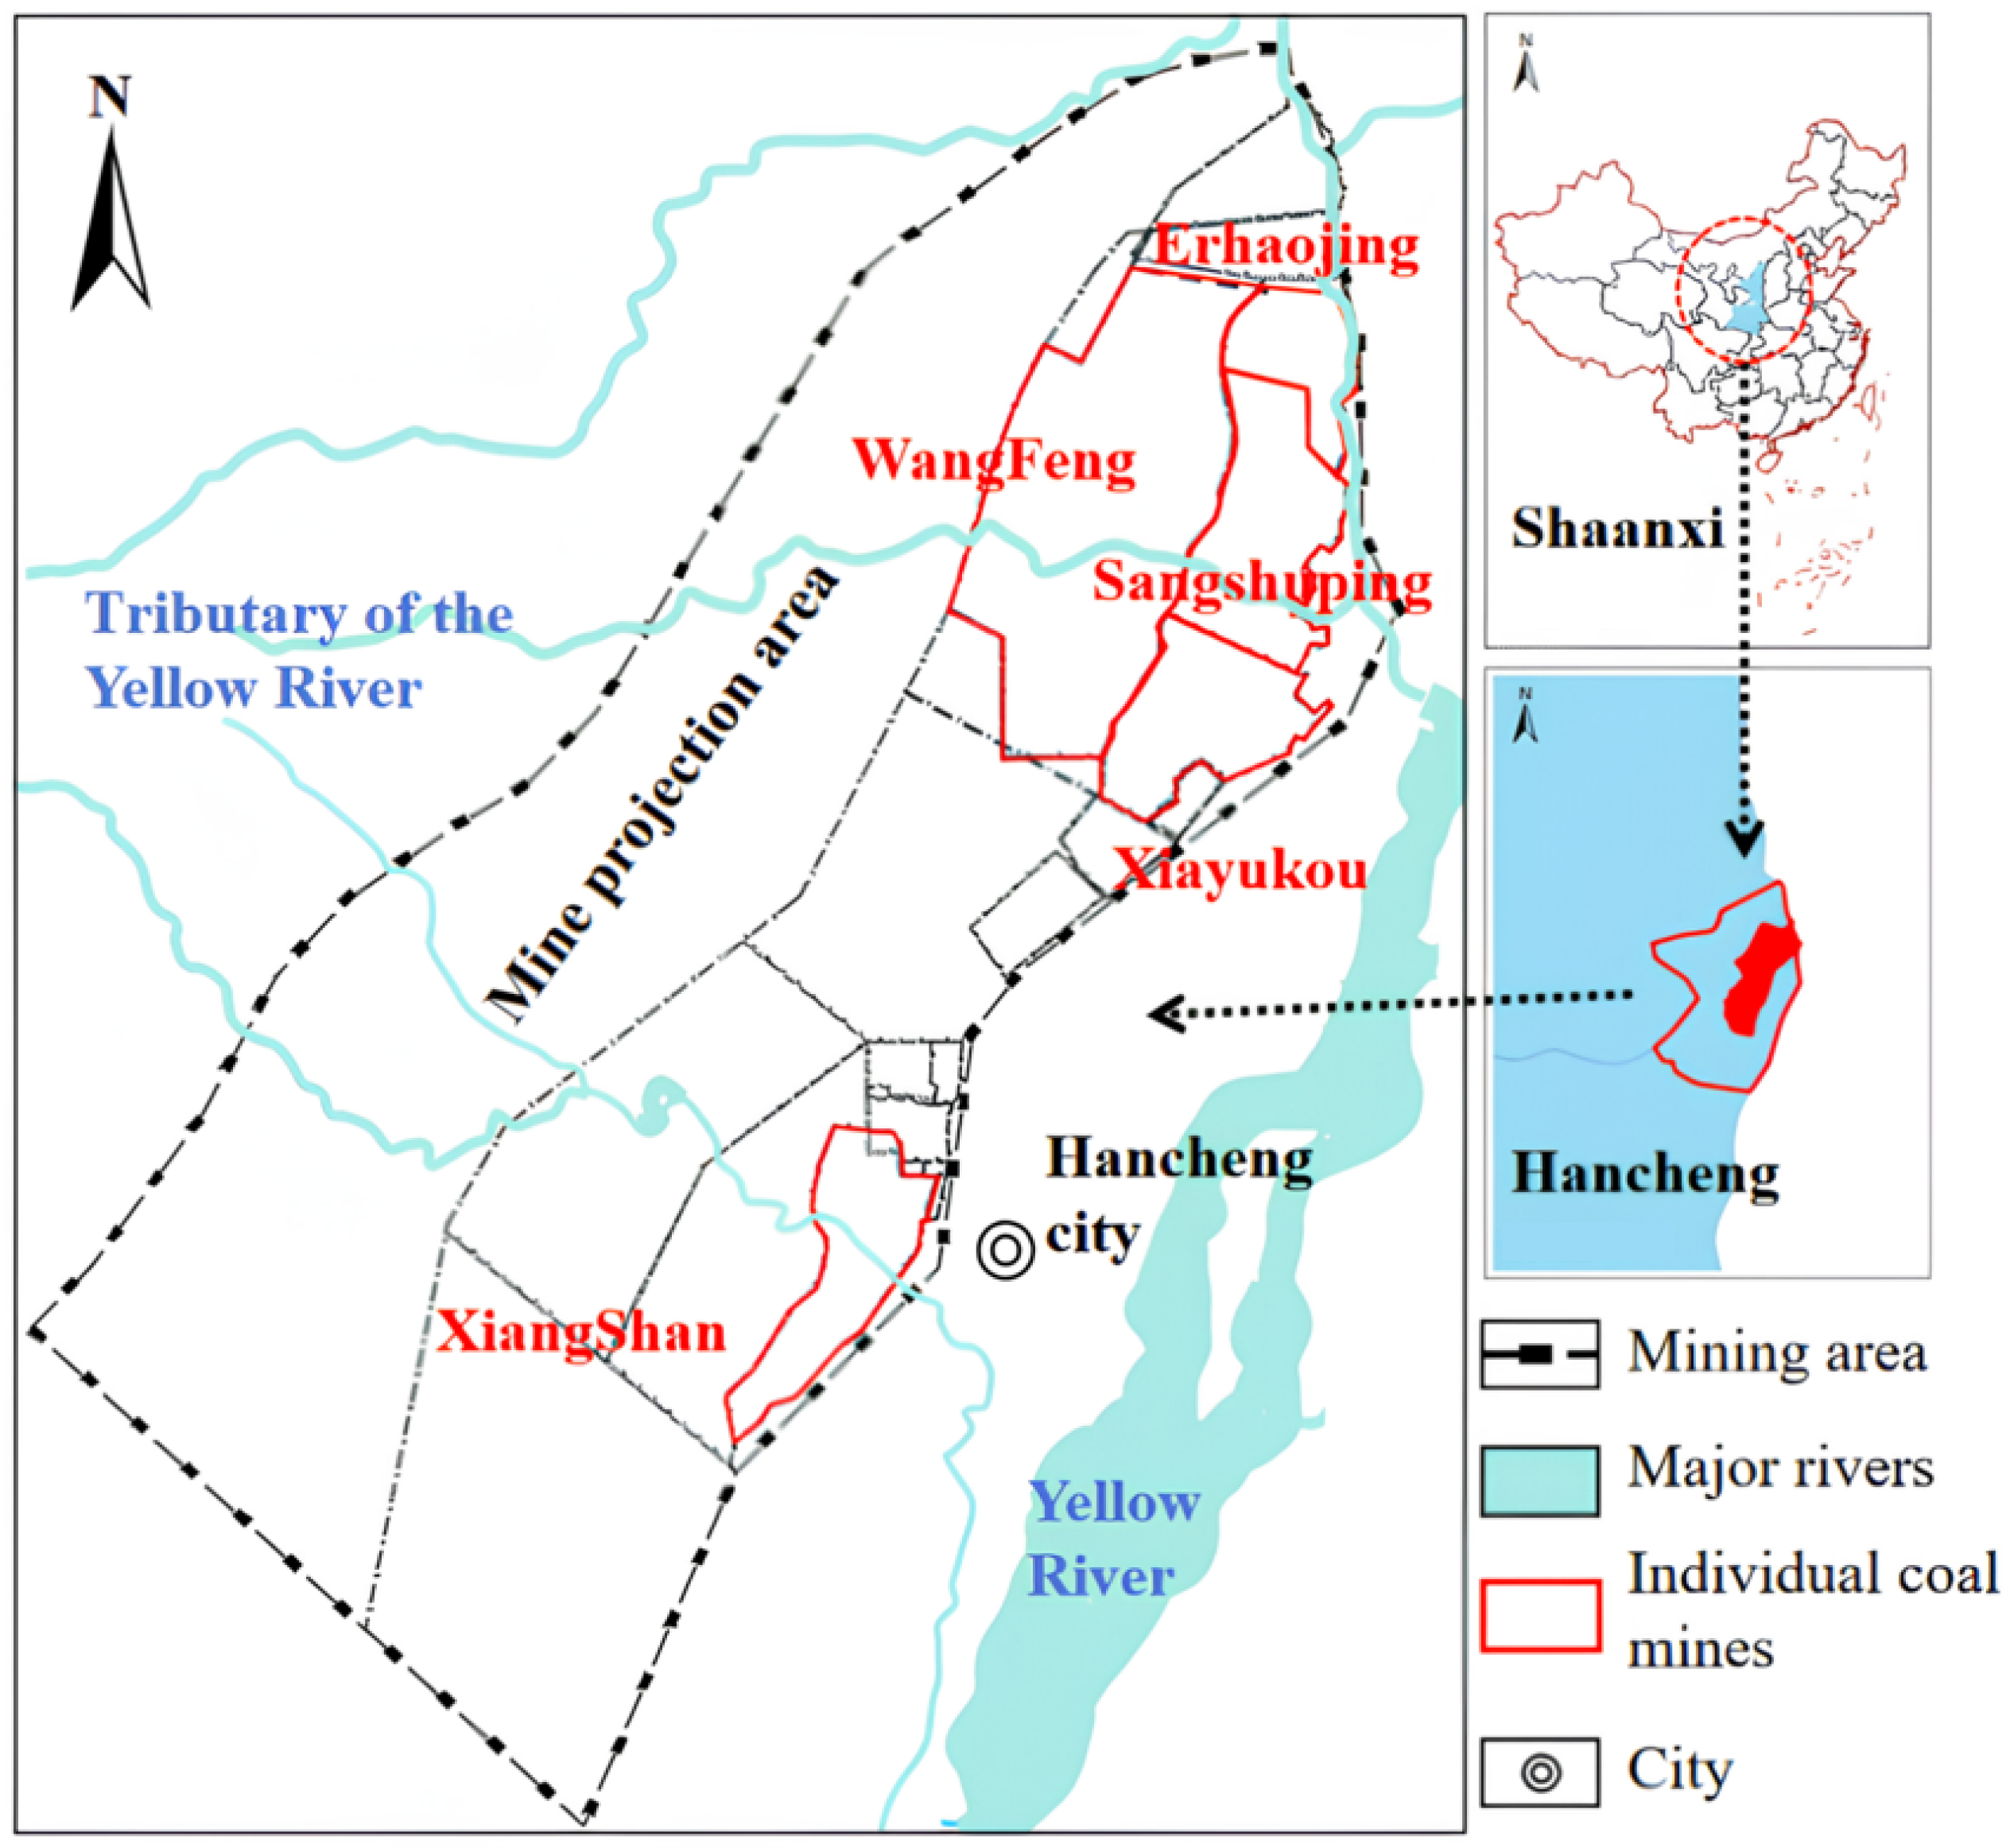
2.1. Overview of the Study Area

Hancheng City, located in the Weinan area of Shaanxi Province in China, is one of the key coal mining bases in the northwest of the country. Within its borders lies the Hancheng mining area, which includes several major coal mines such as Xiangshan, Xiayu Kou, Sangshuping, Erhaojing, and Wangfeng mines (Figure 1).
In the study area, water resources are categorized into two main types: conventional and non-conventional. Conventional water resources primarily consist of surface water, whereas unconventional water resources encompass mine water and domestic wastewater discharged from the major coal mines in the region. The primary sectors demanding water in the city include agriculture and irrigation, forestry, ecology, industry, and domestic use [36]. The structure of the water supply system is illustrated in Figure 2.
In this paper, 2022 serves as the baseline year, while 2027 and 2032 are designated as the short-term and long-term planning years for water resource optimization, respectively. This study utilizes data from the “Shaanxi Province Water Resources Bulletin (2012–2022)”, “Assessment and Analysis of Water Resources and Their Exploitation in Hancheng City”, and “Analysis of Water Resources Supply and Demand Trends in Hancheng City”, alongside planning data pertinent to the development of the mining area. We have employed a variety of methods, including hydrogeological comparison, analytical approaches, and the GM (1, 1) grey prediction model, to forecast and analyze the water supply and demand balance from the present year through the planned future years. The results of this analysis are illustrated in Figure 3. Moreover, the region experiences a water shortage that constitutes approximately 10% to 15% of the total water supply. It is generally recommended that the usage of surface water should not exceed 50% of the overall water demand.
As illustrated in Figure 3, the water supply and demand system between the mining area and the city is divided into two primary components. Initially, in the mining area, water wells and mine water serve as the principal sources for the various coal mines. Following the fulfillment of each coal mine’s requirements, the surplus water is designated as the available water for the current planning phase. Subsequently, the city’s water demand system, as previously analyzed, is categorized into five user groups: agriculture, forestry, pasture, ecology, industries, and domestic water. The water deficit experienced by these user groups constitutes the water shortage for the planning process. Lastly, groundwater is utilized as an additional potential source for supplementation.
Figure 3a illustrates the significant disparity between water supply and demand in both urban and mining areas. In 2022, the water deficit in the mining–urban region was 33,424.65 m3/d. However, the mining area provided 19,458.1 m3/d of unconventional water sources, while traditional water sources contributed 8219 m3/d, collectively addressing 83% of the urban water shortage. Given the continuous growth of the coal industry in recent years and the city’s significant regional importance, it is prudent to establish a reasonable upper limit for water scarcity at 20%.
Furthermore, Figure 3b indicates that by 2027, the anticipated industrial development plans are expected to result in coal mining generating an additional water supply of approximately 13,767.12 m3/d. Correspondingly, the city’s water demand is projected to rise to 55,068.49 m3/d. In light of this, it is imperative that the traditional water supply be appropriately increased by 13,767.12 m3/d. Consequently, by 2027, both unconventional and conventional water sources are expected to collectively address 74% of the region’s water shortage.
Figure 3c illustrates that by 2032, due to the region’s development plans, the water demand of certain urban clients is anticipated to change, with an increase in forestry water use and a decrease in industrial water use. As a result, the projected water deficit in the urban area is estimated to be 55,074.49 m3/d. Traditional water sources are expected to supply 13,768.62 m3/d, while unconventional water sources from the mining area are projected to contribute 28,596.54 m3/d, collectively addressing 77% of the region’s water shortage.

2.2. Water Resources Optimal Allocation Model

Through data modeling, it has been observed that the multi-objective optimization of water resource allocation within mining areas consistently results in local optima. An examination of the effects of iteration count and population diversity reveals that the significant redundancy of water resources in these areas leads to rapid convergence of the solution. To address this issue, it is advisable to first identify the unconventional water resources that each sub-area can generate. This approach will streamline the model’s hierarchy and enhance the computational efficiency of the allocation process.
Figure 4 illustrates the model approach and the corresponding improvement measures. In the operational mechanism of the multi-objective optimization model, the model iteratively converges towards the optimal solution. During each iteration, the model evaluates the objective function values based on the current water resource allocation plan, which includes factors such as water scarcity, economic benefits, and pollutant emissions. Subsequently, it generates new populations and introduces diversity by adjusting parameters within the allocation plan to mitigate the risk of being trapped in local optima. However, the redundancy of water resources within the mining area may contribute to a rapid convergence to local optima during the initial iterations. To address this issue, preprocessing steps are implemented to optimize the model’s initial input conditions, such as determining the unconventional water resources that each sub-region can generate. This approach simplifies the model’s hierarchical structure and enhances its global search capability.
The streamlined model utilizes the surplus unconventional water resources available within the mining area, along with the conventional water resources accessible in the city’s vicinity, as its foundational water supply. Its primary objective is to optimize the allocation of water resources to alleviate the water shortages experienced in various urban sectors. The regional water resource multi-objective optimization aims to minimize water shortages, maximize the economic benefits derived from water usage, and reduce pollutant discharge. Consequently, the model is characterized by three objective functions [18,36].
1.
The social benefit objective primarily aims to minimize water resource shortages for each customer.
m i n f 1 ( x ) = j = 1 j D j i = 1 i j = 1 j x i j R i j
where i is water source, i = 1, 2, j is water user department, j = 1, 2, 3, 4, 5, xij is the water supply from the i-th water source to the j-th user, Dj is the amount of water required by each department, Rij is the water demand of the i-th sub-area j-th water user, f1(x) is total water supply of the region.
2.
The economic benefit objective is mainly to maximize the economic efficiency of water use.
m a x f 2 ( x ) = i = 1 i j = 1 j x i j c j R i j
where cj is the net benefit coefficient of water use for department j (yuan/m3), f2(x) is total water supply cost of the region.
3.
The ecological benefit objective is primarily to minimize pollutant emissions.
m i n f 3 ( x ) = i = 1 i j = 1 j 0.01 x i j b j e j R i j
where bj is the content of key pollutants in the waste water of department j per unit (mg/L), ej is the sewage discharge coefficient of department j (%), f3(x) is total pollutant emissions of the region.
In multi-objective optimization problems, balancing the three optimization goals—social benefits, economic benefits, and ecological benefits—is crucial for achieving sustainable water resource management. In this model, Goal 1, which aims to minimize the water shortage for each user, may initially appear as a fixed value. This perception arises because the available water supply is insufficient to meet the demand, resulting in the total available water supply being fully utilized to address the deficit. In multi-objective optimization models, weight coefficients play a significant role in determining the relative importance of various goals. In this model, the sewage discharge coefficient and the net benefit coefficient of water use collectively influence the trade-off between pollution discharge targets and economic objectives, necessitating an analysis of real-world scenarios to inform decision-making.

2.3. Constraints

Incorporating the requirements of water resource management, the constraints of this model are as follows:
{ i = 1 i j = 1 j x i j R i j S i (4) i = 1 i j = 1 j x i j R i j ( C j   m i n , C j   m a x ) (5) i = 1 i j = 1 j 0.01 x i j b j e j R i j D j ( r u l e ) (6)
x i j 0 ,   i j
where Si is the available water supply of the i-th water source, Cj min–max is the minimum (min)–maximum (max) water demand of the j-th user, Dj(rule) is the stipulated emission volume or limit for the j-th user, i j indicates that this constraint applies to all water sources and users.
Equation (4) delineates the water supply constraint, ensuring that the total water supply does not exceed the available quantity. This guarantees the optimal utilization of all unconventional water resources within the mining area. Equation (5) outlines the water consumption constraint, which ensures that the water demand of each sector is satisfied without surpassing the required amounts, based on the overall water demand of all user sectors. Equation (6) incorporates the pollutant discharge from all user sectors, ensuring that the total discharge adheres to environmental protection standards, thus guaranteeing that the regional pollutant discharge indicators remain within the prescribed emission limits. Finally, Equation (7) establishes the non-negativity constraint, ensuring that the decision variables (i.e., the water supply for various regions and users) are non-negative values. This constraint is fundamental to optimization problems, as a negative water supply would render the model’s calculations meaningless.

2.4. NSGA (II/III) Algorithm and TOPSIS-CCDM Two-Layer Decision Model

2.4.1. NSGA (II/III) Algorithm

In contrast to single-objective optimization, multi-objective scenarios introduce three key complexities related to multiple objectives, constraints, and solution criteria [37,38]. Firstly, the metrics used to evaluate the different objectives are not directly comparable. Secondly, trade-offs or conflicts frequently arise between the objectives. Furthermore, there is typically no single optimal solution; rather, a range of admissible solutions exists, known as the Pareto non-dominated set of solutions. A comparison of the fundamental principles of NSGA-III and NSGA-II, in terms of their mechanisms of action, is illustrated in Figure 5.
As can be seen from the figure, the main steps of the NSGA algorithm consist of four steps.
Step 1, for the population Pt of generation t, whose size is N, firstly, selection, crossover, and mutation operations are performed in order to produce the offspring population Qt.
Step 2, combine the parent population Pt and the offspring population Qt to form a temporary population Rt, which contains 2N individuals.
Step 3, select and eliminate the N optimal individuals in Rt through the distance congestion reference mechanism of NSGA-II or according to the reference point mechanism of NSGA-III, and select the N optimal individuals to form the population Pt+1 of the t + 1 th generation. NSGA-II evaluates the distribution density of individuals in the objective space by calculating the crowding distance among them, prioritizing the retention of individuals with sparse distributions to maintain population diversity. This method is effective for two to three objectives; however, its performance may be limited when addressing high-dimensional objective optimization problems [39]. Conversely, NSGA-III employs a reference point mechanism to establish a series of reference directions in the objective space, guiding the population to evolve along these directions and thus achieving a more uniform distribution of solution sets. This method is particularly well-suited for balancing multiple objectives and can efficiently generate a uniformly distributed Pareto front solution set. Its advantages become increasingly prominent as the number of objectives increases. With the reference point mechanism, NSGA-III can more accurately reflect the relative importance of different objectives, providing decision-makers with more representative decision support [40].
Step 4, observe whether the population satisfies the convergence objective; if not, repeat the above steps in a loop, and if it does, generate the Pareto non-dominated solution set. In multi-objective optimization algorithms, loop conditions, and termination criteria are critical for ensuring both efficient operation and accurate convergence of the algorithm. Loop conditions typically consider whether the preset maximum number of iterations has been reached, whether the population diversity is maintained at an acceptable level, and whether the objective function values continue to exhibit significant changes. These conditions govern the continuation of the iterative optimization process. Conversely, termination criteria are used to determine when the algorithm should cease operation; common scenarios include reaching the maximum number of iterations, achieving stability in the objective function values, and experiencing excessively low population diversity. By scientifically establishing these conditions, the algorithm can generate a high-quality Pareto non-dominated solution set within a limited timeframe, while avoiding entrapment in local optima or engaging in unnecessary computations.

2.4.2. TOPSIS-CCDM Two-Layer Decision Model and RSR Method

In this study, the TOPSIS-CCDM model was selected for its effective management of multi-objective optimization problems. This model integrates the fundamental principles of the TOPSIS method with an enhanced coordination decision-making mechanism, thereby addressing complex decision-making scenarios with greater efficacy. The rationale for this selection is outlined as follows:
  • Comprehensiveness and Adaptability: The TOPSIS method is capable of simultaneously handling multiple evaluation criteria with minimal requirements regarding data distribution, sample size, and the number of criteria. This makes it suitable for both large and small samples. In the context of coal mine water resource research, where complex and outdated data may pose challenges, this method calculates the distances between alternative schemes and the ideal and negative-ideal solutions. By fully utilizing the original data, it minimizes information loss and ensures reliable and accurate evaluation results.
  • Efficient Computation and Intuitive Results: The TOPSIS method features a straightforward calculation process and presents results in an intuitive manner, facilitating understanding and adoption by decision-makers. It does not necessitate complex mathematical models or extensive computational resources, thereby offering valuable reference information promptly.
  • Comparative Advantage in Multi-Criteria Decision-Making: While other multi-criteria decision-making methods such as SPOTIS, COMET, and SIMUS have their respective strengths in addressing complex data, the TOPSIS-CCDM (TOPSIS method combined with the Coupling Coordination Degree Model) exhibits distinct advantages.
A summary of their advantages and disadvantages in the context of this paper’s application is presented in Table 1:
In multi-criteria decision-making, while SPOTIS, COMET, and SIMUS offer advantages in handling complex data, TOPSIS-CCDM distinguishes itself as a superior approach. SPOTIS exhibits sensitivity to data preprocessing and outliers, alongside the necessity for explicit evaluation bounds, which complicates the preprocessing phase and may compromise the reliability of the results [41]. COMET’s dependence on expert scoring introduces subjectivity and computational complexity, with the reliability of outcomes being contingent upon the opinions of the experts involved [42]. SIMUS requires multiple iterations and substantial decision-maker experience, resulting in complex computations and diminished reliability of results [40]. In contrast, TOPSIS-CCDM adeptly manages multiple criteria by integrating subsystem development through the CCDM framework. Its inherent simplicity, intuitive results, and reduced subjectivity significantly enhance reliability, rendering it particularly suitable for complex scenarios that demand rapid decision-making [43].
To validate the rigor of the method, this paper employs the Rank Sum Ratio (RSR) comprehensive evaluation method to screen the data and compares the results with those obtained from the TOPSIS-CCDM model, thereby supporting the conclusions. The RSR method is a multi-criteria decision analysis (MCDA) technique based on rank transformation, which converts multi-indicator values into dimensionless statistical quantities (RSR values) for the purposes of ranking or classification. This method offers several advantages, including simplicity in calculation, wide applicability, comprehensiveness, the ability to mitigate the influence of extreme values, and ease of indicator comparison [44].
The TOPSIS is extensively employed in multi-criteria decision-making analysis. The core concept of TOPSIS lies in evaluating the proximity of each alternative to the ideal solution, thereby identifying the alternative that is closest to the ideal state. The calculation of TOPSIS should encompass three fundamental steps [45].
Step 1, data standardization: the entropy weighting method is used to standardize the original data and calculate the overall score, where in this paper i represents the program number, j represents the objective function, and ij represents the original matrix.
Step 2, calculate the weighted specification matrix: calculate the weights according to the entropy weighting method, and weight the standardized decision matrix to reduce the influence of subjective factors, using the weights of the objective function obtained in the first step of the calculation (wj), and the standardized data (yij) are multiplied by the calculation formula as follows:
Z i j = y i j × w j
Step 3, determine the positive and negative ideal solutions and the Euclidean distance: the purpose of this step is to define the different indicators, the closer the distance of the indicator vector value to the positive ideal solution, the better the performance, and vice versa. The calculation formula is as follows:
Positive   Ideal   Solution :   Z j + = max ( Z 1 j , Z 2 j , , Z n j , )  
Negative   Ideal   Solution :   Z j = min ( Z 1 j , Z 2 j , , Z n j , )
The Euclidean distance formula is derived from the resulting positive and negative ideal solutions as
d i + = j = 1 n ( z i j z j + ) 2   d i = j = 1 n ( z i j z j ) 2  
The formula for the degree of ideal closeness is
C i = d i d i +   d i +
The Coupling Coordination Degree Model (CCDM) serves as a mathematical tool for assessing the interplay and synergy between multiple systems. It excels in quantifying the level of coupling and the harmony of operations among systems, making it particularly adept for evaluating solutions in practical contexts.
The model is defined by equations for the coupling degree (C), the coordination degree (T), and the composite coupling coordination degree (D), which are presented below [46,47]:
C = 3 × U 1 × U 2 × U 3 U 1 + U 2 + U 3 T = a × U 1 + b × U 2 + c × U 3 D = C × T
where, U1, U2, and U3 represent the normalized values of the three objective functions in this paper; a, b and c represent the weights of the three objective functions, respectively. The normalized values convert the original data of different indicators or objective functions in the model into unified dimensionless values. This process eliminates discrepancies in dimensions and numerical ranges, allowing for a comprehensive analysis of each indicator within the same framework. Consequently, it enables a more accurate assessment of the degree of coupling and coordination between subsystems. The function weight refers to the relative importance coefficient assigned to each subsystem or objective function. Objective weighting is a common method for determining these weights, and the Analytic Hierarchy Process (AHP) can be employed to ascertain the weight indicators of the model.
The TOPSIS-CCDM two-layer decision-making model integrates the strengths of the multi-attribute decision-making approach of TOPSIS with the collaborative decision-making features of CCDM. However, it still encounters several challenges in practical applications.
Firstly, the TOPSIS method is sensitive to data normalization, and different normalization techniques can significantly influence the final results. Furthermore, the collaborative decision-making mechanism of CCDM may exacerbate this instability.
Secondly, the model typically assumes equal weights for all indicators, which neglects the interrelations and varying importance of these indicators, potentially leading to deviations in decision-making outcomes.
Additionally, when addressing dynamic data, the TOPSIS-CCDM model is susceptible to inversion issues, where minor data changes can result in unreasonable fluctuations in decision-making results.

2.5. Implementation of NSGA Algorithm and Its Interaction with Decision-Making Model and Parameter Data

The collaboration between the NSGA algorithm and the TOPSIS-CCDM model is evident in two key aspects. Firstly, the NSGA algorithm generates a Pareto optimal solution set that encompasses trade-offs between various objectives, thereby providing a diverse array of alternative schemes for the TOPSIS-CCDM model. Secondly, the TOPSIS-CCDM model conducts a comprehensive evaluation and ranking of the solution set through distance calculation methods, effectively identifying the optimal scheme. This integration fully exploits the optimization advantages of the NSGA algorithm along with the coordination capabilities of the TOPSIS-CCDM model, thereby ensuring scientifically sound and reasonable decision-making results.
The study area is an industrial region primarily characterized by coal mining, where the main sources of pollution stem from the discharge of industrial and domestic wastewater. Consequently, the coefficients and concentrations of pollutants are derived from statistics provided by the local environmental protection department. The water efficiency coefficients for various users are referenced from data pertaining to coal resource-based cities of similar scales located in arid or semi-arid regions. Additionally, according to the “Comprehensive Wastewater Discharge Standard (PRC)” (GB 8978-1996 [48]), the limit for Chemical Oxygen Demand (COD) in industrial wastewater is set at 50 mg/L, while for domestic wastewater, it is 30 mg/L. The specific parameters of the calculation model are detailed in Table 2.

3. Result

3.1. Calculations Analysis

In the preprocessing step, after conducting a comprehensive analysis of all water sources within the mining area and subtracting the water usage of each coal mine, the statistics for remaining unconventional water are utilized as the available water supply. This process simplifies the data structure hierarchy from three layers to two layers, specifically delineating the mining area (as the available water source) and the city (as the water demand). Subsequently, the population size (N) of the NSGA algorithm is established at 100, with the maximum iteration threshold (MaxIT) also set to 100, utilizing the available water demand as the planning boundary. This choice of parameters ensures sufficient diversity for exploring the solution space while avoiding excessive computational costs associated with larger scales. Furthermore, it facilitates the completion of the optimization process within a constrained timeframe, thus preventing infinite loops and allowing the algorithm adequate time to converge. The calculation results are depicted in Figure 6.
Figure 6 illustrates that the study generated a total of 432 potential solutions, comprising 158 for 2022, 139 for 2027, and 135 for 2032. To achieve a balanced compromise among the various algorithms, one solution from each algorithm for each year was selected to form the Algorithmic Compromise Set (ACS), as summarized in Table 3.
Table 3 demonstrates that the proposed solutions consistently maintain minimal water shortages over the three-year period. This consistency arises from the unchanging relationship between the planned water shortage and the available water for planning, which is preserved under the condition of minimizing shortages, thereby ensuring full utilization of all available water resources. The primary indicators for comparison are economic benefits and pollutant discharge functions.

3.2. The Final Solution Selection

To select the most desirable solution from the 6 sets of Alternative Control Strategies (ACS), the Technique for Order Preference by Similarity to Ideal Solution (TOPSIS) method was employed. The solution exhibiting the highest relative closeness index (Ci value) was identified as the optimal option. Table 4 presents the Ci values for the Pareto non-dominated solutions across various planning years, with values approaching 1 signifying more favorable solutions.
Table 4 indicates that the three schemes with Ci values closest to 1 are II-2022-ACS, III-2027-ACS, and III-2032-ACS. A comparison of these three schemes’ Ci values is conducted against all the schemes in the Pareto solution set, as illustrated in Figure 7.
Figure 7 presents a comparison of annual ACS solutions with the Pareto solution sets. In Figure 7a,b, it is evident that the NSGA-II and NSGA-III algorithms produced 5 and 1 sets of solutions, respectively, in 2022. Figure 7c,d indicate that 3 and 14 sets of solutions were generated in 2027, respectively. Furthermore, Figure 7d,f show that 1 and 42 sets of solutions were generated in 2032, respectively. The Ci values of these solutions are greater than or equal to those of the ACS solutions, suggesting a superior balance among the three objective functions and a closer proximity to the ideal solution. Consequently, these solutions should be prioritized in the decision-making process.
As the number of schemes generated by the TOPSIS method increases, it becomes essential to evaluate the coupling coordination of these schemes following the application of the CCDM model, in order to identify the more superior options for further comparison. For instance, schemes III-2022-40 and II-2032-11 each yield a single set of solutions, thereby eliminating the need for screening through the CCDM model. In contrast, NSGA-II generates five sets of schemes in 2022, while NSGA-II/III produces three and fourteen sets in 2027, and NSGA-III generates forty-two sets in 2032. All of these require two rounds of screening through the model. The results of this screening process are presented in Table 5.
As demonstrated in the table, the four schemes exhibiting the highest levels of coupling coordination, as determined by the Coupling Coordination Degree Model (CCDM), are II-2022-21, II-2027-24, III-2027-51, and III-2032-21. The average coupling coordination value for the two systems using the NSGA-II algorithm is 0.835, surpassing the 0.805 average of the NSGA-III algorithm. This indicates that the NSGA-II algorithm demonstrates a higher overall level of coordination. Utilizing the original data, the Ranking and Scoring Method (RSR) was employed, which incorporates three-tier evaluation levels and non-integer ranking methods. Based on the entropy weight method, the index weights for the two algorithms (NSGA-II and NSGA-III) were calculated across the data for each year, resulting in the data values ranked first by the RSR method, as presented in Table 6.
Based on the screening schemes calculated by the NSGA and TOPSIS-CCDM models and the RSR method, a comparison of the three sets of schemes for each of the II/III generation algorithms for the three planning years is obtained, as shown in Table 7.
Table 7 illustrates that in the 2022 algorithm, both the RSR method and the TOPSIS-CCDM model selected the same scheme from NSGA-II, and similarly, in 2027, they chose the same scheme from NSGA-III. A comparison of the other schemes reveals that the RSR method, from a purely mathematical calculation perspective, tends to favor schemes in NSGA-II that prioritize economic benefits (f2(x)), while neglecting pollution (f3(x)). Conversely, in NSGA-III, this trend is reversed.
In the comparison, the RSR method identified schemes 45 and 11, both of which exhibit pollutant emissions exceeding 1000 tons, significantly higher than those of other schemes. Additionally, schemes 38 and 65 only achieve a reduction in pollutant emissions of approximately 7%, while incurring a sacrifice of about 3% in economic benefits, rendering them less favorable compared to the alternatives. The RSR method’s strong preference for specific indicators may lead to a bias towards supporting schemes that perform well on individual metrics, particularly in instances where there is a substantial trade-off between indicators, potentially compromising the objectivity of the results. Conversely, the outcomes of the TOPSIS-CCDM model are more compelling. Notably, both methods converge on the selection of schemes 21 and 51, suggesting a relative consensus in the comprehensive evaluation of the options. This alignment may be influenced by data distribution, the allocation of indicator weights, and the clarity of evaluation objectives, thereby bolstering the credibility of the decision-making process. Consequently, these two sets of schemes should be prioritized in subsequent comparisons.
The ultimate selection of a solution necessitates a comparison with specific allocation scenarios and realistic conditions to arrive at a definitive conclusion. The water resource allocation trends implemented by the schemes selected using the ACS and TOPSIS-CCDM models are illustrated in Figure 8.
Figure 8a indicates that Scheme 21 places significant emphasis on the allocation of water resources within the ecological sector. In contrast, the schemes depicted in Figure 8b,c demonstrate relatively balanced allocations, necessitating further clarification regarding the real-world scenario requirements for selection. Figure 8d reveals that, as a city reliant on coal resources, the coal industry constitutes the largest proportion of the industrial structure, accounting for 71.4%. Consequently, water resource allocation should prioritize the industrial sector.
However, an analysis of the ‘Hancheng City Hydrogen Energy Industry Development Plan (2024–2030)’, the ‘Industrial Doubling Plan’, and the ‘Analysis of Water Supply and Demand in Hancheng City’—released by local government agencies—suggests that industrial water usage should be appropriately reduced in the 2022 and 2027 schemes to enhance investments in ecological configurations within the region. By 2032, priority should be given to industrial–ecological water allocation schemes to support the green transformation of the local steel industry and promote ecological restoration in the Yellow River Basin. Therefore, the selection of Schemes II-2022-21, II-2027-ACS, and II-2032-ACS aligns more closely with actual needs, as demonstrated in Table 8.
Table 8 illustrates that in 2022, the preferred scheme was II-2022-21, which yielded an economic benefit from water usage of ¥2,109,556.17 and resulted in pollutant emissions of 735.92 tons. This scheme prioritized water allocation for ecological purposes, underscoring the emphasis on supporting the ecological environment.
By 2027, the selected II-2027-ACS scheme marked a substantial increase in the economic benefit from water usage, reaching ¥29,401,252.75, while concurrently reducing pollutant emissions to 712.07 tons. This transition signifies a successful balance between economic growth and pollution reduction, achieving a symbiosis between economic development and environmental conservation.
Examining the trend in water resource allocation from 2012 to 2022, there was a progressive decrease in agricultural water use alongside an increase in water allocation for domestic, forestry, livestock, and ecological needs. This reallocation aligns with local ecological construction priorities, fostering sustainable ecosystem development and ensuring water security for other sectors.
Projecting ahead to 2032, the II-2032-ACS scheme emerged as the optimal choice, further boosting the economic benefit from water usage to ¥36,660,367.83 and lowering pollutant emissions to 700.96 tons. The water allocation strategy of this scheme aligns with the anticipated moderation in agricultural water reduction and the rise in industrial water use, effectively underpinning the green transformation of the steel industry and bolstering sustainable industrial development.
According to statistical data, the total water demand across various industries in Hancheng City in 2020 was 132.14 million m3. This included 18.15 million m3 for domestic use, 11.71 million m3 for ecological environments, 30.36 million m3 for agriculture, and 71.92 million m3 for industrial purposes. Compared with the data from 2020 (Table 9), the largest proportion of total water consumption in the region is still industrial and domestic use. The actual water usage is significantly lower than the predictions in the planning documents, with water shortages in the agricultural irrigation, domestic, ecological, and industrial sectors reaching 23%, 78%, 66%, and 57%, respectively. These levels are considered severe water shortages. Based on the 2022 plan from this planning exercise, additional water supplies can be allocated as follows: 10%, 0.3%, 47%, and 2% for agricultural irrigation, domestic, ecological, and industrial use, respectively. By 2027, these figures would be 19%, 19%, 38%, and 2%, and by 2032, 14%, 15%, 33%, and 6%. These allocations can partially alleviate the water shortage situation.
It is noteworthy that due to the slight environmental improvements around 2020 to 2021, by 2022, the water scarcity in various sectors has somewhat eased. Furthermore, the allocation plans were compared individually with the static water scarcity situation in 2020. The cumulative effect of the five-year allocation plans will significantly ameliorate the local water scarcity conditions.
Consequently, the model proposed in this study can help mitigate the urban water deficit to a certain extent. For instance, as shown in Table 8, in 2022, all proposed schemes addressed approximately 58.2% of the shortage, decreasing to 49.4% by 2027, and then slightly increasing to 51.9% by 2032. This trend indicates that the strategies outlined in this model align well with future development trajectories. It is important to note that these predictions are based on a guarantee rate of p = 75%. Field investigations reveal that the average annual precipitation in the Longmen-Sanmenxia secondary basin, where the city is located, was 567.3 mm in 2022, which is lower than the average annual precipitation of 588 mm recorded from 1956 to 2016. The region has experienced a significant decrease in runoff, which has declined by 52.7%, leading to a systematic risk of drought. The proposed scheme emphasizes the use of water for ecological environments, thereby at least mitigating the risk of ecological degradation in the region. To ensure the long-term sustainability of water resource allocation schemes, this study recommends the following measures:
  • Establish a dynamic monitoring and evaluation system to adjust allocation strategies in real-time;
  • Prioritize the protection of ecological water demands;
  • Enhance the adaptability of policies and regulations;
  • Promote technological innovation in water conservation and wastewater treatment.

4. Discussion

This study integrates the Non-Dominated Sorting Genetic Algorithm (NSGA) with the Technique for Order Preference by Similarity to Ideal Solution with Comprehensive Consistency Decision Making (TOPSIS-CCDM) to optimize water resource allocation in the Hancheng City area and conduct scenario screening. During the computational process, the Relative Standard Deviation Ratio (RSR) method was employed to prioritize comparisons with the TOPSIS-CCDM results, thereby verifying the feasibility of the model. The issue of water resource allocation holds global significance, and research across different regions demonstrates both similarities and differences regarding objectives, methodologies, and application scenarios. Consequently, comparing and analyzing this study with other international research can enhance our understanding of the universality and specificity of this topic. Furthermore, through the computational process, we have identified certain limitations inherent to the NSGA algorithm and the TOPSIS-CCDM model.
The issue of similar water resource allocation is prevalent globally, particularly in the context of multi-objective optimization. Numerous studies underscore the importance of balancing economic, social, and ecological benefits in water resource allocation. For instance, Halverson and Fleming [49] employed complex network methods to analyze runoff similarity within the hydrological station network on the west coast of Canada, thereby providing systematic support for optimal water resource allocation. Similarly, Fang et al. [50] optimized water resource allocation in the Pearl River Delta using an improved NSGA-II algorithm, successfully achieving a balance among economic, ecological, and social benefits. These studies demonstrate a high degree of alignment with the present research regarding objective setting, all emphasizing the necessity of multi-objective optimization.
Although the objectives are similar, significant differences exist in the implementation of water resource allocation across various regions. Firstly, the influence of geographical and climatic conditions on water resource allocation is paramount. For instance, in arid regions, water resource allocation emphasizes ecological water requirements and water supply security, as exemplified by the study on the multi-objective optimization scheduling of water supply and ecology in the Simao Gou Reservoir in Hami City [51]. In contrast, humid regions may prioritize water quality management and flood control operations. Secondly, socio-economic conditions significantly influence the prioritization of water resource allocation. For example, in cross-border water resource allocation, fairness and the legal framework are central considerations. Research by Wolf, A.T. et al. [52] on the allocation of international rivers underscores the importance of fairness principles and negotiation mechanisms. In comparison, the present study emphasizes balancing economic, social, and ecological benefits within a specific region.
In international water resource optimization cases, the innovative integration of multi-criteria decision-making methods has emerged as a prominent trend. For instance, the Yellow River basin in China has implemented a combined model utilizing the Technique for Order Preference by Similarity to Ideal Solution (TOPSIS) and the fuzzy analytic hierarchy process [53]. The TOPSIS-CCDM sequential model proposed in this study exhibited superior precision in scheme screening within the context of the Pearl River–Xijiang Economic Belt in China, demonstrating that it provides a more favorable decision-making mechanism compared to individual methods [54].
In the context of multi-objective optimization problems, NSGA-II demonstrates superior coordination capabilities within the TOPSIS-CCDM model, especially when objectives are not predefined. Its solutions exhibit significant advantages in terms of coupling coordination [55]. This advantage can be primarily attributed to the crowding distance mechanism of NSGA-II, which effectively prevents the algorithm from converging to local optima by maintaining population diversity. In contrast, although NSGA-III demonstrates remarkable performance in multi-objective optimization through the use of reference points, it may be less effective in preserving population diversity compared to NSGA-II’s crowding distance mechanism in certain scenarios. Consequently, when the number of objectives is limited or the objectives are not explicitly defined, NSGA-II exhibits superior performance in balancing the distribution and diversity of solutions, thereby demonstrating better coordination in coupled systems. Conversely, NSGA-III achieves faster computation speeds under specific optimization objectives; however, its inclination to favor certain objective functions, such as f3, results in suboptimal performance in attaining a balanced multi-objective outcome [56]. Notably, the Pareto solution set generated by NSGA-II, as illustrated in Figure 5, displays discontinuity, which can be attributed to the algorithm’s independent management of each objective when calculating crowding distance. This observation aligns with the hypothesis proposed by Murugan P et al. [57]. In this paper, the structural hierarchy of the original model was reduced through mathematical techniques during the initial stage of model construction. Unfortunately, the aforementioned issues persisted in subsequent computations, suggesting that this approach may be ineffective in this context.
The Pareto solution sets generated by NSGA-II in high-dimensional problems often exhibit discontinuity, which can be attributed to its strategy of processing each objective independently. This approach can lead to a reduction in the diversity and continuity of the solution set [58,59]. Consequently, decision-makers may find it challenging to select the optimal option, potentially resulting in the selection of a suboptimal solution due to the incomplete presentation of key trade-offs. To address this issue, the approach employed in this paper involves the selection of ACS solutions by evaluating continuous segments while disregarding breakpoints and discontinuous sections. However, this method has a significant drawback: in the context of complex problems, it may overlook important and valuable information. Future improvements could be realized by introducing new mechanisms specifically designed to generate discontinuous solution sets that enhance information selection and coverage.
The deficiencies of NSGA-II in high-dimensional problems can be mitigated by incorporating multi-agent systems, refining the crowding assessment mechanism, or adopting selection strategies based on feature weights. These enhancements can improve search efficiency and the diversity of the solution set [39,60]. However, the simplification measures implemented during the initial stages of model construction have not completely resolved the issue, indicating a need for further adjustments to the optimization strategy.
In real-world complex scenarios, employing a model that integrates TOPSIS with CCDM, utilizing the entropy weight method, demonstrates significant characteristics and advantages for multi-objective decision-making and resource optimization scheduling problems [43]. Typically, these two methods are utilized in tandem; in this paper [54,61], the combination of TOPSIS and CCDM in series significantly enhances the precision and comparability of filtering various solutions. In contrast to the TOPSIS-CCDM model, the RSR method exhibits a more proactive selection tendency: NSGA-II emphasizes economic performance (objective function f2), whereas NSGA-III prioritizes environmental benefits (objective function f3). This distinction underscores the significant trade-off between economic and environmental considerations. The RSR method calculates the RSR value through rank transformation, which is sensitive to the relative magnitude of data. Consequently, within the solution set of NSGA-II, schemes with strong economic performance are assigned higher RSR values; conversely, in the solution set of NSGA-III, the RSR method tends to favor schemes that provide better environmental benefits.
Although the use of TOPSIS and CCDM models in multi-criteria decision analysis offers significant advantages, certain issues have emerged during the calculation process:
  • In this study, the TOPSIS and CCDM models are employed in series, which significantly increases computational complexity and renders the model highly sensitive to minor fluctuations in data. Consequently, this sensitivity poses challenges for decision-makers in achieving consistency in their decisions based on the model’s results in practical applications, particularly when multiple stakeholders are involved, as even slight alterations in data can lead to markedly different outcomes;
  • The classification of coordination levels lacks objective standards, and various research topics may employ different classification methods. This variability somewhat diminishes the comparability of the results.
To address the aforementioned issues, we propose three improvement suggestions:
  • Future research should concentrate on enhancing the ranking fitness strategy of NSGA-II;
  • Implementing the models in parallel may mitigate the CCDM’s reliance on the TOPSIS calculation data, thus reducing computational complexity;
  • Integrating the outcomes of both models can diminish the sequential model’s sensitivity to data fluctuations.
Sensitivity analysis is essential for evaluating the robustness of models; however, traditional methods may neglect the interactions between parameters, which can compromise the accuracy of the results [62]. It is advisable to employ global sensitivity analysis methods, such as Sobol index analysis, which quantify the effects of input variables and their interactions on model output uncertainty through variance decomposition, making them suitable for complex, nonlinear, and high-dimensional systems. Future research should integrate both global and local sensitivity analysis to conduct a more comprehensive evaluation of model robustness, thereby enhancing reliability and applicability.

5. Conclusions

(1) This study constructs a multi-objective optimization model by integrating the NSGA algorithm with the TOPSIS-CCDM model, aiming to address water resource allocation issues while minimizing regional water shortages, maximizing economic benefits, and reducing pollutant emissions. An analysis of water use trends from 2012 to 2022 reveals that future water resource allocation should transition from agricultural to domestic and ecological uses to support ecological construction. Consequently, the II-2022-21, II-2027-ACS, and II-2032-ACS schemes are identified as reference frameworks for the upcoming decade. Specifically, the II-2022-21 scheme indicates a water shortage of 17,802.35 m3/d, economic benefits of 21,019,556.17 yuan, and pollutant emissions of 745.92 tons; the II-2027-ACS scheme shows a water shortage of 14,098.76 m3/d, economic benefits of 29,401,252.75 yuan, and pollutant emissions of 712.07 tons; while the II-2032-ACS scheme demonstrates a water shortage of 12,709.33 m3/d, economic benefits of 36,660,367.83 yuan, and pollutant emissions of 700.96 tons. These schemes effectively reduce pollutant emissions while sustaining economic benefits, aligning with ecological priorities and promoting green industrial practices, thus providing a scientific foundation for regional sustainable development. Given that precipitation in this region was below the historical average in 2022, with a 52.7% reduction in runoff, there is an increased risk of drought. Therefore, this study proposes several measures to ensure the long-term sustainability of the water resource allocation plan: establishing a dynamic monitoring and evaluation system, prioritizing the protection of ecological water demands, enhancing the adaptability of policies and regulations, and promoting technological innovation in water conservation and sewage treatment. These measures are essential for mitigating the risk of ecological decline in the region and ensuring that the plan aligns with future development trends.
(2) This study compares the performance of the NSGA-II and NSGA-III algorithms in multi-objective optimization. The findings indicate that NSGA-III demonstrates superior capabilities in solution distribution control and parameter adjustment. In contrast, NSGA-II, owing to its higher coupling coordination, is more appropriate for scenarios lacking specific objectives. However, both the TOPSIS and CCDM models exhibit limitations when addressing high-dimensional objectives, including high computational complexity and sensitivity to data fluctuations. Therefore, future research should focus on addressing these limitations:
1) Optimizing the ranking adaptability strategy of NSGA-II;
2) Reducing the dependence of the CCDM on TOPSIS data through model parallelization to lower computational complexity;
3) In subsequent studies of a similar nature, a variety of strategies can be implemented to alleviate issues related to data sensitivity. For instance, normalization techniques can rescale data to a uniform range of 0 to 1, reducing inconsistencies arising from dimensional differences. Anomaly detection methods, such as Z-scores or IQR (Interquartile Range), can identify and remove outliers. Data smoothing techniques, like moving averages, can decrease data volatility. Furthermore, combining the results from two models can also help reduce sensitivity to data fluctuations. Simultaneously, given that the Sobol index is a commonly used tool for global sensitivity analysis and is capable of precisely measuring the influence of various input parameters on output results, it is recommended to delve deeper into this field in future research. Incorporating Sobol index analysis can contribute to a comprehensive evaluation of the sensitivity of input parameters and their interactions, thereby enhancing the integrity and depth of the research.
This study presents a systematic solution for water resource allocation through the development of optimization and decision-making models, thereby enhancing the scientific rigor and adaptability of water resource management. The research provides empirical evidence for the selection of optimization tools and offers a novel perspective for addressing complex water resource allocation challenges. The conclusions serve as guidance for water resource planning in Hancheng City and act as a reference for similar regions. Given the complexity and dynamics of water resource issues in mining cities, this paper proposes static allocation schemes based on existing data, underscoring the necessity for localized strategies. Future research will concentrate on improving the model to enhance its applicability and robustness in high-dimensional target and complex data environments, thereby further advancing the field of water resource optimization.

Author Contributions

Conceptualization, H.T.; Methodology, H.T.; Software, C.T.; Validation, R.Z.; Formal analysis, C.T.; Resources, H.T.; Data curation, C.T.; Writing—original draft, C.T.; Writing—review & editing, H.T.; Visualization, C.T.; Supervision, R.Z.; Project administration, R.Z.; Funding acquisition, H.T. All authors have read and agreed to the published version of the manuscript.

Funding

This study was supported by the Key Research and Development Program of Shaanxi (2021ZDLSF05-09) and Shaanxi Coal Industry Resource Comprehensive Utilization Project (2022SMHK-B-J-32).

Institutional Review Board Statement

Not applicable.

Informed Consent Statement

Not applicable.

Data Availability Statement

The data presented in this study are available on request from the corresponding author due to the requirement of confidentiality by the relevant government administrative authorities in the People’s Republic of China. Requests for access to the data should be directed to the corresponding author, and an application process is required.

Conflicts of Interest

The authors declare that they have no known competing financial interests or personal relationships.

References

  1. Mirdashtvan, M.; Najafinejad, A.; Malekian, A.; Sa’doddin, A. Sustainable water supply and demand management in semi-arid regions: Optimizing water resources allocation based on RCPs scenarios. Water Resour. Manag. 2021, 35, 5307–5324. [Google Scholar] [CrossRef]
  2. Zhang, M.; Tan, F.; Lu, Z. Resource-based cities (RBC): A road to sustainability. Int. J. Sustain. Dev. World Ecol. 2014, 21, 465–470. [Google Scholar] [CrossRef]
  3. Wang, S.; Sun, Z.; Liu, J.; Zhou, A. Water resource utilization assessment in China based on the dynamic relationship between economic growth and water use. Sustainability 2024, 16, 1325. [Google Scholar] [CrossRef]
  4. Pittock, J.; Corbett, S.; Colloff, M.J.; Wyrwoll, P.; Alexandra, J.; Beavis, S.; Chipperfield, K.; Croke, B.; Lane, P.; Ross, A.; et al. A review of the risks to shared water resources in the Murray–Darling Basin. Australas. J. Water Resour. 2023, 27, 1–17. [Google Scholar] [CrossRef]
  5. Dong, S.; Wang, H.; Guo, X.; Zhou, Z. Characteristics of water hazards in China’s coal mines: A review. Mine Water Environ. 2021, 40, 325–333. [Google Scholar] [CrossRef]
  6. Guo, D.; Zhang, D.; Xu, D.; Bian, Y.; Pan, Y. Multi-Objective Water Allocation for Wu’an City. Water 2025, 17, 153. [Google Scholar] [CrossRef]
  7. Li, H.; Xiong, Z.; Xie, Y. Resource tax reform and economic structure transition of resource-based economies. Resour. Conserv. Recycl. 2018, 136, 389–398. [Google Scholar] [CrossRef]
  8. Liu, X.; Meng, X. Evaluation and empirical research on the energy efficiency of 20 mining cities in Eastern and Central China. Int. J. Min. Sci. Technol. 2018, 28, 525–531. [Google Scholar] [CrossRef]
  9. Wang, D.; Li, K.; Li, H.; Zhang, Y.; Fu, T.; Sun, L.; Wang, Y.; Zhang, J. Water resource utilization and future supply–demand scenarios in energy cities of semi-arid regions. Sci. Rep. 2025, 15, 5005. [Google Scholar] [CrossRef]
  10. Ahmed, S.A.; Al-Jeshi, M.A.; Al-Yousef, K.K. Produced water reuse enabling circularity in oil operations. Desalination Water Treat. 2022, 263, 60–69. [Google Scholar] [CrossRef]
  11. Li, Y.; Sun, K.; Men, R.; Wang, F.; Li, D.; Han, Y.; Qu, Y. Study on the Optimization of Multi-Objective Water Resources Allocation in the Henan Yellow River Water Supply Zone. Water 2023, 15, 4009. [Google Scholar] [CrossRef]
  12. Zhou, L.; Liang, H. A study on the evolution of water resource carrying capacity in Karst area based on component analysis and entropy. J. Nat. Resour. 2006, 21, 827–833. [Google Scholar]
  13. Onta, P.R.; Jha, M.K. Multi-objective optimization for water resources management: A review. Water Resour. Manag. 2013, 27, 4607–4626. [Google Scholar]
  14. Esat, V.; Hall, M.J. Water resources system optimization using genetic algorithms. In Proceedings of the 1st International Conference on Hydroinformatics, Delft, The Netherlands, 19–23 September 1994; pp. 225–231. [Google Scholar]
  15. Deb, K.; Pratap, A.; Agarwal, S.; Meyarivan, T. A fast and elitist multiobjective genetic algorithm: NSGA-II. IEEE Trans. Evol. Comput. 2002, 6, 182–197. [Google Scholar] [CrossRef]
  16. Deng, L.; Guo, S.; Yin, J.; Chen, K. Multi-objective optimization of water resources allocation in Han River basin (China) integrating efficiency, equity and sustainability. Sci. Rep. 2022, 12, 798. [Google Scholar] [CrossRef]
  17. Deb, K.; Jain, H. An evolutionary many-objective optimization algorithm using reference-point-based nondominated sorting approach, part I: Solving problems with box constraints. IEEE Trans. Evol. Comput. 2014, 18, 700–722. [Google Scholar] [CrossRef]
  18. Deb, K.; Jain, S. An exhaustive review of the metaheuristic algorithms for search and optimization: Taxonomy, applications, and open challenges. Int. J. Appl. Metaheuristic Comput. 2014, 5, 1–24. [Google Scholar]
  19. Chen, C.; Yuan, Y.; Yuan, X. An improved NSGA-III algorithm for reservoir flood control operation. Water Resour. Manag. 2017, 31, 4469–4483. [Google Scholar] [CrossRef]
  20. Li, S.; Guo, S.; Zhang, J. Multi-objective optimization model of water resources considering fairness and water shortage risk. Water 2022, 14, 2648. [Google Scholar]
  21. Yuan, H.; Xu, H.; Wang, B. An improved NSGA-III procedure for evolutionary many-objective optimization. In Proceedings of the 2014 Annual Conference on Genetic and Evolutionary Computation, Lisbon, Portugal, 15–19 July 2023; pp. 661–668. [Google Scholar]
  22. Du, L.; Niu, Z.; Zhang, R.; Zhang, J.; Jia, L.; Wang, L. Evaluation of water resource carrying potential and barrier factors in Gansu Province based on game theory combined weighting and improved TOPSIS model. Ecol. Indic. 2024, 166, 112438. [Google Scholar] [CrossRef]
  23. Zhao, Q.; Bai, Q.; Nie, K.; Wang, H.; Zeng, X. Multi-objective optimization allocation of regional water resources based on NSGA-III and TOPSIS. J. Drain. Irrig. Mach. Eng. 2021, 39, 1–9. [Google Scholar]
  24. Madi, N.; Rostamzadeh, R.; Saberi, M. An exploration of issues and limitations in current methods of TOPSIS and fuzzy TOPSIS. J. Intell. Fuzzy Syst. 2016, 30, 2537–2546. [Google Scholar]
  25. Chang, Q.; Liu, D.; Yang, Y. Multiple attribute decision making method based on improved TOPSIS. Ordnance Ind. Autom. 2024, 43, 49–53. [Google Scholar]
  26. Jiang, Y.; Tang, Y.; Chen, Q.; Liu, H.; Tang, J. Interval-valued intuitionistic fuzzy soft sets and their properties. Comput. Math. Appl. 2010, 60, 906–918. [Google Scholar] [CrossRef]
  27. Garg, H.; Arora, R. TOPSIS method based on correlation coefficient for solving decision-making problems with intuitionistic fuzzy soft set information. AIMS Math. 2020, 5, 2944–2966. [Google Scholar] [CrossRef]
  28. Yuan, D.; Du, M.; Yan, C.; Wang, J.; Wang, C.; Zhu, Y.; Wang, H.; Kou, Y. Coupling coordination degree analysis and spatiotemporal heterogeneity between water ecosystem service value and water system in Yellow River Basin cities. Ecol. Inform. 2024, 79, 102440. [Google Scholar] [CrossRef]
  29. Wang, X.; Zhang, S.; Gao, C.; Tang, X. Coupling coordination and driving mechanisms of water resources carrying capacity under the dynamic interaction of the water-social-economic-ecological environment system. Sci. Total Environ. 2024, 926, 171011. [Google Scholar] [CrossRef]
  30. National Bureau of Statistics. China Energy and Economic Yearbook 2023; National Bureau of Statistics: Beijing, China, 2023. Available online: https://www.stats.gov.cn/sj/ndsj/ (accessed on 11 February 2025).
  31. International Energy Agency (IEA). Coal in Net Zero Transitions; IEA: Paris, France, 2022. Available online: https://www.iea.org/reports/coal-in-net-zero-transitions (accessed on 11 February 2025).
  32. Luo, T.; Otto, B.; Shiao, T.; Maddocks, A. Identifying the Global Coal Industry’s Water Risks; World Resources Institute: Washington, DC, USA, 2014; Available online: https://www.wri.org/insights/identifying-global-coal-industrys-water-risks (accessed on 11 February 2025).
  33. Almulla, N.; Smith, A.; Brown, J. Water resources management in arid oil regions. J. Water Resour. 2022, 25, 45–60. [Google Scholar]
  34. U. S. Geological Survey. Water Use in Appalachian Coal Mining: Challenges and Opportunities (USGS Circular 1488); U. S. Department of the Interior: Reston, VA, USA, 2020. Available online: https://pubs.usgs.gov/circ/1488/ (accessed on 11 February 2025).
  35. World Bank. Managing Water Resources in South Africa’s Mining Sector; World Bank: Washington, DC, USA, 2020; Available online: https://documents.worldbank.org/ (accessed on 11 February 2025).
  36. Qiu, L.; Wang, W. Water Resources Optimization Allocation and Scheduling; China Water & Power Press: Beijing, China, 2015. [Google Scholar]
  37. Liu, X.; Zhang, J.; Wang, J. Optimization of water resource allocation in mining areas based on improved NSGA-III algorithm. Resources 2023, 12, 76. [Google Scholar]
  38. Auger, A.; Bader, J.; Brockhoff, D.; Zitzler, E. Hypervolume-based multiobjective optimization: Theoretical foundations and practical implications. Theor. Comput. Sci. 2012, 425, 75–103. [Google Scholar] [CrossRef]
  39. Zhang, Z. Multi-objective optimization method for building energy-efficient design based on multi-agent-assisted NSGA-II. Energy Inform. 2024, 7, 90. [Google Scholar] [CrossRef]
  40. Zhang, Y.; Li, J. An improved NSGA-III algorithm based on distance dominance relation for many-objective optimization. Expert Syst. Appl. 2023, 228, 120006. [Google Scholar]
  41. Dezert, J.; Tchamova, A.; Han, D.; Tacnet, J.-M. The SPOTIS rank reversal free method for multi-criteria decision-making support. In IEEE Symposium on Information Fusion; IEEE: New York, NY, USA, 2020. [Google Scholar]
  42. Ceballos, B.; Lamata, M.T.; Pelta, D.A. A comparative analysis of multi-criteria decision-making methods. Prog. Artif. Intell. 2016, 5, 315–322. [Google Scholar] [CrossRef]
  43. Shi, H.; Hu, Y.; Gan, L. Assessing urban resilience based on production-living-ecological system using degree of coupling coordination: A case of Sichuan. PLoS ONE 2024, 19, e0304002. [Google Scholar] [CrossRef]
  44. Bu, Q.Q.; Chen, X.R.; Zhang, M.; Tan, B.; Deng, D. Comprehensive evaluation of residents’ health level in China based on entropy weight TOPSIS method combined with RSR method. Stat. Appl. 2024, 13, 133–140. [Google Scholar]
  45. Rahman, S.; Alali, A.S.; Baro, N.; Ali, S.; Kakati, P. A novel TOPSIS framework for multi-criteria decision making with random hypergraphs: Enhancing decision processes. Symmetry 2024, 16, 1602. [Google Scholar] [CrossRef]
  46. Wang, X.; Li, X. An empirical analysis of the coupling and coordinated development of new urbanization and ecological welfare performance in China’s Chengdu–Chongqing economic circle. Sci. Rep. 2024, 14, 13197. [Google Scholar]
  47. Zhang, L.; Xu, Z. Coupling coordination relationship between ecosystem services and water-land resources for the Daguhe River Basin, China. PLoS ONE 2021, 16, e0257123. [Google Scholar]
  48. GB 8978-1996; Integrated Wastewater Discharge. National Environmental Protection Administration (NEPA): Beijing, China, 1996.
  49. Halverson, M.J.; Fleming, S.W. Complex network theory, streamflow, and hydrometric monitoring system design. Hydrol. Earth Syst. Sci. 2015, 19, 3301–3318. [Google Scholar] [CrossRef]
  50. Fang, K.; Sivakumar, B.; WoldeMeskel, F.M. Complex networks, community structure, and catchment classification in a large-scale river basin. J. Hydrol. 2017, 545, 478–493. [Google Scholar] [CrossRef]
  51. Rehemu, A.; Zhenhui, W.; Deddi, L. Multi-objective optimization of water supply and ecological scheduling for the Sidao Gully Reservoir in Hami City. J. Water Resour. Res. 2022, 11, 335–345. [Google Scholar]
  52. Wolf, T.A. Criteria for equitable allocations: The heart of international water conflict. Nat. Resour. Forum 1999, 23, 3–30. [Google Scholar] [CrossRef]
  53. Zhao, M.; Li, J.; Zhang, Y.; Han, Y.; Wei, J. Water cycle health assessment based on combined weight and hook trapezoid fuzzy TOPSIS model: A case study of nine provinces in the Yellow River Basin, China. Ecol. Indic. 2023, 147, 109987. [Google Scholar] [CrossRef]
  54. Zhang, X.; Duan, X. Evaluating water resource carrying capacity in Pearl River-West River economic belt based on portfolio weights and GRA-TOPSIS-CCDM. Ecol. Indic. 2024, 161, 111942. [Google Scholar] [CrossRef]
  55. Chaudhari, P.; Thakur, A.K.; Kumar, R.; Banerjee, N.; Kumar, A. Comparison of NSGA-III with NSGA-II for multi-objective optimization of adiabatic styrene reactor. Mater. Today Proc. 2022, 49, 1125–1130. [Google Scholar] [CrossRef]
  56. Ishibuchi, H.; Imada, R.; Setoguchi, Y.; Nojima, Y. Performance comparison of NSGA-II and NSGA-III on various many-objective test problems. IEEE Trans. Evol. Comput. 2016, 20, 358–369. [Google Scholar]
  57. Murugan, P.; Kannan, S.; Baskar, S. Application of NSGA-II algorithm to single-objective transmission constrained generation expansion planning. IEEE Trans. Power Syst. 2019, 24, 1790–1797. [Google Scholar] [CrossRef]
  58. Ma, H.; Zhang, Y.; Sun, S.; Liu, T.; Shan, Y. A comprehensive survey on NSGA-II for multi-objective optimization and applications. Artif. Intell. Rev. 2023, 56, 15217–15270. [Google Scholar] [CrossRef]
  59. Zhang, X.; Liu, Z.; Wang, C.; Shang, Y. An improved NSGA-II algorithm and its application. In Cyberspace Data and Intelligence, and Cyber-Living, Syndrome, and Health; Ning, H., Ed.; Springer: Berlin/Heidelberg, Germany, 2019; pp. 1137–1146. [Google Scholar]
  60. Cattelani, L.; Fortino, V. Improved NSGA-II algorithms for multi-objective biomarker discovery. Bioinformatics 2022, 38 (Suppl. S2), ii20–ii26. [Google Scholar] [CrossRef]
  61. Chen, L.; Wang, X.; Lv, M.; Su, J.; Yang, B. Coupling coordination and spatial–temporal evolution of the water–land–ecology system in the North China Plain. Agriculture 2024, 14, 1636. [Google Scholar] [CrossRef]
  62. Wang, H.; Zhang, Y.; Feng, W. Utilizing the Sobol’ sensitivity analysis method to optimize reservoir operation rules. Water 2023, 15, 3795. [Google Scholar] [CrossRef]
Figure 1. Study area map.
Sustainability 17 04616 g001
Figure 2. Schematic diagram of the water supply system structure.
Sustainability 17 04616 g002
Figure 3. The supply and demand balance diagram of mining area–city water resources in 2022, 2027 and 2032.
Sustainability 17 04616 g003aSustainability 17 04616 g003b
Figure 4. Model Approach and Mechanism Optimization.
Sustainability 17 04616 g004
Figure 5. NSGA-II/III algorithm mechanism.
Sustainability 17 04616 g005
Figure 6. Pareto solution and ACS diagram.
Sustainability 17 04616 g006
Figure 7. Schematic diagram of calculating Ci values for different schemes in various years using the TOPSIS model.
Sustainability 17 04616 g007
Figure 8. The water allocation trends for different schemes in 2022, 2027, and 2032.
Sustainability 17 04616 g008
Table 1. Comparison of the performance and applicability of multi-criteria decision-making methods.
Method (In This Study)TOPSIS-CCDMSPOTISCOMETSIMUS
Data Preprocessing and Outlier Sensitivity
(The lower, the better)
LOW: Integrating CCDM to mitigate the impact of outliers on decision-making results.HIGH: Sensitive to Data Preprocessing and Outliers.MED: Depends on expert ratings.MED: Requires multiple iterations.
Subjectivity
(The lower, the better)
LOW: Reducing the subjectivity of single expert scoring through CCDM.LOW: Requires fewer expert ratings.HIGH: Highly subjective.MED: Decision-makers are required to iterate multiple times based on experience, featuring a strong subjective nature.
Computational Complexity
(The lower, the better)
LOW: After integrating CCDM, the computation remains efficient.LOW: Rapid and simple computation.HIGH: Requires complex fuzzy logic. HIGH: The computation is complex.
Result Reliability
(The higher, the better)
HIGH: Delivering more reliable evaluation results.MED: Sensitive to Data Preprocessing.HIGH: Influenced by expert subjectivity.MED: The reliability of the results depends on the decision-maker’s experience.
Result Intuitiveness
(The higher, the better)
HIGH: The results are intuitive, facilitating quick understanding and acceptance by decision-makers.MED: Results are ideally difficult to achieve with moderate difficulty.LOW: The reliance on intricate fuzzy logic and expert scoring makes the results challenging to comprehend.LOW: The results are difficult to understand.
Dependency on Decision-makers’ Experience
(The lower, the better)
LOW: Reducing experience dependence to enhance the scientific nature of decision-making.LOW: Low dependence on decision-makers’ experience.HIGH: Expert scoring and experience are relied upon.HIGH: High requirements for decision-makers’ experience.
Comprehensive Evaluation Capability
(The higher, the better)
HIGH: More comprehensive evaluation.MED: Limited comprehensive capability.MED: Subject to the influence of expert subjectivity.MED: The comprehensive capability relies on the decision-maker’s experience.
Table 2. Specific parameter table.
Planning Year 202220272032
agricultureNet benefit factor for water use (yuan/m3)272932
Water for forest and animal husbandryNet benefit factor for water use (yuan/m3)421
ecologicallyNet benefit factor for water use (yuan/m3)450550650
industriesNet benefit factor for water use (yuan/m3)110015001900
Pollutant emission concentration (mg/L)14.2318.1919.06
Sewage discharge factor0.280.260.24
domestic waterNet benefit factor for water use (yuan/m3)450550650
Pollutant emission concentration (mg/L)23.9223.9223.92
Sewage discharge factor0.780.780.78
Table 3. ACS schemes for different NSGA methods over the years.
MethodologiesPlanning Yearf1(x) Water Shortage(m3/d)f2(x) Economic Benefit (yuan)f3(x) Pollutant Emissions (t)
NSGA-Ⅱ202217,802.3514,691,912.25365.53
202714,098.7629,401,252.75712.07
203212,709.3336,660,367.83700.96
NSGA-Ⅲ202217,802.3515,811,597.35438.72
202714,098.7622,188,366.59465.13
203212,709.3335,637,775.89667.95
Table 4. The Ci value index of the ACS.
AlgorithmPlanning YearPositive Ideal SolutionNegative Ideal SolutionRelative Closeness Degree (Ci)Whether to Choose
NSGA-Ⅱ20220.300.500.63
20270.510.250.33×
20320.500.230.32×
NSGA-Ⅲ20220.450.280.38×
20270.250.380.60
20320.320.380.54
Table 5. The CCDM model calculates the results of the selection schemes.
AlgorithmPlanning YearSchemeCoupling Coordination Degree (D)f1(x) Water Shortage (m3/d)f2(x) Economic Benefit (yuan)f3(x) Pollutant Emissions (t)
NSGA-Ⅱ2022210.9017,802.3521,019,556.17745.92
2027240.7714,098.7632,288,428.92863.37
NSGA-Ⅲ2027510.8114,098.7625,235,320.82583.02
2032210.8012,709.3334,994,820.83642.23
Table 6. The optimal scheme obtained by the RSR method.
AlgorithmPlanning YearOriginal Scheme Labelf1(x) Water Shortage (m3/d)f2(x) Economic Benefit (yuan)f3(x) Pollutant Emissions (t)
NSGA-Ⅱ20222117,802.3521,019,556.17745.92
20274514,098.7641,147,313.851296.05
20321112,709.3350,545,524.781236.16
NSGA-Ⅲ20223817,802.3514,662,218.49369.37
20275114,098.7625,720,982.56600.32
20326512,709.3332,815,068.43565.68
Table 7. Comparison of ACS scheme, TOPSIS-CCDM screening scheme, and RSR scheme.
AlgorithmPlanning YearScheme Typef1(x) Water Shortage (m3/d)f2(x) Economic Benefit (yuan)f3(x) Pollutant Emissions (t)
NSGA-Ⅱ2022ACS17,802.3514,691,912.25365.53
Scheme 2117,802.3521,019,556.17745.92
Scheme 21 (RSR)17,802.3521,019,556.17745.92
2027ACS14,098.7629,401,252.75712.07
Scheme 2414,098.7632,288,428.92863.37
Scheme 45 (RSR)14,098.7641,147,313.851296 05
2032ACS12,709.3336,660,367.83700.96
Scheme 2417,802.3516,112,303.44456.30
Scheme 11 (RSR)12,709.3350,545,524.781236.16
NSGA-Ⅲ2022ASC17,802.3515,811,597.35438.72
Scheme 4017,802.3515,130,342.77398.73
Scheme 38 (RSR)17,802.3514,662,218.49369.37
2027ASC14,098.7622,188,366.59465.13
Scheme 5114,098.7625,720,982.56600.32
Scheme 51 (RSR)14,098.7625,720,982.56600.32
2032ASC12,709.3335,637,775.89667.95
Scheme 2112,709.3334,994,820.83642.23
Scheme 65 (RSR)12,709.3332,815,068.43565.68
Table 8. Final options.
Schemef1(x) Water Shortage (m3/d)f2(x) Economic Benefit (yuan)f3(x) Pollutant Emissions (t)Water Allocation Amount (m3/d)
Conventional Water Supply Gap SupplementUnconventional Water Supply Gap Supplement
Agricultural WaterDomestic WaterWater for Forest and Animal HusbandryEcological Water UseIndustrial Water
Ⅱ-2022-2117,802.3521,019,556.17745.928068.48150.52107.5715,186.764163.77
Ⅱ-2027-ACS14,098.7629,401,252.75712.074567.339199.7911,009.5812,057.494135.54
Ⅱ-2032-ACS12,709.3336,660,367.83700.966375.417393.215622.9610,699.5012,274.09
Trend of increase and decrease from 2012 to 2022−64%+33%+57.14%+33%+11.43%
Forecasting the trend of increase and decrease by 2035Decline slowed downIncrease stabilityIncrease stabilityIncrease stabilitySmall increase
Table 9. Water shortage rate, water use ratio, and water allocation improvement and replenishment proportion by subsequent schemes for each industry in 2020.
Agricultural WaterWater for Forest and Animal HusbandryDomestic WaterEcological Water UseIndustrial Water
The proportion of total water use11%14%26%6%43%
Water shortage ratio23%78%66%57%
The 2022 basic scheme theoretically supplements the proportion of water gaps10%0.3%47%2%
The 2027 basic scheme theoretically supplements the proportion of water gaps19%19%38%2%
The 2032 basic scheme theoretically supplements the proportion of water gaps14%15%33%6%
Disclaimer/Publisher’s Note: The statements, opinions and data contained in all publications are solely those of the individual author(s) and contributor(s) and not of MDPI and/or the editor(s). MDPI and/or the editor(s) disclaim responsibility for any injury to people or property resulting from any ideas, methods, instructions or products referred to in the content.

