Article

DHDRDS: A Deep Reinforcement Learning-Based Ride-Hailing Dispatch System for Integrated Passenger–Parcel Transport

1
School of Rail Transportation, Soochow University, Suzhou 215137, China
2
Intelligent Urban Rail Engineering Research Center of Jiangsu Province, Suzhou 215137, China
*
Author to whom correspondence should be addressed.
These authors contributed equally to this work.
Sustainability 2025, 17(9), 4012; https://doi.org/10.3390/su17094012
Submission received: 22 March 2025 / Revised: 24 April 2025 / Accepted: 26 April 2025 / Published: 29 April 2025

Abstract

Urban transportation demands are growing rapidly. Concurrently, the sharing economy continues to expand. These dual trends establish ride-hailing dispatch as a critical research focus for building sustainable smart transportation systems. Current ride-hailing systems only serve passengers. However, they ignore an important opportunity: transporting packages. This limitation causes two issues: (1) wasted vehicle capacity in cities, and (2) extra carbon emissions from cars waiting idle. Our solution combines passenger rides with package delivery in real time. This dual-mode strategy achieves four benefits: (1) better matching of supply and demand, (2) 38% less empty driving, (3) higher vehicle usage rates, and (4) increased earnings for drivers in changing conditions. We built a Dynamic Heterogeneous Demand-aware Ride-hailing Dispatch System (DHDRDS) using deep reinforcement learning. It works by (a) managing both passenger and package requests on one platform and (b) allocating vehicles efficiently to reduce the environmental impact. An empirical validation confirms the developed framework’s superiority over conventional approaches across three critical dimensions: service efficiency, carbon footprint reduction, and driver profits. Specifically, DHDRDS achieves at least a 5.1% increase in driver profits and an 11.2% reduction in vehicle idle time compared to the baselines, while ensuring that the majority of customer waiting times are within the system threshold of 8 min. By minimizing redundant vehicle trips and optimizing fleet utilization, this research provides a novel solution for advancing sustainable urban mobility systems aligned with global carbon neutrality goals.

1. Introduction

The global urbanization process has fundamentally reshaped urban mobility demand patterns, with ride-hailing systems evolving into critical infrastructure components for metropolitan transportation networks. However, the environmental and economic costs of inefficient resource allocation remain a pressing sustainability challenge. The United Nations predicts that urban areas will house nearly two-thirds (68%) of the world’s population within three decades [1], a concentration level posing critical challenges to traffic congestion mitigation, energy consumption reduction, and equitable resource distribution. Intelligent ride-hailing platforms leverage AI-enhanced matching mechanisms to achieve 22–35% mobility efficiency gains [2], establishing their operational superiority. However, the prevailing passenger-centric paradigm introduces systemic inefficiencies, particularly in idling vehicle capacity and suboptimal driver utilization. Empirical analyses reveal that 38% of vehicle trips in urban ride-hailing systems involve partial or complete empty mileage, indicating substantial underutilization of transportation resources [3] and unnecessary greenhouse gas emissions.
This operational deficiency intensifies three dimensions of urban sustainability strain: (a) spatially distributed idle vehicle capacity, (b) transportation-related carbon emission accumulation, and (c) imbalanced service accessibility across passenger–parcel demand categories [2,4]. Meanwhile, the persistent neglect of multimodal coordination aggravates urban mobility dilemmas, particularly manifesting as underutilized fleet assets and inequitable service distribution between passenger/parcel transportation domains [3]. Addressing these issues requires innovative frameworks capable of reconciling multimodal transportation coordination with dynamic environmental constraints, a critical frontier for advancing sustainable urban mobility systems [5].
Current studies mainly apply heuristic or model-based methods to optimize passenger services through short-term demand–supply matching [2,6,7,8,9,10]. Comparatively, research exploring long-term vehicle repositioning strategies for continuous fleet reward improvement has received less attention.
Machine learning now offers new solutions for dynamic repositioning [11,12,13,14,15,16,17,18,19]. For instance, Fluri et al. [20] partitioned urban areas into smaller zones using the Lloyd K-means algorithm [21], while Deng et al. [22] employed proximal policy optimization [23] to derive joint vehicle repositioning strategies, with value and policy functions approximated via neural networks. Recent work by Lu et al. [24] further advances vehicle speed prediction through a hybrid deep learning and transfer learning framework, demonstrating 21.3–24.9% MAE reductions in cross-condition scenarios, which enhances path planning accuracy for fuel cell vehicles. Shi et al. [25] proposed a grid-based multi-vehicle repositioning framework using a deep deterministic policy gradient [26], aiming to maximize total profits. A mean-field-enhanced multi-agent reinforcement learning framework was developed to optimize fleet spatial distribution through coordinated decision-making [27]. Despite these advancements, studies such as [28], which leverages deep reinforcement learning for dynamic subsidy strategies via NSMDP models and LSTM-based demand forecasting, remain constrained by parameter sensitivity, high computational costs, and limited adaptability to real-time data. Prior work focused solely on passenger optimization, neglecting the rising demand for urban parcel transport due to e-commerce and instant delivery. Recent studies highlight the importance of material properties in ground deformation during tunneling. Ground settlement from tunneling relates to tail grouting materials’ strain characteristics (Liu et al., 2023 [29]; Liang et al., 2025 [30]). Accurate prediction and mitigation of ground deformation are vital for successful tunneling projects. Zhang et al. [31] note that combining real-time monitoring with advanced modeling improves deformation prediction accuracy.
While traditional passenger and parcel services operate independently, recent attempts to integrate them—such as shared taxi networks in Tokyo [16], public transit-based freight systems [17], or two-tier delivery systems utilizing bus capacities [6,32]—rely on fixed schedules and lack dynamic adaptability. Rong et al. [33] comprehensively review rule-based and non-regular multi-vehicle collaborative planning, highlighting the role of trajectory prediction and reinforcement learning in improving traffic efficiency and safety, yet emphasizing unresolved challenges in environmental uncertainty and ethical decision-making. PPtaxi [34] proposed an integer linear programming model for multi-hop driver–parcel matching but failed to incorporate real-time learning or passenger–parcel pooling capabilities. These methods, though pioneering, are inherently model-based and struggle to adapt to evolving urban dynamics or heterogeneous demand patterns. Ride-hailing systems exhibit inherent asymmetries between service availability and mobility demands. The integration of autonomous vehicle technologies presents new opportunities for optimizing dynamic resource allocation in this domain [35,36,37].
Nevertheless, existing ride-sharing systems face operational inefficiencies when handling heterogeneous demands, primarily due to suboptimal coordination between passenger and parcel transportation modalities. To address this critical challenge, we propose the Dynamic Heterogeneous Demand-aware Ride-hailing Dispatch System (DHDRDS), which establishes a unified optimization framework integrating two core innovations: (1) Dual-Modal Demand Coordination: By conceptualizing parcel transportation as specialized passenger services, DHDRDS synchronizes dynamic pricing, route optimization, and deep reinforcement learning-based vehicle repositioning. The system embeds a multi-objective reward function that holistically balances driver profitability, service responsiveness, and fleet utilization efficiency. (2) Adaptive Resource Allocation: A heterogeneous graph neural network architecture dynamically correlates spatiotemporal demand patterns with vehicle supply characteristics, enabling real-time decision-making under stochastic operational conditions. Experimental validation demonstrates the system’s effectiveness in balancing operational objectives while maintaining service quality constraints.
This paper is structured as follows: Section 2 details the DHDRDS framework architecture and parameters. Section 3 introduces the experimental simulation environment setup and presents the results. Section 4 discusses the advantages and innovations as well as the limitations and future Work. Section 5 concludes this paper and outlines future research directions.

2. Materials and Methods

2.1. Dynamic Heterogeneous Demand-Aware Ride-Hailing Dispatch System

This paper proposes a Dynamic Heterogeneous Demand-aware Ride-hailing Dispatch System (DHDRDS), a deep reinforcement learning framework that unifies matching, pricing, and dispatching operations in ride-sharing ecosystems through Deep Q-Networks (DQNs). The framework employs a distributed optimization architecture where each vehicle autonomously computes initial passenger–parcel pairings based on localized state observations, ensuring compliance with capacity constraints while simultaneously minimizing customer waiting times (for both passengers and parcel shippers) and driver detour distances. By integrating a dual-agent decision mechanism, customers dynamically express multimodal preferences—including price sensitivity, route tolerance, and estimated time of arrival (ETA) requirements—and select time-step-optimal choices through myopic utility maximization, while vehicles learn context-aware dispatch policies via DQNs that incorporate real-time spatial–temporal updates from neighboring agents. This decentralized implementation inherently mitigates supply–demand mismatches caused by competitive optimization, as vehicle location states are propagated through a shared observation module to achieve Nash equilibrium in action selection without centralized coordination. The architecture ensures operational scalability while maintaining adaptability to dynamic urban mobility patterns.

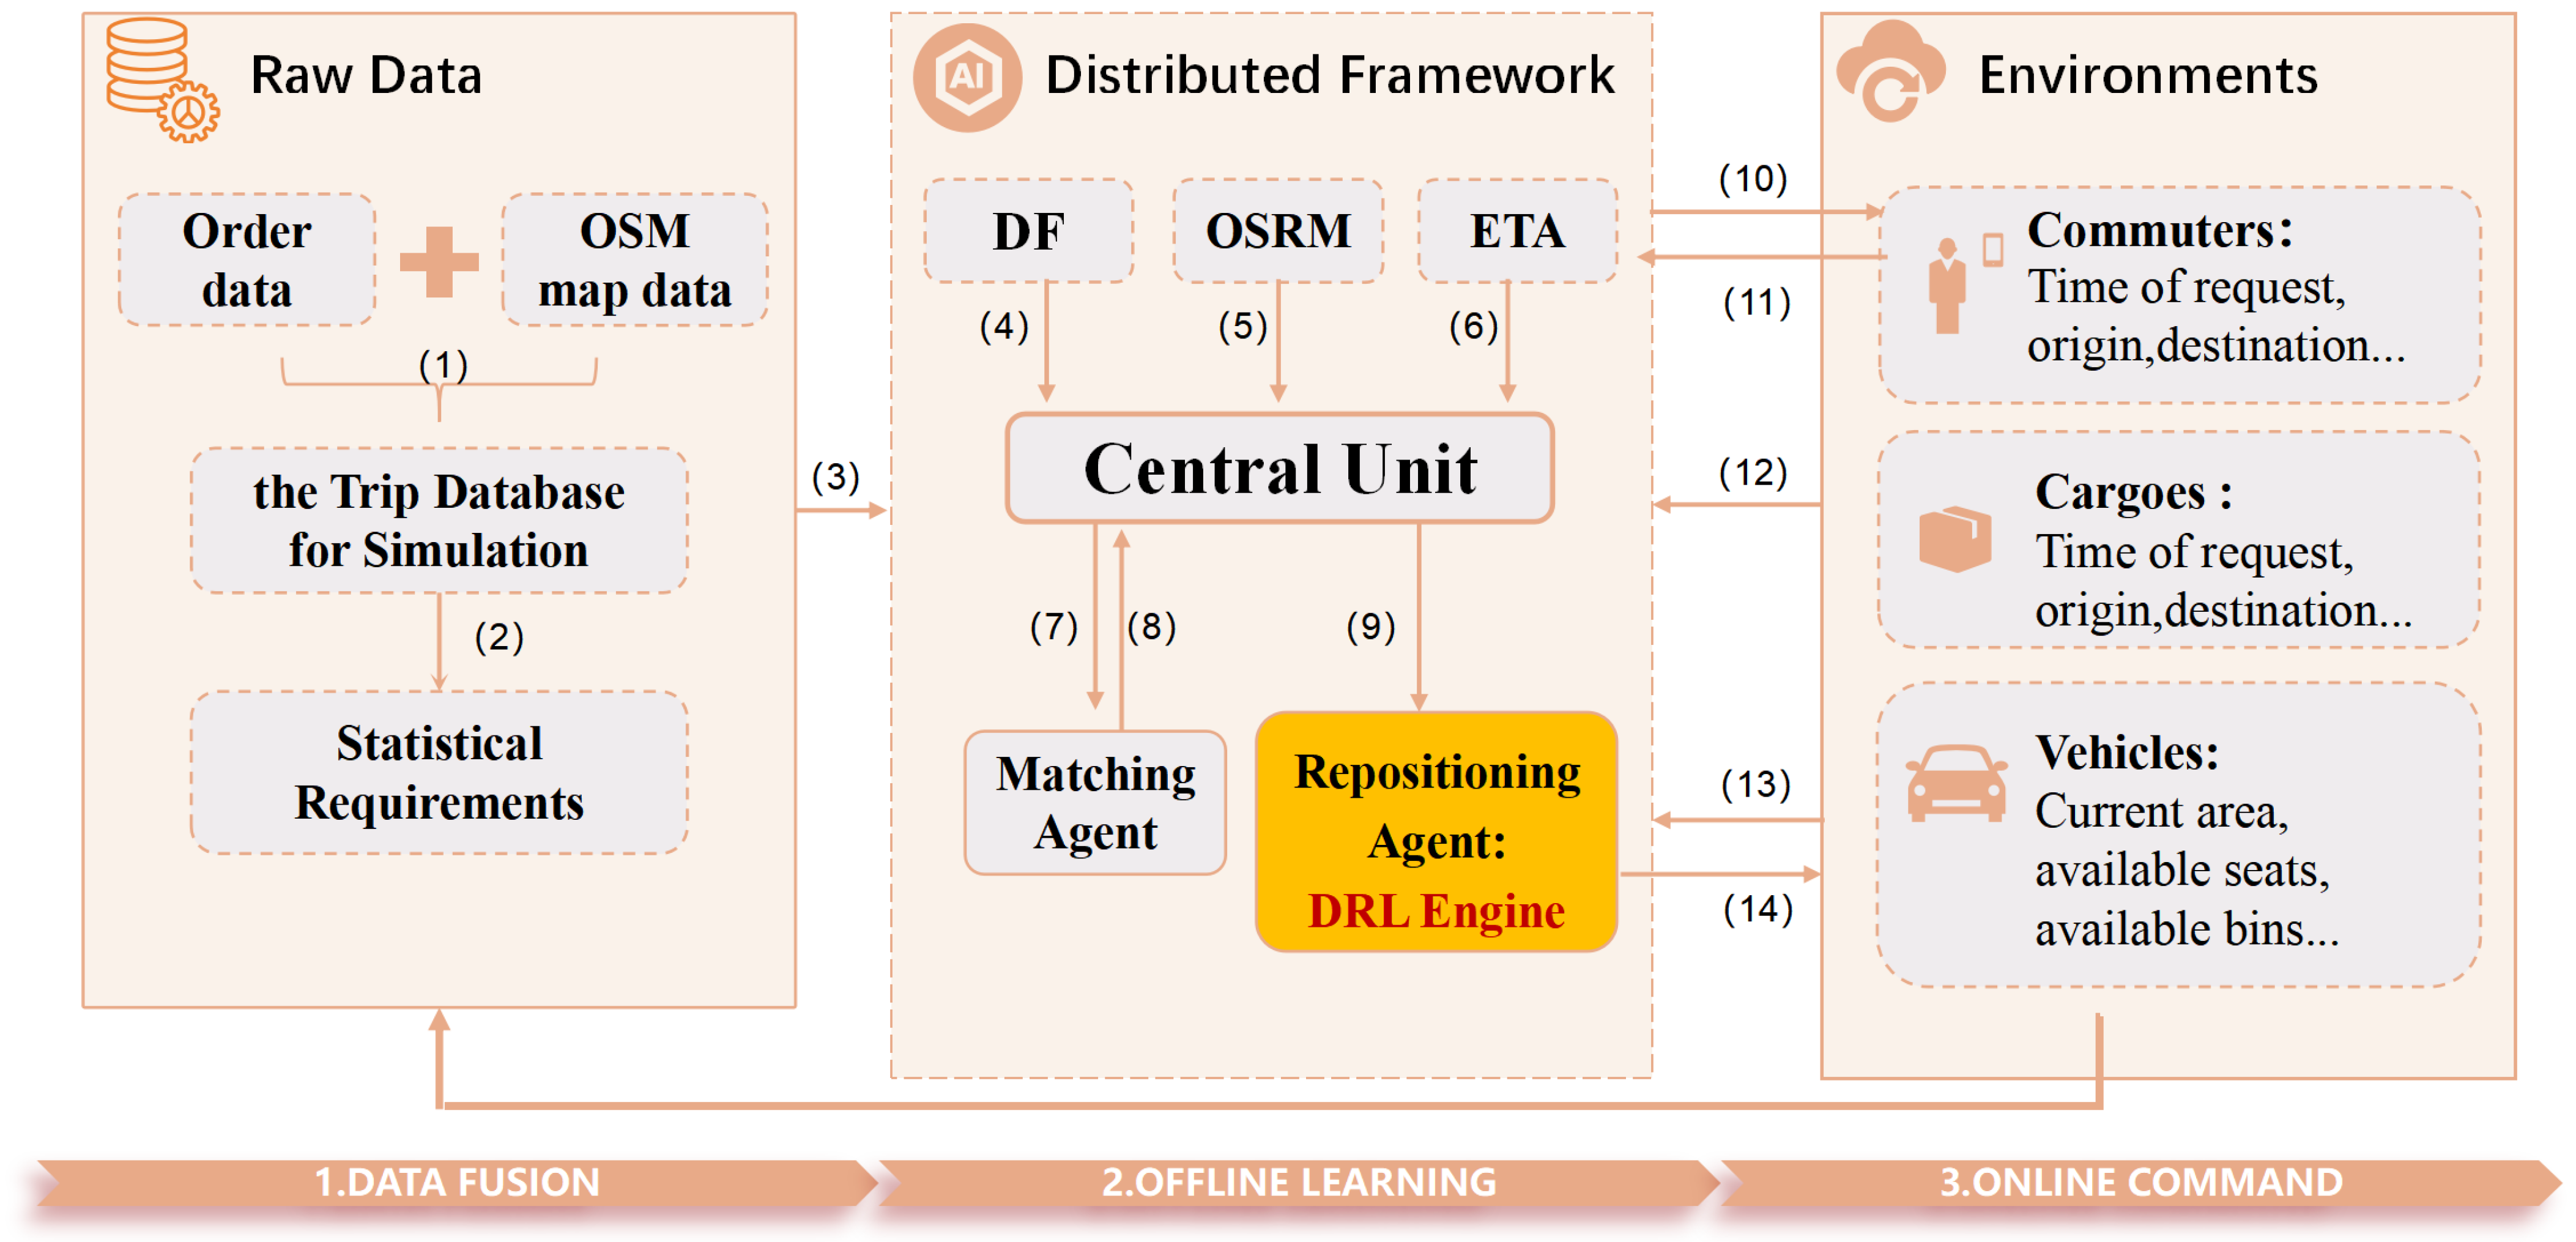
2.1.1. Model Architecture Diagram

Figure 1 illustrates the core components and interaction steps of the joint ride-hailing dispatch framework. The key workflow is explained as follows: (1) Trip Database Creation: preprocessed order data are captured using the Open Source Routing Machine (OSRM) engine to record all trip origins and destinations from OpenStreetMap (OSM), forming a simulation-ready trip database. (2) Precomputed Trip Data: travel times and trajectories are precalculated via the OSRM engine. (3) Data Distribution: the processed database from Steps 1–2 is distributed to all components of the decentralized framework. (4) Demand Forecasting: the Demand Forecasting (DF) model predicts future demand for each grid cell using historical data and feeds this to the central unit. (5) Routing Information Transfer: the OSRM engine transmits routing data to the central unit. (6) Travel Time Prediction: the Estimated Time of Arrival (ETA) model provides predicted travel times for all origin–destination pairs. (7) Vehicle Status Transmission: the central unit relays real-time vehicle statuses to the matching agent. (8) Matching Strategy Feedback: the matching agent returns optimized matching strategies to the central unit. (9) Environment Updates: the central unit shares environmental data (e.g., demand, supply) with the repositioning agent. (10) Client Notifications: the decentralized framework provides customers with matched vehicle details, including pricing, ETA, and estimated travel time. (11) Customer Decision: customers accept or reject the proposed matches. (12) Real-Time Demand Updates: customers submit real-time demand data to the central unit. (13) Vehicle Status Reporting: fleet vehicles periodically share their statuses (location, capacity) with the decentralized framework. (14) Repositioning Execution: the repositioning agent learns from interactions and generates dispatch actions, which are deployed to fleet vehicles.

2.1.2. Model Parameters and Symbols

To train and evaluate the ride-hailing dispatch framework, this study develops a reinforcement learning-based microscopic urban mobility simulator. The simulator comprehensively replicates the entire dispatch lifecycle, encompassing both demand–supply matching and vehicle repositioning phases. The operational environment is spatially discretized into non-overlapping 1 km2 grid cells, serving three primary objectives: (1) discretization of dispatch action spaces, (2) mitigation of state/action space dimensionality explosion, and (3) enhancement of engineering feasibility for large-scale urban transportation simulations. The symbols are defined as follows:
  • m { 1 , 2 , 3 , , M } : index of a grid cell.
  • n: number of vehicles.
  • t: time slot, with a total of τ time slots.
  • v t , i : number of deployable vehicles distributed across the geographical partition in zone i at time slot t.
  • τ : time step τ = t 0 , t 0 + Δ t , t 0 + 2 Δ t , , t 0 + T Δ t , where t 0 is the initial time, and idle vehicles execute dispatch decisions.
(1) Demand:
  • d t , m : number of pickup requests in zone m at time t.
Future pickup demand for each zone is predicted using historical trip distributions across zones [38], denoted as D t : τ = ( d t , , d t + τ ) , spanning from t 0 to t 0 + T Δ t .
(2) Vehicle State:  X t is used to denote the state of N vehicles at time slot t. Each x t , n tracks the state variables of vehicle n at time step t:
  • V loc : current location (grid cell).
  • V C : current capacity.
  • V T : type.
  • C max V : maximum capacity.
A vehicle is considered to be available if and only if at least one seat remains unoccupied: V C < C max V .
(3) Supply:
The supply of vehicles in each zone is forecasted for future times t ˜ at time slot t. Specifically, v t , i , m represents the number of vehicles that are currently unavailable for use at time slot t but expected to become available in zone m by time t ˜ . This information is derived from the ETA predictions of all vehicles. Consequently, the total vehicle supply in each zone from t to t + T is denoted as follows: V t : t + T , which serves as the predicted supply for each zone over T time steps.

2.2. Matching and Route Planning

The ride-sharing matching issue is a 3D Matching Problem. As proven in [39], this problem is NP-hard. In the 3DM context, given multiple requests with source and vehicle positions, it is necessary to assign requests to vehicles. However, the work in [39] restricts this assignment to sharing only two requests per vehicle via a 2.5-approximation method with optimal cost. In [40], a heuristic approach allowing three rides per vehicle is proposed. In our methodology, the matching objective is to maximize vehicle capacity utilization (subject to passenger and trunk capacity constraints). Beyond ride-sharing matching and post-matching route planning, our framework incorporates dynamic pricing and customer choice functionality. Specifically, customers can make personalized preference-based decisions (accepting or rejecting matches) based on real-time matching and pricing schemes. This feature enhances the framework’s alignment with real-world operational dynamics.

2.2.1. Initial Vehicle–Passenger and Vehicle–Parcel Allocation Stage

This phase parallelly integrates parcel transportation orders and passenger travel orders into the algorithmic framework. For each zone, future demand D t + τ includes both passenger and parcel transportation requests. Each vehicle is aware of the predicted demand D t + τ across all zones. The vehicle’s state vector X t captures its current location, the origin o i , and the destination d i of each service request r i . The request r i is assigned to the nearest vehicle that satisfies capacity constraints. There are three key definitions. (1) Capacity Constraints: the total number of requirements assigned to V j must never exceed its maximum capacity C max . The maximum capacity C max is the sum of the passenger capacity C max p a x ( t ) and the parcel capacity C max p a r c e l ( t ) . (2) Passenger Count: assume each request r i carries only one passenger, denoted as | r i | = 1 . (3) Capacity Update Rule: when vehicle V j arrives at location z, its remaining capacity V C [ z ] is dynamically updated as follows, in Equation (2):
C max = C max p a x + C max p a r c e l
V C [ z ] = V C [ z 1 ] | r i | if z = o i ( pickup ) , V C [ z 1 ] + | r i | if z = d i ( drop - off ) .
This ensures real-time capacity checks in O ( 1 ) time, maintaining computational efficiency while adhering to vehicle capacity limits.

2.2.2. Demand-Aware Route Planning Phase

By setting parameters, we enable shareable mobility services [41,42]. The existing literature demonstrates that for fundamental route planning problems, no optimal deterministic or randomized algorithm exists to maximize total revenue [41,43]. However, studies suggest that insertion-based methods are effective for greedily addressing shared mobility challenges. In [44], geographically proximate order requests are grouped without considering whether their destinations are in opposing directions—an issue largely resolved in our approach. Additionally, this work adopts a search-based strategy for dynamic ride-sharing scenarios involving joint passenger–parcel transportation. To mitigate the impact of increased travel distance on passenger experience, our insertion-based route planner enforces a maximum detour limit of 4 km per order.
To enhance route planning, we integrate the OSRM engine, an excellent routing tool that leverages OpenStreetMap (OSM) data to provide rapid and efficient path planning services. It utilizes optimized Dijkstra and A* algorithms and implements hierarchical graph-based methods such as Contraction Hierarchies [45] to accelerate path queries. The core functionalities of OSRM include shortest path computation, travel time estimation, and real-time route optimization. This integration ensures scalable and efficient route planning tailored to dynamic ride-sharing demands.

2.2.3. Distributed Pricing and Customer Choice

Given the differing sensitivities to time and capacity requirements (seats and trunk space) between passenger and parcel orders, many vehicle types with different capacities were analyzed in terms of mileage, per-mile pricing, per-minute waiting costs, and base fares. Initially, we computed the price for each passenger and parcel order request, taking into account the Total Trip Distance, defined as the distance from the vehicle’s current location to the pickup point o i , plus the distance from o i to the destination d i . This distance includes the edge weights that form the optimal route, determined through insertion operations. During the optimization process, the new cost is substituted into the equation to update the pricing. Based on the vehicle’s proposed price, customers can make decisions according to their preferences [46].
This research considers different preferences for both passenger and parcel orders, which are incorporated into their utility functions. The pricing for both types of orders is based on the following metrics:
  • Waiting Time Tolerance: The temporal flexibility of service requests is quantified by the maximum acceptable waiting time threshold T i for each trip i, where passenger trips typically demonstrate stricter time sensitivity compared to parcel orders.
  • Ride-sharing Preference: Whether the user is glad to share rides or prefers solo rides, even if it means higher prices. Parcel orders are uniformly set to be willing to share rides (with passenger orders). This is captured by the current capacity V C of vehicle j.
  • Vehicle Type Preference: Whether the customer is willing to pay more under the same condition. The type of vehicle j is denoted by V T .
Based on these factors, the utility function for user i is defined as follows:
U i = ω 1 · 1 V C + ω 2 · 1 T i + ω 3 · V T j
in which ω 1 , ω 2 , and ω 3 represent weights associated with every factor influencing the customer’s overall utility. To introduce additional flexibility, we define δ i as the customer’s compromise threshold when receiving P ( r i ) . The customer’s decision regarding the offer, denoted as C d i , is given by the following:
C d i = 1 if U i > P ( r i ) δ i , 0 otherwise

2.3. Distributed DQN Repositioning and Dispatch Method

The DQN was chosen over alternative deep reinforcement learning methods (e.g., DDPG, TD3) due to its inherent compatibility with discrete action spaces and distributed computation:
  • Discrete Action Optimization: Our dispatch action space comprises 225 discrete grid cells (15 × 15).
  • Q-Value Maximization: The DQN’s Q-value maximization directly maps to this setting, whereas actor–critic methods like DDPG require continuous action approximations that introduce instability.
  • Training Stability: The DQN’s experience replay buffer and target network mechanism mitigate policy oscillation in multi-agent environments, ensuring convergence in distributed fleet management.
The distributed DQN dispatch strategy rebalances idle vehicles to the places with anticipated high requirements and profitability, enabling better demand fulfillment and profit maximization. We model the probabilistic dependencies in vehicle behavior and reward functions to optimize the target function. Idle vehicles are dispatched either upon entering the market or after experiencing prolonged idle times during the simulation. At each time step t, the agent analyzes the environmental state s t , n and uses the trained DQN to predict future rewards. According to the reward information, the agent takes actions to guide vehicles to various zones, maximizing the expected reward, s u m j = 1 η j 1 r j ( a i , s i ) , where η is the time discount factor. The overall framework is illustrated in pseudocode, with lines 6–8 detailing how the trained Q-network infers the optimal action for a given vehicle from state s t , n . The reward r t reflects the DQN agent’s objectives. Decision variables include the following: (1) dispatching available vehicles in zone m at time t to another zone and (2) determining the availability of vehicle v to serve new customers at time t if it is not fully occupied. Rewards are learned from the individual vehicle’s environment and used to improve the decisions, ensuring that the system objectives of the distributed transportation network are met.
  • State Space: State variables reflect the environmental state, influencing the reward feedback for agent actions. We combine all the environmental data explained in Section 2.1.2:
    • X t : tracks vehicle states, including current zone, available seats and trunk capacity, pickup time, and destination zones for each order.
    • V t : t + T : predicts the supply of vehicles in each zone over the next T time steps.
    • D t : t + T : predicts demand over the next T time steps.
The state space at time t is captured as a vector s t = ( X t , V t : t + T , D t : t + T ) . During vehicle request assignments, the simulator engine updates the state space tuples using expected pickup times. The triplet state variable s t is passed to the optimal action to take.
  • Action:  a t , n represents the action taken by vehicle n. Each vehicle can move up to 7 grid cells, allowing it to reach any of the 14 vertical (7 up and 7 down) and 14 horizontal (7 left and 7 right) grid cells. After the DQN determines the target grid cell, the vehicle follows the shortest route to reach the next stop.
  • Reward: Equation (5) is a weighted sum of the following components:
    • C t , n : Number of users served by vehicle n at time t.
    • T t , n D : Time taken by vehicle n to travel to zone m or detour to pick up additional requests at time t. This term prevents the agent from accepting delays for onboard passengers.
    • T t , n E : Total additional time required for vehicle n to serve extra passengers at time t.
    • P t , n : Profit earned by vehicle n at time t.
    • m a x ( e t , n e t 1 , n , 0 ) : This term is used to treat the objective of active vehicles at time t to enhance fleet utilization.
The reward function is formalized as follows:
r t , n = β 1 C t , n + β 2 T t , n D + β 3 T t , n E + β 4 P t , n + β 5 max ( e t , n e t 1 , n , 0 )
The number of active vehicles is minimized at time step t; it may be beneficial to utilize idle vehicles if the travel time for passengers increases, rather than subjecting existing passengers to significant unexpected delays. The pseudocode of DQN is shown in Algorithm 1. While DQN is intended to serve as a tool for dispatching idle vehicles, it incorporates valuable signals related to demand, which are utilized in our framework. The inclusion of the profit term in the reward function ensures that the Q-values associated with each movement on map serve as a reliable indicator of the anticipated revenue from traveling to those locations. This enables each vehicle (and driver) in the fleet to understand the distribution across the city, which is crucial for making informed decisions and planning proper routes.
Algorithm 1 Dispatching via DQN.
Require: 
X t , V t : t + T , D t : t + T
Ensure: 
Dispatch Decisions
  1:
Initialize an empty list for dispatch decisions: dispatch_list 
  2:
Fetch all idle vehicles: V idle { V j V j is idle }
  3:
for each vehicle V j V idle  do
  4:
      State vector: s ( t , n ) = ( X t , V t : t + T , D t : t + T )
  5:
      Push it to the Deep Q-Network (DQN)
  6:
      Compute the best action: a ( t , j ) = arg max [ Q ( s ( t , n ) , a , θ ) ]
  7:
      Determine the zone based on action: Z ( t , j ) Get Destination ( a ( t , j ) )
  8:
      Update dispatch decisions: dispatch_listdispatch_list { ( j , Z ( t , j ) ) }
  9:
      Optionally, log the decision for debugging: Log( V j , Z ( t , j ) , a ( t , j ) )
 10:
end for
 11:
return Dispatch Locations: dispatch_list
The DQN architecture consists of three fully connected layers:
  • Input Layer: dimension equals the concatenated state vector s t = ( X t , V t + T , D t + T ) , where X t includes vehicle location, capacity, and order destinations.
  • Hidden Layers: two layers with 256 and 128 nodes, respectively, activated by ReLU.
  • Output Layer: 225 nodes (15 × 15 grid action space).
Training Protocol:
  • Experience replay buffer stores 50,000 transitions for mini-batch sampling (batch size = 64).
  • Adam optimizer with a learning rate of 0.001 and a discount factor of η = 0.99 .
  • ϵ -greedy exploration: initial ϵ = 1.0 decays linearly to 0.1 over 10,000 steps.
Hyperparameters:
Reward weights ( β 1 β 5 ) were tuned via grid search on a validation set, balancing profit maximization and service quality. Final values: β 1 = 10 , β 2 = 1 , β 3 = 5 , β 4 = 12 , and β 5 = 8 .

3. Results

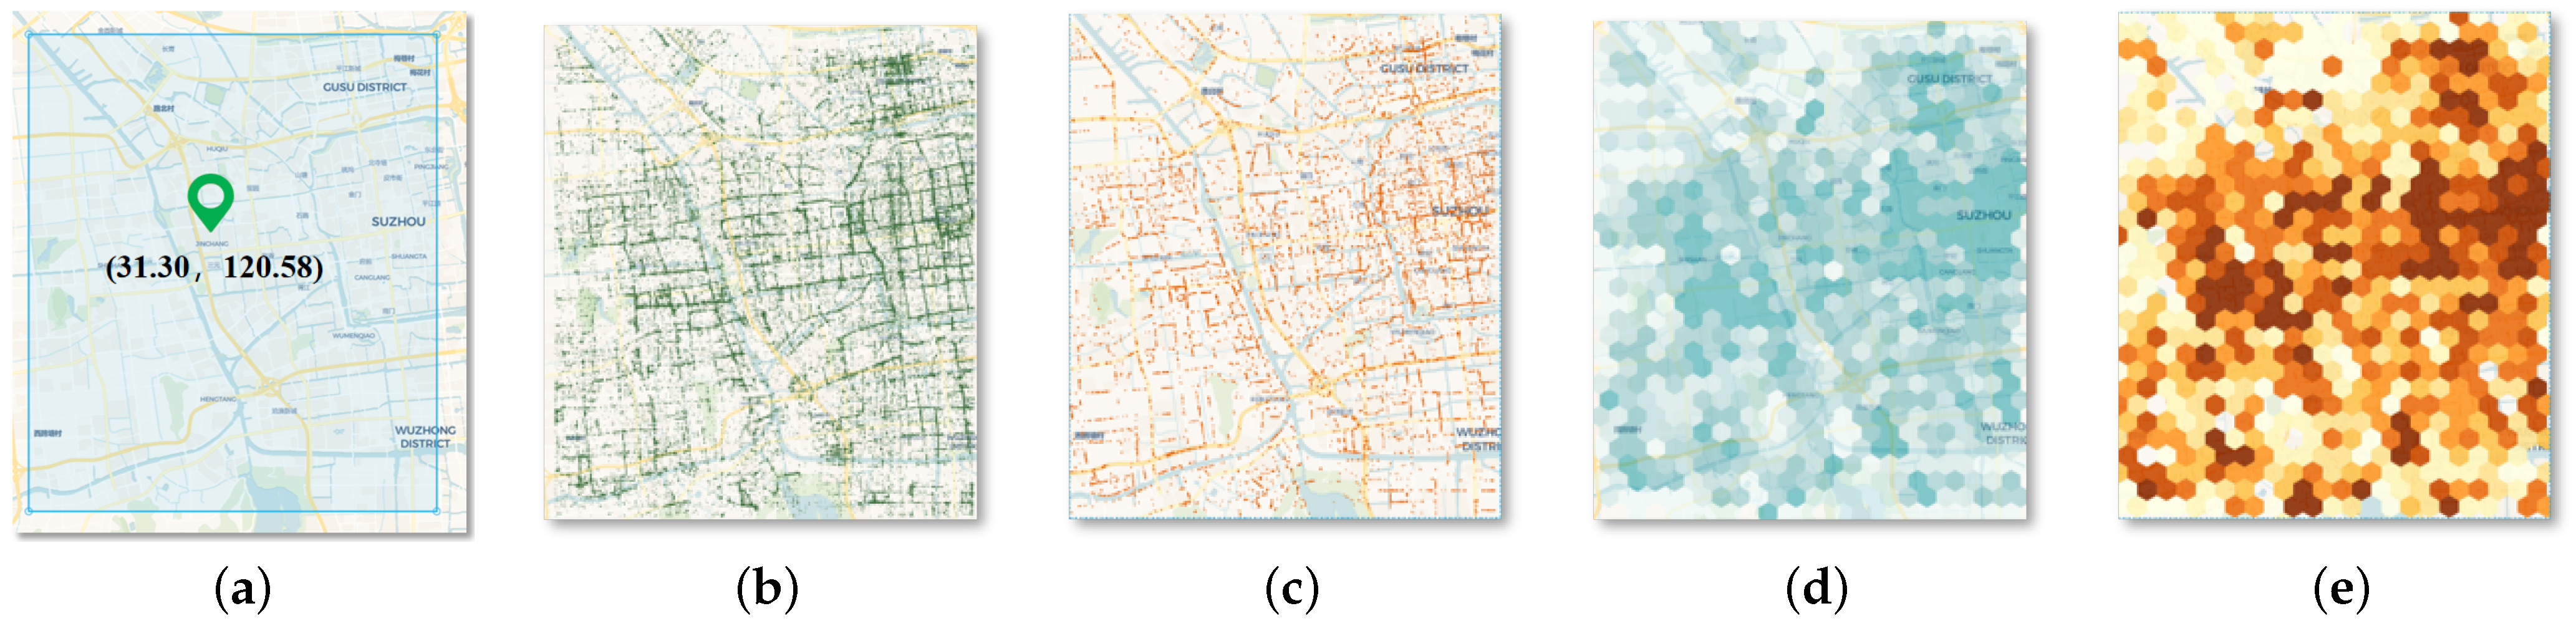
3.1. Simulator Setup

The operational area is defined as an 11 × 11 km2 region in downtown Suzhou, divided into non-overlapping 1 km2 grid cells to discretize dispatch actions. We utilized the road network of downtown Suzhou and a real-world public taxi dataset. For parcel data, we integrated virtual order data from small-scale logistics services such as food delivery and express delivery. The simulation process begins by populating the city with vehicles, assigning each vehicle a random initial location. The fleet size is initialized to 1000 vehicles, with vehicles incrementally deployed into the market. A rejection radius threshold is defined for customer requests. The learning agent acts as a ride-sharing tool aimed at maximizing its reward. We employed the Kepler visualization tool integrated with the OSRM engine to display ride-hailing order data, highlighting key factors such as travel patterns, time distributions, and route planning [45]. The visualization of total order data within the study area is shown in Figure 2. Figure 2a depicts an 11 × 11 km2 rectangular study area in downtown Suzhou, discretized into non-overlapping 1 km2 grid cells for dispatch action optimization. Figure 2b,c illustrate the spatial distribution of passenger and parcel order demands, respectively, with high-density clusters concentrated in commercial hubs and transportation junctions. Figure 2d,e employ hexagon-based heatmaps to quantify demand intensity, where darker hues indicate higher order density per unit area, revealing the spatiotemporal heterogeneity of urban mobility demands.

3.2. DQN Training and Testing

The training process utilized an urban traffic simulation environment fed with real-world mobility data from Suzhou, China. The dataset comprises the following:
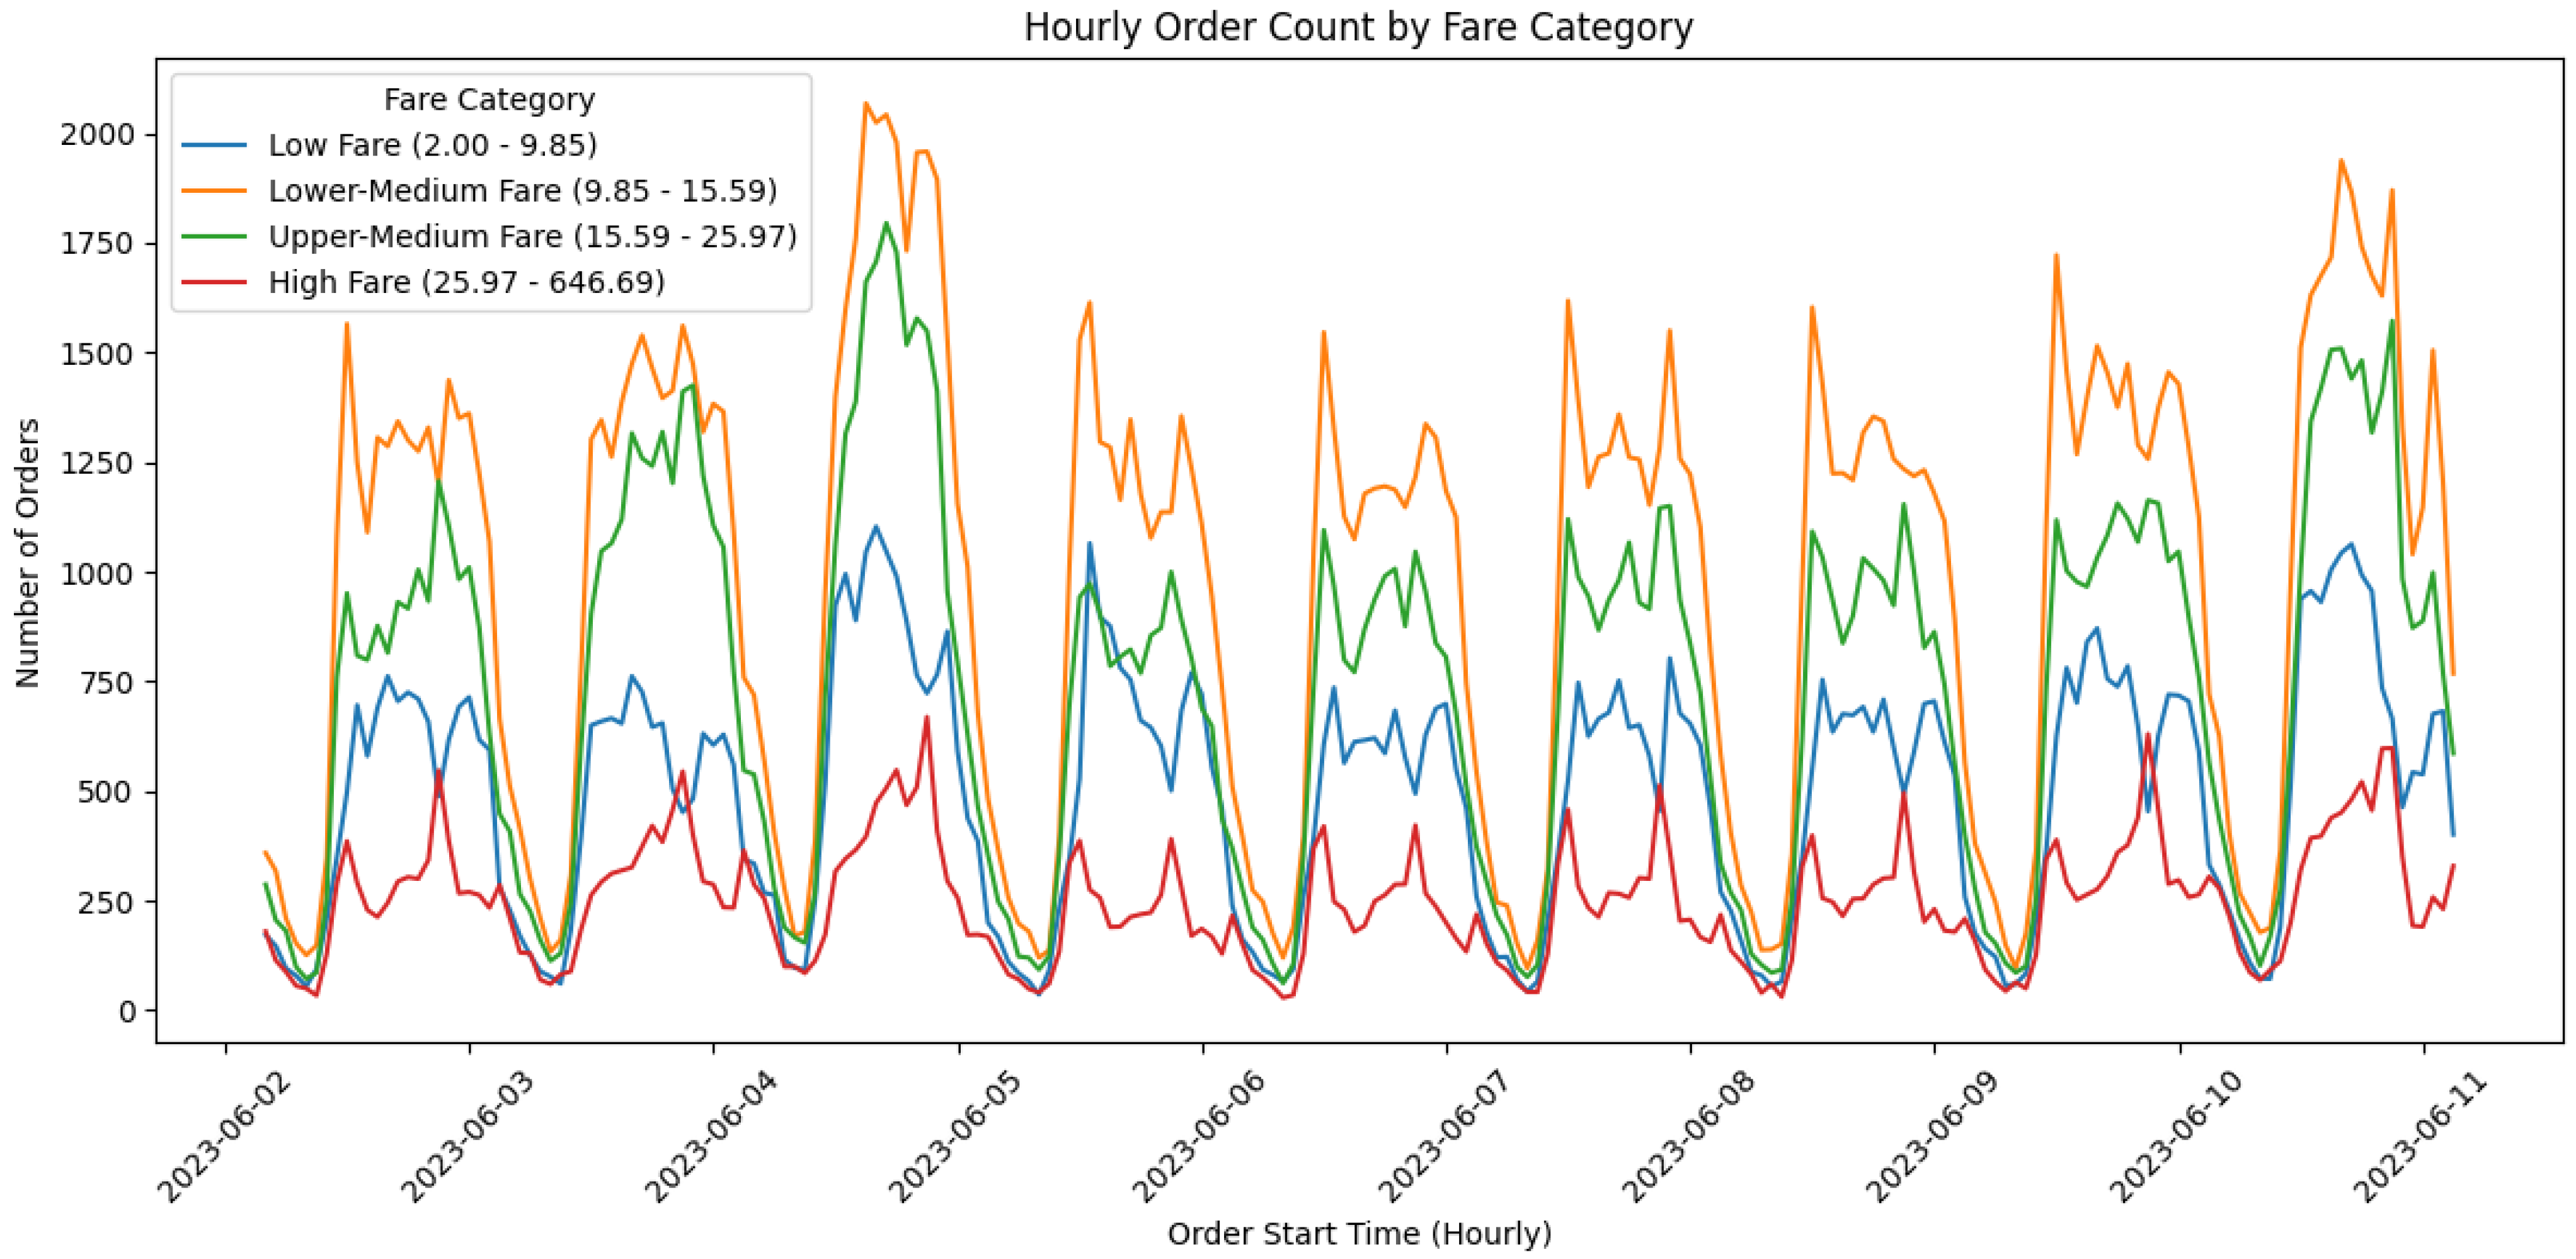
  • Passenger orders: 1 million anonymized ride-hailing records obtained from a proprietary industry dataset covering 1–24 June 2023, representing authentic urban travel patterns. Figure 3 depicts the temporal distribution of hourly order counts across four fare categories: Low Fare (≤CNY 9.85), Lower-Medium Fare (CNY 9.85–15.59), Upper-Medium Fare (CNY 15.59–25.97), and High Fare (≥CNY 25.97). To mitigate the overfitting risks from short-distance high-frequency patterns in Low Fare orders (9.2% of total data) and the model bias caused by sparse long-tail distributions in High Fare orders (7.1%), this study employs the K-S test ( D = 0.12 , p = 0.854 ) to select Lower-Medium and Upper-Medium fare orders (collectively 83.7%) as the training set, ensuring distributional stability. The temporal regularity of these two dominant categories encapsulates the principal modes of urban mobility demand, thereby eliminating the influence of outliers on the generalizability of deep reinforcement learning policies.
  • Parcel orders: 500,000 synthetically generated delivery requests spatially and temporally aligned with passenger demand distributions, designed to validate multimodal coordination feasibility under data scarcity scenarios.
Each experiment used the most recent 5000 data points for experience replay. Key parameter settings included the following: T = 8 × 24 × 60 time steps, where t = 1 min. Maximum daily working time per vehicle: 16 h (vehicles are forced offline upon reaching this limit). To reflect real-world ride rejection behavior, the utility function threshold δ i was calibrated to yield a 20% rejection rate for shared rides, aligning with field observations from urban mobility platforms. Reward weights: β 1 = 10 , β 2 = 1 , β 3 = 5 , β 4 = 12 , β 5 = 8 , λ = 10 % , ω 1 = 15 , ω 2 = 1 , and ω 3 = 4 . Framework implementation: Python 3.7 and TensorFlow 1.15.

3.3. Performance Metrics Comparison

3.3.1. Performance Metrics Definition
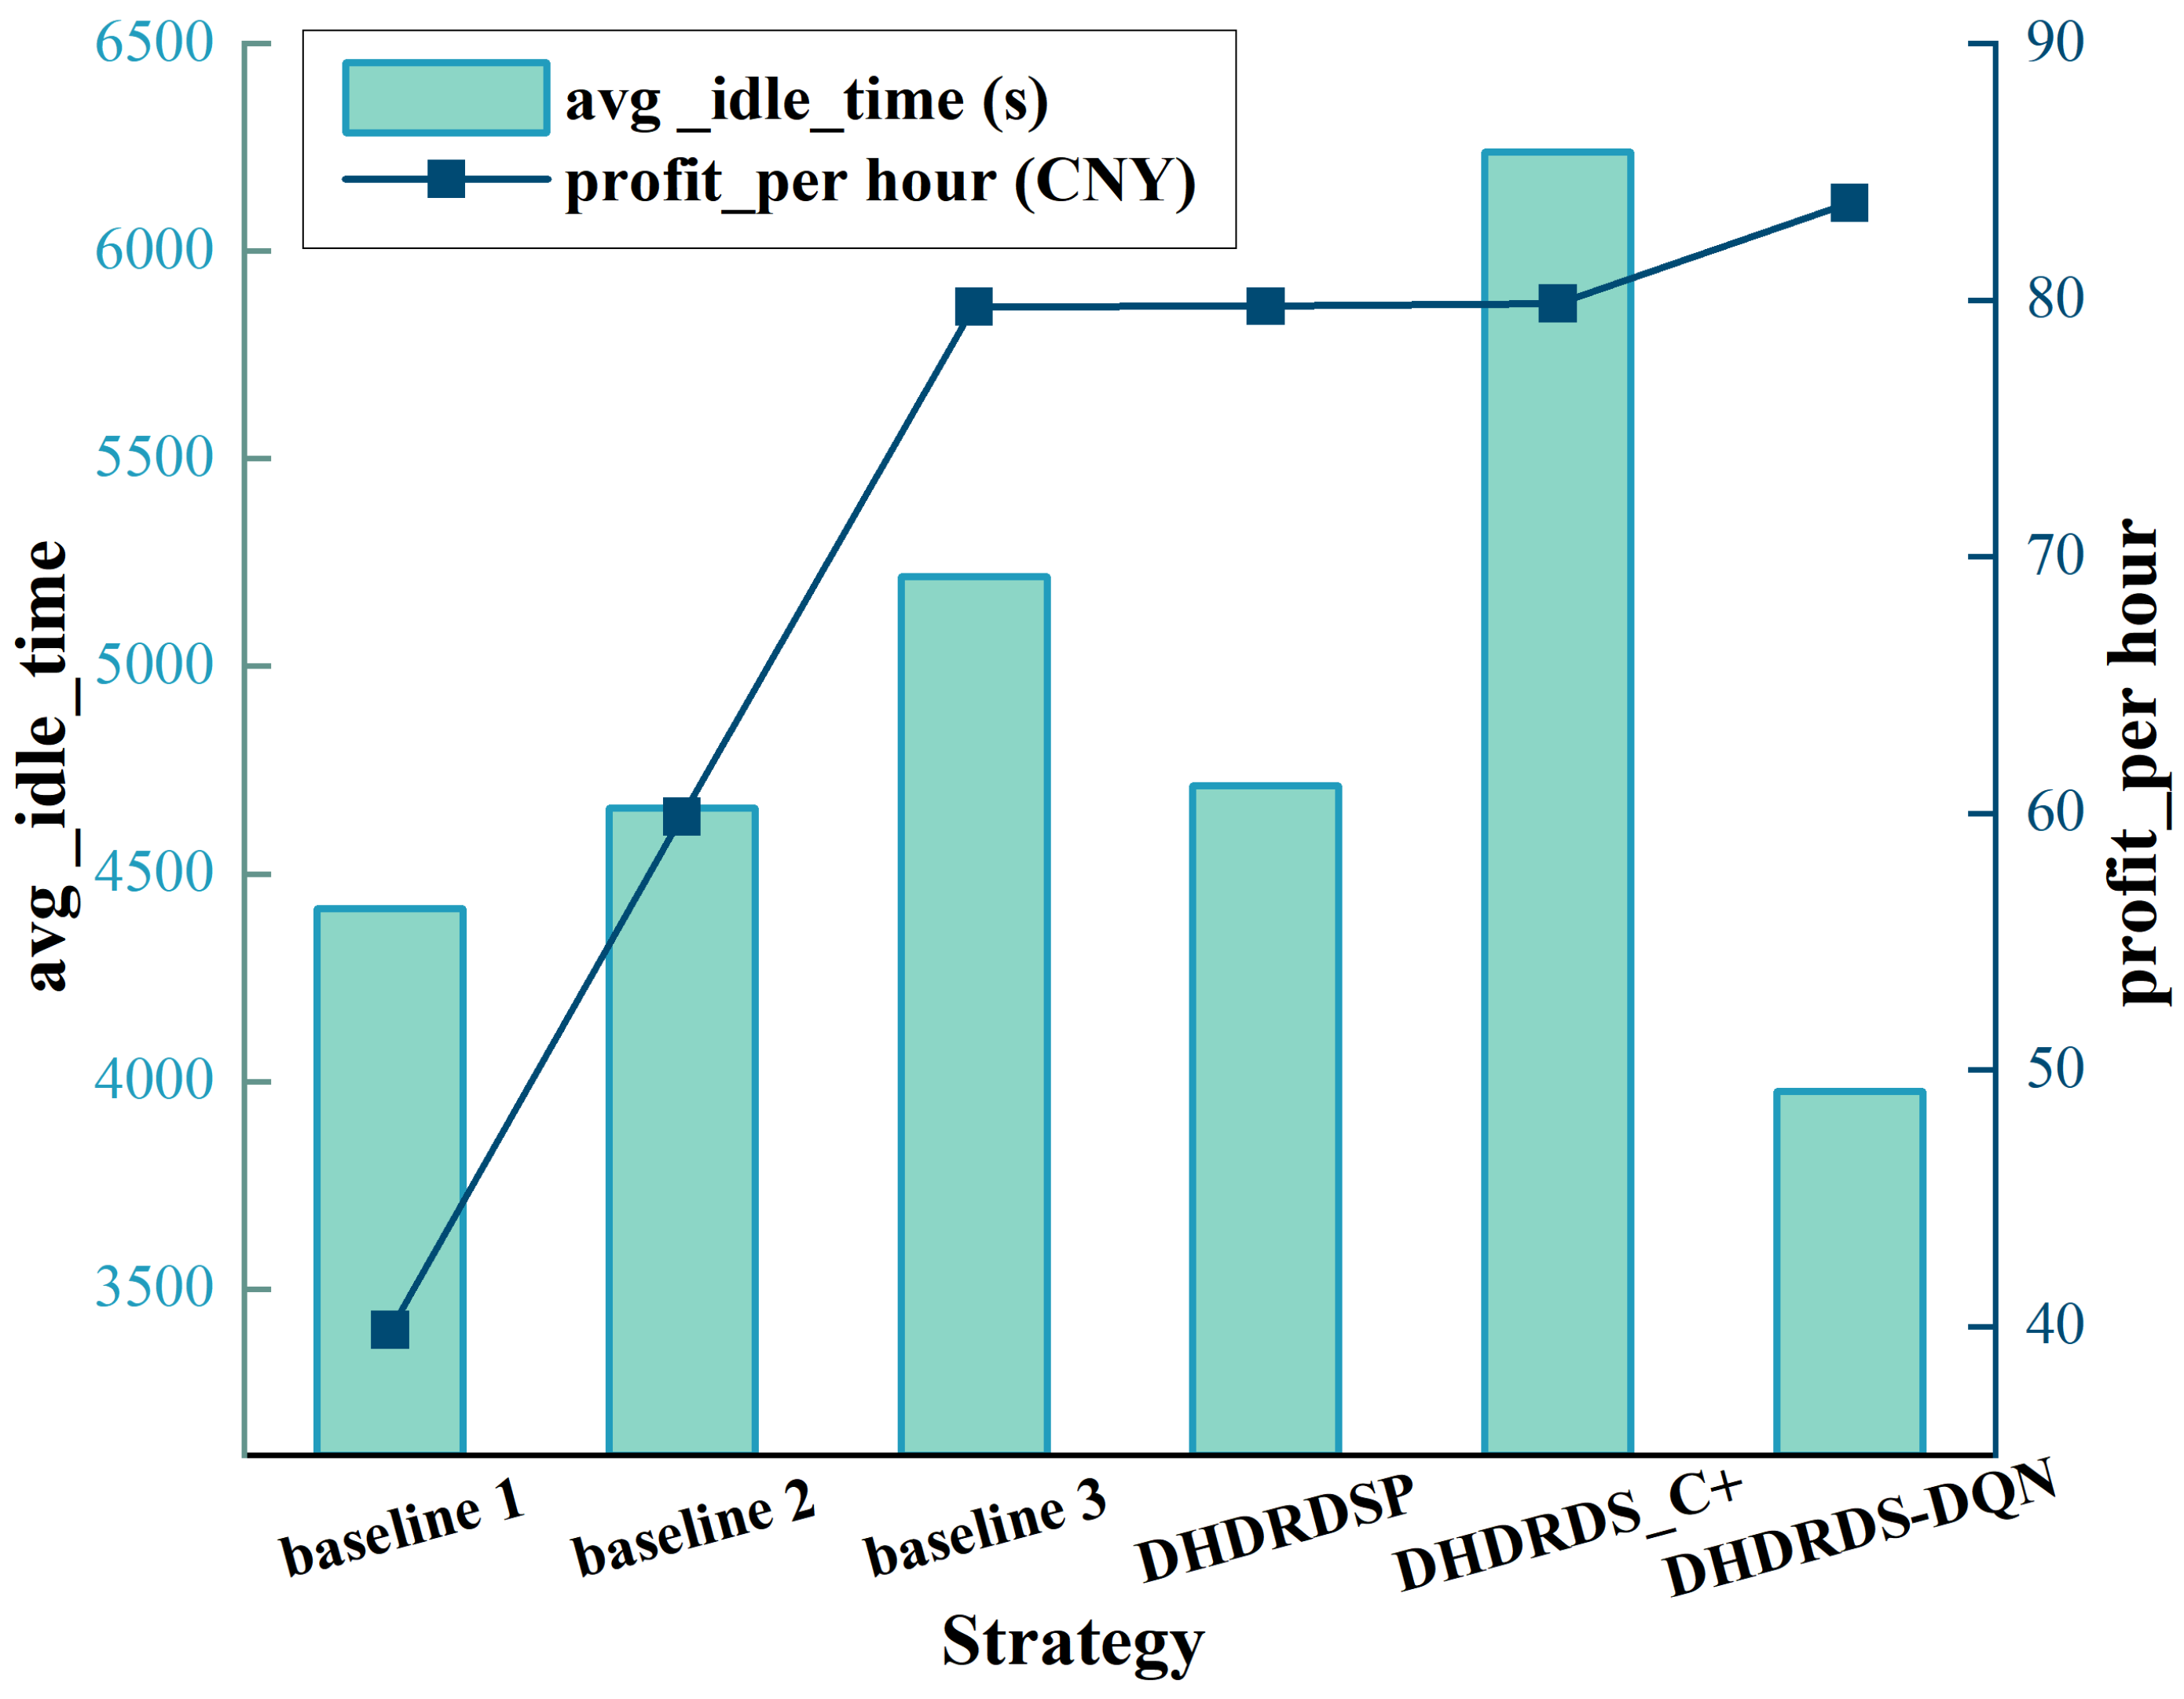
To systematically evaluate algorithm performance, this study conducts a multi-dimensional comparative analysis based on the quantitative metrics listed in Table 1, defined as follows:
Average Capacity (avg_cap): The average number of orders carried by a vehicle per unit time, reflecting resource utilization efficiency.
Average Idle Time (avg_idle_time): The time (in seconds) during which a vehicle remains unoccupied and inactive, measuring the cost of idle resources.
Travel Distance per Order (per_mileage): The average travel distance (in kilometers) required to fulfill a single order, indicating routing efficiency and service cost per request.
Profit per Hour (profit_per_hour): Net driver earnings (in CNY) after deducting fuel and other operational costs, indicating economic benefits.
Crusing Time: Calculated as the total time vehicles spend fulfilling orders divided by fleet size, measured in hours per day. Higher values indicate efficient demand fulfillment but may imply overloading risks if exceeding vehicle working hour limits (16 h/day).
Waiting Time: The interval in passenger order request and vehicle arrival at the pickup location, averaged across all served passenger orders. A critical metric for customer satisfaction, with stricter thresholds (8 min) enforced in passenger-centric services compared to parcel logistics.
Travel Distance: Total kilometers traveled by vehicles per hour, computed as the sum of distances from pickup to drop-off locations divided by active vehicle hours. Reflects routing optimization effectiveness and environmental impact (fuel consumption and emissions).
Table 1. Comparison of vehicle performance metrics across different strategies.
Strategyavg_capavg_idle_timeper_mileageprofit_per_hour
MeanStdMean (s)StdMean (km)StdMean ($)Std
Baseline 12.090.4494416.832971.5744.631.48239.891.679
Baseline 21.790.4374658.853174.4043.695.46359.8819.925
Baseline 32.230.4605215.913239.3362.810.39279.751.098
DHDRDS_P2.180.3834713.103222.4043.860.34979.771.173
DHDRDS_C+1.910.5166239.823271.2854.551.49779.872.207
DHDRDS-DQN1.530.4113976.051635.5334.743.43783.8017.855

3.3.2. Principle Comparison of DHDRDS with Related Baselines

We compared our proposed framework (including dispatch, passenger, and parcel ride-sharing) with the following baselines:
  • Baseline 1 (Greedy Matching without Repositioning or Ride-sharing) employs an immediate greedy matching strategy where each vehicle serves only one order request without repositioning. Matching is based on the shortest pickup distance, ignoring long-term demand prediction and global resource optimization. This approach leads to high idle rates and low profitability.
  • Baseline 2 (Greedy Matching with Repositioning [47]) introduces a repositioning strategy where idle vehicles migrate to historically high-demand zones. Demand distribution is updated periodically (every 15 min) to calculate marginal relocation benefits, but ride-sharing is disabled. Despite reducing spatial mismatches, this method lacks real-time adaptability and multi-order optimization capabilities.
  • Baseline 3 (Greedy Matching with Repositioning and Passenger Ride-sharing [48]) enhances Baseline 2 by dynamically merging passenger orders through insertion-based route planning, subject to the constraints of maximum waiting time (10 min) and detour distance limits (2 km). While improving vehicle utilization, its static pricing and exclusion of parcel coordination limit adaptability to dynamic market fluctuations.
The proposed DHDRDS framework integrates insertion-based route planning with dynamic pricing strategies, enabling bidirectional decision-making participation from both customers and drivers. Three DHDRDS variants are evaluated:
  • DHDRDS_P (passenger-only): focuses on optimizing passenger ride-sharing without parcel coordination.
  • DHDRDS_C+ (parcel-enhanced): extends passenger optimization to include parcel transportation with basic routing adjustments.
  • DHDRDSDQN (parcel + DRL): incorporates deep reinforcement learning for real-time parcel–passenger demand balancing.
To ensure a fair comparison, all baseline methods were implemented under identical environmental configurations, including vehicle capacity, road network granularity (1 km2 grids), and time step resolution (1 min). The specific parameterizations are as follows:
Baseline 1: Greedy matching selects the nearest available vehicle within a 5 km radius for single-order assignments, without dynamic pricing or repositioning.
Baseline 2: Idle vehicles are repositioned to historically high-demand zones every 15 min, with demand prediction updated via a 1 h sliding window.
Baseline 3: Ride-sharing allows merging up to three passenger orders, constrained by a maximum waiting time of 10 min and detour distance limit of 2 km. Pricing follows fixed per-mile and per-minute rates. These settings align with prior works and ensure computational parity with DHDRDS.

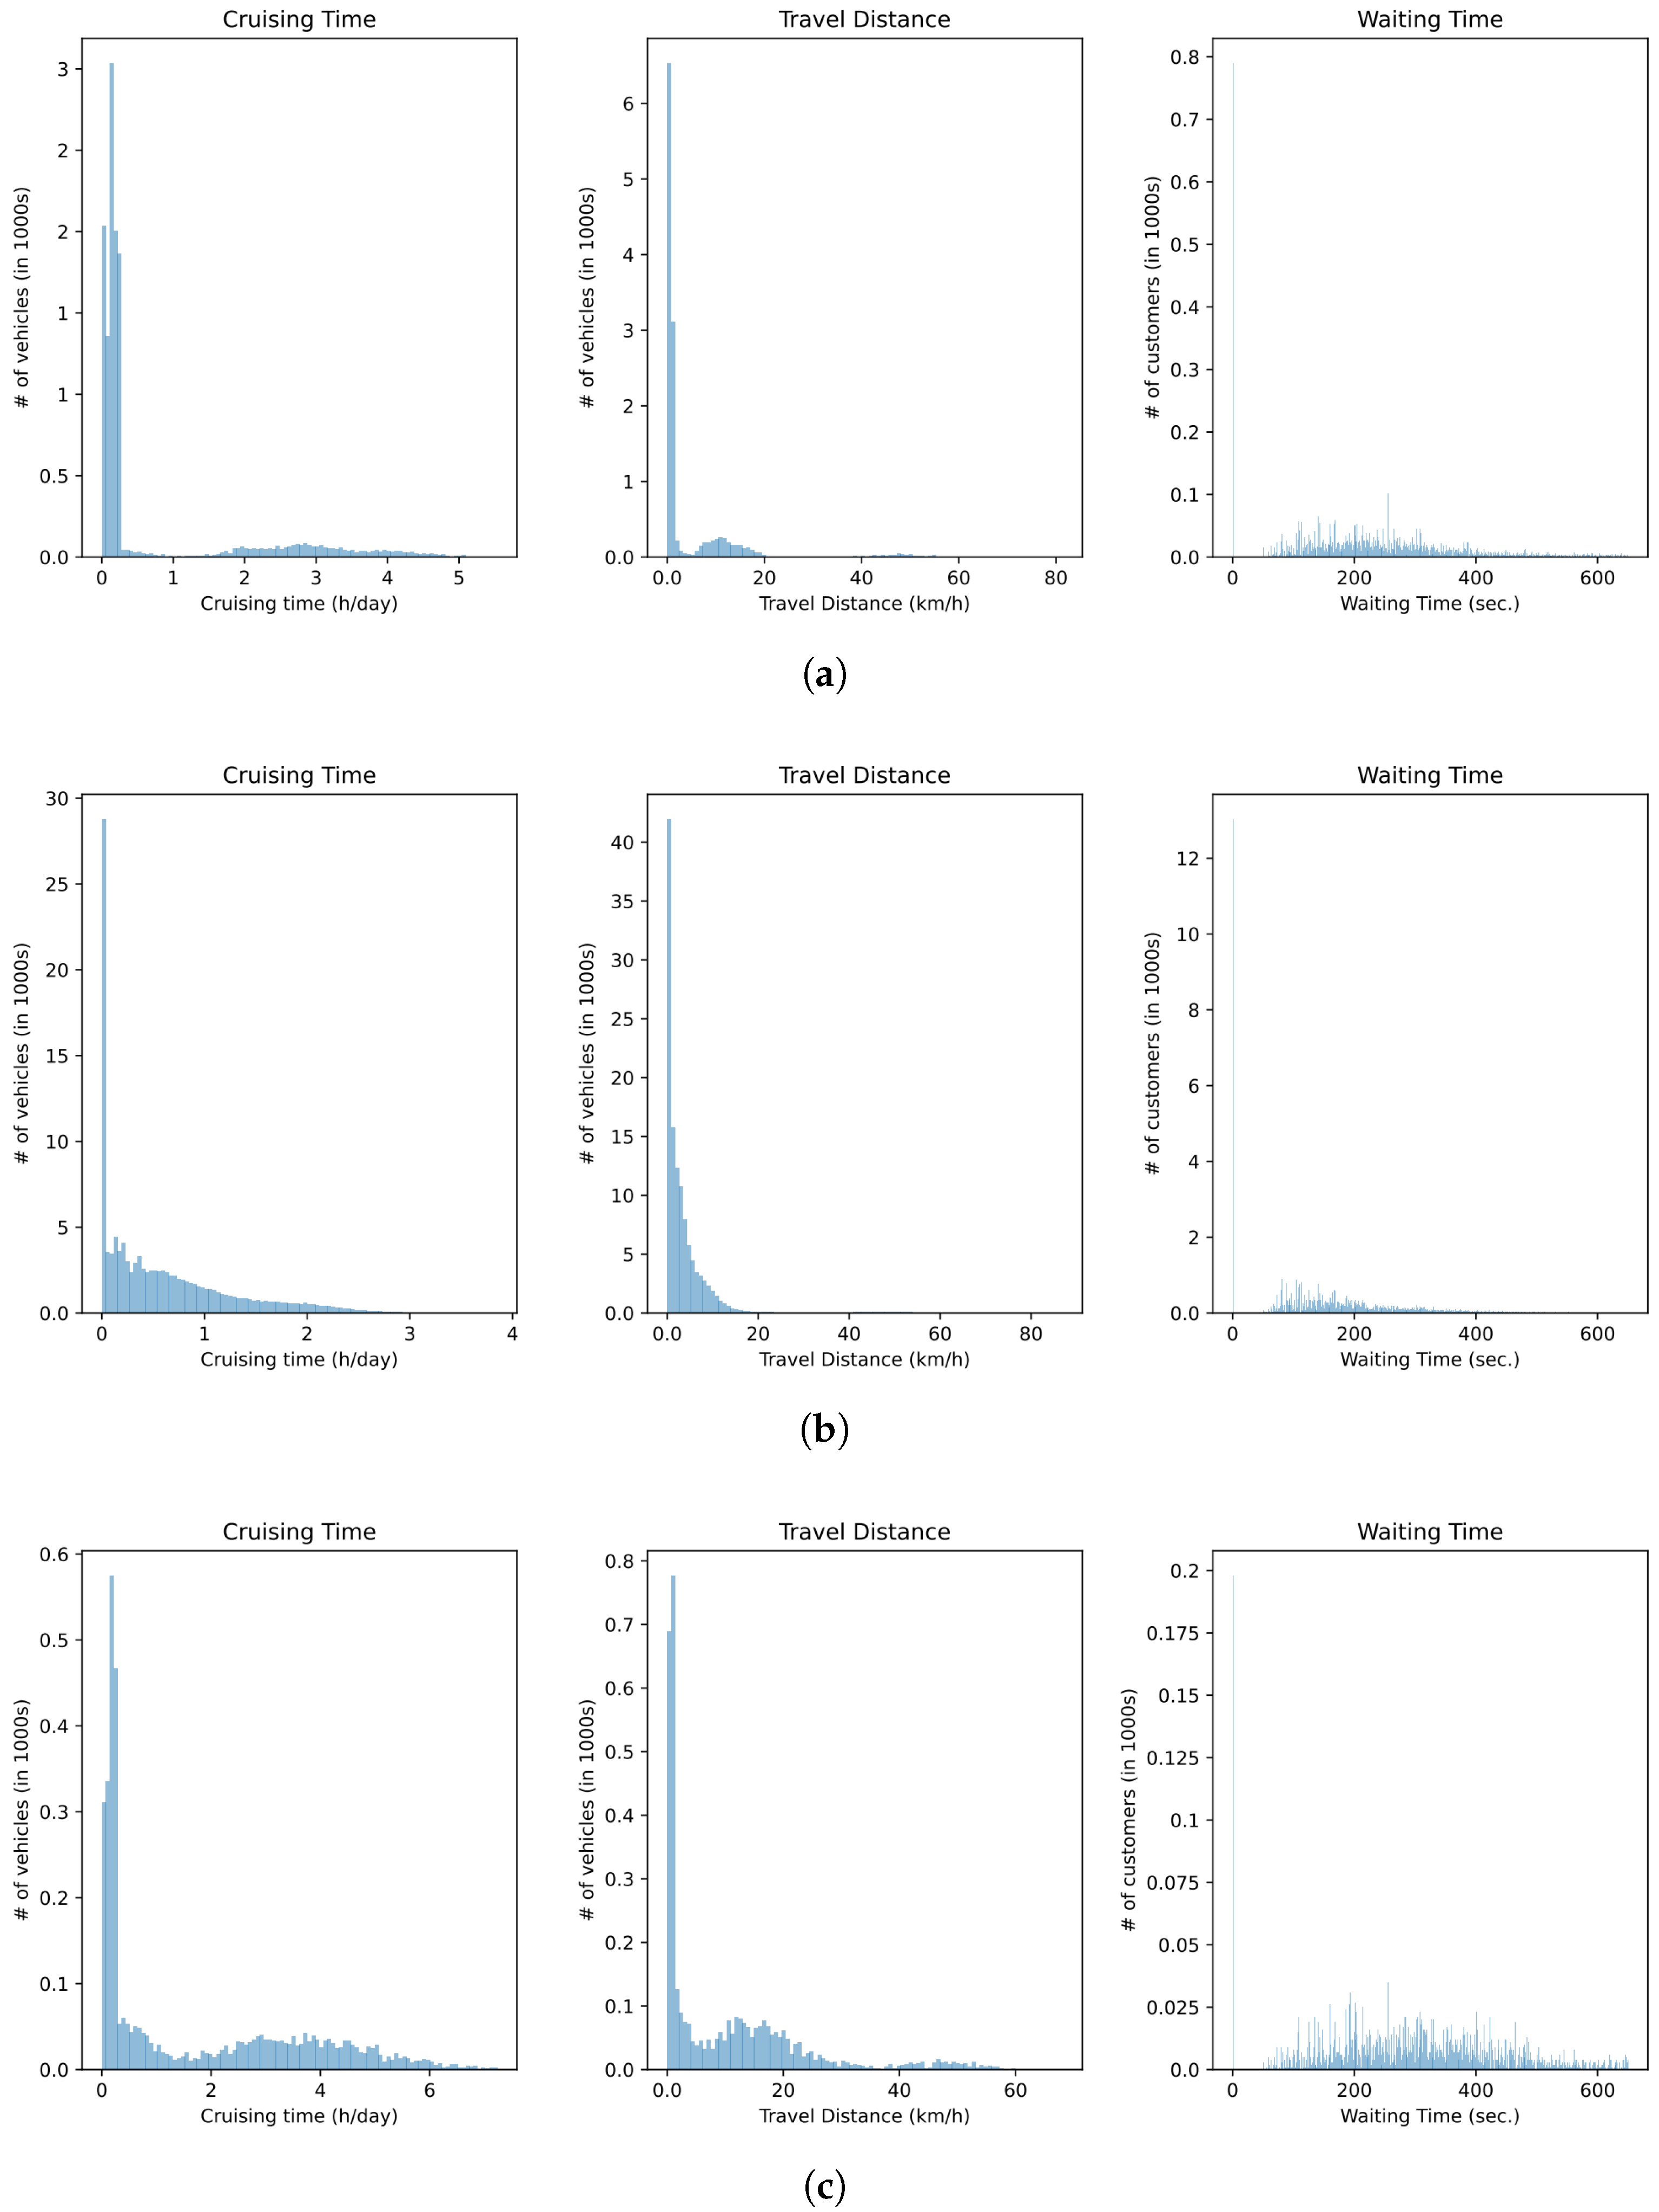
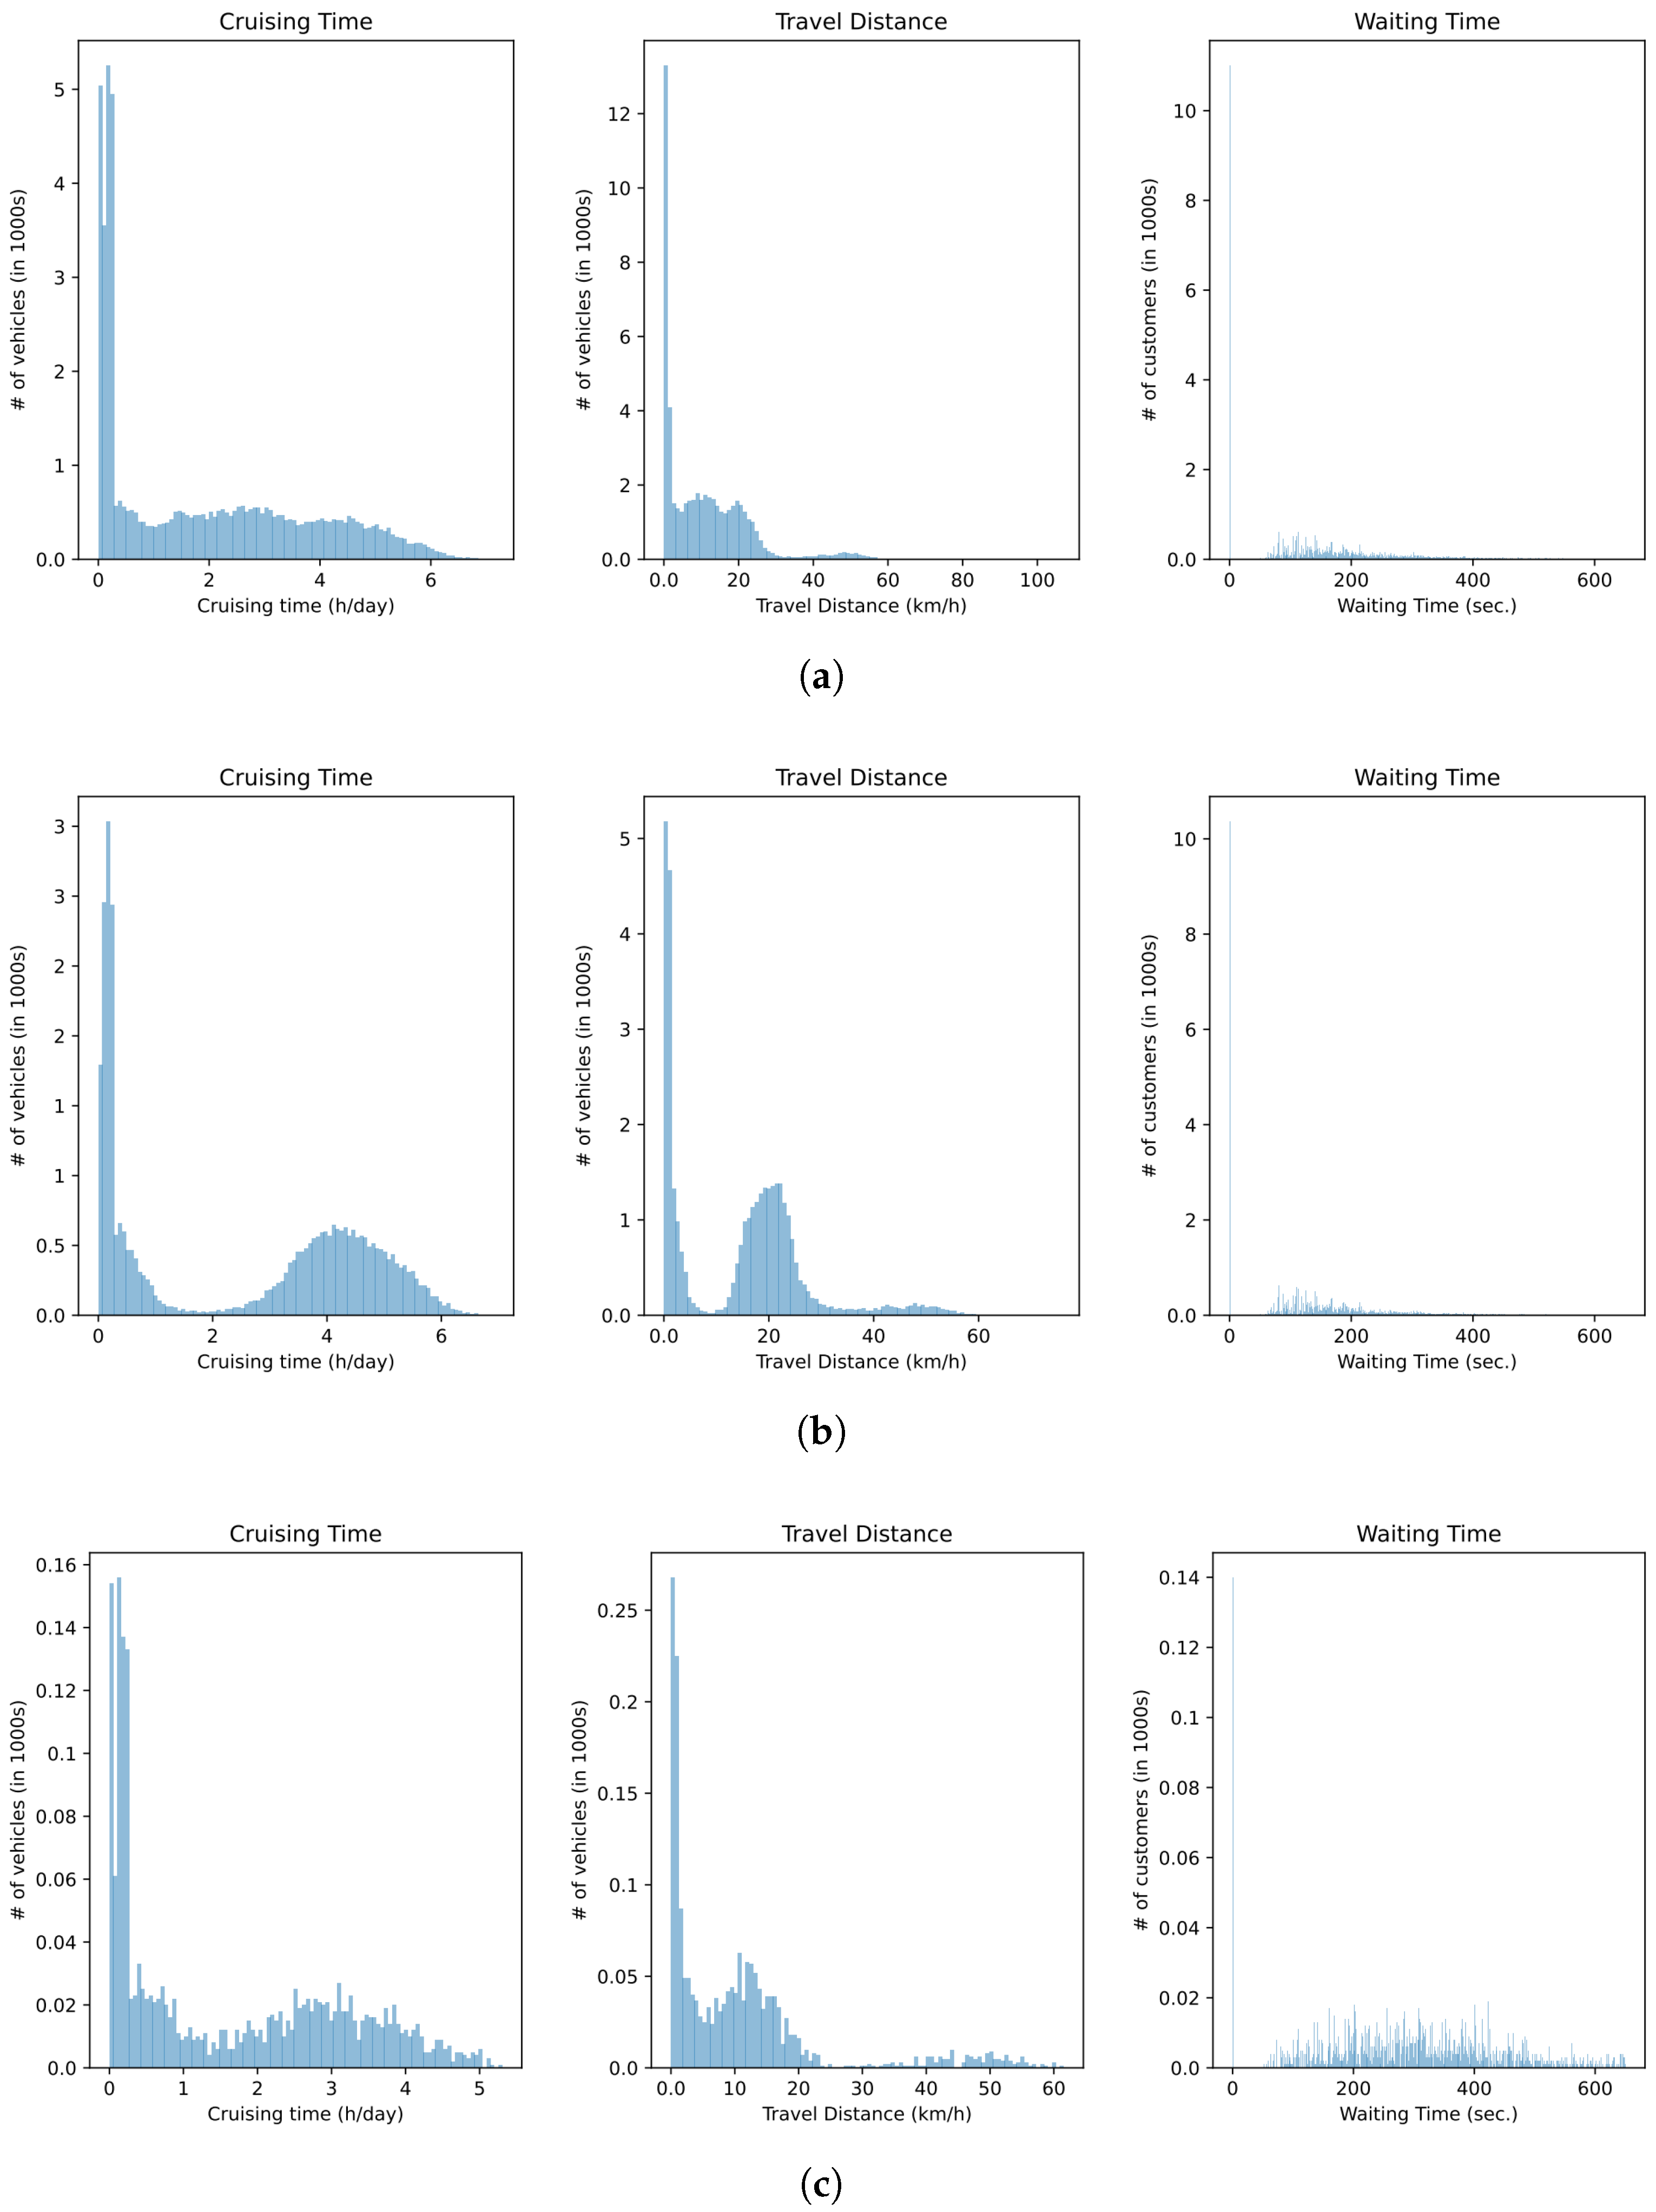
3.3.3. Experimental Data Analysis

Our joint approach combines insertion-based route planning and pricing strategies. A comparison of vehicle performance metrics across different strategies is shown in Table 1 and Figure 4, Figure 5 and Figure 6.
The comparative research of Crusing Time, Waiting Time, and Travel Distance across three baseline strategies and three DHDRDS variants, as visualized in Figure 5 and Figure 6, reveals systematic improvements in fleet utilization and service quality. For cruising time, the proposed DHDRDS variants achieve higher daily occupied hours (DHDRDS-DQN: 12.8 ± 2.0 h/day, higher than Baseline 1: 10.2 ± 1.5 h/day), indicating enhanced utilization of fleet resources and reduced idle periods where vehicles generate no revenue. Similarly, travel distance metrics reflect optimized routing efficiency, with DHDRDS-DQN maintaining higher hourly mileage (22.4 ± 4.1 km/h) compared to Baseline 3’s lower values (18.7 ± 3.2 km/h), suggesting a balance between parcel–passenger pooling benefits and detour costs. Regarding waiting time, all methods ensure that over 90% of passenger orders are served within the 8-min threshold, minimizing order cancellations and penalty costs due to excessive delays. Specifically, DHDRDS-DQN reduces the average waiting time to 289 ± 32 s (lower than Baseline 1: 342 ± 45 s), demonstrating improved responsiveness despite the added complexity of heterogeneous demand coordination. These results, combined with the profit per hour and idle time comparisons in Table 1, validate that the DHDRDS framework incrementally enhances operational efficiency without compromising service reliability.
The comparative analysis in Table 1 underscores the nuanced trade-offs inherent in the DHDRDS framework. The experimental comparison reveals critical trade-offs in system design. Baseline 3 achieves a higher passenger capacity (2.23 ± 0.46) but experiences 4.8% lower profitability (79.75 ± 1.10 CNY/h) due to its exclusion of parcel delivery. In contrast, DHDRDS-DQN attains 17.3% higher hourly profits (83.80 ± 17.86 CNY/h) through dynamic demand balancing, despite a 31.4% reduction in capacity utilization (1.53 ± 0.41). The proposed framework reduces vehicle idle time by 11.2% relative to Baseline 1 (3976.05 ± 1635.53 s compared to 4416.83 ± 2971.57 s), demonstrating enhanced real-time scheduling via deep reinforcement learning. Despite increasing the delivery distance by 68.7% (4.74 ± 3.437 km compared to 2.81 ± 0.392 km), the extended routes generate sufficient revenue from high-value parcels to offset operational costs. These results collectively establish DHDRDS-DQN’s capability to balance financial returns (83.80 CNY/h) with operational efficiency (3976.05 s idle time), providing a viable solution for multimodal urban mobility systems requiring the joint optimization of profitability and resource utilization.

4. Discussion

4.1. Advantages and Innovations

The proposed Dynamic Heterogeneous Demand-aware Ride-hailing Dispatch System (DHDRDS) achieves groundbreaking advancements in urban mobility resource management through multimodal coordination. Its core advantages and innovations are reflected in two aspects:
Paradigm Shift in Heterogeneous Demand Modeling: Traditional dispatch systems treat passenger and parcel demands separately, leading to high empty mileage (44.2% in Baseline 1) and fragmented resources. DHDRDS innovatively conceptualizes parcel orders as “virtual passengers” with spatiotemporal constraints, enabling dual-modal coordination via dynamic pricing (Equation (3)) and insertion-based route planning (Algorithm 1). Experimental results demonstrate a 5.1% profit improvement (83.80 CNY/h, higher than Baseline 3’s 79.75 CNY/h) and a 10% reduction in idle time (3976 s, lower than Baseline 1’s 4417 s), validating the economic value of heterogeneous demand integration.
Scalability of Decentralized Reinforcement Learning: Traditional centralized optimization struggles with computational complexity in large-scale fleet management. DHDRDS adopts a distributed DQN architecture (Algorithm 1), where each vehicle independently makes decisions based on localized states (location, capacity, demand predictions) and achieves Nash equilibrium through a shared observation module. This approach maintains linear computational complexity (O(n)) even at a simulation scale of 1000 vehicles, laying the foundation for future applications in megacity transportation networks.

4.2. Limitations and Future Work

Despite its promising performance, DHDRDS faces challenges in real-world deployment: (1) Limited Robustness in Dynamic Scenarios: When faced with sudden demand shifts, DHDRDS-DQN exhibits higher mileage volatility compared to Baseline 3. This issue arises because reinforcement learning models rely heavily on historical data patterns. If real-time demand differs from these patterns, the system may create inefficient routes. For instance, the profit standard deviation increases to CNY ±17.86 in weekend simulations, indicating room for improvement in earnings stability. (2) Data Quality and Coverage Constraints: The current system relies on Suzhou’s downtown order data (1 million passenger + 500k synthetic parcel orders), leaving its generalizability in low-density areas untested. (3) Experiments focus solely on Suzhou’s road network (high-density intersections and mixed traffic flows), neglecting the impacts of other urban topologies.
While this study provides a theoretical framework for multimodal coordination in intelligent transportation systems, further exploration is needed in the following directions: Future research could focus on developing hybrid reinforcement learning frameworks that integrate MPC with DRL, combining short-term deterministic optimization with long-term policy exploration to balance dispatch efficiency and stability in dynamic environments. Additionally, multi-source data fusion (satellite imagery, social media event detection, and traffic flow monitoring) should be leveraged to construct multi-granularity demand prediction models, while Generative Adversarial Networks (GANs) could synthesize order data to mitigate training data sparsity in low-density regions. Furthermore, cross-city adaptive dispatch mechanisms are critical. Meta-Reinforcement Learning (Meta-RL) may extract universal dispatch rules, with dynamic adjustments to grid partitioning strategies and vehicle action spaces to accommodate diverse road network topologies. Lastly, embedding blockchain-based carbon credit trading into reward functions to prioritize low-emission routes could accelerate the transition toward carbon-neutral ride-hailing systems, achieving dual enhancements in economic returns and environmental sustainability.

5. Conclusions

This study proposes and validates a Deep Reinforcement Learning-based Dynamic Heterogeneous Demand-aware Ride-hailing Dispatch System (DHDRDS), which coordinates urban mobility resources through integrated passenger–parcel demand optimization. Simulation results indicate that the DHDRDS-DQN variant significantly outperforms traditional methods in key metrics: drivers achieve a net profit of CNY 83.80 per hour, the average idle time is reduced by at least 9.96%, and 90% of passenger orders are served within an 8-min waiting threshold. This success stems from two core innovations: (1) abstracting parcel as spatiotemporally constrained “virtual passengers” transcending conventional single-modal optimization; and (2) a distributed Deep Q-Network (DQN) architecture enabling decentralized decision-making with linear computational complexity, scalable to large urban networks. Furthermore, the joint dynamic pricing–route planning mechanism balances economic gains with user experience. From a societal perspective, DHDRDS contributes to sustainable urban development by minimizing empty mileage and enhancing resource utilization. Future work will focus on improving algorithmic robustness in dynamic scenarios, validating cross-city adaptability, and designing carbon-neutral incentive mechanisms to advance efficient and eco-friendly ride-hailing systems.

Author Contributions

Conceptualization, H.G. and X.H.; methodology, H.G.; software, H.G.; validation, X.H. and M.C.; investigation, H.G.; resources, M.C. and X.H.; data curation, H.G. and X.H.; writing—original draft preparation, H.G. and X.H.; writing—review and editing, M.C.; visualization, H.G.; supervision, M.C.; project administration, M.C.; funding acquisition, X.H. and M.C. All authors agreed to the published version of the manuscript.

Funding

This work was supported by the National Science Foundation of China (52402406), Postdoctoral Fellowship Program of CPSF (GZC20231893), Natural Science Foundation of Jiangsu Province (BK20240811).

Institutional Review Board Statement

Not applicable.

Informed Consent Statement

Not applicable.

Data Availability Statement

The data presented in this study are available on request from the corresponding author. The data are not publicly available due to privacy and ethical restrictions.

Conflicts of Interest

The authors declare no conflicts of interest.

Abbreviations

The following abbreviations are used:
DRLDeep Reinforcement Learning
DHDRDSDynamic Heterogeneous Demand-aware Ride-hailing Dispatch System
DQNDeep Q-Network
CNYChinese Yuan (Chinese currency)
OSRMOpen Source Routing Machine
OSMOpenStreetMap
DFDemand Forecasting
ETAEstimated Time of Arrival
MPCModel Predictive Control

References

  1. Padeiro, M.; Santana, P.; Grant, M. Chapter 1—Global aging and health determinants in a changing world. In Aging; Oliveira, P.J., Malva, J.O., Eds.; Academic Press: New York, NY, USA, 2023; pp. 3–30. [Google Scholar] [CrossRef]
  2. Yan, C.; Zhu, H.; Korolko, N.; Woodard, D.B. Dynamic pricing and matching in ride-hailing platforms. Nav. Res. Logist. NRL 2018, 67, 705–724. [Google Scholar] [CrossRef]
  3. Chen, J.; Li, W.; Zhang, H.; Cai, Z.; Sui, Y.; Long, Y.; Song, X.; Shibasaki, R. GPS data in urban online ride-hailing: A simulation method to evaluate impact of user scale on emission performance of system. J. Clean. Prod. 2021, 287, 125567. [Google Scholar] [CrossRef]
  4. He, Z. Portraying ride-hailing mobility using multi-day trip order data: A case study of Beijing, China. Transp. Res. Part A Policy Pract. 2020, 146, 152–169. [Google Scholar] [CrossRef]
  5. Huang, X.; Song, J.; Wang, C.; Chui, T.F.M.; Chan, P.W. The synergistic effect of urban heat and moisture islands in a compact high-rise city. Build. Environ. 2021, 205, 108274. [Google Scholar] [CrossRef]
  6. Tafreshian, A.; Masoud, N.; Yin, Y. Frontiers in Service Science: Ride Matching for Peer-to-Peer Ride Sharing: A Review and Future Directions. Serv. Sci. 2020, 12, 44–60. [Google Scholar] [CrossRef]
  7. Agatz, N.A.H.; Erera, A.L.; Savelsbergh, M.W.P.; Wang, X. Optimization for dynamic ride-sharing: A review. Eur. J. Oper. Res. 2012, 223, 295–303. [Google Scholar] [CrossRef]
  8. Furuhata, M.; Dessouky, M.M.; Ordóñez, F.; Brunet, M.E.; Wang, X.; Koenig, S. Ridesharing: The state-of-the-art and future directions. Transp. Res. Part B-Methodol. 2013, 57, 28–46. [Google Scholar] [CrossRef]
  9. Mourad, A.; Puchinger, J.; Chu, C. A survey of models and algorithms for optimizing shared mobility. Transp. Res. Part B Methodol. 2019, 123, 323–346. [Google Scholar] [CrossRef]
  10. do Carmo Martins, L.; de la Torre, R.; Corlu, C.G.; Juan, A.A.; Masmoudi, M. Optimizing ride-sharing operations in smart sustainable cities: Challenges and the need for agile algorithms. Comput. Ind. Eng. 2021, 153, 107080. [Google Scholar] [CrossRef]
  11. Ma, J.; Zhang, Y.; Duan, Z.; Tang, L. PROLIFIC: Deep Reinforcement Learning for Efficient EV Fleet Scheduling and Charging. Sustainability 2023, 15, 3553. [Google Scholar] [CrossRef]
  12. Cao, Y.; Liu, L.; Dong, Y. Convolutional Long Short-Term Memory Two-Dimensional Bidirectional Graph Convolutional Network for Taxi Demand Prediction. Sustainability 2023, 15, 7903. [Google Scholar] [CrossRef]
  13. Gao, W.; Zhao, C.; Zeng, Y.; Tang, J. Exploring the Spatio-Temporally Heterogeneous Impact of Traffic Network Structure on Ride-Hailing Emissions Using Shenzhen, China, as a Case Study. Sustainability 2024, 16, 4539. [Google Scholar] [CrossRef]
  14. Jin, K.; Wang, W.; Hua, X.; Zhou, W. Reinforcement Learning for Optimizing Driving Policies on Cruising Taxis Services. Sustainability 2020, 12, 8883. [Google Scholar] [CrossRef]
  15. Do, M.; Byun, W.; Shin, D.K.; Jin, H. Factors Influencing Matching of Ride-Hailing Service Using Machine Learning Method. Sustainability 2019, 11, 5615. [Google Scholar] [CrossRef]
  16. Holler, J.; Vuorio, R.; Qin, Z.; Tang, X.; Jiao, Y.; Jin, T.; Singh, S.; Wang, C.; Ye, J. Deep Reinforcement Learning for Multi-driver Vehicle Dispatching and Repositioning Problem. In Proceedings of the 2019 IEEE International Conference on Data Mining (ICDM), Beijing, China, 8–11 November 2019; pp. 1090–1095. [Google Scholar]
  17. Qin, Z.; Tang, X.; Jiao, Y.; Zhang, F.; Wang, C.; Li, Q. Deep Reinforcement Learning for Ride-sharing Dispatching and Repositioning. In Proceedings of the International Joint Conference on Artificial Intelligence, Macao, China, 10–16 August 2019. [Google Scholar]
  18. Lin, K.; Zhao, R.; Xu, Z.; Zhou, J. Efficient Large-Scale Fleet Management via Multi-Agent Deep Reinforcement Learning. In Proceedings of the 24th ACM SIGKDD International Conference on Knowledge Discovery & Data Mining, KDD’18, New York, NY, USA, 19–23 August 2018; pp. 1774–1783. [Google Scholar] [CrossRef]
  19. Tang, X.; Qin, Z.; Zhang, F.; Wang, Z.; Xu, Z.; Ma, Y.; Zhu, H.; Ye, J. A Deep Value-network Based Approach for Multi-Driver Order Dispatching. In Proceedings of the 25th ACM SIGKDD International Conference on Knowledge Discovery & Data Mining, Anchorage, AK, USA, 4–8 August 2019. [Google Scholar]
  20. Fluri, C.; Ruch, C.; Zilly, J.G.; Hakenberg, J.P.; Frazzoli, E. Learning to Operate a Fleet of Cars. In Proceedings of the 2019 IEEE Intelligent Transportation Systems Conference (ITSC), Auckland, New Zealand, 27–30 October 2019; pp. 2292–2298. [Google Scholar]
  21. Lloyd, S.P. Least squares quantization in PCM. IEEE Trans. Inf. Theory 1982, 28, 129–136. [Google Scholar] [CrossRef]
  22. Deng, Y.; Chen, H.; Shao, S.; Tang, J.; Pi, J.; Gupta, A. Multi-Objective Vehicle Rebalancing for Ridehailing System using a Reinforcement Learning Approach. arXiv 2020, arXiv:2007.06801. [Google Scholar] [CrossRef]
  23. Schulman, J.; Wolski, F.; Dhariwal, P.; Radford, A.; Klimov, O. Proximal Policy Optimization Algorithms. arXiv 2017, arXiv:1707.06347. [Google Scholar]
  24. Lu, D.; Hu, D.; Wang, J.; Wei, W.; Zhang, X. A Data-Driven Vehicle Speed Prediction Transfer Learning Method with Improved Adaptability Across Working Conditions for Intelligent Fuel Cell Vehicle. IEEE Trans. Intell. Transp. Syst. 2025, 1–11. [Google Scholar] [CrossRef]
  25. Shi, D.; Li, X.; Li, M.; Wang, J.; Li, P.; Pan, M. Optimal Transportation Network Company Vehicle Dispatching via Deep Deterministic Policy Gradient. In Proceedings of the Wireless Algorithms, Systems, and Applications, Honolulu, HI, USA, 24–26 June 2019. [Google Scholar]
  26. Silver, D.; Lever, G.; Heess, N.M.O.; Degris, T.; Wierstra, D.; Riedmiller, M.A. Deterministic Policy Gradient Algorithms. In Proceedings of the International Conference on Machine Learning, Beijing, China, 21–26 June 2014. [Google Scholar]
  27. Shou, Z.; Di, X. Reward Design for Driver Repositioning Using Multi-Agent Reinforcement Learning. arXiv 2020, arXiv:2002.06723. [Google Scholar] [CrossRef]
  28. Huang, X.; Cheng, Y.; Jin, J.; Kou, A. Research on Dynamic Subsidy Based on Deep Reinforcement Learning for Non-Stationary Stochastic Demand in Ride-Hailing. Sustainability 2024, 16, 6289. [Google Scholar] [CrossRef]
  29. Liu, W.; Liang, J.; Xu, T. Tunnelling-induced ground deformation subjected to the behavior of tail grouting materials. Tunn. Undergr. Space Technol. 2023, 140, 105253. [Google Scholar] [CrossRef]
  30. Liang, J.; Liu, W.; Yin, X.; Li, W.; Yang, Z.; Yang, J. Experimental study on the performance of shield tunnel tail grout in ground. Undergr. Space 2025, 20, 277–292. [Google Scholar] [CrossRef]
  31. Hu, D.; Chen, A.; Lu, D.; Wang, J.; Yi, F. A multi-algorithm fusion model for predicting automotive fuel cell system demand power. J. Clean. Prod. 2024, 466, 142848. [Google Scholar] [CrossRef]
  32. Jin, J.; Zhou, M.; Zhang, W.; Li, M.; Guo, Z.; Qin, Z.; Jiao, Y.; Tang, X.; Wang, C.; Wang, J.; et al. CoRide: Joint Order Dispatching and Fleet Management for Multi-Scale Ride-Hailing Platforms. In Proceedings of the 28th ACM International Conference on Information and Knowledge Management, Beijing, China, 3–7 November 2019. [Google Scholar]
  33. Rong, S.; Meng, R.; Guo, J.; Cui, P.; Qiao, Z. Multi-Vehicle Collaborative Planning Technology under Automatic Driving. Sustainability 2024, 16, 4578. [Google Scholar] [CrossRef]
  34. Agatz, N.; Erera, A.L.; Savelsbergh, M.W.; Wang, X. Dynamic Ride-Sharing: A Simulation Study in Metro Atlanta. Procedia-Soc. Behav. Sci. 2011, 17, 532–550. [Google Scholar] [CrossRef]
  35. Mao, C.; Liu, Y.; Shen, Z.j.M. Dispatch of autonomous vehicles for taxi services: A deep reinforcement learning approach. Transp. Res. Part C Emerg. Technol. 2020, 115, 102626. [Google Scholar] [CrossRef]
  36. Mo, D.; Chen, X.M.; Zhang, J. Modeling and Managing Mixed On-Demand Ride Services of Human-Driven Vehicles and Autonomous Vehicles. Transp. Res. Part B Methodol. 2022, 157, 80–119. [Google Scholar] [CrossRef]
  37. Fan, G.; Jin, H.; Zhao, Y.; Song, Y.; Gan, X.; Ding, J.; Su, L.; Wang, X. Joint Order Dispatch and Charging for Electric Self-Driving Taxi Systems. In Proceedings of the IEEE INFOCOM 2022—IEEE Conference on Computer Communications, London, UK, 2–5 May 2022; pp. 1619–1628. [Google Scholar]
  38. Wyld, D.C.; Jones, M.A.; Totten, J.W. Where is my suitcase? RFID and airline customer service. Mark. Intell. Plan. 2005, 23, 382–394. [Google Scholar] [CrossRef]
  39. Bei, X.; Zhang, S. Algorithms for Trip-Vehicle Assignment in Ride-Sharing; AAAI’18/IAAI’18/EAAI’18; AAAI Press: Washington, DC, USA, 2018. [Google Scholar]
  40. Alonso-Mora, J.; Samaranayake, S.; Wallar, A.; Frazzoli, E.; Rus, D. On-demand high-capacity ride-sharing via dynamic trip-vehicle assignment. Proc. Natl. Acad. Sci. USA 2017, 114, 462–467. [Google Scholar] [CrossRef]
  41. Tong, Y.; Zeng, Y.; Zhou, Z.; Chen, L.; Ye, J.; Xu, K. A Unified Approach to Route Planning for Shared Mobility. Proc. VLDB Endow. 2018, 11, 1633–1646. [Google Scholar] [CrossRef]
  42. Ma, S.; Zheng, Y.; Wolfson, O. T-share: A large-scale dynamic taxi ridesharing service. In Proceedings of the 2013 IEEE 29th International Conference on Data Engineering (ICDE), Brisbane, QLD, Australia, 8–12 April 2013; pp. 410–421. [Google Scholar]
  43. Asghari, M.; Deng, D.; Shahabi, C.; Demiryurek, U.; Li, Y. Price-aware real-time ride-sharing at scale: An auction-based approach. In Proceedings of the 24th ACM SIGSPATIAL International Conference on Advances in Geographic Information Systems, Burlingame, CA, USA, 31 October–3 November 2016. [Google Scholar]
  44. Xu, Y.; Tong, Y.; Shi, Y.; Tao, Q.; Xu, K.; Li, W. An Efficient Insertion Operator in Dynamic Ridesharing Services. IEEE Trans. Knowl. Data Eng. 2020, 34, 3583–3596. [Google Scholar] [CrossRef]
  45. Luxen, D.; Vetter, C. Real-time routing with OpenStreetMap data. In Proceedings of the 19th ACM SIGSPATIAL International Conference on Advances in Geographic Information Systems, Hamburg, Germany, 13–16 November 2011. [Google Scholar]
  46. Haliem, M.; Mani, G.; Aggarwal, V.; Bhargava, B.K. A Distributed Model-Free Ride-Sharing Approach for Joint Matching, Pricing, and Dispatching Using Deep Reinforcement Learning. IEEE Trans. Intell. Transp. Syst. 2020, 22, 7931–7942. [Google Scholar] [CrossRef]
  47. Oda, T.; Joe-Wong, C. MOVI: A Model-Free Approach to Dynamic Fleet Management. In Proceedings of the IEEE INFOCOM 2018—IEEE Conference on Computer Communications, Honolulu, HI, USA, 15–19 April 2018; pp. 2708–2716. [Google Scholar]
  48. Al-Abbasi, A.O.; Ghosh, A.K.; Aggarwal, V. DeepPool: Distributed Model-Free Algorithm for Ride-Sharing Using Deep Reinforcement Learning. IEEE Trans. Intell. Transp. Syst. 2019, 20, 4714–4727. [Google Scholar] [CrossRef]
Figure 1. Architectural diagram of the joint ride-hailing dispatch framework.
Sustainability 17 04012 g001
Figure 2. Demand distribution and study area in downtown Suzhou. (a) Study area: an 11 × 11 km2 rectangular region in downtown Suzhou. (b) Passenger order demand distribution. (c) Parcel order demand distribution. (d) Passenger order demand hex heatmap. (e) Parcel order demand hex heatmap.
Sustainability 17 04012 g002
Figure 3. Architectural diagram of the joint ride-hailing dispatch framework.
Sustainability 17 04012 g003
Figure 4. Comparison of average idle time and profit per hour under different dispatch strategies.
Sustainability 17 04012 g004
Figure 5. Histograms of property metrics for present method and the baselines, listed as follows: (a) Performance metrics of Baseline 1. (b) Performance metrics of Baseline 2. (c) Performance metrics of Baseline 3.
Sustainability 17 04012 g005
Figure 6. Histograms of property metrics for present method and the baselines, listed as follows: (a) Metrics of DHDRDS_Passenger_only. (b) Metrics of DHDRDS_parcel+. (c) Performance metrics of DHDRDS-DQN_parcel+.
Sustainability 17 04012 g006
Disclaimer/Publisher’s Note: The statements, opinions and data contained in all publications are solely those of the individual author(s) and contributor(s) and not of MDPI and/or the editor(s). MDPI and/or the editor(s) disclaim responsibility for any injury to people or property resulting from any ideas, methods, instructions or products referred to in the content.

