Article

Energy Subsidies and Potential Reforms in the Gulf Region: Investigating Villa Residents’ Electricity Consumption and the Factors Influencing It in Kuwait’s Six Governorates

1
Department of Architecture, College of Architecture, Kuwait University, Kuwait City 46300, Kuwait
2
Welsh School of Architecture, Cardiff University, Cardiff CF10 3NB, UK
3
Department of Statistics and Operations Research, College of Science, Kuwait University, Kuwait City 46300, Kuwait
*
Authors to whom correspondence should be addressed.
Sustainability 2025, 17(10), 4578; https://doi.org/10.3390/su17104578 (registering DOI)
Submission received: 23 February 2025 / Revised: 10 May 2025 / Accepted: 13 May 2025 / Published: 16 May 2025
(This article belongs to the Section Energy Sustainability)

Abstract

:
This paper investigates the electricity consumption of 150 Kuwaiti residential villas located in Kuwait’s six governorates. The data collection is based on monthly electricity meter readings, collected directly from photographs of the sample of villas’ analog electricity meters, between 2018 and 2023. Most available previous studies, reviewed in this paper, not only relied mainly on secondary aggregated data of annual electricity consumption in villas but also from smaller samples located in some but not all of Kuwait’s governorates. The current paper is, therefore, based on a study that is the first of its kind in Kuwait, as it relies on primary data with a high level of granularity based on monthly meter readings for a large sample of villas. Average daily electricity consumption and overall average monthly electricity consumption from samples located in each governorate are presented. The data analyses reveal that the daily electricity consumption in Kuwaiti villas is almost five times higher at the beginning of summer than in winter, indicating the high load required from the electricity grid in Kuwait and the large subsidies provided by the government. Furthermore, the paper investigates whether there are any common characteristics between the villas with high monthly electricity consumption in the sample. Correlations between villas’ monthly electricity consumption and their governorate location, year of construction, number of floors, number of occupants, plot size, and compliance with various editions of the Kuwait Energy Conservation Code of Practice for Buildings ECCPB were found. The results reveal that 80% of these villas had plot sizes greater than 400 m2, 74% of these villas were built in 1996 or later, and 63% of these villas had occupants greater than seven. This paper highlights the need to carry out further research to understand the drivers of electricity consumption, including occupants’ behavioral aspects, to inform the development of futures strategies that address the ever-increasing electricity consumption in Kuwait’s heavily subsidized residential sector and meet the target goals of the United Nations 2023 Kuwait’s Voluntary National Review VNR.

1. Introduction

Kuwait is a hot and arid country situated on the northern tip of the Arabian Gulf, bordering the Kingdom of Saudi Arabia and Iraq. It has a total area of 17,399 km2 and a population of 4,918,570 [1]. Kuwait’s economy is controlled by its oil and gas industry, with many of its resources being utilized to meet the energy needs of its population. Kuwait is ranked among the countries with the highest residential electricity consumption per capita and the highest electricity subsidies per capita when compared to other Gulf Cooperation Countries, such as Qatar, Bahrain, and the Kingdom of Saudi Arabia [2] (p. 30). Furthermore, Kuwait has the highest level of carbon dioxide-equivalent emissions per capita in the world, with a value of 21 tons/capita; these emissions are predicted to increase by 2035, with an average annual growth of 1.1% [3]. The high energy consumption per capita is due to the following three main factors: (1) the increasing residential demand for electricity to operate mechanical cooling systems, (2) the reliance of most of the population on the use of private cars for transport, and (3) the high energy subsidies for producing electricity and oil products [3] (p. 46).
Because Kuwait Public Authority for Housing Welfare (PAHW) is the main provider of housing units in the form of single-family villas for all Kuwaiti nationals and will continues to be so for the foreseeable future, the largest percentage of electricity consumption in the residential sector is from villas; this percentage is expected to increase over the coming years due to the gradual increase in the Kuwaiti population [4].
Researchers in the field of energy and buildings face many challenges in developing effective strategies to reduce electricity consumption in Kuwaiti villas. Among these challenges is the limited amount of available published literature on drivers of electricity consumption from a representative large dataset sample of Kuwaiti housing stock. Understanding the existing housing stock is necessary for evaluating energy performance and adopting suitable energy efficiency strategies [5].

1.1. High Electricity Consumption in Kuwaiti Villas

In the early 1980s, the Kuwait Ministry of Electricity, Water, and Renewable Energy (MEWRE) recognized the importance of reducing electricity consumption in the building sector. Because electricity is used for cooling, heating, lighting, appliances, and water heating in Kuwaiti homes, referred to as villas, the term “energy” in this paper refers to electricity, even though many Kuwaiti villas use gas in the form of butane/propane 12Kg cylinders and/or electric ovens and stoves for cooking [5]. As Kuwait’s population has increased, more residential villas have been built to meet the growing demand for housing, resulting in an increase in electricity demand and consumption for cooling. Consequently, in 1983, the MEWRE commissioned the Kuwait Institute for Scientific Research (KISR) to develop a code for the purpose of improving the energy efficiency of buildings in Kuwait. The KISR developed the first edition of the Energy Conservation Code of Practice for Buildings (ECCPB) in 1983, and it went through subsequent revisions in 2010, 2014, and 2018 [6]. The code provides the minimum energy requirements for the design and construction of various building types in Kuwait, including residential villas. These energy requirements include power density for air conditioning (A/C) and lighting systems, building material insulation, glazing characteristics for windows and curtain walls, window-to-wall ratios, building envelope air infiltration, and thermostat requirements [6].
With the aid of energy modeling simulation, researchers at KISR predicted a 40% reduction in the cooling loads for buildings constructed in full compliance with the 1983 ECCPB code [7] (p. 99). However, there is little evidence of the effectiveness of the code in practice [8], and despite the three updated versions of the ECCPB code, Kuwait’s residential building sector’s demand for electricity has continued to increase over the years [9]. In 2019, the buildings and transport sectors had the largest share of energy demand in Kuwait. To develop effective strategies for reducing energy consumption, the KISR published the first edition of the Kuwait Energy Outlook (KEO) in 2019. This publication provided an overview of energy demand trends in Kuwait based on reliable data, as well as robust projections that serve as a foundation for Kuwait’s policy choices for a more sustainable energy future. Because the local energy statistics were incomplete, the 2019 KEO publication had to rely on energy balances from the International Energy Agency (IEA) [2].
In the most recent 2023 KEO, local statistics and IEA energy balances were used to develop an energy system model for Kuwait in the form of a business-as-usual (BAU) case to reflect the trends in Kuwait’s energy system until 2040. According to the BAU case, the energy demands in Kuwaiti buildings are growing at a rate of 1.4%, with electricity fueling most of this demand [2]. Currently, air conditioning demand accounts for 60% of the total electricity demand and is estimated to reach a maximum of 67% over the period from 2019 to 2040. This air conditioning demand is growing at a rate of 1.5% annually and is likely to continue doing so until 2040 [2]. Researchers have proposed various strategies to reduce electricity consumption and improve the energy efficiency of buildings in Kuwait [2]. In 2019, Kuwait submitted the first Voluntary National Review (VNR) to the United Nations with the objective of meeting sustainable development goals that included improving the energy efficiency of its buildings by 2035 [3].
Moreover, in a publication produced by the Council of Ministers of the State of Kuwait in 2024, the minister revealed that Kuwait’s government plans to curtail subsidies that are provided to the citizens of Kuwait in response to changes in the prices of crude oil between 2000 and 2023 and the challenges associated with meeting the increasing percentage of subsidy demands of the population [10]. Kuwaiti policy reforms to improve energy efficiency in buildings include enhancing the arrangement of windows, installing photovoltaic integrated systems, and investing in building retrofitting. Moreover, energy pricing reform strategies include gradually replacing universal subsidies with targeted cash transfers or compensations schemes, clearly defining price changes for future price movements, and launching public awareness campaigns about energy price reforms to avoid opposition from the public due to a sudden increase in prices [3].
There are many available energy conservation strategies and policies, as well as research into increasing the energy efficiency of villas to reduce cooling loads and, hence, electricity consumption [11]. However, studies that provide a detailed quantitative understanding of electricity consumption in the residential sector are rare, if they exist at all. The lack of benchmarks makes it extremely challenging to target effective energy-saving opportunities, determine precise measurable saving goals, and monitor the implementation of strategies to ensure post-occupancy success. Additionally, the limitations in understanding energy demand profiles in residential buildings lead to an under- or oversizing of the electrical distribution infrastructure, which negatively impacts the grid [7,11]. Among the reasons for the lack of literature on the drivers of electricity consumption in Kuwaiti villas is the limited number of publicly available building energy datasets in Kuwait [11].

1.2. Published Studies on Kuwaiti Building Stock Energy Performance Based on Large Datasets Obtained from Kuwait Ministries

In the Kuwaiti context, and possibly in the GCC region, only one published study has been conducted using the largest dataset of the Kuwaiti building stock’s energy performance, which was made available for academic publishing. It was a study published in 2021 based on a sample of 463 buildings in Kuwait. However, this study relied on secondary data obtained from different organizations, including the Kuwait Municipality “Baladia” and the Ministry of Energy, Water, and Renewable Energy (MEWRE), rather than primary data collected for the purpose of the study. The sample of 463 buildings consisted of commercial, multi-story residential buildings, and single-family villas. Furthermore, the data on which this study was based were gathered from a multitude of diverse sources, such as Kuwaiti building codes, international building codes, a database of US prototype energy models, and local academic publications [11].
While the sample size in that study was possibly the largest used in Kuwait and in the GCC region for academic publishing, the data collected lacked granularity when it came to energy consumption, and the study only aggregated annual data that were available from a variety of sources that are not necessarily compatible. Moreover, the data lacked fundamental information on the building fabric, such as construction information about the buildings’ skin, glazing type, window-to-wall ratios, and the type of glazing systems. The dataset also lacked operation parameters, including occupancy schedules and thermostat set points. To address these limitations, the research used a hybrid approach that combined statistical data analysis and energy modeling. Additionally, the scope of the data used in the research was geographically limited, as the sample of buildings was not taken from the different urban areas of Kuwait; the results are, therefore, difficult to generalize at the country level [11].
However, the study aimed to fill a gap in the literature about energy benchmarking and quantification by making recommendations based on the statistical analyses of secondary data and an energy modeling approach to the following three broadly defined categories of buildings in Kuwait: namely, commercial, multi-story residential, and single-family residential villas [11]. The precise sample size for each category of building was not made clear. The key parameter surveyed was the average electricity consumption kWh/day, which was determined according to consumers’ electricity meters and consisted of a single value per building that represented the average daily consumption over a period of one year, a value that was derived by dividing the annual electric consumption by 365 days. The study indicates that the average daily electric consumption of single-family residential villas was 631 kWh, and the electricity use intensity value centered around the mean 229 kWh/m2/year, a mean value that indicated a certain homogeneity in the performance of single-family villas, which is highly unlikely. Furthermore, the study found that the building size is a significant driver of energy consumption, and that the largest determinant of building energy consumption performance for all three categories of buildings, including single-family residential villas, was the thermostat cooling setpoint. Consequently, a thermostat setpoint of 20 °C instead of 24 °C can increase a villa’s electricity consumption by more than 20% [11].
We found two other studies that included large sample datasets of Kuwait’s residential neighborhoods. Both studies relied on secondary annual electricity meter readings of the Qadsiya residential neighborhood located in the Al Asimah governorate, and the datasets were obtained from the local municipality. The purpose of both studies was to improve an urban building energy modelling tool called UBEM. In one of these two studies, the large sample dataset consisted of a sample size of 140 Qadsiya villas; it aimed to enhance UBEM accuracy by reproducing uncertainties in occupant behavior parameters based on simulated models [12]. The second study sample dataset consisted of 336 two-to-three-story villas in the Qadsiya neighborhood; it used real data to quantify the simulation error of the urban building energy model tool (UBEM) and calibrate the model to reduce simulation errors [13].
The other study was based on interviewing a large sample of residents. In total, 250 interviews were conducted in the six governorates of Kuwait, with the aim of gathering information about the physical characteristics of interviewees’ residential villas, the occupants’ socio-demographic characteristics, and the occupants’ energy use behavior. Due to the challenges of restricted access to villas and cultural restrictions associated with conducting interviews at private villas, the questionnaires were administered by 12 interviewers at residential supermarkets, referred to as co-ops, in randomly selected neighborhoods within the six Kuwait governorates, referred to as the six districts. The interviewers collected the data by performing face-to-face interviews on location at the co-ops. Critics of the quota sampling challenged the method of data collection and claimed that the representativeness of the sample was questionable, because the interviewers may have tended to approach those who were sociable and accessible to them. The data analysis performed included descriptive analysis and multiple linear regression analysis using SPSS (version 22). A correlation matrix was created using Pearson’s correlation coefficient, Spearman’s rank correlation coefficient, and a one-way ANOVA test [8,14].
The interviews included participants’ answers about their annual electricity consumption, which was found to be significantly higher than the average electricity annual consumption that was published in the Kuwait National Statistics. This overestimation in annual electricity consumption was due to the self-reported bill, which is a one-figure sum that includes both water and electricity. Another challenge of the study was that only 65% of the survey participants answered the question about their villa’s annual electricity consumption [8,14].
To improve the quality of the data used for regression analysis in the study, data pertaining to Kuwait’s national energy consumption were overlaid over the sample’s data to identify possible outliers. The study found that the average total monthly household income was between KWD 1000 (USD 3330) and KWD 2500 (USD 8326), the average total number of occupants was 9.3 per villa, and the mean annual utility bill for villas was KWD 801 (USD 2668)/annum, which is 400,433 kWh/annum. Furthermore, the study considered 62 cases to be outliers, and these were removed from the sample, because the survey participants reported a consumption greater than KWD 900 (USD 2997)/annum, which is 450,000 kWh/annum, and this value was considered too high according to the national consumption data, representing an implausible level of energy consumption that could not be explained. A revised mean utility bill of KWD 500 (USD 1665)/annum, which is 250,198 kWh/annum, was estimated from the remaining 101 acceptable survey datapoints [8,14].
The study concluded that the electricity consumption increased when the number of floors, number of occupants, villa size, and household income increased. However, the electricity consumption decreased when the air conditioning A/C thermostat set points and villa age increased [8,14].

1.3. Published Studies on Kuwaiti Building Stock Energy Performance Based on Small Datasets Obtained by Researchers Through Monitored Data

In a study that investigated the impact of occupants’ behavior and activity patterns on electricity consumption in Kuwaiti villas, 30 villas were surveyed to make recommendations about regional responsive data that should be used in building energy simulation software. The study compared the software simulation results generated using the default values of a typical US residence with the actual values of Kuwaiti villas that were obtained from the study. The simulation results illustrated that there was an increase of 21% in energy consumption in a Kuwaiti villa compared to the same case when the default values of the software were used [15].
The values obtained for the study were gathered from Kuwaiti students of the Department of Architecture at Kuwait University, who were asked to complete a survey on their villas. Because Kuwait University is a public university that offers free education to Kuwaiti nationals, the students’ sample represents the diverse cultural and economic strata of Kuwaiti society [15].
The study investigated the occupants’ activities, electric lights, electrical appliances, and the thermostat settings of the air conditioning (A/C) units. The research found that the average total number of occupants in Kuwaiti villas was seven. However, the measured electricity consumption, the villa’s year of construction, building fabric, plot size, and the number of floors were not included in the research. The research presented the number of sample villas based on the number of rooms in each zone. The rooms of the surveyed villas were grouped into four main zones, i.e., the living and dining rooms, bedrooms, kitchens, and bathrooms. The surveyed data were analyzed using the thermal simulation program ENERWIN, and the study found that there was a 29% reduction in electricity consumption when inputting the building energy simulation model with real data related to occupancy patterns with lighting schedules. Moreover, there was a 39% reduction in electricity consumption when efficient lighting patterns were coupled with raising thermostat setpoints from 22 °C to 24 °C [15].
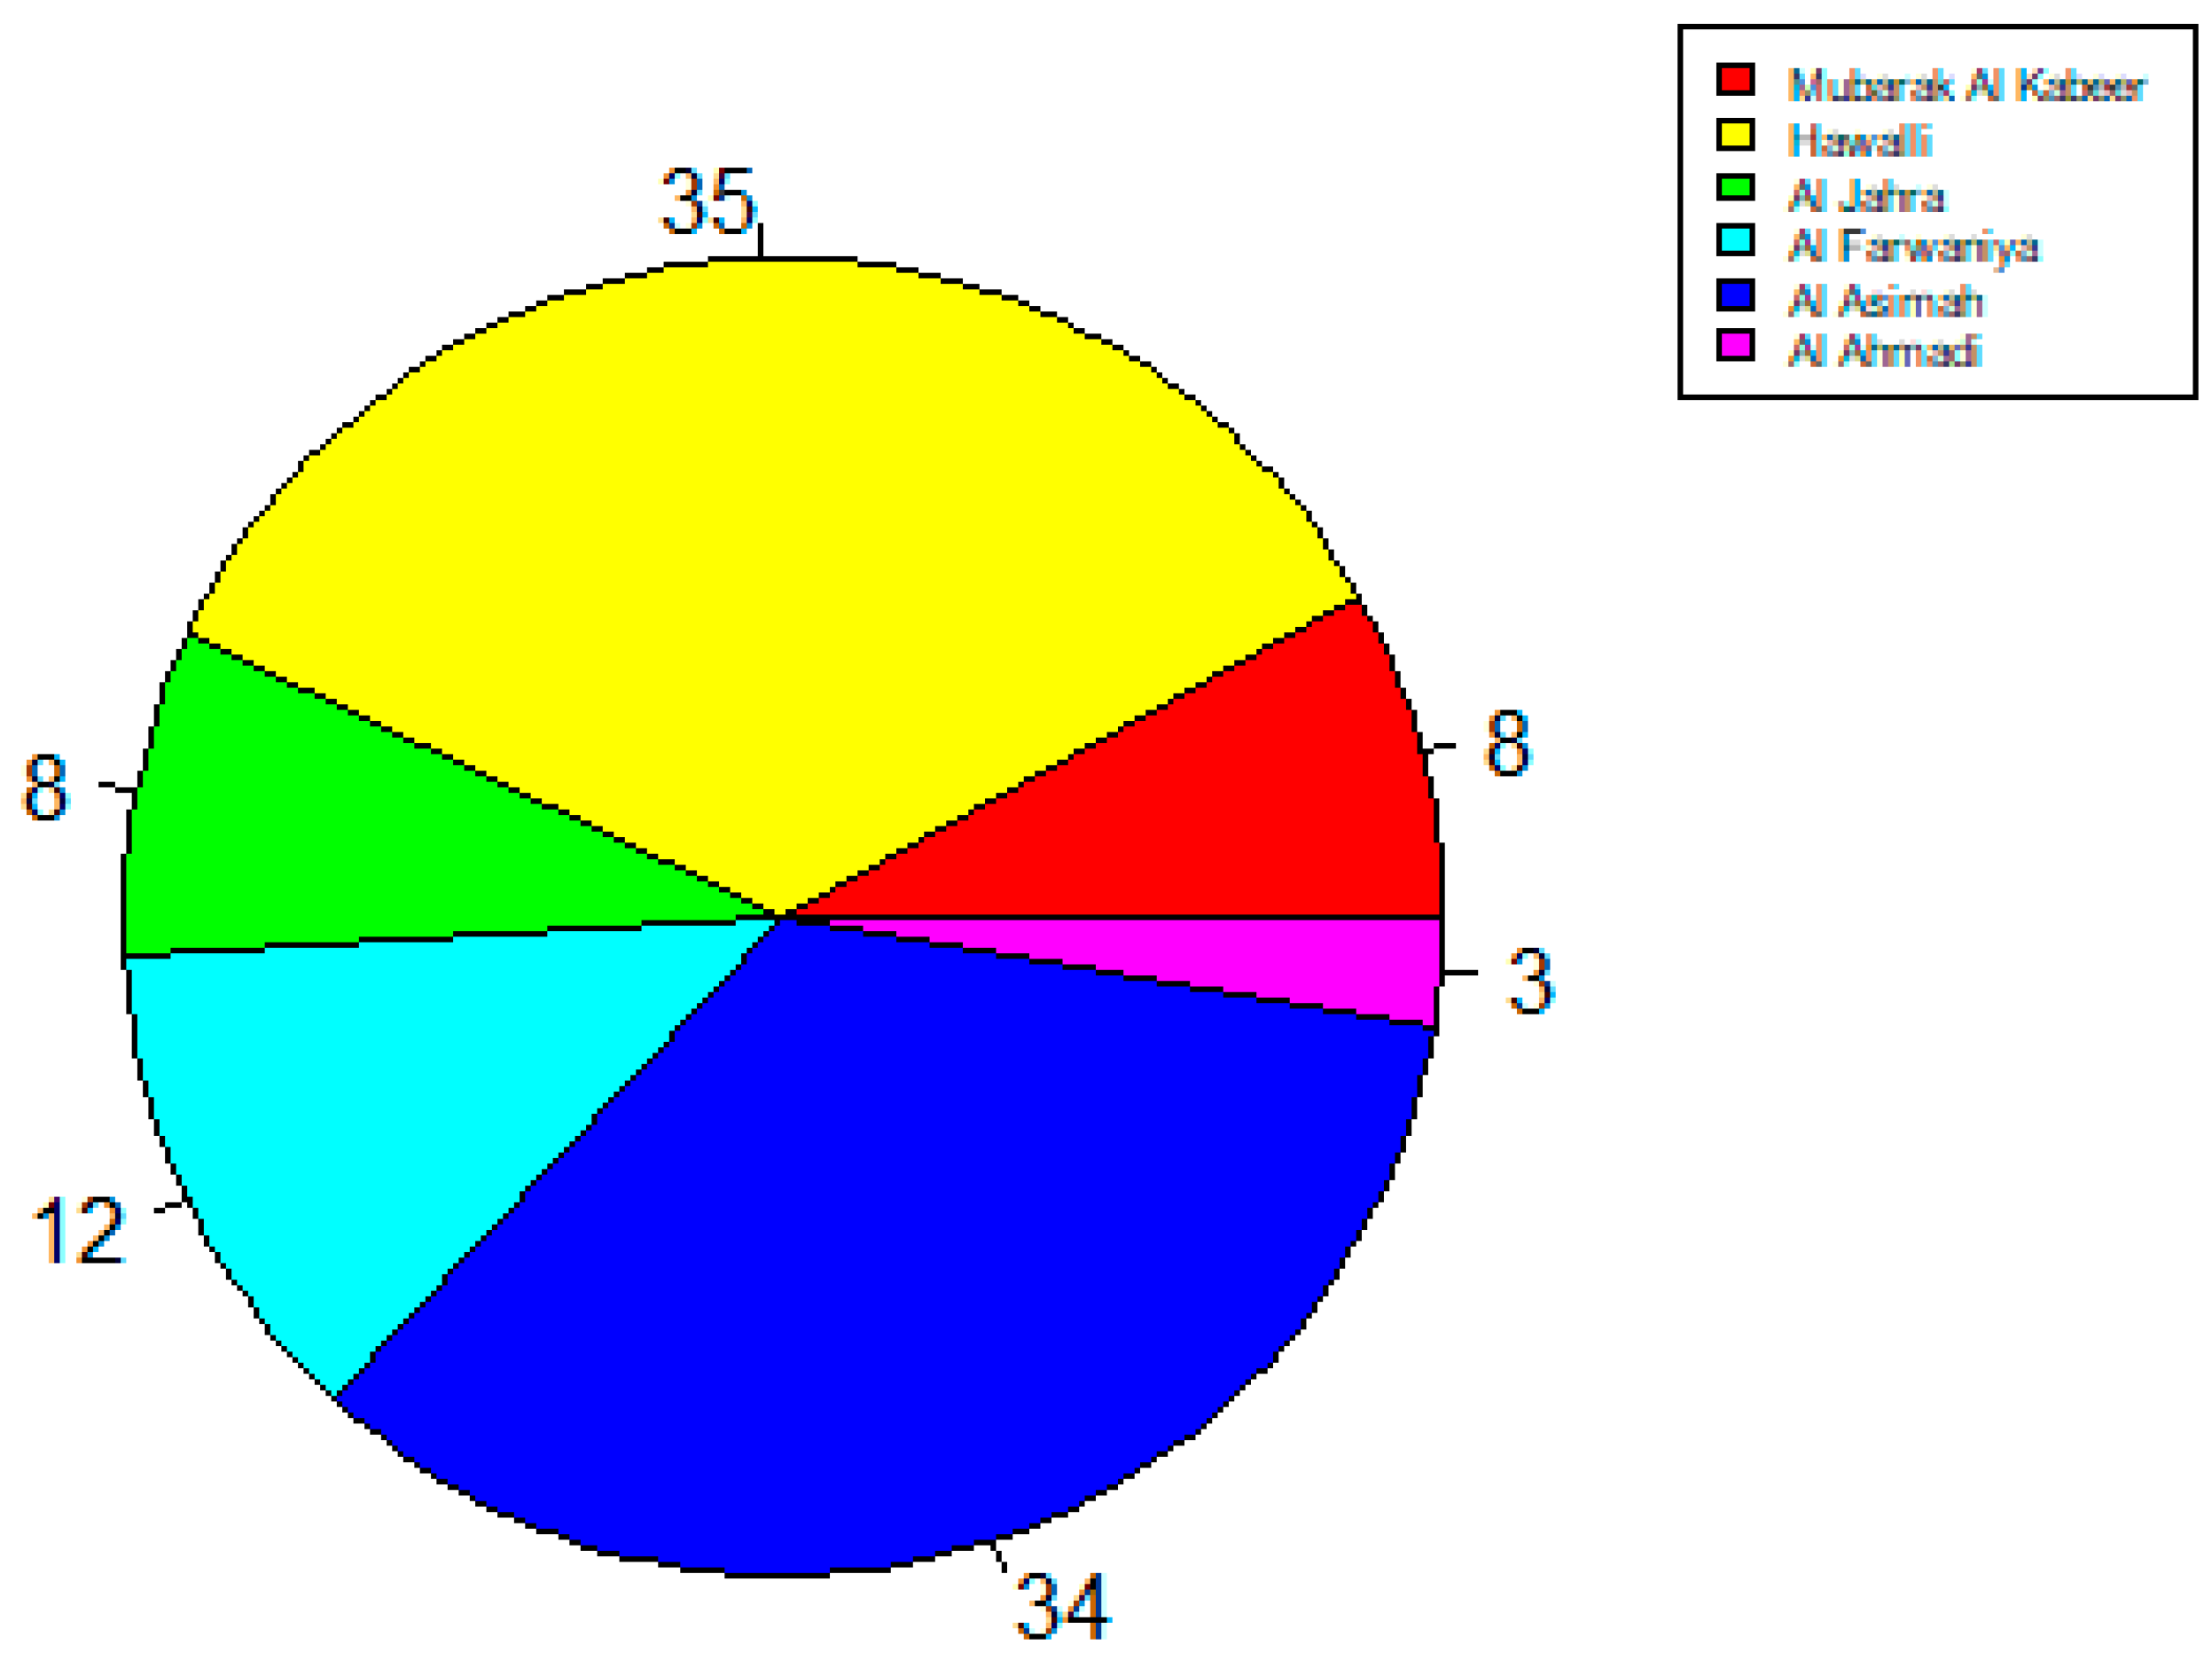
In another field study that investigated indoor thermal conditions and thermal comfort in Kuwaiti villas, 25 villas located in the five governorates of Kuwait were surveyed during the summers of 2006 and 2007, from the month of May until the month of October, when air conditioning is generally used. The sizes of the villas studied ranged from one to three floors, and all villas had a plot area of 400 m2. However, no data pertaining to the measured electricity consumption, the villa’s year of construction, the building fabric, or occupants’ behavior were provided. These villas were in the Al Asimah, Hawalli, Al Jahra, Al Ahmadi, and Mubarak Al Kabeer governorates [16].
The study consisted of physical measurements that were carried out on 25 villas using a Bruel & Kjaer Indoor Climate Analyzer (Type 1212). This system consisted of transducers and a data logging system that was fitted into a trolley arrangement to collect the dry-bulb and wet-bulb air temperatures, relative humidity, air velocity, and operative temperature. During this data collection process in each villa, subjective data were also collected from 111 participants via a questionnaire with questions based on the ASHRAE seven-point scale. The data collection period lasted 75 min in each villa, and the participants were asked to complete the questionnaire in their living rooms. The study concluded that the neutral operative temperatures based upon AMV and PMV were 25.2 °C and 23.3 °C, respectively [16].
In a study that also consisted of physical measurements and subjective data collection, four Kuwaiti villas were monitored over a period of 12 months to gain insight into the social and physical drivers of electricity consumption. In this study, a building energy model was used to analyze the drivers of electricity consumption from actual data obtained by monitoring the four villas and surveying the occupants to better predict energy use in Kuwaiti villas. The data gathered on the villas included energy use, internal temperatures, the building fabric, building systems, and occupants’ behavior. Weekly electricity meter readings and temperatures were monitored. Each villa was installed with 15 to 20 onset HOBO data loggers, and 3 HOBO data loggers were placed on the roofs of the villas in a Stevenson screen to monitor the outdoor temperature [5]. A physical survey of the building fabric and building services was conducted via a walk-through survey and from photographs taken of the villas. A social survey of the villas’ occupants was conducted via an initial interview prior to the start of monitoring and then later through a series of follow-up interviews during the monitoring phase. The duration of each interview was one hour, and all interviews were conducted in the interviewees’ villas [5].
The research did not aim to generalize the results beyond the sample of the four villas but was instead meant to provide a platform for future research on the drivers of electricity consumption in Kuwaiti villas, using a nationally representative sample size [5]. Most published literature on Kuwaiti villas’ electricity consumption has been based on building energy models with limited empirical data. Because energy models assume standard occupant behavior, they overlook the interaction between people and technology. Therefore, to improve the predicted energy analysis outcomes in the study, building energy models were developed using Simergy; they were grounded with empirical data from the four case study villas’ climates, systems, internal loads, and schedules. The building energy model illustrated that the electricity consumption used to cool the villas was 50% to 75% of its total energy use. Moreover, 30% of the electricity consumed for cooling was due to heat gain from appliances; improving the levels of efficiency of the insulation and double glazing did not significantly reduce the measured and modelled energy use of the villas, but it did improve the uniform internal temperatures. Occupants’ behaviors in terms of not adjusting the air-conditioning thermostat settings during periods of summer travel was identified as a driver of electricity consumption, and the lack of regular air-conditioning maintenance led to high electricity consumption [5].

1.4. Published Studies on Kuwaiti Building Stock Energy Performance Based on Energy Modeling with Limited Empirical Grounding

In a study investigating energy savings from the government-funded retrofitting of 42,403 old residential villas built before 1983, recommendations were made based on an energy model with limited empirical data. The study identified limitations in the first edition of the ECCPB code published in 1983 and in all subsequent versions of the code, as none of the versions included any guidelines for retrofitting the pre-1983 villas. The retrofitting strategies considered for the study were tested using an energy model simulation tool called the DOE-2.1E building simulation program, and the proposed retrofits that were tested dealt with the exterior fitting of thermal insulation and changing the glazing type. While the annual energy consumption savings were estimated to be 3.25 million MWh, the data used in the energy simulation model did not go beyond retrofitting the building fabric in the energy simulation tool of an old villa to verify the results [17].
Similarly, in another study conducted by a researcher from the Public Authority for Applied Education and Training (PAAET), the author proposed modifications to the 1983 ECCPB code, based on iterations conducted on seven building case study scenarios of typical villas using the building simulation program TRNSYS. However, the impact of the proposed retrofitting modifications was not tested in practice [18].
Another study conducted by KISR investigated the effectiveness of the various ECCPB editions and concluded that both the 1983 and 2010 editions of the ECCPB were not effectively enforced in the construction of residential villas in Kuwait. The author arrived at this conclusion by conducting an energy simulation analysis of a prototypical residential villa complying with both editions of the code and found that, had the codes been enforced, then the result would have been a reduction in energy consumption of 12% from complying with the 1983 edition and of 31% from complying with the 2010 edition [19]. In conclusion, most of the published literature on using retrofitting strategies to reduce villa electricity consumption is based on building energy simulation tools [19,20,21,22,23].
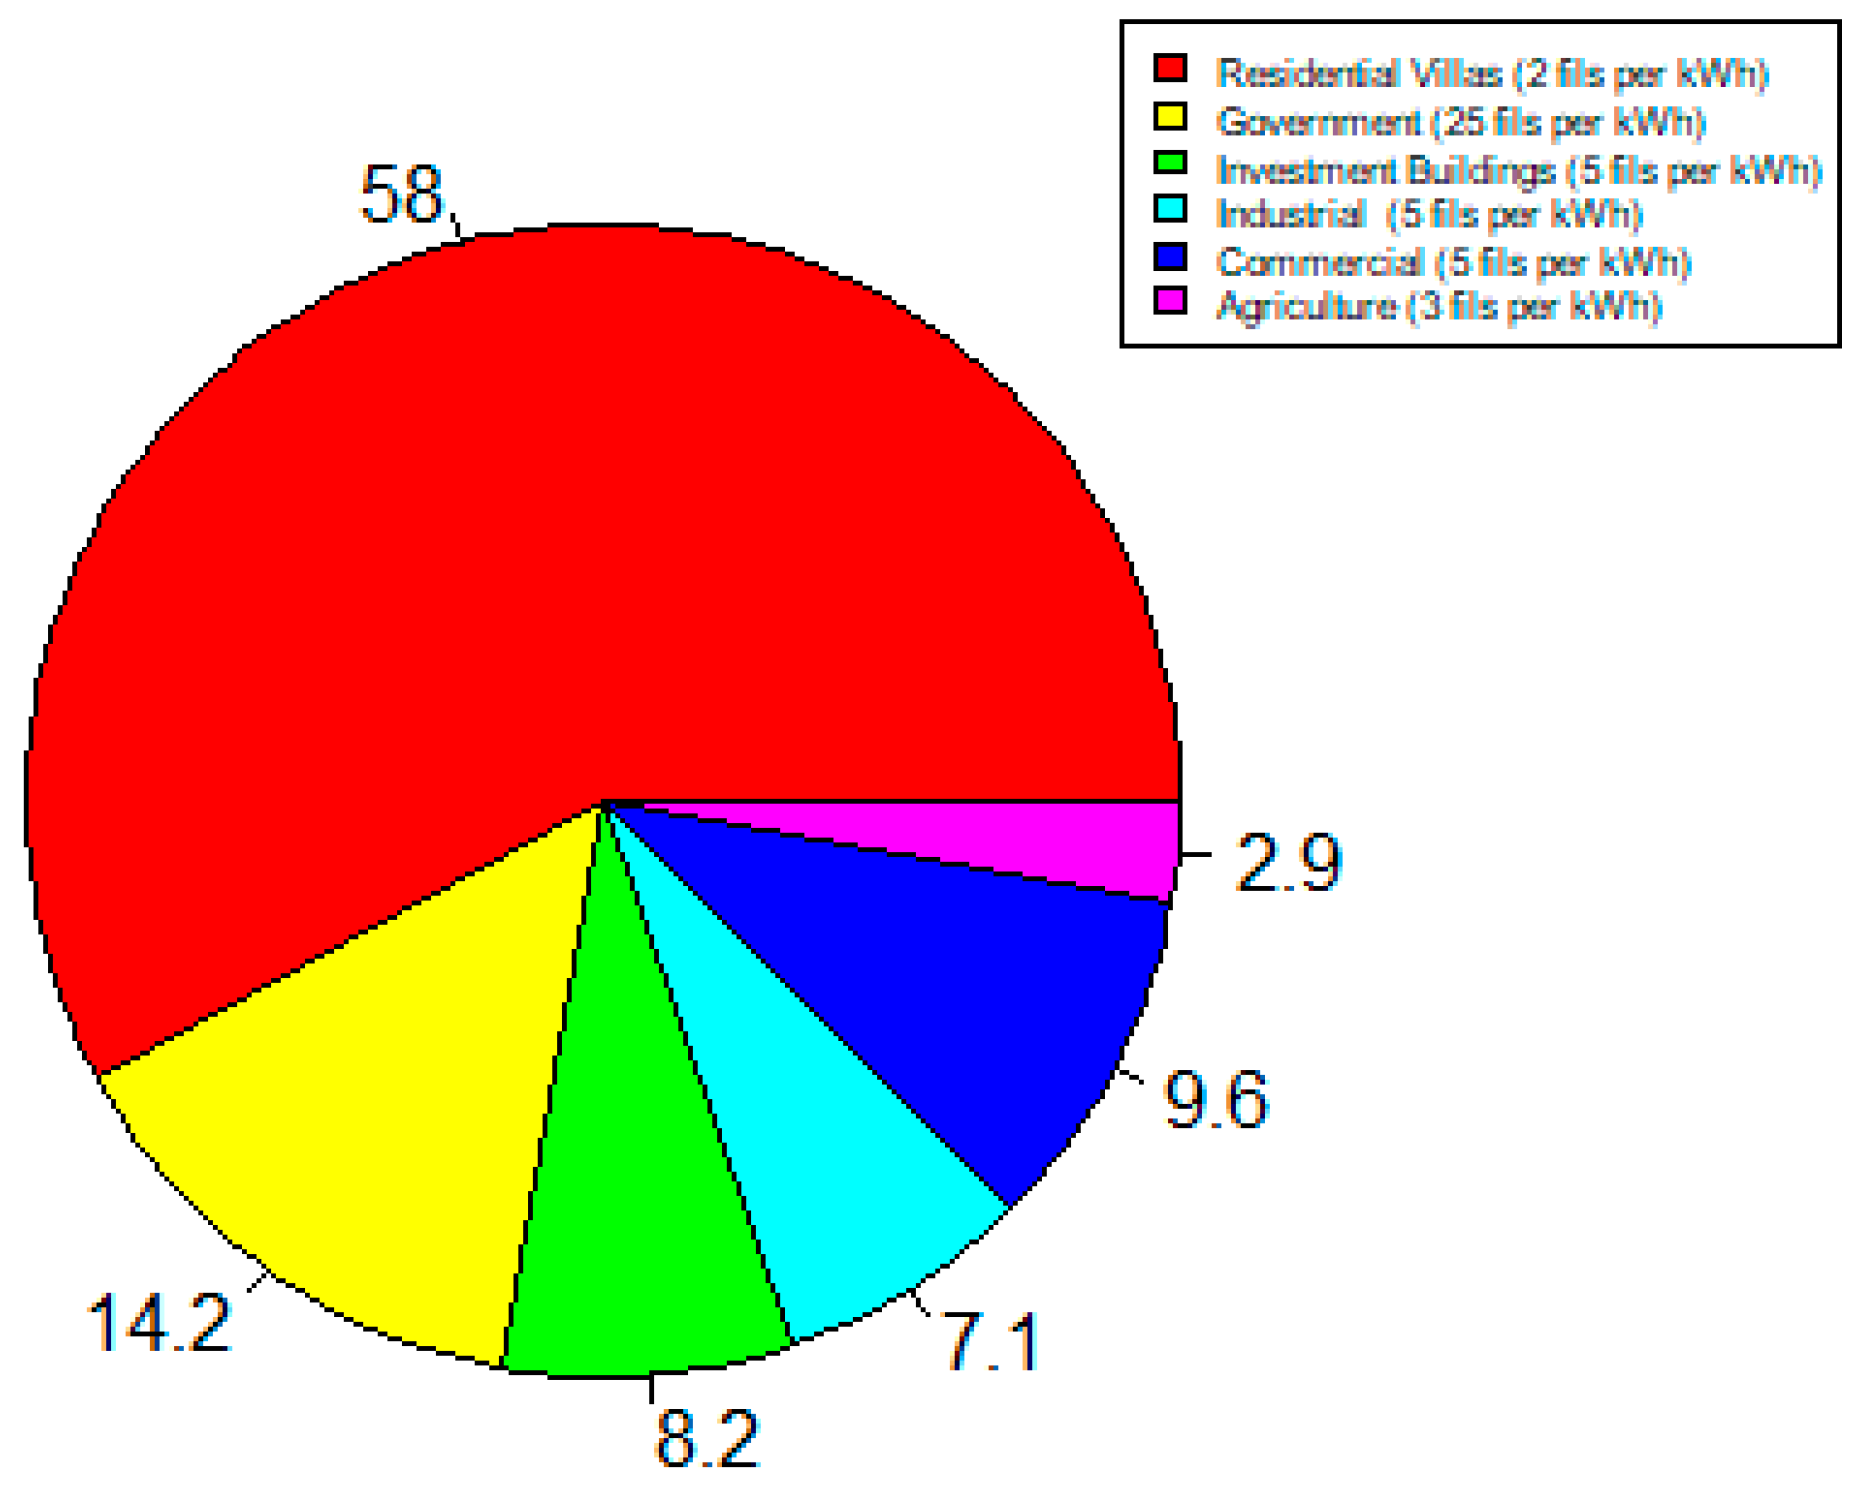
Despite regular updates to the ECCPB, the annual and monthly statistical reports of MEWRE continue to show a steady increase in electricity consumption in villas [24]. In 2023, the villas’ sector registered the highest proportion (58%) of electricity consumption for electrical installations in Kuwait. Moreover, electricity was sold to households at a flat rate of 2 fils/kWh (USD 0.007/kWh), which is the highest electricity tariff subsidy offered to Kuwaiti building sectors; this price is less than 5% of the real electricity generation costs [2]. However, 60% of that electricity consumption was for cooling, which is essential for residents of Kuwait where summer temperatures reach as high as 53.2 °C (127.7 °F). With temperatures increasing gradually since 1992, the demand for electricity for cooling purposes has also been increasing gradually, reaching its maximum daily load in July 2023 [9] (see Table 1).
This article presents the results of a study conducted between 2018 and 2023, which aims to provide new insights into Kuwaiti villas’ electricity consumption across all of Kuwait’s six geographical governorates; it does so by examining monthly electricity meter readings carried out over three-, four-, and six-month consecutive intervals over the five-year period. The data collected have much higher granularity than that of all previous studies; the data are analyzed to determine seasonal variations in electricity consumption and to identify which factors are highly likely to impact residents’ electricity consumption in Kuwaiti villas. This study is based on a large dataset obtained from monitoring 150 villas and responds to a gap in the published literature on the Kuwaiti housing stock’s energy performance.

1.5. The Resdiential Building Sector in Kuwait

The residential sector in Kuwait is categorized into three building types: (1) private villa housing, (2) social villa housing, referred to as model homes, and (3) investment housing, i.e., high-rise apartment buildings. In Kuwait Municipality, referred to as Baladia, the residential sector’s private villas and social villas are considered to be villa housing intended mainly for the use of Kuwaiti single- or multifamily units; whereas, all investment housing apartment buildings are intended for Kuwaiti nationals and expats. Most expats reside in investment housing apartment buildings and are excluded from the planning of the Kuwaiti residential neighborhoods that are planned for private villa housing and social villa housing. Due to real estate legislation, expats are unable to own property in Kuwait. Consequently, they reside in properties that they rent out from private Kuwaiti landlords or real estate companies [25].
In 1954, Kuwait’s government established a welfare system financed by oil revenue that provided eligible Kuwaiti citizens with government housing. The Public Authority for Housing Welfare (PAHW) manages government housing in Kuwait [25]. The Kuwaiti villas’ plot size, maximum number of floors, and maximum built up area have gone through various iterations since the establishment of the PAHW, with the plot size de-creasing by more than half since its inception [26]. This reduction in plot size is due to rapid urban expansion, leading to a lack of available land for housing and a construction pace that is too slow to meet the increasing housing demand due to Kuwaiti population growth [11]. While the size of plots for villas has changed since the 1950s, the government standardized plot sizes for villas in the early 1980s, with 400 m2 per plot to be allocated to Kuwaiti nationals by the PAHW. A specific set of building codes was established, setting specific building setbacks on the plots and the percentage of plot-built areas; compliance is compulsory [4,26]. Since then, most villas for average Kuwaiti families occupy equal plots of 400 m2. Moreover, Kuwait Municipality building codes mandate that the maximum number of floors for villas is three; whereas, the maximum number of floors for the investment housing apartment buildings is forty [27]. The percentage of electricity customers in the residential sector continues to increase as the Kuwaiti population increases, and the total number of villas has reached 163,434 [1]. This study focuses on villas’ electricity consumption, because villas have the highest electricity consumption, and the highest electricity tariff subsidy compared to other buildings [24] (see Figure 1). Furthermore, villas are populated mostly by Kuwaiti nationals, and this percentage is expected to increase in the coming years [1,24].

1.6. Kuwait Residential Neighborhoods and Villa Building Codes

Architecture in Kuwait City in the pre-oil period consisted of clusters of courtyard houses for single and/or extended families. This vernacular form was replaced in 1951 with the modern versions that were developed by British planners Minoprio, Spencely, and P.W. Macfarlane [28]. In 1955, the Kuwaiti Government enforced building codes for residential villas that must be adhered to, specifying maximum building heights, the floor–area ratio (FAR), and plot line setbacks. The 1951 building code was amended in 1955 and then later in 1961; it was followed by other editions in 1979 and in 1985, and it has remained unchanged since then, with requirements and specifications that are still used today [29]. Moreover, the formation of Kuwait’s oldest governorates was the result of an expansion that began in the early 1950s from Kuwait’s earliest settlement, which was a small, walled town whose natives needed to be in direct proximity to the coast for fishing, pearl diving, and trade, which were their sources of livelihood. With the discovery of oil and the first master plan in 1952 and the expansion of housing beyond the town wall, the old town became Kuwait City; Hawalli was constructed near the coast to benefit from cooling sea breeze, while more expansion was undertaken along the coastal road towards Al Jahra and beyond [26].
In addition to the differences in proximity to the coast between Kuwait’s six governorates, there is also a difference in land value. The continuous transfer of public land to private owners at prices significantly below the market rate has resulted in an imbalance in the market, and eventually, villas and plots closer to Kuwait City took on higher monetary value than the villas and plots in governorates further away from the city center. Moreover, the PAHW stipulated a minimum of 400 m2 plot size for villas, which resulted in a sprawling city with neighborhoods and governorates built further away from the coast and city center [26].
The PAHW randomly allocates plots to Kuwaiti nationals via lottery-style draws to ensure the homogenous and equitable distribution of plots among Kuwaiti nationals throughout Kuwait’s neighborhoods and, thus, its governorates. However, through an unofficial practice, PAHW employees have put citizens who want to swap plots in contact with each other to secure plots in neighborhoods that are mainly populated by people of similar tribal or ethnic backgrounds to sustain proximity to family-based residential clusters. This practice mirrors natives’ preference to live among those from the same ethnic or tribal background as them, as was practiced in pre-oil Kuwait towns [4].
Despite Kuwait being classified as one of the hottest places in the world, the Kuwait Municipality building codes do not include requirements specifically geared towards reducing direct solar radiation on villas’ fenestration. Although researchers have proven that fixed shading devices reduce energy loads for cooling villas, and although the optimum solar orientation of villas can provide better indoor living environments and reduce the electricity consumption required for cooling, proper shading strategies have not been considered in refining the quality of solar radiation in Kuwaiti villas [20]. Shading strategies are necessary, particularly when designing a villa with a small plot size and facades with unfavorable solar orientations. In fact, certain sections of the residential building code enforce the opposite regulations, mandating that certain building elevations are exposed to direct sunlight through setbacks. For example, section two of the code states that, when designing a new private villa, setbacks to neighboring villas with a building footprint of less than 750 m2 must be a minimum of 1.5 m, resulting in a distance between two adjacent villas of at least 3 m. As for the setback values for building footprints of 750 m2 or more, there must be a minimum of 2 m, resulting in a distance between two adjacent villas of at least 4 m [27].
Moreover, no section in the code provides guidance for facade shading devices. However, section six of the code states that protrusions are permitted on villa façades to beautify the elevations, on the condition that the protrusions’ depth does not exceed 50 cm, regardless of the width or height of the window. While there is no building code focused on intercepting direct sunlight into the building through its fenestrations, section seven of the code supports the utilization of lightwells to permit daylight and natural ventilation into the villa [27]. While this code has the potential to increase daylight, it also leads to an increase in the building envelope surface area that causes more unwanted heat gain due to extreme temperatures differences between the outside and inside temperatures of the villas during the summer months.
While there have been various editions of the building code, these editions have gone through modifications to allow for an increase in the villas’ sizes. In 1996, Kuwait Municipality permitted the use of more land for the expansion of villa sizes, which led to many homeowners undertaking refurbishment works that added an additional floor or an additional space to their villas [8,30]. Then, in 2000, further allowances permitted the construction of an additional 120 m2 to the allowed built area [30] (see Table 2).
In conclusion, Kuwait governorates may hold other key drivers of electricity consumption in Kuwait’s residential sector; these must be considered when developing building codes and energy codes to meet Kuwait’s objective of improving the energy efficiency of Kuwaiti villas. Drivers that possibly impact the electricity consumption in villas include the behaviors and attributes of individuals of different tribal or ethnic backgrounds, household members’ economic wealth, climate differences due to geographic proximity to the coast, climate differences due to geographic location within the desert, microclimate due to the size of villas, plot sizes, setbacks and neighborhood design, and differences in energy performance due to compliance with a particular edition of the ECCPB code.
While adhering to the ECCPB code should reduce residential villas electricity consumption, researchers have found that the anticipated outcomes in energy reductions have not been met through compliance with the ECCPB code [14]. There are three institutions involved in the modification of the ECCPB code. The primary enforcer of the code is the MEWRE, and the other two institutions involved are the Baladia and the Ministry of Public Works (MPW). The role of the MEWRE is to approve the W/m2 for calculations and lighting, approve all electrical drawings to obtain a building permit from Baladia, approve all energy conservation measures, and approve kW/t for air conditioning systems and equipment. The Baladia’s role is to approve compliance with zoning regulations and perform inspections during the construction of insulation materials and glazing specifications. Finally, the MPW’s responsibility is the testing and certification of building materials, including all insulation materials and systems. While each government institution’s responsibilities are clearly defined, inadequate coordination among the various institutions results in challenges, such as the continuous increase in energy consumption, as building energy efficiency by itself is not sufficient. Residents continue to engage in the same patterns of electricity consumption, irrespective of the construction quality of their buildings, by continuing to excessively use A/C units and other appliances, as well as electric lighting during daylight hours [3] (p. 48).
Residents lack awareness about how their villas’ construction quality, particularly that of the roof and externally facing walls without or with inadequate wall and roof insulation and/or high thermal mass, will impact the rapidity of the loss of any coolness generated by A/C units. The tendency to keep A/C units on all the time and the lack or irregularity of their maintenance contribute to excessive electricity consumption, which the government absorbs through high subsidies and the continuous building of new electricity generation power stations. The combination of building occupants’ high electricity consumption with no major consequences on their electricity bills, the poor quality of the buildings’ envelopes in terms of thermal insulation and energy efficiency, and the unsustainable behavioral patterns of the building occupants transferred through several generations are likely to continue exacerbating the problem [3] (p. 48).

1.7. Data Collected from 150 Villas from Kuwait’s Six Governorates

As mentioned above, other researchers have conducted studies with the aim of improving the energy efficiency of residential villas in Kuwait. However, while there are many reasons for excessive electricity consumption in residential villas in Kuwait, exacerbated by increasing summer temperatures, the availability of accurate data with a high level of granularity remains extremely limited. Moreover, there is no law that obligates ministries to share electricity datasets for academic purposes. Ministries have the discretion to approve or deny data access requests based on internal policies.
The literature review conducted in the previous section revealed that none of the previous studies have measured electricity consumption by collecting data directly from the individual villas’ electricity meters, relying on a large sample of villas taken from all governorates and over an extended period. The various methods that have been proposed to address Kuwaiti villas’ high electricity consumption and the factors that are likely to influence them included statistical modeling, survey-informed estimates, and energy simulation. However, these studies mainly relied on (1) a large sample of aggregated annual electricity consumption of various building types, including villas drawn from selected neighborhoods and governorates provided by Baladia and MEWRE, without access to monthly electricity consumption data, (2) villa residents’ self-reported one-figure utility bill (for both water and electricity) that was obtained through oral interviews, and (3) the small sample of villas’ weekly electricity meter readings over the span of a year. While these methods provided useful insights into villas’ electricity consumption, the aggregated annual electricity consumption failed to account for seasonal changes in villas’ electricity consumption across the year, the datasets provided by Baladia and MEWRE to re-searchers was limited to selected neighborhoods and governorates, the self-reported single utility bill combining water and electricity charges was ineffective in providing an accurate representation of villas’ electricity consumption and was limited to the willingness of the Kuwaiti people to disclose personal information for research, and the small sample of villas’ weekly electricity meter readings were too small to reflect national-level villa electricity consumption. In contrast, the method proposed in this study did not utilize secondary data nor did it use interpolation techniques to adjust for sampling imbalances. Rather, the study relied entirely on real, primary data collected from photographs of a large sample of villas’ analog electricity meters’ monthly readings and was collected from villas from Kuwait’s six governorates over an extended period.
The limited availability of accurate and up-to-date data that are available in academic literature and in governmental institutions, including research ones, indicates an urgent need to conduct research that is both rigorous and longitudinal. This is necessary to provide sound evidence that informs future energy consumption policies in the housing sector.
This study aims to address this gap and, for the first time, provides an analysis of monthly electricity meter readings for a large sample of 150 residential villas. The data collection was carried out between 2018 to 2023 by the residents of the villas. Data were collected from villas’ electricity meters in Kuwait’s six governorates as part of an architectural design module taught at Kuwait University by the main author, encouraging students’ awareness of their energy consumption in their own villas. The data collected anonymously during several design studio sessions over a period of five years are analyzed to investigate the following questions:
  • Are there major variations in monthly and yearly electricity consumption between single-family villas in Kuwait according to the governorate where they are located and between those located in the same governorate or between the samples within each governorate and between governorates, according to the month and year in which the data were collected?
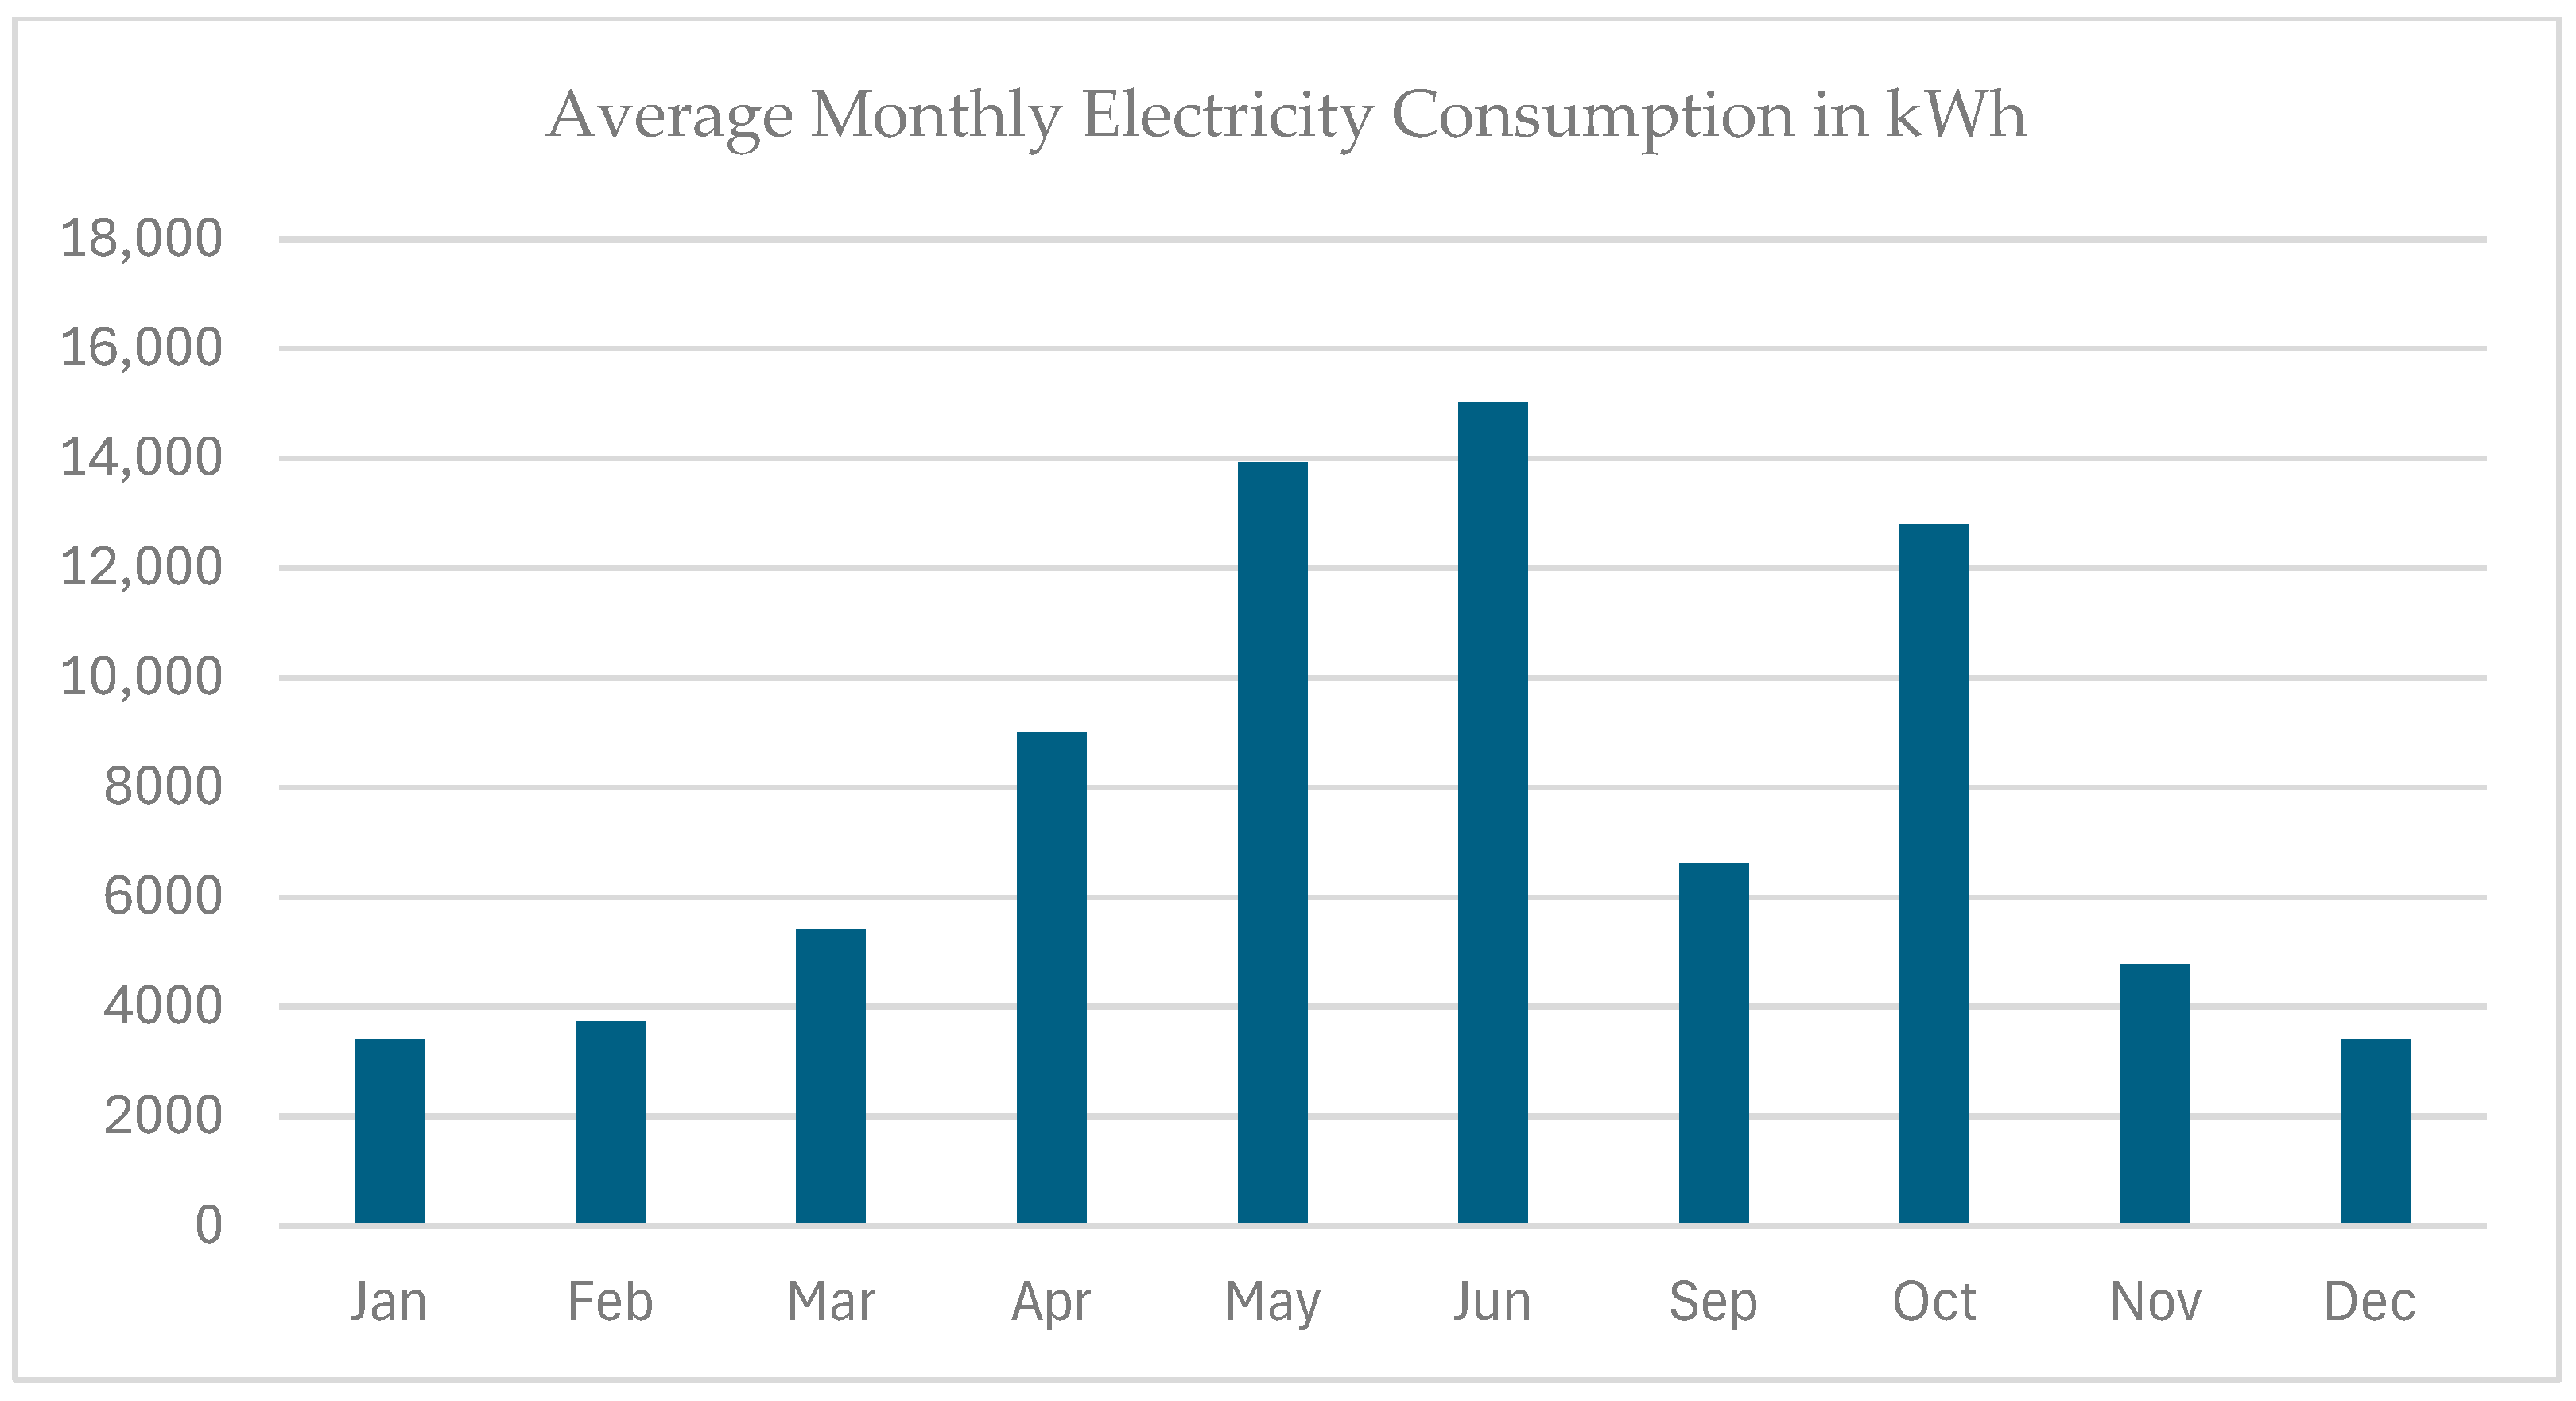
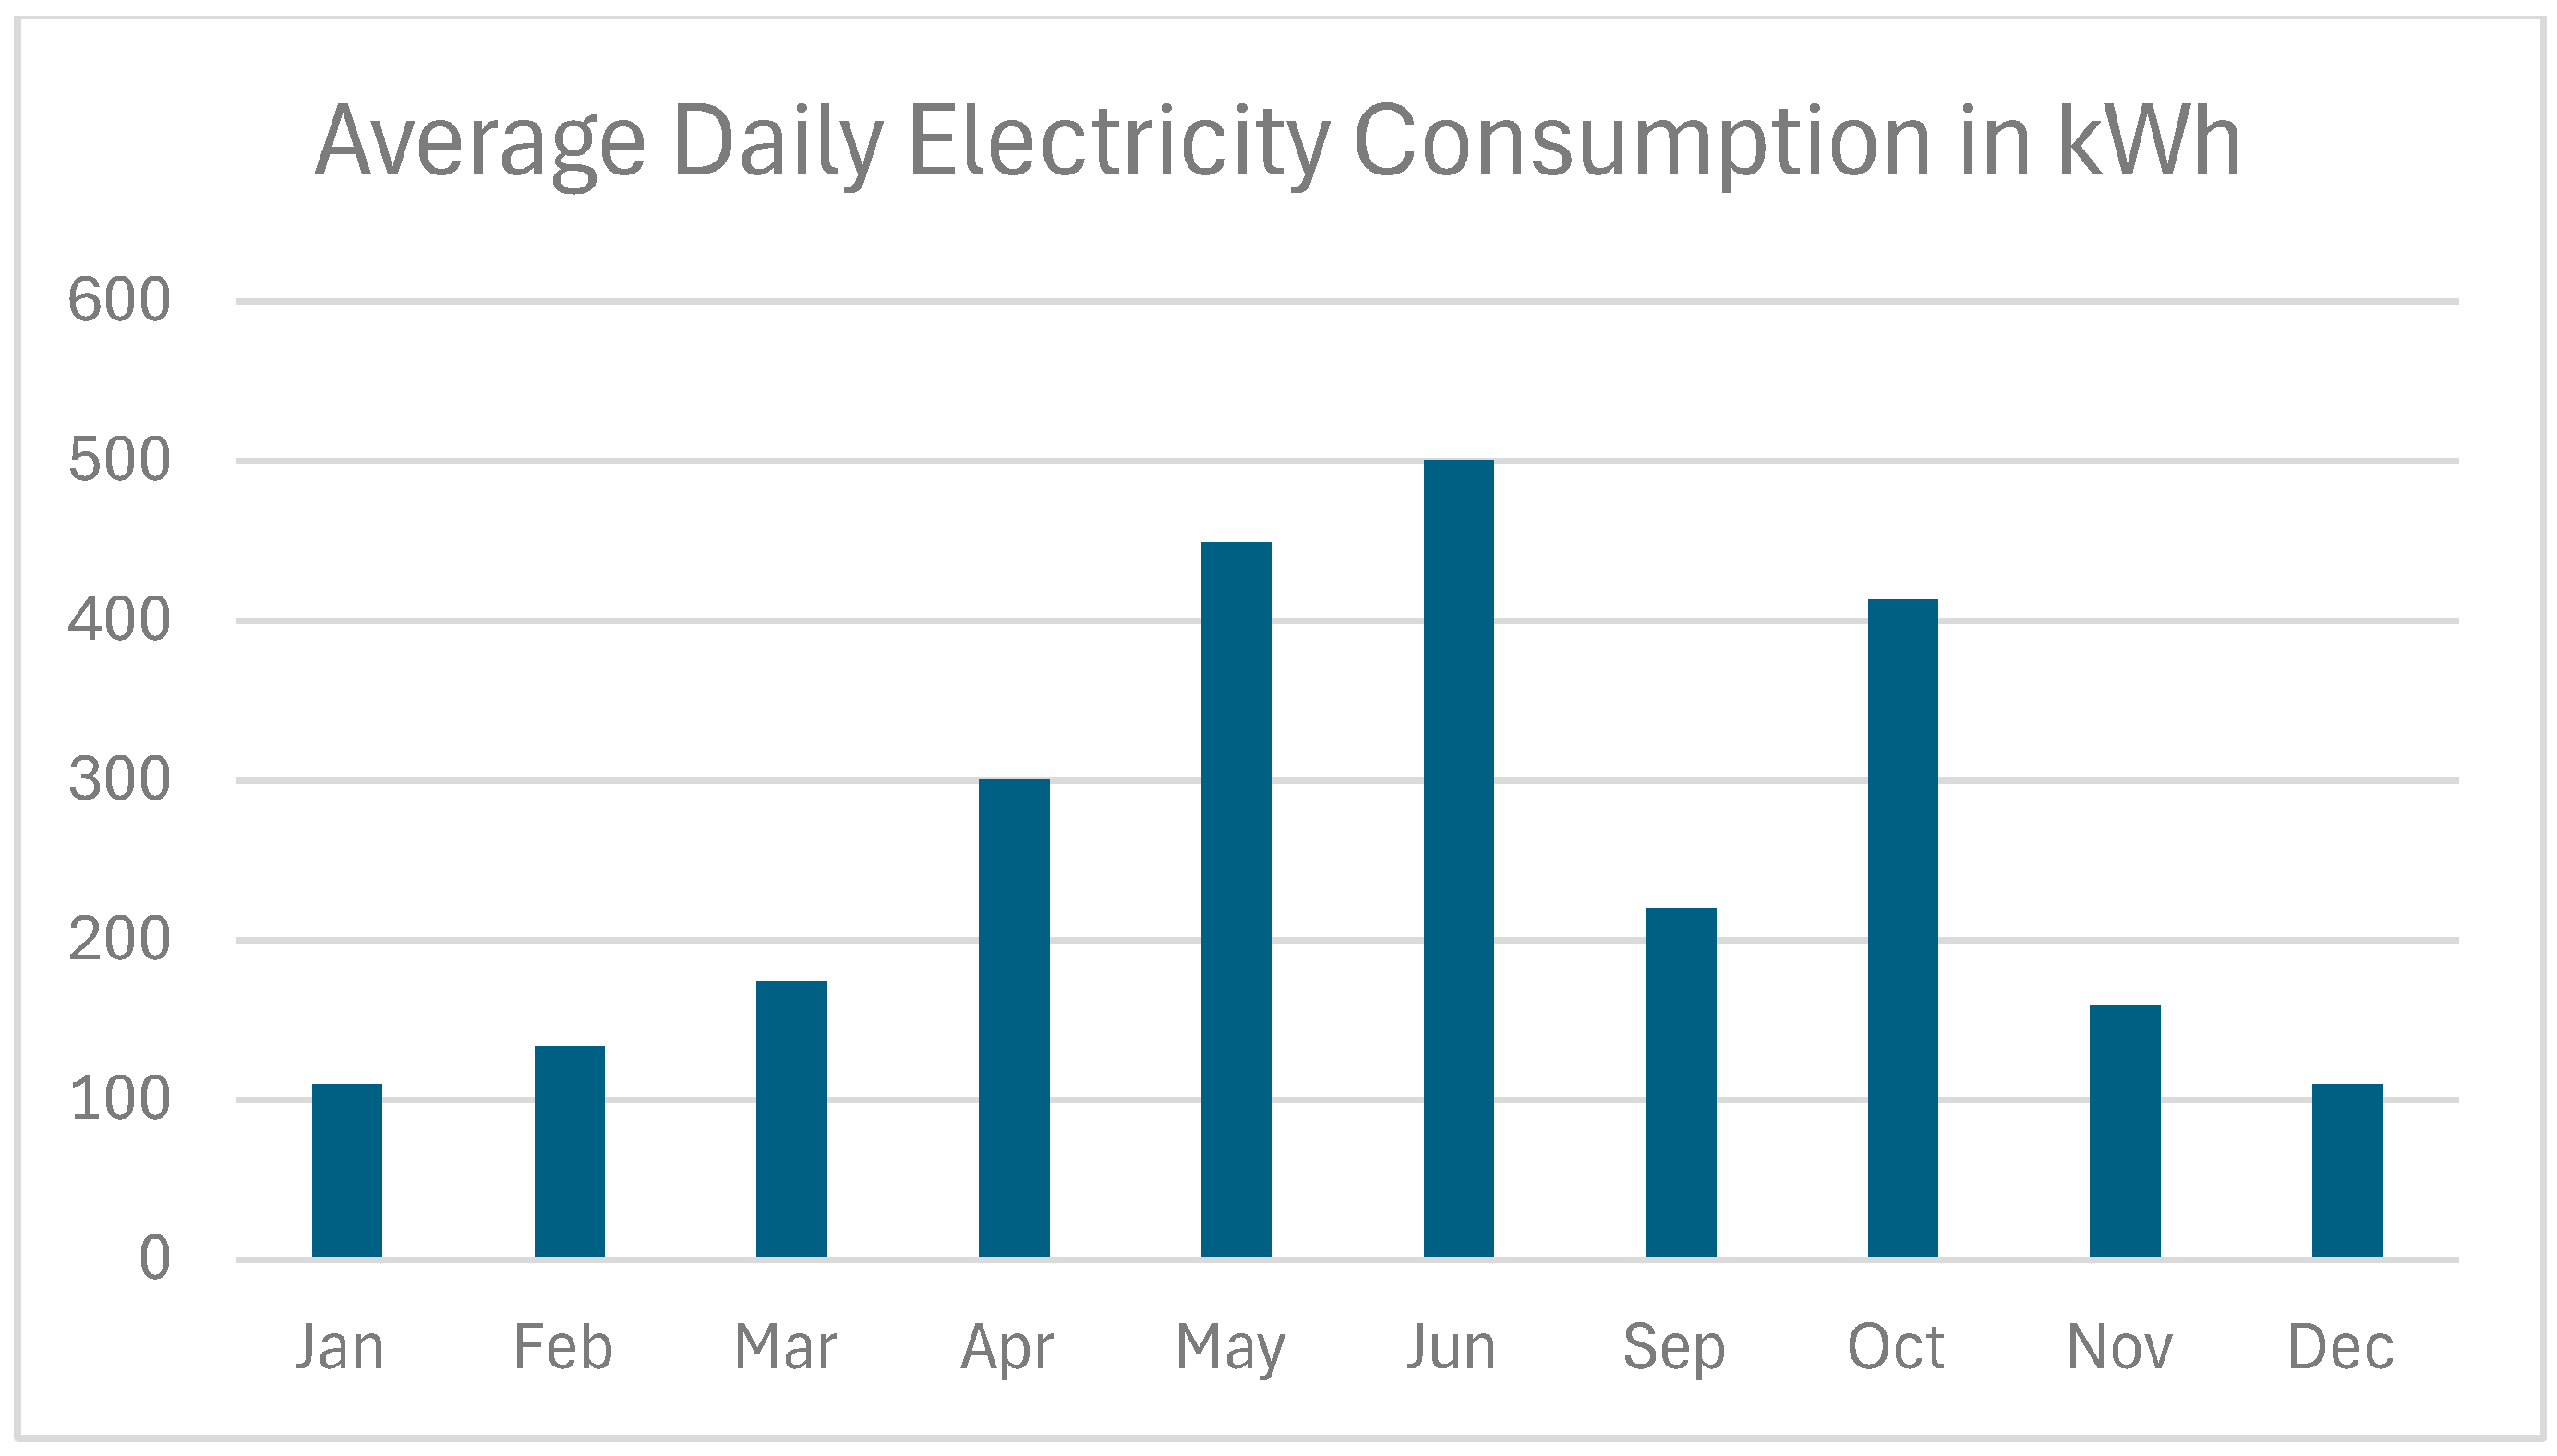
  • What are the averages of energy consumption in villas based on monthly readings of electricity consumption meters collected over several months between 2018 and 2023 in the six Kuwait governorates?
  • What are the highest and lowest electricity consumption levels in the sub-samples in each governorate, and how do they compare between the different governorates?
  • Which factors impact on the villas’ electricity consumption? We study this by examining correlations between recorded monthly electricity consumption and each of the following factors: the villa’s year of construction, the villa’s plot size, the villa’s number of floors, and the number of occupants.
  • We investigate whether there are major variations in the data between the months and years when the measurements were taken.

2. Materials and Methods

This paper provides new insights into the nature of the Kuwaiti villa housing stock’s overall electricity consumption and attempts to identify the factors that are likely to affect it. The targeted objectives include (1) calculating villas’ average monthly electricity consumption, (2) calculating villas’ average daily electricity consumption, (3) calculating villas’ overall average monthly electricity consumption according to the governorate, (4) mapping and characterizing the existing housing stock according to the actual monthly monitored electricity consumption, (5) identifying the common characteristics of residential villas with high electricity consumption, (6) quantifying the energy impact of architectural drivers on the monitored monthly electricity consumption, and (7) identifying the key factors that negatively impact energy consumption in Kuwait’s residential villa sector.

2.1. Sampling the Case Study Villas in Kuwait’s Six Governorates

The population in Kuwait consists of approximately 30% Kuwaitis and 70% expats [1]. Kuwait is divided into six governorates (see Figure 2 and Figure 3), and there was an increase in housing stock in all six governorates between 2011 and 2023. When examining the rate of increase in housing units during that period, it was found that Al Jahra witnessed the highest increase at 128.5%, followed by Al Ahmadi at 59.4%, Al Asimah at 57.6%, Al Farwaniya at 44.8%, Hawalli at 26.7%, and finally, Mubarak Al Kabeer at 22.3% (see Table 3) (see Figure 4).
In terms of population, the statistics for 2023 indicate that Al Farwaniya was the most populated governorate. Al Ahmadi has the highest proportion of Kuwaiti nationals and Al Farwaniya has the highest number of expatriates (see Table 4) (see Figure 5). In terms of the proportion of electricity installation per governorate, Al Ahmadi and Al Farwaniya had the highest proportions of installations, 34% and 21%, respectively, in 2022. However, these statistics do not provide a detailed picture of how much electricity is consumed in the different types of housing (see Figure 6).
Residential areas are divided into low-density, single-family villas that are intended for Kuwaiti nationals and high-density apartment buildings that are intended for expatriates [25] (p. 9). Furthermore, private villas have the largest share of electricity consumption, at 58% of total electricity consumption, including all other sectors [24] (see Figure 1). However, even though most of the population consists of expatriates, who live in apartment buildings, most of the electricity consumption, which is highly subsidized by the Kuwaiti government, comes from villas occupied by Kuwaiti nationals and expatriate domestic staff, such as cleaning staff and drivers. In 2020, the number of expatriate domestic staff living in villas with Kuwaiti nationals was approximately 739,000, which is a ratio of one expatriate domestic staff member for every two Kuwaiti nationals [25] (p. 12). As mentioned above, this study focuses on villas’ electricity consumption, because villas have the highest electricity consumption and the highest electricity tariff subsidies compared to other buildings [24] (see Figure 1). Furthermore, villas are mostly occupied by Kuwaiti nationals, and this percentage is expected to increase in the coming years [1,24] (see Table 5 and Figure 7).

Data Collection Method

The sample of villas for this study was collected through Kuwait University’s Kuwaiti students. Because KU is a public university that provides government-funded education for Kuwaiti citizens, it was possible to collect data for a large sample of villas occupied by Kuwaiti families from all six governorates. The sample of villas investigated in this study represents a diverse socio-economic and cultural stratum in Kuwait. The stratified sample of 150 built villas was investigated to identify patterns of electricity consumption and to determine how these vary between Kuwait’s six governorates. The data collected for this study were gathered over five years and through a sequence of academic modules delivered between 2018 and 2023.
Each student was asked to monitor the electricity consumption of their own villas by taking a photo of their villa’s analog electricity meter (installed in the 150 villas) on the first day of every month and by providing a description of their dwelling in terms of the year of construction, plot size, number of floors, and number of occupants. The dataset consisted of monthly electricity meter readings carried out in consecutive intervals over three, four, and six months in the five-year period from 2018 to 2023. Because the data were collected during academic semesters, no data were collected during KU’s official summer holiday months in July and August. The statistics in the pie chart (see Figure 8) were provided long after the random sampling of villas was completed and are based on the students attending the architectural module delivered by the main author.
When examining the characteristics of the villas sampled in this study, their distribution between Kuwaiti governorates varies, with more than two thirds of the villas being in the Al Asimah and Hawalli governorates, with almost equal sub-samples representing 34% and 35%, respectively, of the whole sample of 150 villas. Approximately one third of the villas monitored were from Al Farwaniya, Al Jahra, and Mubarak Al Kabeer, with the smallest monitored sample size villas from Al Ahmadi governorate (see Table 6).

2.2. Determining Variations Between the Samples Within Each Governorate and Between Governorates According to the Month and Year in Which the Data Were Collected

The dataset was analyzed using descriptive statistics, as well as by testing possible correlations between recorded electricity consumption and the villas’ physical attributes, the number of occupants, and the governorate location. Data analysis was performed using the R programming language and Microsoft Excel. The statistical tests used were descriptive data and more advanced statistics, including the t-test, Pearson’s Chi-squared test, the Fisher test, and the ANOVA test. These tests were utilized to investigate possible correlations between variables to identify factors affecting electricity consumption. Statistical analyses were conducted on the entire 150 samples of villas; this was followed by further analyses of a sub-sample of the 19 villas with the highest electricity consumption.
The dataset included 150 villas with a diverse range of physical attributes in terms of construction, spanning the years from 1960 to 2021, villa plot sizes that ranged from 300 m2 to 2000 m2, and a number of floors ranging from a minimum of one floor to a maximum of four floors. There was a large range of occupants, ranging from a minimum of 3 to a maximum of 34 (see Table 7). The electricity meter readings were collected for the months of January, February, March, April, May, June, September, October, November, and December, with the highest number of monthly electricity meter readings recorded for the month of December and the lowest for the months of May and June (71 and 18, respectively) (see Table 8). Furthermore, the villas’ electricity meter readings were collected for all six governorates for the years spanning from 2018 to 2023, with the maximum number of years recorded for the Al Asimah governorate and the minimum number of years for Al Ahmadi governorate, with five years and one year, respectively (see Table 9).

2.3. Averages of Energy Consumption in Villas Based on Monthly Readings of Electricity Consumption Meters Collected over Several Months Between 2018 and 2023 in Kuwait’s Six Governorates: Calculating Villas’ Average Monthly Electricity Consumption and Villas’ Average Daily Electricity Consumption

The entire dataset was analyzed to determine the villas’ average monthly electricity consumption across the entire period of study from 2018 to 2023. It was found that the average monthly electricity consumption from lowest to highest was as follows: January (3398 kWh), December (3401 kWh), February (3738 kWh), November (4772 kWh), March (5415 kWh), September (6612 kWh), April (9017 kWh), October (12,806 kWh), May (13,927 kWh), and June (15,019 kWh). The study did not include the months of July and August, because no data were collected for these two months, as mentioned previously. Furthermore, the maximum average monthly electricity consumption was 15,019 kWh in June, and the minimum average monthly electricity consumption was 3398 kWh in January (see Table 10 and Figure 9).
The monthly averages were then analyzed further to calculate the average daily electricity consumption. This was achieved by dividing the average monthly electricity consumption by the number of days in each month. It was found that the average daily electricity consumption from lowest to highest was as follows: January and December (110 kWh), February (134 kWh), November (159 kWh), March (175 kWh), September (220 kWh), April (301 kWh), October (413 kWh), May (449 kWh), and June (501 kWh) (see Table 11 and Figure 10).

2.4. Average Energy Consumption in Villas Based on Monthly Readings of Electricity Consumption Meters over Several Months Between 2018 and 2023 in Kuwait’s Six Governorates: Calculating Villas’ Overall Average Monthly Electricity Consumption According to Governorate

Further analysis of the dataset revealed that there were differences in the villas’ electricity consumption across the governorates. The average monthly electricity consumption of the villas was calculated for each governorate for the months of January, February, March, April, May, June, September, October, November, and December. Then, the overall average monthly electricity consumption was calculated for each governorate. It was found that the overall average monthly electricity consumption per governorate from lowest to highest was as follows: Mubarak Al Kabeer (3163 kWh), Hawalli (6097 kWh), Al Jahra (6268 kWh), Al Asimah (7794 kWh), Al Ahmadi (7952 kWh), and Al Farwaniya (15,426 kWh) (see Table 12).

2.4.1. Comparison Between the Al Farwaniya Governorate’s Villas, with the Highest Overall Average Monthly Electricity Consumption, and the Mubarak Al Kabeer Governorate’s Villas, with the Lowest Overall Average Monthly Electricity Consumption

It was found that the Al Farwaniya governate had the highest overall average monthly electricity consumption, with a value of 15,426 kWh; whereas, the Mubarak Al Kabeer governate had the lowest, with a value of 3168 kWh. Furthermore, most of the villas with the highest average monthly electricity consumption were in the Al Farwaniya governorate, while most of the villas with the lowest average monthly electricity consumption were in the Mubarak Al Kabeer governorate (see Table 12).
The Al Farwaniya governorate was investigated further to gain insight into the factors influencing its high average monthly electricity consumption. A table was generated, illustrating the mean number of occupants, mean plot size, average electricity consumption per year, and sample size per governorate. The Al Farwaniya governorate was found to have the highest mean number of occupants and the second highest mean plot size. This investigation suggests that the number of occupants and the plot size are factors influencing villas’ high electricity consumption (see Table 13).
To compare the Al Farwaniya and Mubarak Al Kabeer governorates, the t-test method was used for both governorates, because both sample sizes were too small. The method was applied to data collected in April only, because the April dataset was the largest. As for the remaining months of the year, the available dataset was too small to conduct the test. The data used for the t-test are given in Table 14.
The results of the two samples’ t-tests are as follows:
Data: April by governorate
t = 2.7794, df = 7.2567, p-value = 0.01318
Alternative hypothesis: true difference in means between the Al Farwaniya group and the Mubarak Al Kabeer group is greater than 0
95 percent confidence interval:
2842.253 Inf
Sample estimates: 0
The mean in the Al Farwaniya group is 11,874.800, and the mean in the Mubarak Al Kabeer group is 3046.667.
Since the p-value of 0.01318 is smaller than 0.05, the null hypothesis is rejected. This means the alternative hypothesis is accepted, and the true difference in means between Al Farwaniya and Mubarak Al Kabeer is greater than 0. Therefore, the mean electricity consumption of the Al Farwaniya group is greater than that of Mubarak Al Kabeer.
To check the dependency between variables for the entire dataset, Pearson’s Chi-square test and the Fisher information test were used. These tests were used to identify any statistically significant correlations explaining the variation in electricity consumption in Kuwaiti villas. No evidence of dependency was found between variables.
This lack of evidence could be due to the comparison between Al Farwaniya’s five villas with Mubarak Al Kabeer’s six villas during the month of April, a spring month. Despite outdoor temperatures being relatively high in Kuwait during the month of April, mechanical air conditioning systems, which are identified in Section 1.1. as a major cause of high electricity consumption in Kuwaiti villas, might not have been operating at full capacity during April.

2.4.2. Identifying the Villas with the Highest Monthly Electricity Consumption Within Each Governorate and Comparing These Between the Different Governorates: Identifying the 19 Villas with High Electricity Consumption from All Six Governorates

To understand which variables are correlated with electricity consumption in villas, the dataset was filtered to include only the villas with high electricity consumption (≥18,000) in any given year to check for any similarities between them. From the 150 villas, only 19 had high electricity consumption (≥18,000) in any given month. Table 15 shows the filtered data including only the villas with high electricity consumption regardless of the month or year of the monitored electricity meter reading.
Of the 19 villas with high electricity consumption that were investigated, 48% were from the Al Asimah governorate, 21% were from the Al Farwaniya and Hawalli governorates, and 5% were from the Mubarak Al Kabeer and Al Jahra governorates (see Figure 11).

2.5. Factors Influencing High Electricity Consumption

The factors that are likely to be associated with the recorded 19 villas’ high electricity consumption were investigated. This investigation was achieved by examining possible correlations between the recorded monthly electricity consumption and each of the following factors: the villas’ (1) governorate location, (2) the year of construction, (3) the number of floors, (4) the number of occupants, (5) the plot size, and (6) compliance with the various editions of the ECCPB.

2.5.1. Factors Likely to Be Associated with the Recorded 19 Villas’ High Electricity Consumption: Governorate Location

It was found that the villas with the highest electricity consumption of (≥18,000) in any given month and in any given year had the following common characteristics: 47% of these villas were from the Al Asimah governorate (see Figure 11).
As mentioned in Section 1.6, the Al Asimah governorate is characterized by higher land values, primarily due to the villas’ plots being located closer to Kuwait City and the coastal area. The properties in the Al Asimah governorate tend to have higher land value, with larger villas, contributing to higher electricity usage. These factors suggest that households in the Al Asimah governorate often have higher socio-economic status; therefore, due to their economic standing, these households may have less concern about electricity consumption. Additionally, the larger size of the villas in this governorate could require more electricity for cooling and other household needs, potentially leading to higher overall consumption.

2.5.2. Factors Likely to Be Associated with the Recorded 19 Villas’ High Electricity Consumption: Year of Construction

It was found that the villas with high electricity consumption (≥18,000) in any given month and in any given year had the following common characteristics: 74% of these villas were built in 1996 and later (see Figure 12).
As mentioned in Section 1.6, prior to 1996, the total floor percentage for villas was 120%, and the total floor area for villas was 600 m2. Then, in 1996, the total floor percentage increased to 170%, and the total floor area increased to 850 m2. This represents a substantial increase in villa size. This increase in the size of the villas has likely contributed to their higher electricity consumption, because bigger villas typically require more electricity for cooling.

2.5.3. Factors Likely to Be Associated with the Recorded 19 Villas’ High Electricity Consumption: Number of Floors

It was found that the villas with high electricity consumption (≥18,000) in any given month and in any given year had the following common characteristics: 58% of these villas had three floors (see Figure 13). This finding suggests that larger villas are likely to consume more electricity than smaller villas.

2.5.4. Factors Likely to Be Associated with the Recorded 19 Villas’ High Electricity Consumption: Number of Occupants

It was found that the villas with high electricity consumption (≥18,000) in any given month and in any given year had the following common characteristics: 63% of these villas had a number of occupants greater than seven (see Figure 14). It was observed that villas with more than seven occupants have higher electricity consumption than villas with fewer occupants. This could be due to several factors, including the increased use of household appliances, and higher demand for mechanical air conditioning to regulate the indoor air temperature.

2.5.5. Factors Likely to Be Associated with the Recorded 19 Villas’ High Electricity Consumption: Plot Size

It was found that villas with high electricity consumption (≥18,000) in any given month and in any given year had the following common characteristics: 80% of these villas had plot sizes greater than 400 m2 (see Figure 15). Villas built on plots larger than 400 m2 were found to have higher electricity consumption. This could be because more electricity is needed to operate mechanical air conditioning units for cooling.

2.5.6. Factors Likely to Be Associated with the Recorded 19 Villas’ High Electricity Consumption: Compliance with the ECCPB Code

It was found that the villas with high electricity consumption (≥18,000) in any given month and in any given year had the following common characteristics: 63% of these villas were built in compliance with the first edition of the 1983 ECCPB code (see Figure 16). As mentioned in Section 1.1, researchers found little evidence of the anticipated 40% reduction in cooling loads in villas built in compliance with the 1983 ECCPB code. Despite the intentions of the 1983 ECCPB code, the analysis indicates that the code was ineffective in ensuring the construction of energy-efficient villas.

2.6. Major Variations in the Data Between the Months and Years When Measurements Were Taken

To investigate variations in the data between the months and years when measurements were taken in Kuwait’s six governorates, we intended to include weather data as a factor in the analysis. However, due to the unavailability of publicly accessible and accurate weather data for the six governorates from 2018 to 2023, the investigation could not be completed as planned. See Appendix A.1 and Appendix A.2 for the ANOVA and Chi-square tests and the statistical analyses that were carried out for the 150 villas to assess potential variations.

3. Results

3.1. Interpreting the Average Monthly Electricity Consumption in Kuwaiti Villas

The average monthly electricity consumption in villas from lowest to highest is as follows: January (3398 kWh), December (3401 kWh), February (3738 kWh), November (4772 kWh), March (5415 kWh), September (6612 kWh), April (9017 kWh), October (12,806 kWh), May (13,927 kWh), and June (15,019 kWh). As mentioned in the previous section, the study did not include the months of July and August.
The month of October was expected to have a lower average monthly electricity consumption than the month of September, because temperatures in October are cooler than September, and many Kuwaiti villas begin to turn off their air conditioning in October. However, the monitored villas in this study showed high average monthly electricity consumption during this month. Possible factors impacting this high consumption could be related to human behavior other than operating mechanical cooling systems at low temperatures or excessive use of household appliances. Furthermore, it was found that the highest range per month was 193,433 kWh in October. This indicates that the electricity consumption of a particular villa exceeded the average consumption of most villas; therefore, it is important to identify problematic villas that have a substantial impact on the electricity consumption of an entire neighborhood or governorate. It is possible that the high electricity consumption reading may be attributed to a malfunctioning electricity meter, or residence used for other purposes. Such villas must be identified and investigated further on a national scale, as they could be the root cause of the problem of overall high electricity consumption in Kuwait’s residential sector.

3.2. Villas’ Overall Average Monthly Electricity Consumption and Mean Number of Occupants per Governorate

The overall average monthly electricity consumption in villas per governorate from lowest to highest is as follows: Mubarak Al Kabeer (3163 kWh), Hawalli (6097 kWh), Al Jahra (6268 kWh), Al Asimah (7794 kWh), Al Ahmadi (7952 kWh), and Al Farwaniya (15,426 kWh). The mean number of occupants per governorate from lowest to highest is as follows: Al Jahra (8.08), Mubarak Al Kabeer (8.25), Hawalli (8.63), Al Asimah (9.09), Al Ahmadi (12.5), and Al Farwaniya (14).
It was found that the highest overall average monthly electricity consumption and the highest mean number of villa occupants were in villas located in the Al Farwaniya governorate. As mentioned previously, while the PAHW developed a system for equitable plot distribution among Kuwaiti nationals, the unofficial practice of swapping plots has led to concentrations of Kuwaitis with the same ethnic or tribal backgrounds in certain governorates. This could be a possible reason for the variations in the mean number of occupants per governorate. Furthermore, the high overall average monthly electricity consumption in the Al Farwaniya governorate could be due to drivers of human behavior, such as social practices common among tribal or ethnic communities, which could impact thermostat temperature setpoints for operating mechanical cooling systems at lower temperatures; preferences in single-family and extended-family living arrangements could also impact household appliance usage.

3.3. Villas’ Overall Average Monthly Electricity Consumption and Governorate Location

The overall average monthly electricity consumption varied between governorates, indicating that location is an influencing factor in villas’ electricity consumption. Possible explanations for the variation in overall average monthly electricity consumption per governorate are the geographical location of the villas according to the governorates, which determines proximity to the Arabian Gulf and the desert. Villas located near coastal areas typically experience higher humidity due to the evaporation of water from the gulf. The proximity to the ocean may result in more moderate temperature fluctuations in comparison to villas located in governorates that are further inland near the desert, which are likely to experience lower humidity levels and dry air. Thus, the interaction between villas’ geographical locations and their surrounding natural environment influences the microclimate and, therefore, the electricity used to operate villas’ cooling systems according to the desired temperature setpoints for indoor thermal comfort. Moreover, as mentioned previously, the practice of swapping land through the PAHW employees may have led to the concentration in certain areas of certain groups of the Kuwaiti population with shared cultural practices and behaviors regarding the operation of villas’ mechanical systems and appliances; this may have impacted their villas’ electricity consumption.
Moreover, the average monthly electricity consumption of Al Ahmadi was excluded due to insufficient data. Partial surveying, data collection, and published statistical data from MEWRE reports suggest that the average monthly electricity consumption of Al Amadi villas is comparable to that in Al Farwaniya. However, more monthly monitored data on Al Ahmadi villas’ electricity consumption must be collected and analyzed if we are to reach an accurate conclusion.

3.4. Characteristics of High-Electricity-Consumption Villas

The study identified 19 villas from the dataset with high electricity consumption (≥18,000) in any given year; we studied them to gain further insight into the drivers that impact electricity consumption. We found that 48% of these villas were from the Al Asimah governorate, 21% were from the Al Farwaniya and Hawalli governorates, and 5% were from the Mubarak Al Kabeer and Al Jahra governorates. While partial monitored data and published statistical data from the MEWRE reports suggest that the Al Ahmadi villas are comparable to the Al Farwaniya villas, the Al Ahmadi villas were excluded due to insufficient data.
A common characteristic shared among the 19 villas is that 74% of these villas were constructed from 1996 onwards, and 74% of these villas had three floors or more. As mentioned previously, Kuwait Municipality amended the building codes in 1996 to allow for an increase in villa sizes. This provision led to a 40% increase in the size of villas built from 1996, potentially causing an increase in electricity consumption.
Another common characteristic of villas with high electricity consumption is that 48% were villas from the Al Asimah governorate, and 80% of these villas had plot sizes larger than 400 m2. As mentioned earlier, the PAHW stipulated 400 m2 plot sizes for villas built in newly developed neighborhoods and governorates located further away from the coast and city center. The land value and, thus, the homeowner socioeconomic status are higher in neighborhoods and governorates that are located near the coast and city center, such as the Al Asimah governorate, than those further away. This difference in economic status could be a factor impacting the behavior of occupants regarding preferred temperature setpoints, the operation of air conditioning systems, and electricity consumption in their large villas.

3.5. Villas with High Electricity Consumption and the Various Editions of the ECCPB Codes

It was found that 63% of the villas with high electricity consumption were built in compliance with the 1983 edition of the ECCPB code. As mentioned previously, little evidence of the effectiveness of the 1983 ECCPB code was found in practice, and Kuwaiti policy reform strategies include investing in building retrofits to improve energy efficiency. A closer examination of the major differences between the 1983 ECCPB edition of the code and the subsequent versions would aid in identifying the most effective retrofitting strategies to improve the energy performance of villas that were built in compliance with the first edition of the code.

4. Discussion

The MEWRE reported high overall electricity consumption, attributing 58% of the total consumption to the residential sector. However, the data from the sample of 150 villas in this study showed that only 13% of the villas exhibited high electricity consumption, while the remaining 87% had relatively low consumption levels. This suggests that the overall issue of high consumption is not widespread across the entire population of villas but rather concentrated in a smaller subset of villas with high electricity consumption. Therefore, the disproportionate contribution to national consumption is likely primarily driven by this 13% of villas. This finding emphasizes the importance of a targeted approach when formulating energy policies, regulations, and subsidy reforms. Policymakers must be cautious not to implement significant policy changes based on national statistics that fail to identify the true sources of the problem of high electricity consumption in the residential sector. It is important that the government address the underlying issue of high electricity consumption at the villa level, rather than assuming the problem is applicable across all villas.
Furthermore, as mentioned in Section 1.5, drivers that possibly impact electricity consumption in villas include the behaviors and attributes of individuals of different tribal or ethnic backgrounds, household members’ economic wealth, climate differences due to geographic proximity to the coast, climate differences due to geographic location within the desert, the microclimate due to the sizes of villas, plot sizes, setbacks, and neighborhood design, and differences in energy performance due to compliance with a particular edition of the ECCPB code. All of these are factors that influence the villas’ occupants’ electricity consumption. Therefore, investigating certain aspects without considering the building and its occupants together could lead to recommendations for ineffective solutions to solving the challenge of reducing electricity consumption in Kuwaiti villas.
The limitations of the data collection method presented here pertain to the fact that the data were collected during Kuwait University academic years only. Therefore, no data were collected during KU’s summer holiday in July and August. While the data collected provided important insight into villas’ monthly electricity consumption, there is a lack of continuous electricity consumption readings for a whole year for any villa. It is also likely that the electricity consumption peaked during the hottest months of the year in July and August, particularly with some of the highest recorded temperatures occurring during July, and annual averages would, therefore, be higher when including the data from July and August. Moreover, no data were collected in 2020 due to the COVID-19 pandemic.
As mentioned previously, Azar concluded that the average daily electricity consumption of villas was 631 kWh. However, this study found that the average daily electricity consumption was less than 631 kWh. We found that the average daily electricity consumption from lowest to highest is as follows: January (110 kWh), December (110 kWh), February (134 kWh), November (159 kWh), March (175 kWh), September (220 kWh), April (301 kWh), October (413 kWh), May (449 kWh), and June (501 kWh). It is possible that the sample analyzed in Azar’s study consisted mostly of high-electricity-consumption villas; whereas, this research identified 19 villas from the sample of 150 that were classified as high-electricity-consumption villas (≥18,000 kWh). However, the previous study does not indicate the sample size of villas amongst the 463 buildings. Therefore, the comparability of the data is limited.

5. Conclusions

The research presented in this paper investigated the average monthly and daily electricity consumption of Kuwaiti villas for the months of January, February, March, April, May, June, September, October, November, and December based on 150 villas’ monthly electricity meter readings collected from Kuwait’s six governorates. The monitored electricity consumption data were collected directly from photographs of the sample of villas’ analog electricity meters, and the data collection was carried out over five years and through a sequence of academic modules delivered between 2018 and 2023.
Previous research on Kuwaiti villas’ electricity consumption has consistently highlighted the challenges of accessing existing consumption data for a large sample. The authors of this study encountered a similar challenge and addressed this limitation by collecting monthly electricity consumption data through an academic module. As a result, the level of granularity for a large sample of villas obtained for this study is the first of its kind, as all available previous studies relied primarily on aggregated annual electricity consumption for villas located in some of Kuwait’s governorates.
The average monthly and daily electricity consumption has been calculated according to the data, as illustrated in Table 11, and the overall average monthly electricity consumption per governorate has been calculated and illustrated in Table 12. It was found that the average daily electricity consumption from lowest to highest is as follows: January (110 kWh), December (110 kWh), February (134 kWh), November (159 kWh), March (175 kWh), September (220 kWh), April (301 kWh), October (413 kWh), May (449 kWh), and June (501 kWh). Evidence of the impact of seasonal variation on villa’s electricity consumption is demonstrated by the calculated averages presented. Specifically, the average electricity consumption in June was found to be approximately five times higher than that of December. Moreover, the study found common characteristics between villas with high monthly electricity consumption. It was found that 47% of these villas were from Al Asimah governorate, 74% of these villas were built in 1996 and later, 58% of these villas had three floors, 63% of these villas had a number of occupants greater than seven, 80% of these villas had plot sizes greater than 400 m2, and 63% of these villas were built in compliance with the first edition of the 1983 Energy Conservation Code of Practice for Buildings ECCPB.
While the unique data provided a valuable foundation for the analysis presented in this paper and a more accurate analysis of consumption patterns across different seasons, the limitations of the data collection method presented here pertain to the fact that the data were collected during Kuwait University academic years only. Therefore, no data was collected during KU’s summer holiday in July and August. While the data collected provided important insight into villas’ monthly electricity consumption, there is a lack of continuous electricity consumption readings for a whole year for any villa. It is also likely that the electricity consumption peaked during the hottest months of the year in July and August, particularly with some of the highest recorded temperatures occurring during July, and annual averages would, therefore, be higher when including the data from July and August.
This study is the first of its kind where the data used include the actual monthly measurements of the energy consumption of villas stocks. While this study provides valuable insights into the factors influencing electricity consumption, future research is needed to obtain more comprehensive and reliable data. It is recommended that future studies involve the collection of monthly and possibly even daily electricity meter readings from a representative sample of households across Kuwait’s six governorates. The sample should reflect the proportional distribution of housing types throughout Kuwait to ensure that it accurately represents the broader population of both Kuwaiti nationals and expatriates. Furthermore, to enhance the robustness of the study, data should be gathered over a period of at least 12 consecutive months, including a detailed analysis of seasonal variations and long-term electricity consumption patterns. Furthermore, to gain insight into the impact of seasonal variations on villas’ electricity consumption patterns, it is crucial that weather stations be installed in all six governorates. The collection of accurate weather data throughout the research period and in all six governorates would enable a thorough analysis of the impact of weather conditions on villas’ electricity consumption.
Such a dataset would significantly improve the reliability of the analysis and provide a more accurate basis for making effective policy recommendations. Furthermore, such a dataset would be invaluable for making effective recommendations related to energy policies, improved editions of the ECCPB code, the Baladia Municipality Building code, and reforms to subsidies, ultimately leading to more energy efficient villas and sustainable residential neighborhoods, efficient energy consumption practices, and meeting the target goals of the United Nations 2023 Kuwait’s Voluntary National Review (VNR).

Author Contributions

Conceptualization, D.M.K. and M.S.; methodology, D.M.K., M.S. and L.A.; software, D.M.K. and L.A.; validation, D.M.K., M.S. and L.A.; formal analysis, D.M.K., M.S. and L.A.; statistical analysis, L.A.; investigation, D.M.K., M.S. and L.A.; resources, D.M.K.; data curation, D.M.K.; writing—original draft preparation, D.M.K. and M.S.; writing—review and editing, D.M.K. and M.S.; visualization, D.M.K. and L.A.; supervision, M.S.; project administration, D.M.K. All authors have read and agreed to the published version of the manuscript.

Funding

This research received no external funding.

Institutional Review Board Statement

Not applicable.

Informed Consent Statement

Not applicable.

Data Availability Statement

The data presented in this study are available on request from the corresponding author.

Acknowledgments

This paper is the outcome of the leading author’s sabbatical from the College of Architecture at Kuwait University, which was spent at the Welsh School of Architecture at Cardiff University. The main author gratefully acknowledges the support and resources provided during this sabbatical, which made a significant contribution to the completion of this research.

Conflicts of Interest

The authors declare no conflicts of interest.

Abbreviations

The following abbreviations are used in this manuscript:
ECCPBEnergy Conservation Code of Practice for Buildings
VNRVoluntary National Review
MEWREMinistry of Electricity, Water, and Renewable Energy
PAHWPublic Authority for Housing Welfare
KISRKuwait Institute for Scientific Research
KUKuwait University
PAAETPublic Authority for Applied Education and Training
KEOKuwait Energy Outlook
IEAInternational Energy Agency
BAUBusiness As Usual
GCCGulf Cooperation Council
KWDKuwaiti Dinars
PACIPublic Authority for Civil information
MPWMinistry of Public Works
BaladiaKuwait Municipality

Appendix A

Appendix A.1. Major Variations in the Data Between the Months and Years When Measurements Were Taken

To conduct the Chi-square test, contingency tables were constructed, which are only used for categorical data. Therefore, the numerical consumption variables were trans-formed into categorical variables by considering the following intervals for each level:
Level 1: consumption per month < 3000
Level 2: 3000 ≤ consumption per month < 6000
Level 3: 6000 ≤ consumption per month < 9000
Level 4: 9000 ≤ consumption per month < 12,000
Level 5: 12,000 ≤ consumption per month < 15,000
Level 6: 15,000 ≤ consumption per month < 18,000
Level 7: consumption per month ≥ 18,000
The Chi-square test was applied to check for dependency between the electricity consumption per month and the number of occupants, plot size, and number of floors.
The Chi-square test was used to check for dependency between variables. In the Chi-square test, the following hypotheses were made:
The variables are independent
vs. the variables are dependent
And the following results were found:
Pearson’s Chi-squared test
data: da3$Maycon.cat and da3$plotsize
X-squared = 193.49, df = 123, p-value = 5.151 × 10⁻⁵
Since the p-value was too small (<0.05) the null hypothesis was rejected; therefore, the May consumption and the plot size are dependent.
Pearson’s Chi-squared test
data: da3$Junecon.cat and da3$numfloors
X-squared = 63.408, df = 24, p-value = 2.078 × 10⁻⁵
Therefore, the June consumption and the number of floors are dependent.
Pearson’s Chi-squared test
data: da3$novcon.cat and da3$Num
X-squared = 81.69, df = 57, p-value = 0.01768
Therefore, there is dependency between the November consumption and the number of occupants.

Appendix A.2. Factors Influencing Electricity Consumption and the Month and Year of Data Collection

A dependency was identified between electricity consumption and the year of data collection for the months of February, March, April, June, September, October, and November. However, the two variables are independent during December, January, and May. During December and January, electricity consumption is not affected by data collection. This could be due to mechanical air conditioning systems being turned off annually during the coldest months of the winter season in Kuwait. However, an explanation for May would require further investigation.
The Pearson’s Chi-squared test was applied to the dataset to check for dependency between the electricity consumption per month and the number of occupants, plot size, and number of floors. The test revealed that the villa electricity consumption in May and the plot size are dependent. It was found that villas of larger plot sizes had a higher electricity meter reading. The test also revealed that the villa electricity consumption in June and the number of floors are dependent. Consequently, the villas’ monthly electricity consumption increases with the increase in the number of floors. As a result, the electricity consumption of villas in the hot summer months of May and June is higher in larger villas. This could be due to mechanical cooling systems being operated in summer.
The test also revealed that there is a dependency between villas’ electricity consumption in November and the number of occupants. In Kuwait, November is a mildly cold winter month that does not usually require any cooling or heating. Therefore, the number of occupants is more impactful than the villa size on electricity consumption during this month. Factors influencing electricity consumption during November could relate to human behavior, such as habits of operating household appliances.

References

  1. PACI. Population; The Public Authority for Civil Information: Kuwait City, Kuwait, 2023. [Google Scholar]
  2. Al-Abdullah, Y.M.; Al-Ragom, F.; Alsayegh, O.; Al-Adwani, S.A.; Khajah, M.; Sreekanth, K.J. Kuwait Energy Outlook 2023: The Security-Transition Nexus of Kuwait; Kuwait Institute for Scientific Research: Kuwait City, Kuwait, 2023. [Google Scholar]
  3. National Committee for Sustainable Development for the State of Kuwait. Kuwait Voluntary National Review 2019: Report on the Implementation of the 2030 Agenda to the UN High-Level Political Forum on Sustainable Development. General Secretariat of the Supreme Council for Planning and Development, Kuwait, 2019. Available online: https://www.undp.org/kuwait/publications/kuwait-voluntary-national-review-2019 (accessed on 22 February 2025).
  4. Al-Ansari, M.; AlKhaled, S. Sustainable urban forms in the Arabian Gulf: An evidence-based analysis of Kuwaiti social housing neighborhoods at Jaber Al-Ahmed City. Front. Built Environ. 2023, 9, 1154523. [Google Scholar] [CrossRef]
  5. Jaffar, B.; Oreszczyn, T.; Raslan, R. Empirical and modelled energy performance in Kuwaiti villas: Understanding the social and physical factors that influence energy use. Energy Build. 2019, 188, 252–268. [Google Scholar] [CrossRef]
  6. MEW. Energy Conservation Code for Buildings. In MEW/R-6/2018; Ministry of Electricity and Water: Kuwait, 2018. [Google Scholar]
  7. Maheshwari, G.; Al-Mulla, A.; Al-Hadban, Y. Energy management program for the state of Kuwait. Int. J. Energy Technol. Policy 2009, 7, 95–112. [Google Scholar] [CrossRef]
  8. Jaffar, B.; Oreszczyn, T.; Raslan, R.; Summerfield, A. Understanding energy demand in Kuwaiti villas: Findings from a quantitative household survey. Energy Build. 2018, 165, 379–389. [Google Scholar] [CrossRef]
  9. MEWRE. Statistical Monthly Book for July 2023; Ministry of Electricity, Water and Renewable Energy: Kuwait City, Kuwait, 2023. Available online: www.mew.gov.kw/media/3zvjuf0s/electrical-annual-report-2023.pdf (accessed on 15 August 2024).
  10. CMGS. Government Work Programme; The Council of Ministers of the State of Kuwait: Kuwait City, Kuwait, 2024. Available online: https://cmgs.gov.kw/ (accessed on 15 August 2024).
  11. Azar, E.; Alaifan, B.; Lin, M.; Trepci, E.; El Asmar, M. Drivers of energy consumption in Kuwaiti buildings: Insights from a hybrid statistical and building performance simulation approach. Energy Policy 2021, 150, 112154. [Google Scholar] [CrossRef]
  12. Cerezo, C.; Sokol, J.; Reinhart, C.; Al-Mumin, A. Three methods for characterizing building archetypes in urban energy simulation. A case study in Kuwait City. In Proceedings of the BS2015: 14th Conference of International Building Performance Simulation Association, Hyderabad, India, 7–9 December 2015. [Google Scholar]
  13. Cerezo Davila, C.; Jones, N.; Al-Mumin, A.; Hajiah, A.; Reinhart, C. Implementation of a calibrated Urban Building Energy Model (UBEM) for the evaluation of energy efficiency scenarios in a Kuwaiti residential neighborhood. Build. Simul. 2017, 15, 745–754. [Google Scholar]
  14. Jaffar, B.N. Energy Performance in Kuwaiti Villas: Understanding the Social and Physical Factors That Drive Energy Use. Ph.D. Dissertation, University College London (UCL), London, UK, 2020. [Google Scholar]
  15. Al-Mumin, A.; Khattab, O.; Sridhar, G. Occupants’ behavior and activity patterns influencing the energy consumption in the Kuwaiti residences. Energy Build. 2003, 35, 549–559. [Google Scholar] [CrossRef]
  16. Al-Ajmi, F.F.; Loveday, D.L. Indoor thermal conditions and thermal comfort in air-conditioned domestic buildings in the dry-desert climate of Kuwait. Build. Environ. 2010, 45, 704–710. [Google Scholar] [CrossRef]
  17. Al-Ragom, F. Retrofitting residential buildings in hot and arid climates. Energy Convers. Manag. 2003, 44, 2309–2319. [Google Scholar] [CrossRef]
  18. Al-Ajmi, F.F.; Hanby, V. Simulation of energy consumption for Kuwaiti domestic buildings. Energy Build. 2008, 40, 1101–1109. [Google Scholar] [CrossRef]
  19. Ameer, B.; Krarti, M. Impact of subsidization on high energy performance designs for Kuwaiti residential buildings. Energy Build. 2016, 116, 249–262. [Google Scholar] [CrossRef]
  20. Al-Anzi, A.; Khattab, O. Solar conscious house design in Kuwait. Kuwait J. Sci. Eng. 2010, 37, 59–72. [Google Scholar]
  21. Ameer, B.; Krarti, M. Design of carbon-neutral residential communities in Kuwait. J. Sol. Energy Eng. 2017, 139, 031008. [Google Scholar] [CrossRef]
  22. Assem, E.O.; Al-Ragom, F. The effect of reinforced concrete frames on the thermal performance of residential villas in hot climates. Int. J. Energy Technol. Policy 2009, 7, 46–62. [Google Scholar] [CrossRef]
  23. Krarti, M.; Hajiah, A. Analysis of impact of daylight time savings on energy use of buildings in Kuwait. Energy Policy 2011, 39, 2319–2329. [Google Scholar] [CrossRef]
  24. MEWRE. Electrical Energy Statistical Year Book; Ministry of Electricity & Water & Renewable Energy: Kuwait City, Kuwait, 2023. Available online: https://www.mew.gov.kw/media/0fpnlm2h/electrical-annual-report-2022-for-qr.pdf (accessed on 22 February 2025).
  25. da Cruz, N.F.; Alrasheed, D.; Alrabe, M.; Al-Khonaini, A. Spatial Patterns and Urban Governance in Kuwait: Exploring the Links Between the Physical, the Socio-Economic and the Political; LSE Middle East Centre Kuwait Programme Paper Series, no. 25; LSE Middle East Centre: London, UK, 2024. [Google Scholar]
  26. Alshalfan, S. The Right to Housing in Kuwait: An Urban Injustice in a Socially Just System; Kuwait Programme on Development, Governance and Globalisation in the Gulf States, no. 28; London School of Economics and Political Science: London, UK, 2013. [Google Scholar]
  27. Baladia. Requirements and Specifications for Typical Residential Buildings and Private Housing; Kuwait Municipality: Salmiya, Kuwait, 2024. Available online: https://www.baladia.gov.kw/sites/ar/municipalityServices/Pages/constructionSystem/page3.aspx?menuItem=item6&g1=demo4 (accessed on 15 August 2024).
  28. Albaqshi, M. Kuwait Latent Sustainable Urbanity. In Proceedings of the Sustainable Architecture and Urban Development conference SB10, Amman, Jordan, 12–14 July 2010; Volume 3, pp. 107–119. [Google Scholar]
  29. AlKhaled, S. A Framework to Evaluate the Impact of Building Legislation on the Performance of the Built Environment: The Case of Kuwait, a Master-Planned City-State; Summer Research Internship Report; Kuwait-MIT Center for Natural Resources and the Environment: Cambridge, MA, USA, 2015. [Google Scholar]
  30. Mahgoub, Y. The development of private housing in Kuwait: The impact of building regulations. Open House Int. 2002, 27, 47–63. [Google Scholar]
  31. PACI. Buildings. In Statistics Services System; The Public Authority for Civil Information: Kuwait City, Kuwait, 2023. [Google Scholar]
Figure 1. Distribution of electrical installations by building sector with tariff subsidies in 2022. (1) Residential villas accounted for installations 3904 with a total load of 430,415.470 kW and a tariff of Fills 2 per kWh, (2) the government building sector accounted for installations 67 with a total load of 105,331.741 kW and a tariff of Fills 25 per kWh, (3) investment buildings accounted for installations 125 with a total load of 60,462.824 kW and a tariff of Fills 5 per kWh, (4) the industrial building sector accounted for installations 95 with a total load of 52,942.263 kW and a tariff of Fills 5 per kWh, (5) the commercial building sector accounted for installations 62 with a total load of 71,466.246 kW and a tariff of Fills 5 per kWh, and (6) the agriculture sector accounted for installations 240 with a total load of 21,416.891 kW and a tariff of Fills 3 per kWh [24] (p. 115, 122, 123).
Sustainability 17 04578 g001
Figure 2. Location map of Kuwait’s six Governorates: (1) Al Jahra, (2) Al Farwaniya, (3) Al Asimah, (4) Hawalli, (5) Mubarak Al Kabeer, and (6) Al Ahmadi.
Sustainability 17 04578 g002
Figure 3. Number of villas in Kuwait’s six Governorates. Source: main author.
Sustainability 17 04578 g003
Figure 4. Increase in housing stock per Kuwaiti governorate from 2011 to 2023. Source: Building and Dwelling Census (2011) conducted by the Central Statistical Bureau of Kuwait. Source: 2011 [29] (p. 14) and 2023 [1].
Sustainability 17 04578 g004
Figure 5. Population density by governorate. Kuwaiti national and expatriate populations in Kuwait’s six governorates in June 2024. Source: Accessed in January 2025 [1].
Sustainability 17 04578 g005
Figure 6. Distribution of electrical installations by governorate in 2022. (1) Mubarak Al Kabeer accounted for number of installations of 524 with a total load of 99,126.658 kW, (2) Hawalli accounted for number of installations of 305 with a total load of 77,835.407 kW, (3) Al Jahra accounted for number of installations of 176 with a total load of 43,696.570 kW, (4) Al Farwaniya accounted for number of installations of 1253 with a total load of 153,931.577 kW, (5) Al Asimah accounted for number of installations of 441 with a total load of 117,836.590 kW, and (6) Al Ahmadi accounted for number of installations of 1794 with a total load of 249,608.633 kW. Source: [24] (p. 120).
Sustainability 17 04578 g006
Figure 7. The total number of villas and apartments in each of Kuwait’s six governorates in 2023. Source: The Public Authority for Civil Information [1].
Sustainability 17 04578 g007
Figure 8. The proportion of villas sampled in each governorate for the whole sample of 150 villas where readings of electricity meters were conducted between 2018 and 2023. Source: main author.
Sustainability 17 04578 g008
Figure 9. Average monthly electricity consumption for the whole sample of 150 villas where readings of electricity meters were conducted between 2018 and 2023. Source: main author.
Sustainability 17 04578 g009
Figure 10. Average daily electricity consumption per month for the whole sample of 150 villas where readings of electricity meters were conducted between 2018 and 2023. Source: main author.
Sustainability 17 04578 g010
Figure 11. The 19 villas with high electricity consumption that were investigated. It was found that 47% of the villas were from the Al Asimah governorate, 21% were from the Al Farwaniya and Hawalli governorates, and 5% were from the Mubarak Al Kabeer and Al Jahra governorates. Source: main author.
Sustainability 17 04578 g011
Figure 12. In total, 74% of the villas with high electricity consumption were built in 1996 and after.
Sustainability 17 04578 g012
Figure 13. The percentages of the number of floors in villas with high electricity consumption.
Sustainability 17 04578 g013
Figure 14. Number of occupants according to plot size.
Sustainability 17 04578 g014
Figure 15. Plot sizes in villas with high electricity consumption.
Sustainability 17 04578 g015
Figure 16. In total, 63% of the villas with high electricity consumption were built in compliance with the first edition of the 1983 ECCPB code.
Sustainability 17 04578 g016
Table 1. Percentage of Kuwaiti government subsidies for residential villas.
YearPercentage of Government Subsidies
200387% [17]
201694.7% [19]
Table 2. Comparison between villas’ sizes. Source: [30] (p. 56).
Year198519962000
Total floor percentage120%170%170% + 120 m2
Total floor area600 m2850 m2970 m2
Ground floor percentage40%80%Not specified
Table 3. Increase in housing provision in each governorate between 2011 and 2023. Source: Building and Dwelling Census (2011) conducted by the Central Statistical Bureau of Kuwait. Source: 2011 [29] (p. 14) and 2023 [1].
Governorate20112023Percentage of Increase %
Al Ahmadi21,38434,10359.4%
Al Asimah16,95826,73157.6%
Al Farwaniya18,30626,51244.8%
Al Jahra12,33428,188128.5%
Hawalli20,39225,84926.7%
Mubarak Al Kabeer 18,02922,05122.3%
Table 4. Population density by governorate. Kuwaiti national and expatriate populations in Kuwait’s six governorates in June 2024. Source: accessed in January 2025 [1].
GovernorateTotal Population per GovernorateKuwaitisExpatsPercentage of Kuwaitis to Total Governorate Population (%)Percentage of Expats to Total Governorate Population (%)
Al Ahmadi1,095,805347,870747,93531.7568.25
Al Asimah621,213291,926329,28746.9953.01
Al Farwaniya1,231,225260,171971,05421.1378.87
Al Jahra633,620222,198411,42235.0764.93
Hawalli1,003,312247,487755,82524.6775.33
Mubarak Al Kabeer328,524190,089138,43557.8642.14
Not Stated 4871
Total Population4,918,5701,559,7413,353,95831.7168.19
Table 5. Total number of villas and apartment buildings in Kuwait’s six governorates in 2023 [31].
GovernorateVillasApartment Buildings
Al Asimah26,731832
Hawalli25,8495540
Al Ahmadi34,1033259
Al Jahra28,188258
Al Farwaniya26,5122798
Mubarak Al Kabeer22,051500
Total163,43413,187
Table 6. The total number of sampled villas in each of Kuwait’s six governorates. Source: main author.
GovernorateTotal Number of Sampled Villas
Mubarak Al Kabeer12
Hawalli52
Al Jahra12
Al Farwaniya19
Al Asimah51
Al Ahmadi4
TOTAL150
Table 7. Descriptive statistics and characteristics of the sample of 150 villas where electricity consumption measurements were taken. Source: main author.
Latest villa year of construction2021
Earliest villa year of construction1960
Range of villa years of construction61
Maximum number of occupants per villa 34
Minimum number of occupants per villa 3
Range of number of occupants31
Maximum villa plot size2000
Minimum villa plot size300
Range of villa plot size1700
Maximum number of floors4
Minimum number of floors1
Range of number of floors3
Table 8. Number of meter readings per month and per year for the 150 villas. Source: main author.
JanuaryFebruaryMarchAprilMayJuneSeptemberOctoberNovemberDecember
Count Total 21624965181856585971
Count 2018 00000056585649
Count 2019 1293131000000
Count 2020 0000000000
Count 2021 2018319181800019
Count 2022 0000000022
Count 2023 0151515000011
Table 9. Available sampled villa dataset per month/per year/per governorate. Source: main author.
GovernorateYearJanuaryFebruaryMarchAprilMayJuneJulyAugustSeptemberOctoberNovemberDecember
Al Ahmadi 2023044400000000
Al Asimah20180000000020202020
2019013131300000000
20216661488000000
2022000000000022
2023033300000000
Al Farwaniya2018000000007777
2019033300000000
2021220222000002
2023055500000000
Al Jahra2018000000007777
2019033300000000
2021210000000001
Hawalli20180000000023232323
2019011111100000000
20219132777000000
2023044400000011
Mubarak
Al Kabeer
2018000000004444
2019044400000000
2021110211000000
Total2073587518180061616467
Table 10. The monthly average, median, minimum, maximum and range for the years from 2018 to 2023 from the dataset of 150 villas. Source: main author.
JanuaryFebruaryMarchAprilMayJuneSeptemberOctoberNovemberDecember
Average kWh339837385415901713,92715,019661212,80647723401
Median kWh142721522829653214,04016,1595773966633071774
Minimum kWh 19016720624910761175306384283150
Maximum kWh 19,44918,00319,81069,70032,41042,57232,340193,81731,97430,857
Range kWh 19,25917,83619,60469,45131,33441,39732,034193,43331,69130,707
Table 11. Average daily electricity consumption, calculated by dividing the average monthly electricity consumption by the number of days in each respective month. Source: main author.
JanuaryFebruaryMarchAprilMayJuneSeptemberOctoberNovemberDecember
Average Monthly kWh 339837385415901713,92715,019661212,80647723401
Number of Days31283130313030313031
Average Daily kWh 110134175301449501220413159110
Table 12. Average monthly electricity consumption per governorate. Most of the orange cells were in the Al Farwaniya governorate, and most of the yellow cells were in the Mubarak Al Kabeer governorate. Source: main author.
GovernorateJanuaryFebruaryMarchAprilMayJuneSeptemberOctoberNovemberDecemberAVG.
Al AhmadiN/A562883209909N/AN/AN/AN/AN/AN/A7952
Al Asimah486037225401923716,31818,21851908938336326907794
Al Farwaniya10315238815415,29823,28621,68515,68445,05311,036779115,426
Al Jahra4210412628725803N/AN/A949212,740661042876268
Hawalli293531144769789910,24711,24953688510398728876097
Mubarak Al Kabeer4361946246630471856249160646673371029383168
Note: N/A indicates data not available. The orange cells represent the highest average electricity consumption per month; whereas, the yellow cells represent the lowest.
Table 13. Al Farwaniya has the highest mean number of occupants and the second highest mean plot size.
GovernorateMean Number of OccupantsMean Plot SizeAverage Consumption per YearSample Size
Al Ahmadi12.545079524
Al Asimah9.09615779451
Al Farwaniya1452915,42619
Al Jahra8.08451626812
Hawalli8.63510609752
Mubarak Al Kabeer8.25433316312
Table 14. Comparison between the Al Farwaniya governorate, which has the highest average monthly electricity consumption, and Mubarak Al Kabeer, which has the lowest average monthly electricity consumption during the month of April.
GovernorateApril Electricity Consumption
Al Farwaniya14,920
Mubarak Al Kabeer249
Al Farwaniya4753
Al Farwaniya10,959
Mubarak Al Kabeer1259
Mubarak Al Kabeer1002
Mubarak Al Kabeer11,807
Mubarak Al Kabeer2311
Al Farwaniya8647
Mubarak Al Kabeer1652
Al Farwaniya20,095
Table 15. The 19 villas with the highest electricity consumption.
GovernorateNumber of OccupantsYear of ConstructionPlot SizeNum. of FloorsJanuaryFebruayMarchAprilMayJuneSeptemberOctoberNovemberDecember
Al Asimah72017400319,4491447N/AN/AN/AN/AN/AN/AN/A11,138
Al Farwaniya2019915002N/A18,00319,81069,700N/AN/AN/AN/AN/AN/A
Hawalli620055002N/A971215,15018,672N/AN/AN/AN/AN/AN/A
Hawalli920065142N/A994414,17119,908N/AN/AN/AN/AN/AN/A
Al Farwaniya3419933233N/AN/AN/AN/AN/AN/A32,34041,10031,97430,857
Mubarak Al Kabeer820174003.5N/AN/AN/AN/AN/AN/A20,80520,23210,88210,581
Al Asimah620097503N/AN/AN/AN/AN/AN/A10,50222,85313,231N/A
Al Farwaniya1220107003N/AN/AN/AN/AN/AN/AN/A2 × 105N/AN/A
Al Asimah8200210003N/AN/AN/AN/AN/AN/A13,41624,2062348N/A
Al Asimah5200310002N/AN/AN/AN/AN/AN/A20,76517,16770505810
Al Asimah319609852N/AN/AN/AN/AN/AN/A300228,90448824582
Al Jahra320065003N/AN/AN/AN/AN/AN/A14,54418,36916,5436348
Al Asimah1220174003N/AN/AN/AN/AN/AN/A737918,15692199268
Al Asimah1119757503N/AN/AN/A19,21032,16036,112N/AN/AN/AN/A
Al Asimah1020005253N/AN/AN/A15,38327,80122,966N/AN/AN/AN/A
Al Asimah8200710004N/AN/AN/A20,23027,95342,572N/AN/AN/AN/A
Hawalli620206003N/AN/AN/A20,365921319,742N/AN/AN/AN/A
Al Farwaniya1319957503.5N/AN/AN/A20,09532,41027,000N/AN/AN/AN/A
Hawalli920005003N/AN/AN/A24,68822,58515,949N/AN/AN/AN/A
Note: N/A indicates data not available.
Disclaimer/Publisher’s Note: The statements, opinions and data contained in all publications are solely those of the individual author(s) and contributor(s) and not of MDPI and/or the editor(s). MDPI and/or the editor(s) disclaim responsibility for any injury to people or property resulting from any ideas, methods, instructions or products referred to in the content.

