Article

A Generative Urban Form Design Framework Based on Deep Convolutional GANs and Landscape Pattern Metrics for Sustainable Renewal in Highly Urbanized Cities

School of Architecture and Urban Planning, Shandong Jianzhu University, Jinan 250101, China
*
Author to whom correspondence should be addressed.
Sustainability 2025, 17(10), 4548; https://doi.org/10.3390/su17104548
Submission received: 30 March 2025 / Revised: 29 April 2025 / Accepted: 8 May 2025 / Published: 16 May 2025
(This article belongs to the Section Sustainable Urban and Rural Development)

Abstract

:
The iterative process of urban development often produces fragmented renewal zones that disrupt the continuity of urban morphology, undermining both cultural identity and economic cohesion. Addressing this challenge, this study proposes a generative design framework based on Deep Convolutional Generative Adversarial Networks (DCGANs) to predict and regenerate urban morphology in alignment with existing spatial contexts. A dataset was constructed from highly urbanized city centers and used to train a DCGAN model. To evaluate the model performance, seven landscape pattern indices—LPI, PLAND, LSI, MPFD, AI, PLADJ, and NP—were employed to quantify changes in scale, shape, compactness, fragmentation, and spatial adjacency. Results show that the model accurately predicts morphological patterns and captures underlying spatial logic in developed urban areas, demonstrating strong sensitivity to local form characteristics, and enhancing the feasibility of sustainable urban renewal. Nonetheless, the model’s generalizability is constrained by inter-city morphological heterogeneity, highlighting the need for region-specific adaptation. This work contributes a data-driven approach to urban morphology research and offers a scalable framework for form-based, sustainability-oriented urban design.

1. Introduction

The accelerated process of urbanization has significantly contributed to sustained economic growth and rising living standards across nations. Simultaneously, it has profoundly reshaped the physical environments in which social activities occur. Urban morphology has undergone fundamental transformations, characterized by large-scale expansion, spatial restructuring, intensified land use, and shifts in geographic conditions [1,2,3]. In highly urbanized regions, these dynamics have resulted in expansive and fragmented urban forms, adversely affecting ecological systems, climate regulation, and spatial equity across social groups [4,5,6]. Such patterns directly challenge the core mandate of sustainable development: to meet long-term urban goals without compromising environmental integrity, social welfare, or quality of life.
Efficient land use is a prerequisite for sustainable urban development [7]. Urban morphology is shaped by the interplay of land use, building typologies, street networks, and natural systems, organized into the broader urban fabric through the aggregation of basic plots [8]. In response to the growing complexity of urban transformation, this study proposes a generative urban renewal design method tailored for highly urbanized regions and capable of accommodating diverse morphological types. A dataset encompassing 18 major developed cities worldwide was constructed using widely adopted texture maps to represent local urban forms and ensure compatibility with deep learning models.
This research utilizes a Deep Convolutional Generative Adversarial Network (DCGAN)–based image inpainting architecture, capable of predicting missing morphological structures from partial urban data with minimal input requirements. From a sustainability perspective, landscape pattern indices are employed to compare the model’s predictive outputs with existing urban conditions. Section 3 outlines the construction of training and testing datasets, including model architecture, parameter selection, and evaluation metrics. Section 4 presents comparative analyses across cities using these indices. Conclusions are provided in Section 5.

2. Literature Review

The study of urban morphology has long drawn on theoretical frameworks such as morphological genes and the theory of living structure, introduced by Christopher Alexander in the 1960s. Spatial elements evolve analogously to genetic material, encoding the structure and logic of cities over time [9]. Traditional approaches—including space syntax [10,11] and spatial modeling techniques [12]—have laid a foundation for morphological analysis, but fall short in offering predictive insights or practical design guidance In contrast, deep learning technologies offer powerful analytical capabilities that support more comprehensive interpretations of urban form and enable rational spatial planning. With the growth of urban data, these models increasingly support the realization of sustainability goals, particularly those directly tied to environmental performance. Their relevance to sustainable urban development has been widely recognized.
Recent research trends have shifted toward integrating deep learning with urban morphological analysis. Machine learning and morphometric methods have emerged as core areas of inquiry [13,14]. The construction of deep learning datasets aligns with the idea of morphological genes, where models serve as data-driven representations of spatial form—echoing Alexander’s theoretical framework. This convergence offers new potential for identifying regional specificity and cultural identity within urban systems.
At the design level, parametric modeling emerged as an early generative method, introducing a novel paradigm for improving design efficiency [15]. By defining parameters and constraints, such methods enable complex form generation and variation. With the advent of tools such as BIM and Grasshopper, parametric modeling has gained traction in urban design practice [16,17]. These methods allow rapid articulation of design logic through user-defined rules [18], yet they struggle to fully capture evolving urban realities or control key morphological drivers—limiting their application in urban form generation.
To overcome these limitations, researchers have begun integrating classical and generative approaches. However, current generative techniques still provide limited support for urban morphological modeling. There remains a need for models capable of extracting spatial features with greater precision. Advances in satellite imagery, the interpretive power of the living structure theory, and the evolution of deep learning technologies collectively offer a promising basis for progress.
Empirical studies indicate that deep learning can extract block-level design characteristics and stylistic traits from urban imagery, including features such as scale, form, compactness, and adjacency [19,20] which are closely related to sustainability and spatial equity. Generative design methods powered by deep learning—including parametric models [21,22], generative adversarial networks [23], and embedded machine learning [24]—have demonstrated potential for efficient data use and rapid form generation. Some scholars have further introduced computer graphics and big data techniques to explore intra-city morphological homogeneity [25,26].
Generative Adversarial Networks (GANs) have become a transformative force in the field of urban design and planning, reshaping the methodological landscape of the discipline. Scholars have developed GAN models under different modes to enhance the adaptability and effectiveness of urban design processes, promote inclusive decision-making, and diversify the scope of design perspectives [27,28]. At the same time, scholars in academia have also contributed to the construction of data infrastructure, establishing the Reco dataset [29]. In addition, GAN has shown potential for integration in urban land use classification methods, which can further improve the accuracy and comprehensiveness of urban planning data, and make more informed decisions [30].
Nevertheless, the black-box nature of convolutional neural networks limits interpretability during training [31]. Unlike artistic creation, urban form design is constrained by policy, social context, geography, historical trajectories, and functional zoning. As a result, generic pre-trained models often fail to meet context-specific requirements. Targeted model adjustments are therefore necessary to guide generative outputs, and image inpainting algorithms present a viable path toward addressing this gap [32].
A notable precedent in applying ecological theory to urban analysis comes from Ian L. McHarg, who introduced landscape pattern indices in Design with Nature (1969) as a framework for evaluating urban spatial structure. Urban form, as a subset of urban landscape, can be analyzed through these indices to measure linearity, spatial connectivity, regional characteristics, and cultural identity [33,34]. For instance, the number of patches (NP) and patch density (PD) indicate fragmentation [35], while edge density (BD) and the aggregation index (AI) measure land-use efficiency and spatial compactness [36].
These metrics provide planners with a quantitative and multidimensional understanding of urban form and offer a foundation for evaluating the learning effectiveness of deep learning models. In doing so, they help support the development of planning strategies aligned with sustainable urban development.

3. Methodology

Framework is shown in Figure 1.

3.1. Dataset Construction

The dataset construction process involved multiple stages, including regional and urban selection, spatial preprocessing, and formatting for model input. To be compatible with deep learning (DL) frameworks, the dataset was required to possess both high volume and rich morphological content. The spatial richness, morphological stability, and internal homogeneity of highly urbanized areas make them particularly suitable for the construction of DL training datasets [37]. These characteristics also reduce variance among cities in terms of developmental stage, transportation infrastructure, urban scale, and institutional systems—factors that otherwise introduce morphological noise.
City selection was based on the 2020 global city rankings published by the Globalization and World Cities Research Network (GaWC). Cities categorized as either alpha or beta were included. To avoid excessive geographic or cultural bias, countries with fewer than two qualifying cities were excluded. The final selection was stratified by country (Figure 2 and Table 1).
High-resolution satellite imagery was obtained in the form of osm files from OpenStreetMap. Leveraging the WGS84 geodetic coordinate system and adhering to the EGM2008 elevation datum, the raw data offered a spatial resolution of 1:2000, enabling the detailed capture of urban architectural outlines and ground features. Subsequently, non-morphological features including road networks and place labels were systematically removed. The vector map data were transformed into grayscale texture raster maps with a resolution of 0.5 m per pixel. In this conversion, non-building areas (e.g., farmland, green space, water bodies, and infrastructure) were uniformly assigned a pixel value of 255 (white), while built-up areas were represented by grayscale values ranging from 0 (Figure 3).
From these processed texture maps, the central 20 km × 20 km area of each city was selected. This was achieved by conducting kernel density analysis to pinpoint the spatial density peaks of the built-up areas, with the 20 km × 20 km square centered around these peak points. Within these zones, 180,000 standardized urban block samples were generated via random cropping into 500 m × 500 m patches, the total sample coverage area amounted to 450 square kilometers, with 10,000 samples from each city (Figure 4). All samples were annotated in txt format to ensure compatibility and completeness for DL model training.

3.2. Image Inpainting Model Based on Deep Convolutional Generative Adversarial Networks

Deep learning seeks to extract features and patterns from large-scale datasets by leveraging computational power. As a generative model, the Generative Adversarial Network (GAN) consists of two components: a generator (G) and a discriminator (D) (Figure 5). The generator receives a random noise vector zzz and, this vector passes through a series of transposed convolutional layers (Deconv1–Deconv4). Each layer increases the spatial dimensions of the data while reducing the number of channels. For example, Deconv1 takes the input and transforms it into a feature map with a size of 8 × 8 × 512 . As the data progresses through subsequent layers, the feature maps become larger and more refined, eventually outputting a generated image with a size of 64 × 64 × 3 , which attempts to mimic real urban area images. The discriminator module takes both the generated images from the generator and real images from the dataset (denoted as X). It consists of a series of convolutional layers (conv1–conv4). Each convolutional layer reduces the spatial dimensions of the input while increasing the number of channels. The discriminator processes these images through leaky ReLU activation functions in each layer. After the final convolutional layer, the output is passed through a sigmoid function, which outputs a probability value between 0 and 1. This value indicates the discriminator’s confidence in whether the input image is real or generated. Under ideal training conditions, the generator and discriminator operate in an adversarial loop, optimizing the parameters within their respective networks. The training process aims to achieve a Nash equilibrium, where D(G(z)) = 0.5D(G(z)) = 0.5D(G(z)) = 0.5, indicating that the generator has fully learned the underlying data distribution. The standard objective function of GAN is defined as:
min G max D V ( D , G ) = E x ~ P d a t a ( x ) [ lg D ( x ) ] + E z ~ P z ( z ) [ lg ( 1 D ( G ( Z ) ) ) ]
where:
  • V ( D , G ) denotes the divergence between generated and real image distributions,
  • x represents real image input,
  • G ( Z ) denotes the generated sample,
  • E is the expectation operator,
  • P d a t a ( x ) is the distribution of real data,
  • P z ( z ) is the Gaussian distribution of noise z,
  • D ( x ) is the probability that the discriminator classifies xxx as real,
  • D ( G ( Z ) ) is the probability that the discriminator classifies the generated sample as real.
Figure 5. Model Workflow.
Sustainability 17 04548 g005
Deep Convolutional Neural Networks (DCNNs) improve feature extraction and representation capacity through increased network depth, achieving strong performance in image generation tasks [38]. DCGAN modifies the traditional GAN architecture by incorporating convolutional operations. The generator employs transposed convolution layers to progressively upsample low-dimensional noise vectors into high-resolution images. The discriminator uses convolutional layers for downsampling input images, extracting features, and evaluating authenticity. This structure reduces overfitting, decreases parameter count, and enhances computational efficiency.
DCGAN has advantages in convolution and diversity. In terms of convolution, it efficiently extracts hierarchical features of images through convolution and deconvolution layers, preserves spatial information, reduces parameters, and makes training more stable through local connections and weight sharing, which is difficult for some new-era models to achieve. Although StyleGAN can finely control styles, its structure is complex, while DCGAN is more concise and efficient. In terms of diversity, DCGAN can generate rich images based on latent spatial random noise, and adversarial training mechanisms also promote diversity. If CGAN requires conditional information, DCGAN unsupervised learning can explore a wider range of data distributions, generate more diverse types and styles of samples, and have stronger applicability.
For optimization, DCGAN typically adopts the Adam algorithm, which combines adaptive learning rates with exponentially decaying averages [39]. However, its reliance on second-order momentum may lead to instability or failure to converge in certain conditions. To address this, the learning rate in our model is scheduled using cosine annealing, which enables dynamic adjustment and helps avoid local optima during training, thus enhancing overall convergence stability [40].

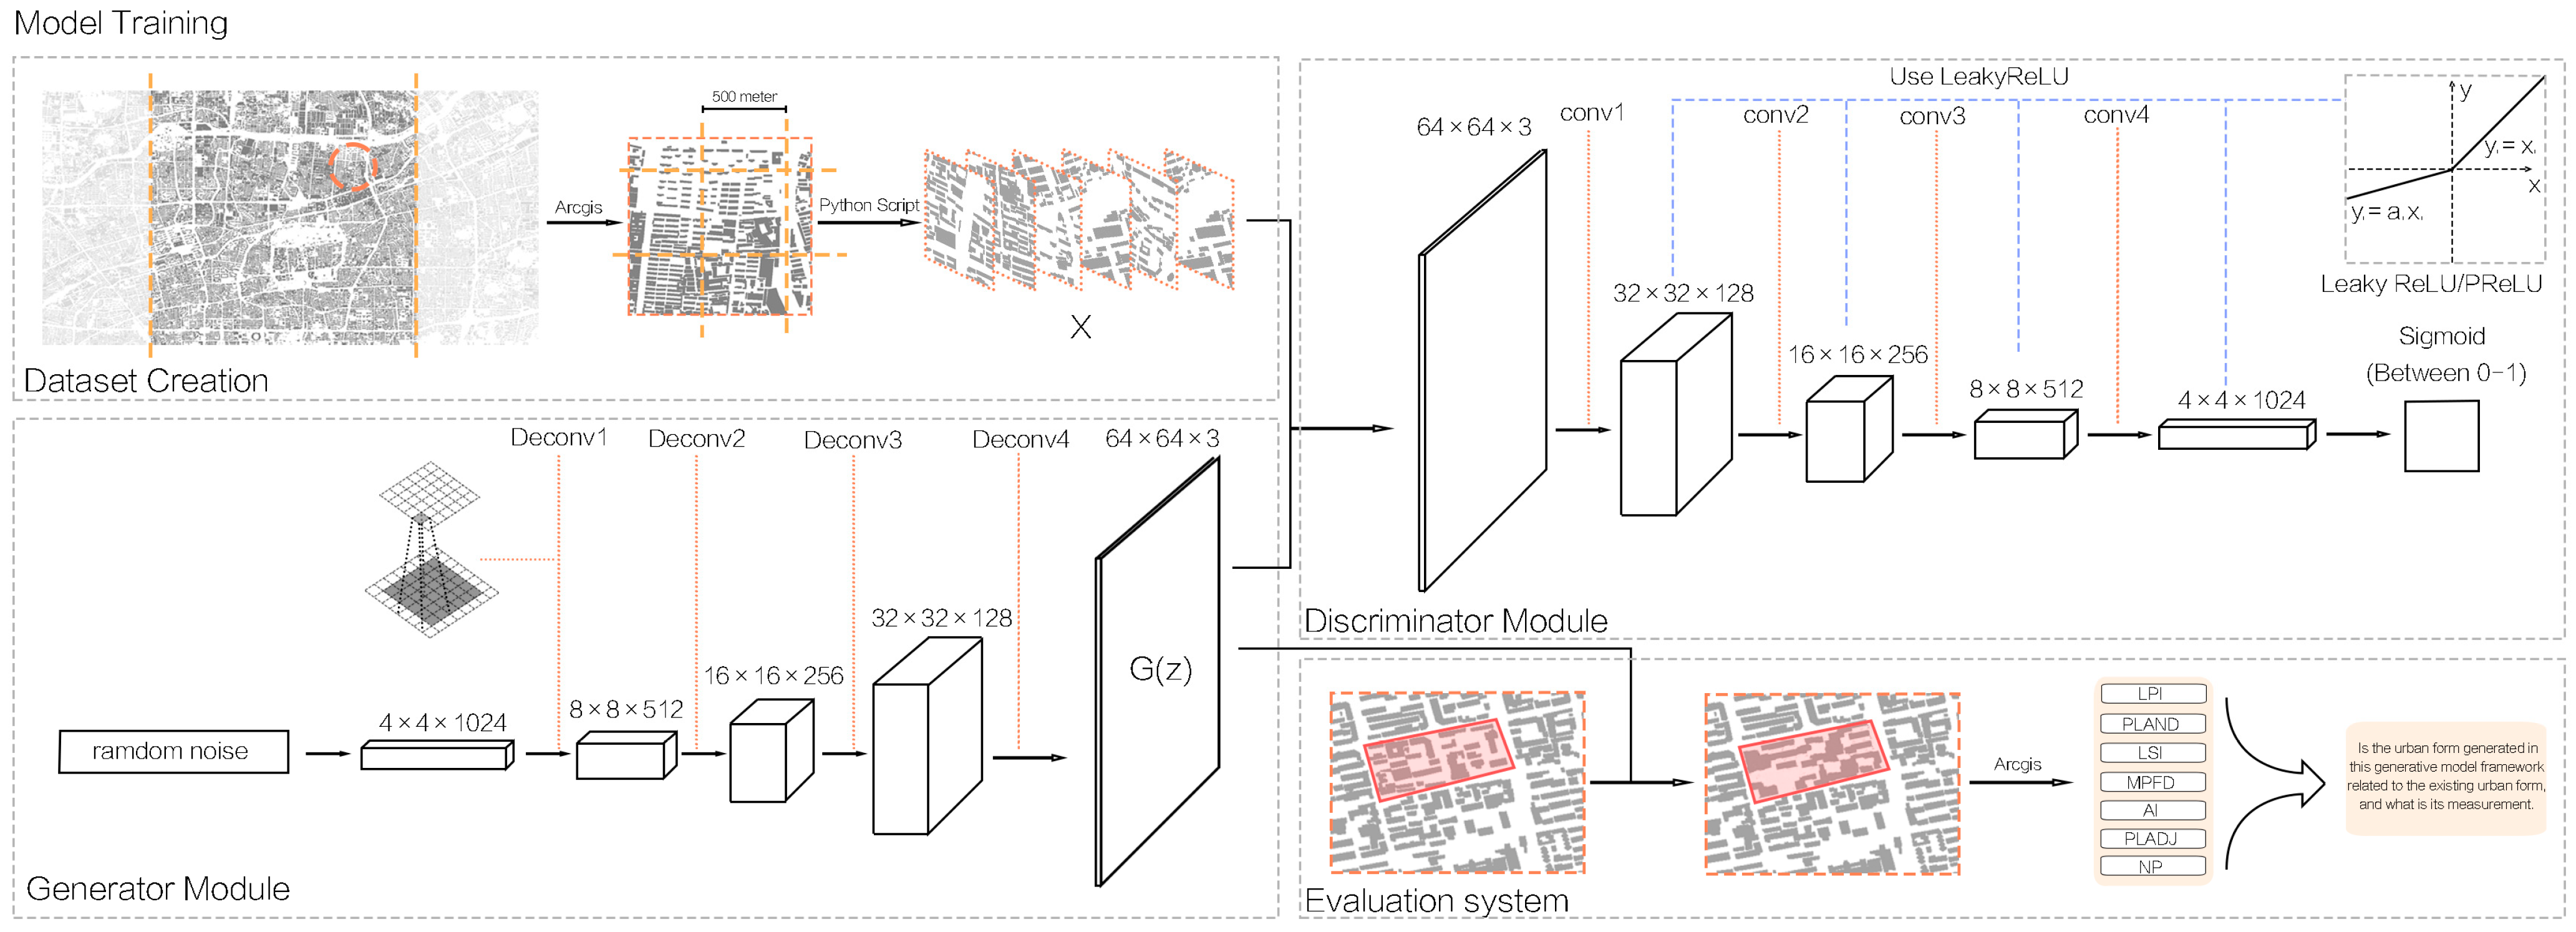
3.3. Urban Morphological Evaluation Using Landscape Pattern Indices

To assess the practical utility of the proposed model, landscape pattern indices were introduced as evaluation metrics. These indices translate visual urban form data into quantifiable parameters, enabling verification of whether the model’s predictive results contribute positively to sustainable urban development outcomes [41,42].
Urban morphology emerges from the spatial arrangement of land use, building typologies, and street networks. To explore how generative design influences morphological outcomes, seven widely adopted landscape pattern indices were selected from five core dimensions: shape, scale, compactness, fragmentation, and adjacency [34,43]. These indices serve as a composite framework for characterizing internal morphological evolution and spatial structure. All selected indices pertain to built-up land categories, as listed in Table 2.
The indices are mathematically defined as follows:
  • a i j : area of patch j in landscape type i (in hectares, h m 2 );
  • p i j : perimeter of patch i j (in meters);
  • g : number of adjacencies between raster cells of the same landscape type;
  • m : number of landscape types (categories);
  • n : total number of patches;
  • A : total landscape area (in h m 2 );
  • E : total edge length of all patches (in meters).
LPI reveals the dominant position of the largest patches, indicating the core degree of urban areas. PLAND displays the proportion of land occupied by buildings, reflecting the distribution of urban land use. LSI and MPFD measure the complexity of building and block forms, and numerical values indicate the degree of irregularity in urban form. AI evaluates the clustering degree of buildings, indicating the development trend of clustering or dispersion in urban blocks. PLADJ measures the adjacency of adjacent buildings, highlighting the interaction between urban spaces. NP calculates the number of buildings to reflect the degree of urban fragmentation. These indicators guide urban designers to optimize land use, shape functional layouts, and create more livable and efficient urban spaces.
These quantitative indicators offer a multi-dimensional view of urban spatial configuration and serve as a basis for comparing model-generated morphology with real-world urban forms in sustainability-related assessments.

4. Results

4.1. Model Training Process

To evaluate the effectiveness of the proposed approach, the model was tested using the constructed training dataset. Through iterative experimentation, the optimal hyperparameters were determined in Table 3.
Choose BCEloss as the loss function. The training process was conducted over 200 epochs with a batch size of 100. In order to distinguish and compare the training effects, based on the 18 cities selected in Table 2, Geneva, São Paulo, Paris, Nanjing, New York, and Toronto were selected according to their degree of urban regularity and density. Generator and discriminator loss curves for each city during training are shown in Figure 6.
During epochs 1–20, the generator loss G_loss dropped rapidly from 10 to the 2–4 range, while the discriminator loss D_loss peaked. This phase reflects early-stage learning, where the model had not yet captured coherent urban.
From epochs 100–150, divergence in G_loss trends was observed among cities: Toronto’s loss curve stabilized near 8, while the remaining cities continued fluctuating between 4–8, with D_loss gradually approaching 0. By epochs 150–200, generator loss across all cities had stabilized around 8–9, and discriminator loss had converged to 0, indicating a complete initial training cycle. The loss function did not show any signs of overfitting observed throughout the training, suggesting that the model structure and hyperparameter configuration were robust and well-balanced.
Using the generator from epoch 200, 25 prediction samples were generated for each city, excluding NP with significant numerical differences between different cities, and comparing the landscape pattern index of the predicted results (Figure 7). To enhance consistency, each image preserved a 500-m buffer around the central urban block. The central region was then cropped to produce the final synthesized sample. These outputs were subsequently evaluated using the landscape pattern indices (Figure 8). Across all cities, the predicted values consistently fell within adjacent ranges, successfully capturing city-specific morphological traits. For instance, São Paulo and Paris exhibited consistently high PLAND and LPI scores, indicating a higher proportion and scale of urban land patches. In contrast, Nanjing’s lower PLADJ and AI scores suggested a more dispersed urban structure with lower spatial compactness.
The LPI index revealed a notable exception: only Paris displayed significant variation within the interquartile range of the boxplot (25–75%), implying that the generated forms did not consistently enhance monocentricity, thus hinting at a tendency toward decentralized urban development.

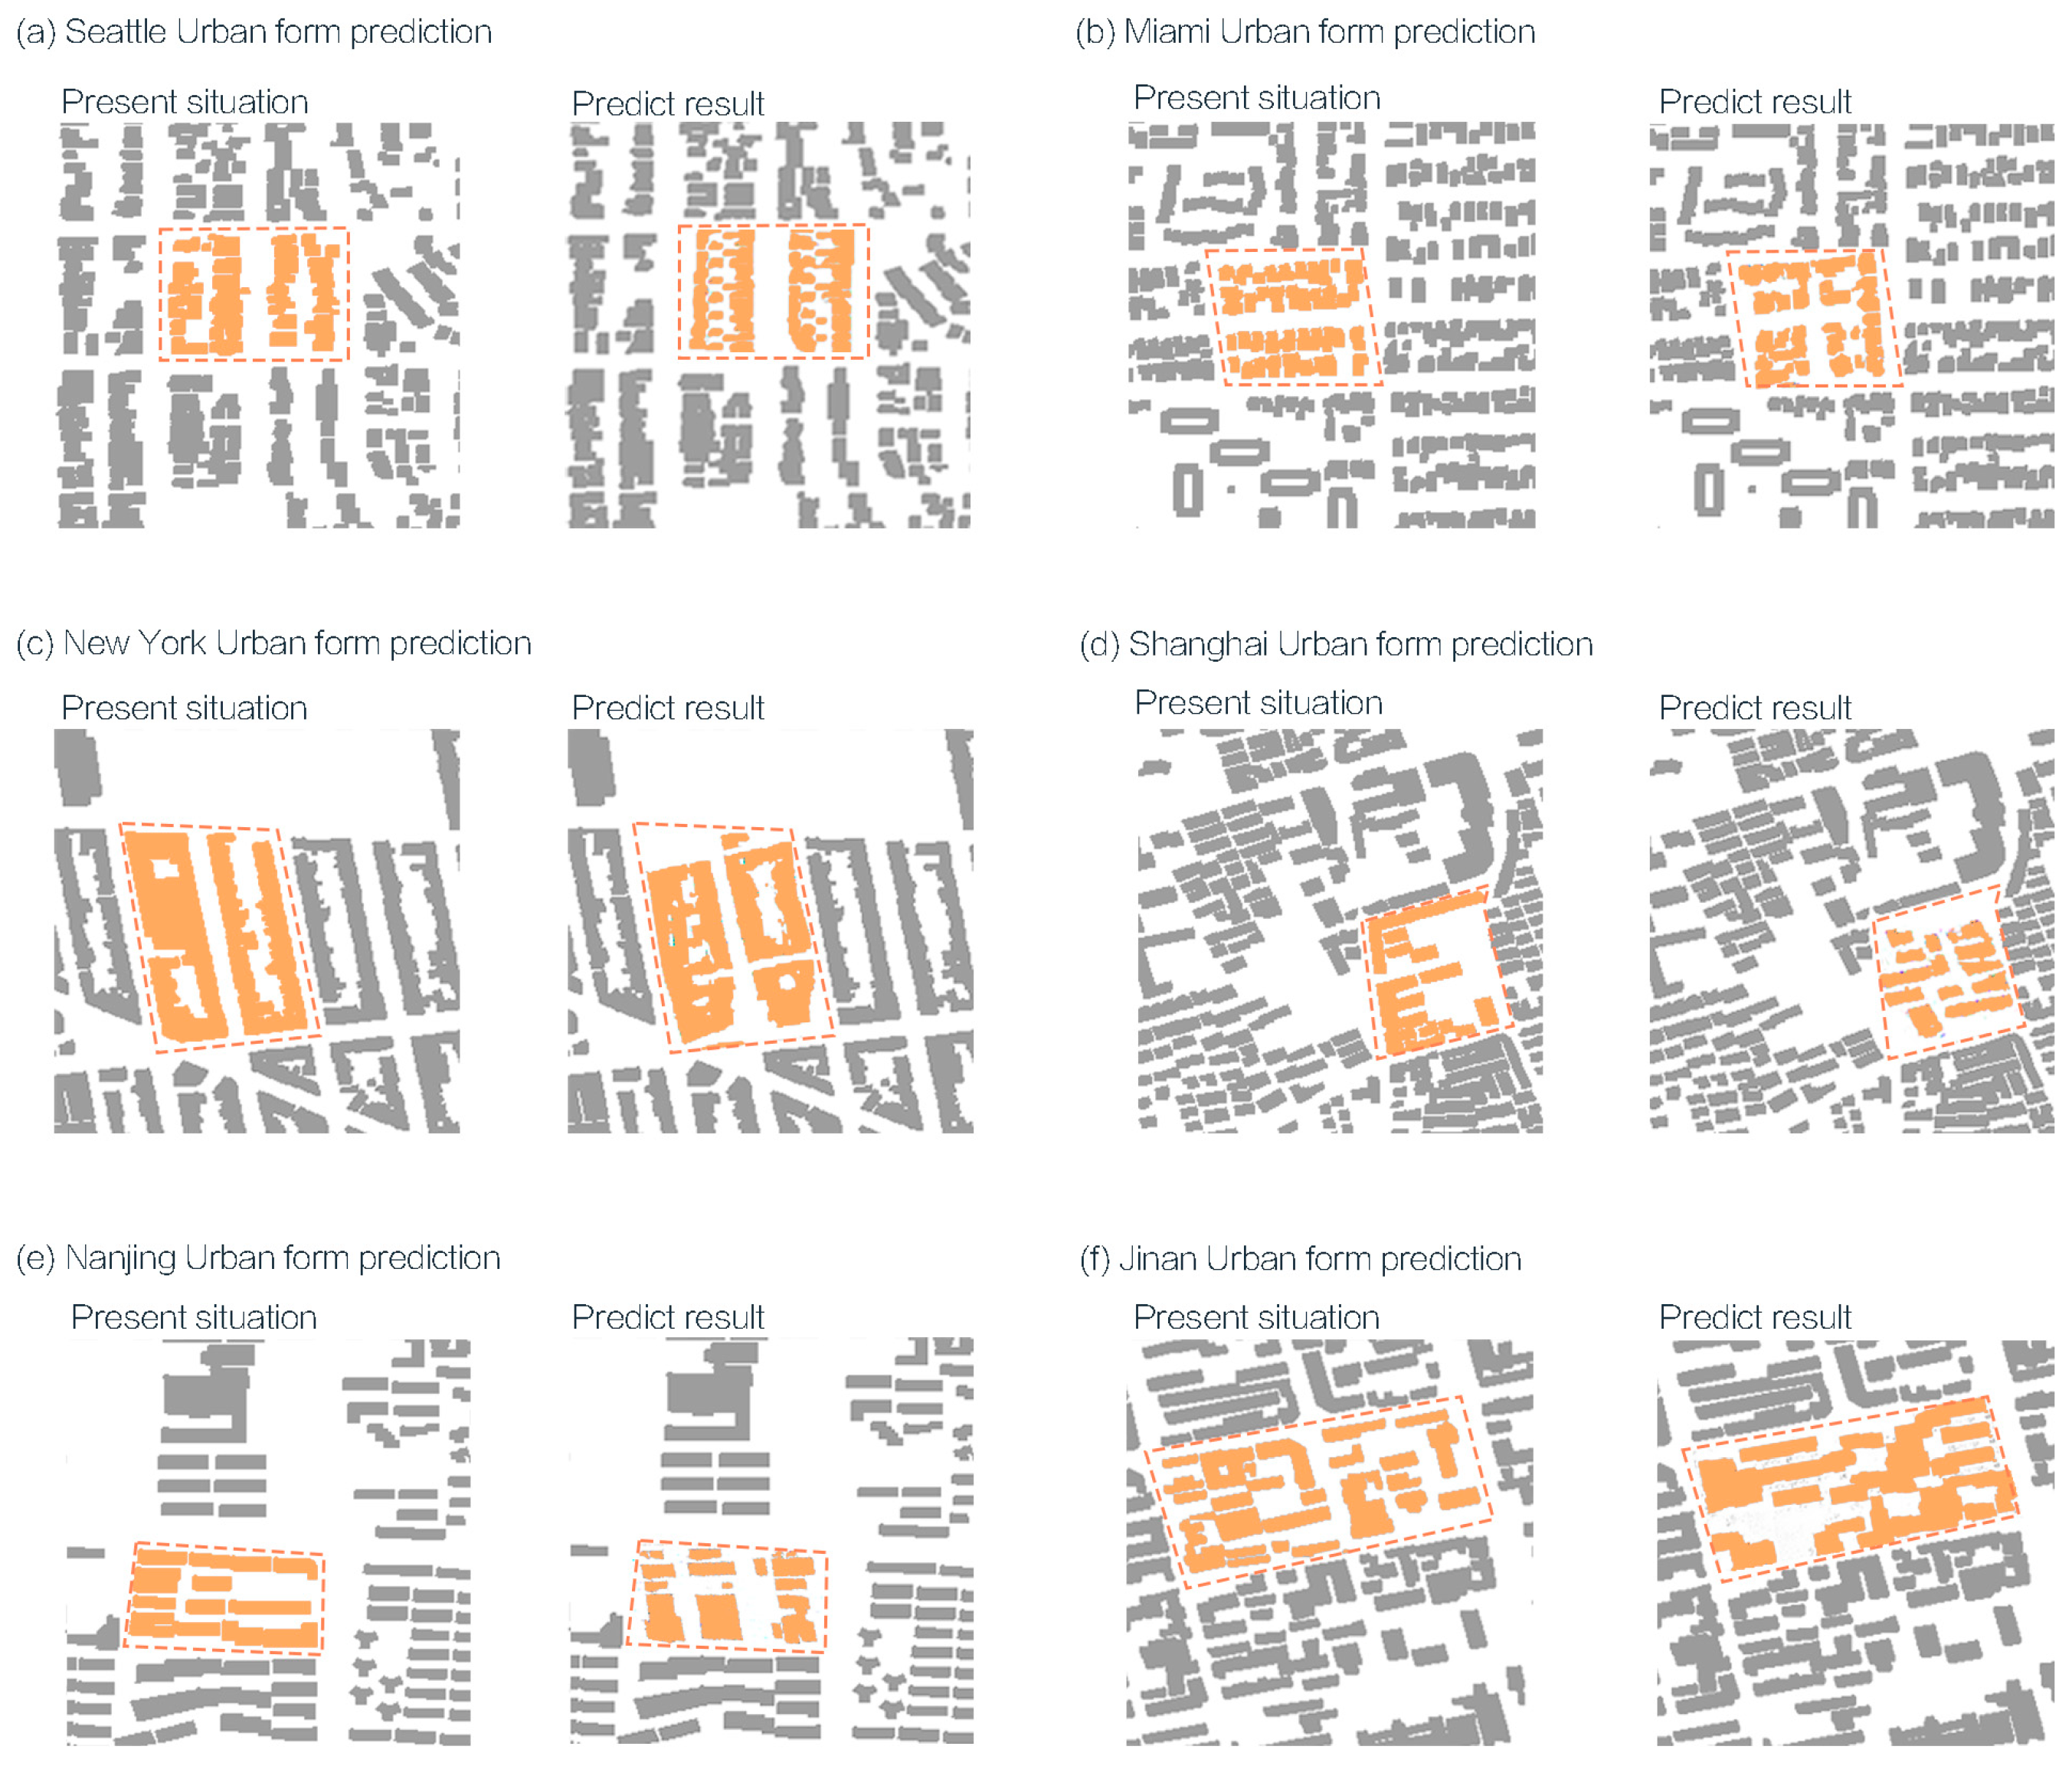
4.2. Generation Results of the Model

In research on generative design methodologies, a central focus lies in exploring how exploratory variations can trigger non-linear divergences in design thinking, resulting in a broad spectrum of outcomes. Such processes tend to reduce the strict alignment typically required between the designer’s intention and the final result [44]. When integrating the predicted outputs with existing urban conditions, the inherently black-box nature of deep learning (DL) models—and the diversity of generated outputs—necessitates selective filtering. From the pool of generated results, samples were screened based on morphological coherence and stylistic quality. The final selection of urban forms was made through a comparative evaluation grounded in social, economic, and aesthetic value.
For empirical validation, the trained DL model was applied to a test dataset composed of samples from 18 highly urbanized cities (Table 2) used to create the dataset. The generated results were compared with the original form for landscape pattern index evaluation (Table 4, Table 5 and Table 6). Random imagery from each city was selected as the target area for urban renewal. Each image preserved a 500-m buffer zone surrounding the core block as a margin for inpainting. The central portion was cropped, and generation was performed using the trained generator at epoch 200. Multiple predictions were produced for each city, and the version with the most favorable landscape pattern indices was selected for integration.
The resulting images were then compared with the current conditions of the corresponding sites (Figure 9, Figure 10 and Figure 11). Use gray to represent buildings within the buffer zone, orange dashed lines to indicate the scope of renovation, and orange color blocks to represent the shape of the renovated street area. This side-by-side evaluation allowed for an assessment of the model’s ability to propose spatially coherent and context-sensitive morphological alternatives under the framework of sustainable urban transformation.

4.3. Evaluation Using Landscape Pattern Indices

Landscape pattern indices were applied to assess urban morphological changes within the 500-m buffer zones surrounding central blocks. Before-and-after comparisons were conducted, with variations expressed per mille (‰). The results are summarized in Table 2, Table 3 and Table 4. Among the evaluated indices, LPI, PLAND, and LSI exhibited statistically significant shifts, indicating that the generative outputs meaningfully influenced urban form at the local scale.
From the perspective of shape metrics, cities such as Seattle, Moscow, and Hanoi showed significantly negative changes in LPI at the 3% level, whereas Paris and Jinan demonstrated significantly positive shifts at the 1% level. These patterns suggest that the model is capable of evaluating and adjusting the patch scale of built-up areas in different urban contexts.
Regarding land proportion, PLAND scores for São Paulo and Paris exceeded 50% and were significantly negative at the 3% level. Conversely, Seattle, Moscow, and Hanoi recorded PLAND values below 40%, with statistically significant positive changes at the 3% level. This bi-directional responsiveness indicates that the model adaptively adjusts the share and scale of land use patches—raising or lowering them depending on existing spatial conditions. The joint variation of PLAND and LPI demonstrates the model’s alignment with sustainable development goals by refining land allocation patterns.
The LSI index for cities including New York, Miami, Hanoi, and Paris showed significantly negative results at the 3% level, suggesting that the generated forms led to more regular, cohesive patch shapes within the buffer zones—contributing to a more integrated urban morphology.
Only Seattle exhibited a statistically significant change in MPFD at the 1% level. Moreover, the generated MPFD values across all cities were greater than 1, indicating no major morphological deviation in patch boundary complexity. This supports the idea that the model performs secondary generation based on existing urban form patterns, consistent with its intended design behavior.
No significant changes were observed for AI across all cities, implying that the compactness of spatial distribution remained stable and no unintended densification or dispersal occurred. However, the PLADJ index revealed significant improvements at the 1% level in cities such as New York, Jinan, Edinburgh, and Hanoi. These results indicate enhanced adjacency among land patches, leading to more compact urban formations and potentially higher land-use efficiency.
With respect to NP (number of patches), all but three cities showed significant changes. Nine cities experienced significant reductions, while six cities exhibited notable increases. For example, New York and Jinan demonstrated significant NP decreases at the 10% level, while Moscow showed a significant increase at the same level. When considered alongside PLAND and LSI, these patterns suggest that the model adjusts patch quantity in response to existing spatial regularity and land-use proportions. Specifically, cities with more regular and spatially limited land patches tend to yield fewer resulting patches after generation.
Finally, MPFD remained statistically insignificant across all cities, reinforcing that the model does not alter the overall boundary complexity of generated urban forms and has minimal impact on land-use integration at the edge level.

4.4. Morphological Differences in Generated Results

As discussed earlier, urban forms generated by convolutional adversarial networks can be preliminarily integrated into existing urban environments. At the level of morphological genes, the generated plots reflect a meaningful grasp of form and exert notable influence on built-up land patterns within a 1 km buffer zone—specifically in terms of scale, proportion, shape, spatial structure, compactness, and adjacency. At the block level, these effects manifest in changes to internal street networks, building orientations, and floor area ratios (FAR).
From a holistic urban morphological perspective, cities such as Seattle, New York, Berlin, and Osaka demonstrated strong alignment between the generated and existing forms, with differences limited to architectural style and distribution scale. In contrast, cities like Nanjing and Sydney experienced fundamental changes in internal block structure. For example, Nanjing shifted from an east-west–oriented grid to a north-south configuration, while Sydney’s generated form transitioned from a cohesive urban mass into fragmented, independently distributed buildings arranged along a north-south corridor. Despite these differences, the resulting configurations remain consistent with each city’s development scale and spatial logic and can be interpreted as design scheme variations within urban planning frameworks.
In terms of street orientation and network structure, most cities showed minimal changes. Cities like New York and Seattle retained their original block patterns, whereas others—such as Miami and Nanjing—displayed newly generated internal road systems. Paris exhibited a substantial transformation: its original group-block pattern was replaced with irregular, asymmetrical street structures. This divergence may stem from Paris’s detailed dataset, which includes rich information on street orientation and building layout; while the model captured this complexity in training, its generative mechanism may lack the precision required for faithful reconstruction.
Regarding floor area ratio (FAR), cities like Hanoi and Moscow experienced significant increases. Hanoi’s original block was located in a chemical warehouse district with large adjacent open space. In the generated output, this open space was relocated to the east and west sides of the block, effectively raising the FAR while preserving green space buffers. Moscow’s selected block was along the river, where the baseline layout was spatially irregular due to topographical constraints. The generated results preserved this fragmented distribution while enhancing local morphological definition. While consistent with model expectations, these outcomes deviated from idealized street layout standards and revealed areas for improvement.
In most other cities, the generated urban forms reflected ecological upgrades aligned with planning policy objectives. Green buffers were enhanced, the spatial environment became more integrated, and the generated forms provided plausible references for future urban design.
From the perspective of model applicability, Paris was an outlier with particularly poor generation results. This may be attributed to a mismatch between the selected site and model suitability. Furthermore, since the 1960s, Paris’s central districts have suffered from chronic traffic congestion and land scarcity—factors that contribute to its unusually high PLADJ index relative to other cities [45]. These conditions may limit the model’s ability to generate effective urban morphology for such contexts.

5. Discussion

5.1. Deep Learning and the Extraction of Urban Morphological Characteristics

This study introduced a deep learning-based generative design framework aimed at extending and evolving existing urban morphological patterns. By focusing on the continuity of urban form, the model provides a novel approach to linking present spatial configurations with potential future forms. Unlike previous deep learning-based urban morphology studies, which typically relied on datasets from specific cities, the dataset collected in this study covers 18 cities for comprehensive data collection. This extensive data collection not only captures a wider range of urban morphological changes but also emphasizes morphological similarities with surrounding areas. Previous studies often overlooked the influence of adjacent spatial backgrounds, generating urban forms in isolation without considering how they interact with neighbors and are shaped by them. The integration of spatial-geographical characteristics and morphological gene theory marks a departure from traditional urban morphology research, enabling the extraction of regionally embedded, temporally continuous, and climate-sensitive morphological features.
Unlike conventional rule-based or typological methods, the proposed model allows for the data-driven recognition of complex urban form attributes. It offers a theoretical basis for applying generative methods in morphology-aware urban design. However, the diversity of urban contexts introduces limitations: morphological genes do not generalize well across distinct regions due to varied climatic, geographic, and infrastructural conditions. By focusing the dataset on highly urbanized, developed regions, the study minimizes variance across cities in developmental stages, transportation systems, and institutional structures.
Future research should explore the adaptive reweighting of morphological gene features and expand training datasets to include cities from diverse developmental and cultural contexts. This would improve the model’s generalizability and applicability in a broader range of urban planning scenarios.

5.2. Advancing Urban Morphology Research Through Deep Learning

Urban form is not merely the outcome of design aesthetics but also reflects a city’s strategic orientation toward sustainable growth. This research positions generative design as a computational complement to human-centered urban design, providing a procedural framework for evaluating spatial systems at scale.
By collecting and predicting morphological data from the central districts of 18 major developed cities, the study introduces a robust pipeline that incorporates seven landscape pattern indices—LPI, PLAND, LSI, MPFD, AI, PLADJ, and NP—to quantify variation in form characteristics such as scale, shape, fragmentation, and adjacency. This quantification enables spatial diagnostics relevant to sustainable development goals.
The contribution lies not only in methodological innovation but also in demonstrating how deep learning can support the translation of spatial data into actionable urban design insights. Nevertheless, the scope of this initial application remains confined to culturally and infrastructurally similar urban environments. Future work should construct morphological gene systems tailored to regional and cultural typologies and explore the embedded relationship between form, policy, and local identity.

5.3. Limitations and Future Work

The proposed generative design method offers an expanded spatial perspective and enhances the analytical resolution of urban form studies, at the same time, we will collaborate with urban modeling to enhance the appearance of the area in a targeted manner. Enabling core districts to inform the renewal of peripheral zones contributes to more strategic and scalable urban form governance. However, several limitations must be acknowledged.
First, the model currently lacks sensitivity to regional specificity and does not integrate auxiliary urban datasets such as zoning regulations, transport flows, or socio-economic metrics—factors that heavily influence urban morphology. Second, its current design favors developed cities with relatively uniform urban infrastructure, limiting broader applicability.
To address these issues, future work should prioritize multi-source data integration to construct a more complete urban data environment. Expanding input data types and enriching the morphological feature space would support better generalization and adaptability. Furthermore, aligning generative outputs with functional land-use demands and policy constraints will be crucial for practical implementation in real-world planning processes.

6. Conclusions

This study proposed a generative design framework for urban morphological renewal based on Deep Convolutional Generative Adversarial Networks (DCGANs), focusing on the central districts of highly urbanized cities. By constructing a dataset from 18 developed urban centers and training a deep learning model, the research explored how morphological continuity and spatial logic can be captured, simulated, and evaluated using data-driven methods.
The use of seven landscape pattern indices—LPI, PLAND, LSI, MPFD, AI, PLADJ, and NP—enabled a comprehensive quantitative assessment of urban forms across key dimensions such as scale, compactness, fragmentation, and spatial configuration. The generated outputs not only demonstrated alignment with existing morphological patterns but also revealed context-sensitive adjustments, reflecting the model’s sensitivity to regional spatial structures.
This work contributes to the field of urban morphology by integrating deep generative modeling with measurable spatial evaluation. It establishes a replicable and scalable approach for simulating urban form evolution and offers methodological support for sustainable urban design. Assist designers in similarity design or assist government departments in regulating site indicators. The research also introduces a framework for quantifying generative outputs through interpretable spatial indices, bridging the gap between black-box neural models and planning-oriented decision-making.
While the current model performs well in highly urbanized, infrastructure-consistent settings, further research is needed to enhance adaptability to diverse geographical and cultural contexts. Expanding the dataset, incorporating auxiliary data sources (e.g., land-use plans, transit networks), and refining region-specific morphological gene structures will be essential for broadening the model’s practical applicability in future urban transformation strategies.

Author Contributions

Conceptualization, S.X.; Methodology, S.X.; Software, S.X.; Validation, H.J.; Formal analysis, H.J. and H.W.; Data curation, S.X. and H.W.; Writing—original draft, S.X. and H.J.; Writing—review & editing, H.W.; Project administration, H.J.; Funding acquisition, H.J. All authors have read and agreed to the published version of the manuscript.

Funding

This research was supported by the Overseas Science and Technology Talent Recognition Project (Hanyang Wang) of the Shandong Provincial Science and Technology Department, and the Doctoral Scholars Grant Program of Shandong Jianzhu University (No. X24024; Hanyang Wang).

Institutional Review Board Statement

Not applicable.

Informed Consent Statement

Not applicable.

Data Availability Statement

The original contributions presented in this study are included in the article material. Further inquiries can be directed to the corresponding author.

Conflicts of Interest

The authors declare no conflicts of interest.

References

  1. Dijkstra, L.; Florczyk, A.J.; Freire, S.; Kemper, T.; Melchiorri, M.; Pesaresi, M.; Schiavina, M. Applying the degree of urbanisation to the globe: A new harmonised definition reveals a different picture of global urbanisation. J. Urban Econ. 2021, 125, 103312. [Google Scholar] [CrossRef]
  2. Zhu, W.J.; Chen, J.J. The spatial analysis of digital economy and urban development: A case study in Hangzhou, China. Cities 2022, 123, 103568. [Google Scholar] [CrossRef]
  3. He, Q.S.; Yan, M.; Zheng, L.Z.; Wang, B.; Zhou, J. The Effect of Urban Form on Urban Shrinkage—A Study of 293 Chinese Cities Using Geodetector. Land 2023, 12, 799. [Google Scholar] [CrossRef]
  4. Dai, K.; Shen, S.; Cheng, C.; Ye, S.; Gao, P. Trade-Off Relationship of Arable and Ecological Land in Urban Growth When Altering Urban Form: A Case Study of Shenzhen, China. Sustainability 2020, 12, 10041. [Google Scholar] [CrossRef]
  5. Stuhlmacher, M.; Georgescu, M.; Turner, B.L.; Hu, Y.; Goldblatt, R.; Gupta, S.; Frazier, A.E.; Kim, Y.; Balling, R.C.; Clinton, N. Are global cities homogenizing? An assessment of urban form and heat island implications. Cities 2022, 126, 103705. [Google Scholar] [CrossRef]
  6. Yu, P.H.; Yung, E.H.K.; Chan, E.H.W.; Wong, M.S.; Wang, S.Q.; Chen, Y.Y. An integrated approach for examining urban fragmentation in metropolitan areas: Implications for sustainable urban planning. J. Clean. Prod. 2023, 419, 138151. [Google Scholar] [CrossRef]
  7. He, S.W.; Yu, S.; Li, G.D.; Zhang, J.F. Exploring the influence of urban form on land-use efficiency from a spatiotemporal heterogeneity perspective: Evidence from 336 Chinese cities. Land Use Policy 2020, 95, 104576. [Google Scholar] [CrossRef]
  8. Sharifi, A. Urban form resilience: A meso-scale analysis. Cities 2019, 33, 238–252. [Google Scholar] [CrossRef]
  9. Huang, J.X.; Cui, Y.; Chang, H.L.; Obracht-Prondzyńska, H.; Kamrowska-Zaluska, D.; Li, L. A city is not a tree: A multi-city study on street network and urban life. Landsc. Urban Plan. 2022, 226, 104469. [Google Scholar] [CrossRef]
  10. Ge, T.Y.; Hou, W.J.; Xiao, Y. Study on the regeneration of city centre spatial structure pedestrianisation based on space syntax: Case study on 21 city centres in the UK. Land 2023, 12, 1183. [Google Scholar] [CrossRef]
  11. Wang, L.; Han, X.; He, J.; Jung, T. Measuring residents’ perceptions of city streets to inform better street planning through deep learning and space syntax. ISPRS J. Photogramm. Remote Sens. 2022, 190, 215–230. [Google Scholar] [CrossRef]
  12. Xia, H.S.; Liu, Z.; Efremochkina, M.; Liu, X.; Lin, C. Study on city digital twin technologies for sustainable smart city design: A review and bibliometric analysis of geographic information system and building information modeling integration. Sustain. Cities Soc. 2022, 84, 104009. [Google Scholar] [CrossRef]
  13. Mobaraki, A.; Vehbi, B.O. A conceptual model for assessing the relationship between urban morphology and sustainable urban form. Sustainability 2022, 14, 2884. [Google Scholar] [CrossRef]
  14. Wang, J.; Fleischmann, M.; Venerandi, A.; Romice, O.; Kuffer, M.; Porta, S. EO + morphometrics: Understanding cities through urban morphology at large scale. Landsc. Urban Plan. 2023, 233, 104691. [Google Scholar] [CrossRef]
  15. Bin, C.; Yu, W. Application of parametric design in contemporary architecture design. In Proceedings of the International Conference on Optimization Design (ICOD 2010), Wuhan, China, 18–19 March 2010; Wu, X.K., Yu, L., Eds.; ASME Press: New York, NY, USA, 2010; pp. 61–64. [Google Scholar] [CrossRef]
  16. Tommasi, C.; Achille, C.; Fassi, F. From point cloud to BIM: A modelling challenge in the cultural heritage field. Int. Arch. Photogramm. Remote Sens. Spat. Inf. Sci. 2016, XLI-B5, 429–436. [Google Scholar] [CrossRef]
  17. Asl, M.R.; Bergin, M.; Menter, A.; Yan, W. BIM-based parametric building energy performance multi-objective optimization. In Proceedings of the 32nd Conference on Education and Research in Computer Aided Architectural Design in Europe (eCAADe), Delft, The Netherlands, 10–12 September 2014; pp. 455–464. [Google Scholar]
  18. Canadinc, S.T.; van Leeuwen, D.; Bakker, K. Multi-User and Web-based Parametric Modeling with Multiple Visual Programming Tools. In Proceedings of the 38th Conference on Education and Research in Computer Aided Architectural Design in Europe (eCAADe), Berlin, Germany, 16–18 September 2020. [Google Scholar]
  19. Chen, X.; Yu, J.; Zhu, Y.; Wu, R.; Tu, W. Short video-driven deep perception for city imagery. Environ. Plan. B Urban Anal. City Sci. 2024, 51, 689–704. [Google Scholar] [CrossRef]
  20. Li, Q.Y.; Taubenböck, H.; Zhu, X.X. Identification of the potential for roof greening using remote sensing and deep learning. Cities 2025, 159, 105782. [Google Scholar] [CrossRef]
  21. Zhang, J.; Zhang, X.; Tan, X.P.; Yuan, X.D. Extraction of Urban Built-Up Area Based on Deep Learning and Multi-Sources Data Fusion—The Application of an Emerging Technology in Urban Planning. Land 2022, 11, 1212. [Google Scholar] [CrossRef]
  22. Huang, C.Y.; Zhang, G.J.; Yao, J.W.; Wang, X.X.; Calautit, J.K.; Zhao, C.R.; An, N.; Peng, X. Accelerated environmental performance-driven urban design with generative adversarial network. Build. Environ. 2022, 224, 109575. [Google Scholar] [CrossRef]
  23. Gan, W.; Zhao, Z.C.; Wang, Y.K.; Zou, Y.X.; Zhou, S.Q.; Wu, Z.Q. UDGAN: A new urban design inspiration approach driven by using generative adversarial networks. J. Comput. Des. Eng. 2024, 11, 305–324. [Google Scholar] [CrossRef]
  24. Bhooshan, S. Parametric design thinking: A case-study of practice-embedded architectural research. Des. Stud. 2017, 52, 115–143. [Google Scholar] [CrossRef]
  25. Wang, J.; Huang, W.; Bilječki, F. Learning visual features from figure-ground maps for urban morphology discovery. Comput. Environ. Urban Syst. 2024, 109, 102076. [Google Scholar] [CrossRef]
  26. Chen, W.Y.; Wu, A.N.; Bilječki, F. Classification of urban morphology with deep learning: Application on urban vitality. Comput. Environ. Urban Syst. 2021, 90, 101706. [Google Scholar] [CrossRef]
  27. Jiang, F.F.; Ma, J.; Webster, C.J.; Li, X.; Gan, V.J.L. Building layout generation using site-embedded GAN model. Autom. Constr. 2023, 151, 104888. [Google Scholar] [CrossRef]
  28. Quan, S.J. Urban-GAN: An artificial intelligence-aided computation system for plural urban design. Environ. Plan. B-Urban Anal. City Sci. 2022, 49, 2500–2515. [Google Scholar] [CrossRef]
  29. Chen, X.; Xiong, Y.; Wang, S.Q.; Wang, H.F.; Sheng, T.; Zhang, Y.; Ye, Y. ReCo: A Dataset for Residential Community Layout Planning. In Proceedings of the 31st ACM International Conference on Multimedia—MM 2023, Ottawa, ON, Canada, 29 October–3 November 2023; ACM: New York, NY, USA, 2023; pp. 397–405. [Google Scholar] [CrossRef]
  30. Xu, Y.Y.; Zhou, B.; Jin, S.; Xie, X.J.; Chen, Z.L.; Hu, S.; He, N. A framework for urban land use classification by integrating the spatial context of points of interest and graph convolutional neural network method. Comput. Environ. Urban Syst. 2022, 95, 101807. [Google Scholar] [CrossRef]
  31. Pouyanfar, S.; Sadiq, S.; Yan, Y.; Tian, H.; Tao, Y.; Presa Reyes, M.; Shyu, M.-L.; Chen, S.-C.; Iyengar, S.S. A Survey on Deep Learning: Algorithms, Techniques, and Applications. ACM Comput. Surv. (CSUR) 2018, 51, 92. [Google Scholar] [CrossRef]
  32. Chandak, V.; Saxena, P.; Pattanaik, M.; Kaushal, G. Semantic Image Completion and Enhancement using Deep Learning. In Proceedings of the 2019 10th International Conference on Computing, Communication and Networking Technologies (ICCCNT), Kanpur, India, 6–8 July 2019; IEEE: Piscataway, NJ, USA, 2019. [Google Scholar] [CrossRef]
  33. Li, S.; Liu, X.; Liu, X.; Zhang, X. Spatiotemporal patterns and the influence mechanism of urban landscape pattern on carbon emission performance: Evidence from Chinese cities. Sustain. Cities Soc. 2024, 118, 105918. [Google Scholar] [CrossRef]
  34. Wu, J.; Wu, C.Y.; Zhang, Q.; Zhuang, M.H.; Xiao, H.R.; Wu, H.; Ouyang, L.; Liu, Y.; Meng, C.; Song, C.; et al. Spatiotemporal Evolution of Urban Agglomeration and Its Impact on Landscape Patterns in the Pearl River Delta, China. Remote Sens. 2023, 15, 2520. [Google Scholar] [CrossRef]
  35. Fu, F.; Li, Y.; Zhang, H.; Zhou, Y. Research on the spatiotemporal evolution of land use landscape pattern in a county area based on CA-Markov model. Sustain. Cities Soc. 2022, 80, 103704. [Google Scholar] [CrossRef]
  36. Han, D.R.; Wang, Y.; Yang, Y. The roles of surrounding 2D/3D landscapes in park cooling effect: Analysis from extreme hot and normal weather perspectives. Build. Environ. 2023, 231, 109807. [Google Scholar] [CrossRef]
  37. Xue, J.; Jiang, N.; Liang, S.W.; Pang, Q.; Yabe, T.; Ukkusuri, S.V.; Ma, J. Quantifying the spatial homogeneity of urban road networks via graph neural networks. Nat. Mach. Intell. 2022, 4, 246–257. [Google Scholar] [CrossRef]
  38. Pan, Y.; Jin, M.W.; Zhang, S.R.; Deng, Y. TEC Map Completion Using DCGAN and Poisson Blending. Space Weather—Int. J. Res. Appl. 2019, 18, e2020SW002467. [Google Scholar] [CrossRef]
  39. Reddi, S.J.; Kale, S.; Kumar, S. On the convergence of Adam and beyond. arXiv 2019, arXiv:1904.09237. [Google Scholar] [CrossRef]
  40. Loshchilov, I.; Hutter, F. SGDR: Stochastic Gradient Descent with Warm Restarts. arXiv 2016, arXiv:1608.03983. [Google Scholar] [CrossRef]
  41. Rao, Y.X.; Dai, J.Y.; Dai, D.Y.; He, Q.S.; Wang, H.Y. Effect of compactness of urban growth on regional landscape ecological security. Land 2021, 10, 848. [Google Scholar] [CrossRef]
  42. Dong, Y.X.; Liu, S.; Pei, X.S.; Wang, Y. Identifying critical landscape patterns for simultaneous provision of multiple ecosystem services—A case study in the central district of Wuhu City, China. Ecol. Indic. 2023, 158, 109111. [Google Scholar] [CrossRef]
  43. Zhang, X.; Li, D.H.; Zhang, X.Y.; Si, Y.F.; Gu, R.X. The Impact of National Economic and Technological Development Zones on Urban Form: A Case Study of the Yangtze River Delta Region. J. Nat. Resour. 2024, 39, 668–681. [Google Scholar] [CrossRef]
  44. Huang, K.L.; Liu, Y.C.; Dong, M.Q.; Lu, C.C. Integrating AIGC into product design ideation teaching: An empirical study on self-efficacy and learning outcomes. Learn. Instr. 2024, 92, 101929. [Google Scholar] [CrossRef]
  45. Salat, S. Cities and Forms: Research on Sustainable Urbanization; China Architecture & Building Press: Beijing, China, 2012. [Google Scholar]
Figure 1. Research Content Relationship Diagram.
Sustainability 17 04548 g001
Figure 2. Data division of GaWC countries. (Data source: http://bzdt.ch.mnr.gov.cn/index.html, accessed on 15 April 2025).
Sustainability 17 04548 g002
Figure 3. Map processing process.
Sustainability 17 04548 g003
Figure 4. Map cutting process.
Sustainability 17 04548 g004
Figure 6. Changes in loss function during model training process (Drawing using OriginalPro 2024).
Sustainability 17 04548 g006
Figure 7. Comparison of model-generated and real-world urban forms using six landscape pattern indices (Drawing using OriginalPro 2024).
Sustainability 17 04548 g007
Figure 8. Changes in loss function during model training process.
Sustainability 17 04548 g008
Figure 9. Prediction results of urban generation form for 500 m buffer zones in selected cities in the United States and China.
Sustainability 17 04548 g009
Figure 10. Prediction results of urban generation form for 500 m buffer zones in selected cities in Germany, the United Kingdom, and Canada.
Sustainability 17 04548 g010
Figure 11. The impact of urban generation form on the 500 m buffer zone urban form of selected cities in Switzerland, Geneva, Vietnam, Brazil, Japan, France (Drawing using GIS 10.8.1 and Fragstats).
Sustainability 17 04548 g011
Table 1. City selection in various countries.
Selection CriteriaCountries with 2–4 Cities
CountrySwitzerlandRussiaVietnamJapanBrazilFrance
CityGenevaMoscowHanoiOsakaSao PauloParis
Selection criteriaCountries with 4–6 cities
CountryBritainGermanyCanadaAustralia
CityEdinburghManchesterBerlinFrankfurtTorontoSydney
Selection criteriaCountries with more than 6 cities
CountryChinaAmerica
CityJinanNanjingShanghaiSeattleMiamiChicago
Table 2. Urban form measuring index.
Measurement DimensionMeasurement IndicatorsVariable CodeMeaningFormula
ScaleLargest patch indexLPIMeasuring the relative advantage of the largest urban patch, reflecting the single centrality of the city L P I = m a x j = 1 n a i j A × 100
Landscape percentagePLANDReflecting the relative scale of urban land use P L A N D = j = 1 n a i j A × 100
ShapeLandscape shape indexLSIReflecting the degree to which the shape of urban patches deviates from the regular structure L S I = 0.25 E A
Average fractal dimensionMPFDReflecting the complexity of urban form and the degree of human interference M P F D = j = 1 n 2 ln ( 0.25 p i j ) ln a i j n i
CompactnessDegree of aggregationAIMeasuring the spatial allocation of urban patches and land parcels A I = g i i m a x g i i × 100
Similar proximity percentagePLADJReflecting the trend of adjacent urban areas P L A D J = g i i k = 1 m g i k × 100
FragmentationNumber of plaquesNPChanges in the number of construction land patches within the research interval N P = n i
Table 3. Determination of hyperparameters for dcgan model.
Hyperparameter NameMaximum Learning RateMinimum Learning RateWeight Decay β 1 β 2 ε λ
Specific numerical values0.0020.00010.00010.80.999 1 × 10 9 0.01
Table 4. The impact of urban generation form on the 500 m buffer zone urban form of selected cities in the United States and China (Drawing using GIS 10.8.1 and Fragstats 4.2.1).
CityVariableLPIPLANDLSIMPFDAIPLADJNP
New YorkOriginal form6.741834.567621.88271.096594.870477.7320753
Generate plan6.781634.228920.93441.091895.253378.8829676
Variation0.0398 (+5‰)−0.3387 (−10‰)−0.9483 (−43‰)−0.0047 (−4‰)0.3829 (+4‰)1.1509 (+15‰)−77 (−102‰)
SeattleOriginal form2.323025.432021.82411.060797.852083.4251443
Generate plan2.251326.309721.55471.071397.498083.8624420
Variation−0.0717 (−30‰)0.8777 (+35‰)−0.2694 (−12‰)0.0106 (+10‰)−0.3540 (−4‰)0.4373 (+5‰)−23 (−51‰)
MiamiOriginal form1.492825.767624.37791.074697.168183.5342453
Generate plan1.495425.904623.67391.078197.109283.9789428
Variation0.0026 (+2‰)0.1370 (+5‰)−0.7040 (−29‰)0.0035 (+3‰)−0.0589 (−1‰)0.4447 (+5‰)−25 (−55‰)
ShanghaiOriginal form6.284731.468225.77261.102295.426982.5947585
Generate plan6.269131.724925.28571.101395.613983.0544548
Variation−0.0156 (−3‰)0.2567 (+8‰)−0.4869 (−19‰)−0.0009 (−1‰)0.1870 (+2‰)0.4597 (+6‰)−37 (−63‰)
NanjingOriginal form4.457325.760524.23421.083097.071084.9979177
Generate plan4.497426.191124.20191.078097.122485.0188182
Variation0.0401 (+9‰)0.4306 (+17‰)−0.0323 (−1‰)−0.0050 (−5‰)0.0514 (+1‰)0.0209 (+1‰)5 (+28‰)
JinanOriginal form2.237838.559922.17071.110795.382285.7988322
Generate plan2.278538.650021.84101.109195.711487.2049282
Variation0.0407 (+18‰)0.0901 (+2‰)−0.3297 (−14‰)−0.0016 (−1‰)0.3292 (+3‰)1.4061 (+16‰)−40 (−124‰)
Table 5. The impact of urban generation form on the 500 m buffer zone urban form of selected cities in Germany, the United Kingdom, and Canada (Drawing using GIS 10.8.1 and Fragstats).
CityVariableLPIPLANDLSIMPFDAIPLADJNP
TorontoOriginal form5.789037.324419.31601.113996.224483.9813194
Generate plan5.783737.400019.37141.113796.212883.9435199
Variation−0.0053 (−1‰)0.0756 (+2‰)0.0554 (+3‰)−0.0002 (−0‰)−0.0116 (−0‰)−0.0378 (−1‰)5 (+26‰)
EdinburghOriginal form2.203825.820226.93371.107493.639673.4828870
Generate plan2.211125.712426.26711.109193.695174.3451805
Variation0.0073 (+3‰)−0.1078 (−4‰)−0.6666 (−24‰)0.0017 (+2‰)0.0555 (+1‰)0.8623 (+12‰)−65 (−75‰)
ManchesterOriginal form1.963422.094526.72711.118191.808472.5331586
Generate plan1.815822.837926.82881.119791.706272.5871592
Variation−0.1476 (−8‰)0.7434 (+3‰)0.1017 (+4‰)0.0016 (+1‰)−0.1022 (−1‰)0.0540 (+1‰)6 (+10‰)
SydneyOriginal form5.340541.811219.88671.166594.632786.3881399
Generate plan5.380741.464719.96731.165794.608886.3278401
Variation0.0402 (+8‰)−0.3465 (−8‰)0.0806 (+4‰)−0.0008 (−1‰)−0.0239 (+0‰)−0.0603 (−1‰)2 (+5‰)
BerlinOriginal form10.297136.860219.56011.084095.909384.9363375
Generate plan10.337236.708119.37181.083495.946084.9983372
Variation0.0401 (+4‰)−0.1521 (−4‰)−0.1883 (−10‰)−0.0006 (−1‰)0.0367 (+0‰)0.0620 (+1‰)−3 (−8‰)
FrankfurtOriginal form2.056428.708218.23171.118293.781189.2962489
Generate plan2.041628.916018.34491.118193.756689.2010499
Variation−0.0148 (−7‰)0.2078 (+7‰)0.1132 (+6‰)−0.0001 (−0‰)−0.0245 (−0‰)−0.0952 (−1‰)10 (+20‰)
Table 6. The impact of urban generation form on the 500 m buffer zone urban form of selected cities in Switzerland, Geneva, Vietnam, Brazil, Japan, and France (Drawing using GIS 10.8.1 and Fragstats).
CityVariableLPIPLANDLSIMPFDAIPLADJNP
GenevaOriginal form7.058232.980322.20261.105395.177382.5646638
Generate plan7.008133.180421.70031.107095.225283.0807611
Variation−0.0501 (−7‰)0.2001 (+6‰)−0.5023 (−23‰)0.0017 (+2‰)0.0479 (+1‰)0.5161 (+6‰)−27 (−42‰)
MoscowOriginal form4.341534.737217.76901.123295.442788.1501190
Generate plan4.217735.816218.25231.122095.436387.8502210
Variation−0.1238 (−29‰)1.0790 (+31‰)0.4833 (+27‰)−0.0012 (−1‰)−0.0064 (−0‰)−0.2999 (−3‰)20 (+105‰)
HanoiOriginal form1.432235.402425.96701.086496.547982.17701159
Generate plan1.376536.618525.29931.086596.707982.98281115
Variation−0.0557 (−39‰)1.2161 (+34‰)−0.6677 (−26‰)0.0001 (+0‰)0.1600 (+2‰)0.8058 (+10‰)−44 (−38‰)
Sao PauloOriginal form3.530153.294627.43881.140993.963582.7432951
Generate plan3.581150.244127.53601.140493.991982.5968947
Variation0.0510 (+14‰)−3.0505 (−57‰)0.0972 (+4‰)−0.0005 (−0‰)0.0284 (+0‰)−0.1464 (−2‰)−4 (−4‰)
OsakaOriginal form2.869544.198424.24191.060295.471386.2800783
Generate plan2.739643.853224.09941.067595.257686.3757820
Variation−0.1299 (−5‰)−0.3452 (−8‰)−0.1425 (−6‰)0.0073 (+7‰)−0.2137 (−2‰)0.0957 (+1‰)37 (+47‰)
ParisOriginal form1.872858.779322.05231.116091.902985.17761390
Generate plan1.922457.203921.43571.118092.063985.60181324
Variation0.0496 (+27‰)−1.5754 (−27‰)−0.6166 (−28‰)0.0020 (+2‰)0.1610 (+2‰)0.4242 (+5‰)−66 (−48‰)
Disclaimer/Publisher’s Note: The statements, opinions and data contained in all publications are solely those of the individual author(s) and contributor(s) and not of MDPI and/or the editor(s). MDPI and/or the editor(s) disclaim responsibility for any injury to people or property resulting from any ideas, methods, instructions or products referred to in the content.

