Article

Environmental Microbiological Sampling in Civil Settings: Comparative LCA Analysis of Green Cleaning Techniques vs. Traditional Methods in Accordance with New Italian CAM Guidelines

1
Department of Chemical, Pharmaceutical and Agricultural Sciences, University of Ferrara, 44121 Ferrara, Italy
2
Punto 3 Srl S.B., 44122 Ferrara, Italy
3
Department of Environmental and Prevention Sciences, University of Ferrara, 44121 Ferrara, Italy
4
LTTA Laboratory for Advanced Therapies, Technopole of Ferrara, 44121 Ferrara, Italy
5
CIB—Interuniversity Centre for Biotechnologies, University of Ferrara, 44121 Ferrara, Italy
*
Author to whom correspondence should be addressed.
These authors contribute equally to this work and share first authorship.
Sustainability 2025, 17(10), 4546; https://doi.org/10.3390/su17104546
Submission received: 17 April 2025 / Revised: 9 May 2025 / Accepted: 14 May 2025 / Published: 16 May 2025
(This article belongs to the Special Issue Life Cycle Assessment (LCA) and Sustainability)

Abstract

:
This research conducts a comparative life cycle assessment (LCA) to examine both the ecological footprint and microbiological performance of eco-friendly and traditional cleaning methods in non-clinical environments. Conducted in accordance with the updated Minimum Environmental Criteria (CAMs), the research follows the principles and framework established by UNI EN ISO 14040 and 14044. Additionally, the assessment of carbon footprint (kg CO2e) adheres to ISO 14067:2018, with guidance from Product Category Rules (PCR 2011:03 v3.0.1). Our findings demonstrate that the Green Protocol implemented by Dussmann Service reduces the carbon footprint of cleaning activities by 20.0% compared to the traditional protocol, equating to an annual reduction of 156 kg CO2 at the pilot site. Laboratory analyses confirm that the Green Protocol maintains hygiene standards equivalent to conventional methods, ensuring adequate microbiological quality while significantly lowering environmental impact. The study highlights the feasibility of integrating eco-friendly cleaning practices without compromising effectiveness. Future research should explore the scalability, cost-efficiency, and long-term benefits of this approach. This assessment provides a scientifically validated foundation for adopting sustainable cleaning methodologies in professional settings, supporting the transition towards environmentally responsible facility management.

1. Introduction

Recent studies have highlighted a significant rise in public awareness regarding environmental challenges, which has, in turn, increased the importance of developing sustainable processes. These practices play a key role in reconciling social productivity goals with environmental safeguards and natural resource conservation. According to the literature, robust sustainability strategies and thorough risk assessments are essential to promoting responsible chemical use that minimizes ecological impact without compromising efficiency [1].
Life cycle assessments (LCAs) have emerged as an essential tool for evaluating the environmental impacts of products or processes throughout their life cycle. Recent studies have recognized LCAs not only as a traditional environmental assessment methodology but also as a key component for incorporating economic and social dimensions, as outlined in the Life Cycle Sustainability Assessment (LCSA) framework [2,3]. This comprehensive approach considers environmental, economic, and social impacts, underscoring the necessity for a holistic assessment strategy in product life cycles.
In the management of civil spaces, effective cleaning and sanitization protocols play a critical role in ensuring hygiene and safety. These practices are vital for preventing cross-contamination and addressing the growing concern of microbial resistance to sanitizing agents [4,5]. The widespread use of chemical disinfectants, while effective, has contributed to increasing microbial adaptation, diminishing their long-term efficacy and prompting a shift toward alternative cleaning strategies. This has spurred research into sustainable solutions, such as eco-friendly products and innovative nanoformulations, to enhance both hygiene and environmental responsibility [6].
Traditional chemical-based disinfection methods, despite their common use in offices, public buildings, and other high-traffic environments, present significant drawbacks. Persistent contamination, the development of resistant microbial strains, and the environmental impact of excessive chemical use highlight the urgent need for more sustainable and effective approaches [7]. In this context, microbial monitoring has become an essential tool for evaluating cleaning protocol performance and ensuring a data-driven approach to optimizing both cost-effectiveness and efficacy [4].
The principles of LCAs offer a valuable framework for assessing sustainability in cleaning practices beyond healthcare settings. Office buildings, schools, and commercial spaces, where cleaning occurs frequently, could greatly benefit from adopting eco-friendly methods that reduce health risks and environmental impact. Liu and Qian emphasized that sustainability must be considered throughout a building’s entire life cycle, from material choices to maintenance processes [7]. Comparing traditional chemical-based cleaning methods with greener alternatives is especially crucial in high-traffic areas, where resistance to sanitizers can undermine long-term hygiene standards.
This research seeks to assess the performance of environmentally certified cleaning products—such as ultra-concentrated detergents—relative to conventional alternatives. The research aligns with the broader objective of promoting sustainable cleaning practices in accordance with the Minimum Environmental Criteria (CAM), contributing to a more informed understanding of how to balance environmental responsibility with operational efficiency in civil building management.

2. Materials and Methods

2.1. Objectives of the Comparative LCA

The objective of this study was to conduct a comparative life cycle assessment (LCA) highlighting the environmental advantages and hygienic-microbiological performance of the “Green” cleaning protocol defined by the updated CAM, compared to conventional cleaning approaches.
Sustainability 17 04546 i001
The Minimum Environmental Criteria (CAM) for cleaning services, which were published in the Official Journal on 19 February 2021 and came into effect on 19 June 2021, include as a selection criterion the bidder’s ability to show the environmental and qualitative advantages of their proposed methods in comparison with traditional approaches.
To ensure the scientific rigor, transparency, and representativeness of the comparative LCA study, Dussmann followed the primary international standards and guidelines for such assessments, including UNI EN ISO 14040:2021 on environmental management and life cycle assessment principles, UNI EN ISO 14044:2021 on life cycle assessment requirements and guidelines, and UNI EN ISO 14067:2018 on greenhouse gases and product carbon footprint quantification [8,9,10].
PCR—Professional Cleaning Services for Buildings v3.0.1, 2011-03-UN CPC 853 was also adopted.

2.2. Scope of Application

This study assessed the cleaning service provided by Dussmann Service at the COIMA Headquarters (COIMA HQ), located at Piazza Gae Aulenti, 12–20124, Milan (MI), Italy. The site chosen for the analysis represents a typical civil cleaning environment, encompassing offices, meeting rooms, waiting areas, refreshment spaces, service areas, and connecting areas. It was selected for its suitability in terms of accurately determining the diversity of surfaces, levels of dirt, cleaning frequency, and methods used in civil cleaning environments.
The analysis covered all the operational areas within the building where Dussmann Service is active, with a total of 4432.17 square meters. The comparative study focused on the cleaning activities defined in the customer’s service agreement for the selected pilot site. These activities were carefully chosen to reflect the overall service needs, including the area covered, material and energy consumption, and their environmental impacts.

2.2.1. Service Definition: Protocols and Areas

A cleaning protocol adheres to the service specifications established by the customer for both routine and periodic cleaning activities. These activities are planned and executed at predetermined intervals and frequencies, as outlined in the service agreement. In accordance with international LCA evaluation standards, the initial step was to develop the analytical and calculation systems involved and identifying and mapping the characteristics of Dussmann Service’s cleaning operations. Subsequently, significant activities were analyzed in the field by sampling material consumption—including water, chemicals, textile equipment, and other supplies—as well as the energy usage of cleaning machinery over different time periods and across all operational areas. This approach facilitated the construction of a schematic model that accurately represents the actual operations performed.
All significant cleaning interventions conducted during the sampling period were included in the study’s impact assessment. An intervention was deemed significant if it created a flow into or out of the system that was non-negligible in terms of energy exchanged or the environmental impact produced [11].
Each protocol was assessed over a four-week period, ensuring a representative timeframe for meeting service specifications and collecting data on key activities. The traditional protocol was monitored from 14 October to 8 November 2024, covering 26 sampling days, with cleaning operations performed on 19 of those days. The green protocol was evaluated from 11 November to 11 December 2024, spanning 31 sampling days, with activities carried out on 23 days. Cleaning operations were primarily conducted daily, weekly, and monthly, adhering to contractual terms for continuous service. Activities occurring less frequently than once a month were excluded from the analysis and were not included in the monitored protocols.

2.2.2. Cleaning Procedures

The cleaning procedures outlined in the Green and Traditional protocols primarily differed in the types of cleaning agents used, their initial concentrations, necessary dilutions, and the equipment and machinery employed.

Cleaning Agents

The main differences between the Traditional Protocol and the Green Protocol were in the chemical composition of the cleaning agents used.
In the Traditional Protocol, the formulations were pre-diluted to the final usage concentration and contained various classes of compounds. Specifically, the cleaning agents included anionic and non-ionic surfactants, along with auxiliary agents. Some formulations incorporated lactic acid, non-ionic surfactants, and phosphoric acid, while others contained aliphatic alcohols combined with non-ionic surfactants, contributing to their cleaning efficacy and material compatibility.
In contrast, the Green Protocol employed concentrated formulations with a different chemical profile, focusing on environmentally preferable alternatives. The cleaning agents included non-ionic and anionic surfactants, isopropyl alcohol, chelating agents, and auxiliary compounds. Additionally, specific formulations contained citric acid and non-ionic surfactants, while others incorporated 2-butoxyethanol, chelating agents, anionic and non-ionic surfactants, potassium pyrophosphate, potassium hydroxide, and auxiliary compounds.
These variations in chemical composition influence the environmental impact, biodegradability, and potential effects on treated surfaces and microbial communities, which are critical factors for assessing the overall sustainability of the two cleaning protocols.
While lactic acid is biodegradable and relatively safe, phosphoric acid can contribute to eutrophication if released into water systems and is classified as hazardous in concentrated forms, making its environmental impact more concerning. In contrast, the green protocol included ingredients such as 2-butoxyethanol, a glycol ether commonly used in green formulations due to its efficacy and relatively low acute toxicity. However, it is important to note that 2-butoxyethanol is only moderately biodegradable and can pose health risks if misused. Other green-labeled components in our tested products included plant-derived surfactants (e.g., alkyl polyglucosides), citric acid, and enzymatic complexes, all of which are readily biodegradable, have low aquatic toxicity, and are generally recognized as safer for both human health and the environment.

Cleaning Equipment and Machinery

Regarding cleaning equipment and machinery, the Green Protocol utilized eco-certified devices specifically designed to reduce water and chemical consumption. This included a floor cleaning fringe composed of microfiber materials optimized for high dirt removal with minimal detergent usage, a reusable multi-purpose cleaning cloth made from sustainable fibers, a cleaning trolley designed for efficient waste separation and reduced plastic components, a washer-dryer operated in an energy-saving mode, and a domestic washing machine set to a 40 °C washing cycle to lower energy demand.
In contrast, the Traditional Protocol employed a conventional floor cleaning fringe designed for standard detergent application, a microfiber cleaning cloth with high absorption capacity, a standard cleaning trolley with a traditional compartment system, a washer-dryer functioning in normal energy consumption mode, and a domestic washing machine set to a 60 °C washing cycle, which requires more energy compared to the Green Protocol’s lower-temperature setting.
These differences highlight the emphasis of the Green Protocol on sustainability, aiming to minimize environmental impact through optimized cleaning tools and reduced energy consumption.

Summary of Key Differences

The key differences between the Green and Traditional cleaning protocols were in the chemical composition, cleaning tools, and machinery mode of use.
In terms of chemical composition and dilution, the Green Protocol generally made use of super-concentrated products with environmentally friendly chemical compounds, with specific dilution factors designed to minimize environmental impact. In contrast, the Traditional Protocol relied on lower concentrations and some ready-to-use products, not all Ecolabel, each with different dilution requirements suited to conventional cleaning methods.
When it comes to cleaning tools, the Green Protocol employed eco-friendly microfiber cloths, emphasizing sustainability, while the Traditional Protocol used standard microfiber alternatives, which did not focus as much on environmental concerns.
Regarding machinery, the Green Protocol prioritized eco-friendly methods of use that reduced energy, water, and chemical usage, whereas the Traditional Protocol relied on more conventional consumption modes which did not offer the same level of environmental efficiency [12,13].

2.3. LCA Analysis Methodology

The methodology utilized in this study employed a comparative approach based on the new CAMs (D.M. 29 January 2021) and complied with the technical standards of UNI EN ISO 14040 and UNI EN ISO 14044. These standards established the principles and framework for LCA and specified the requirements and guidelines for conducting an LCA, respectively [8,9].
To evaluate the carbon footprint of the product system concerning greenhouse gas emissions (kg CO2e), the study also references ISO 14067:2018, which focuses on the climatic footprint of products [10]. Specifically, it applies the quantification requirements outlined in this standard. Section 6.2 of ISO 14067 advises consulting Product Category Rules (PCRs) for more specific industry guidance. For this analysis, PCR 2011:03 v3.0.1, published on 13 April 2022, was used. This PCR provides guidelines specifically for the “professional cleaning services for buildings” category, covering both civil and sanitary structures in the public and private sectors. The PCR details the criteria on data type, quality, and exclusion standards necessary for the analysis.

2.3.1. Functional Unit

In accordance with ISO 14067:2018, Section 6.3.3, the present study defined the functional unit as “1 square meter of representative average area maintained clean for 1 year”. The definition of this area considered the various types of environments present within the sample areas, ensuring the functional unit was representative of typical spaces maintained by cleaning services.

2.3.2. System Boundaries

The study adopted a “cradle to grave” approach to define its system boundaries, as outlined in PCR 2011:03. The analysis was broken down into three phases—upstream, core, and downstream. These phases are illustrated in Figure 1 and described in Section 4.3.1 of the PCRs. The “upstream” phase involved processes related to the sourcing and manufacturing of materials and products used in the cleaning services, while the “core” phase covered the main cleaning activities. The “downstream” phase addressed the end-of-life of the cleaning products and equipment, as well as the final disposal or recycling processes. This comprehensive approach ensured that the full environmental impact of the cleaning services was assessed.

Upstream Processes

The upstream phase included raw material extraction and processing, transport to suppliers, and the production of consumables—chemicals (e.g., detergents, disinfectants) and textiles (e.g., fringes, cloths)—with associated plastic and cardboard packaging. It also involved the production of durable goods expected to last over three years, such as machines and trolleys. Production processes related to single-use textiles, economic consumables (e.g., waste bags, toilet paper, hand towels), fringe support tools (e.g., frames), and dosing units were excluded, as they remained identical across both protocols under comparison.

Core Processes

The core phase comprised the distribution of consumables to construction sites, on-site service delivery using chemicals, textiles, equipment, and machinery, fuel production for transport, energy (electricity and heat) generation for on-site operations, and water use for dilution and washing.
Personnel transport and maintenance operations were excluded, as they were consistent between the two analyzed protocols.

Downstream Processes

The downstream phase involved the transport and processing of solid waste resulting from the operational activities.

2.3.3. Impact Category

The comparative LCA methodology centered on the Global Warming Potential (GWP) category, in accordance with the Intergovernmental Panel on Climate Change (IPCC) framework [14]. This method quantified the climate impact of gases such as CO2, CH4, N2O, SF6, HFCs, and PFCs, based on their radiative forcing and atmospheric lifetimes.
Each gas’s emissions were converted into “kg CO2 equivalents” using characterization factors derived from the IPCC’s 6th Assessment Report (2021) [15], assuming a 100-year time horizon. CO2 was the reference gas, with a GWP of 1. The total climate impact was determined by summing the kg CO2 equivalent contributions of all gases.

2.3.4. Methodological Assumptions of the Comparative Study

This study followed the methodological framework for comparative analysis as defined by ISO 14026 [16]. Both systems being assessed shared the same functional unit and were comparable in terms of spatial layout and intervention types. The areas selected for the study were identical, offering consistency in terms of surface materials, usage conditions, dirt levels, the proportion of clutter (including furniture and other elements), and floor types.
Moreover, the interventions and frequencies of operation were consistent, as were the rules governing the inclusion of input and output flows. Consistency was also ensured in data quality requirements, life cycle inventory (LCI) units, calculation methods, and allocation rules. The chosen impact categories and characterization factors aligned with ISO 14067 and GWP100, based on IPCC AR6 guidelines.

2.4. Sampling Plan for Microbiological Analysis

We developed our sampling plan based on recognized protocols, collecting each sample three times to ensure reliability. Sampling occurred in the different zones outlined in Table 1, with specimens gathered both before and after applying the cleaning procedures.

2.5. Microbiological Evaluation

We standardized our sampling by using RODAC plates and Dey Engley-neutralized swabs procured from Liofilchem (Roseto degli Abruzzi, Italy). Before microbiological testing, each surface was visually inspected for its condition, level of soiling, and moisture content [17,18]. Microbial loads were measured via aerobic colony counts (ACC) on neutralizer-coated TSA RODAC plates (48 h at 37 °C), enterobacteria on MCA, staphylococci on MSA, and yeasts/molds on SDA. SDA plates were incubated at 25 °C for up to 120 h. Flat areas were sampled by pressing RODAC plates for 30 s using a contact plate weight applicator for 30 s (VWR Collection, International, Milano, Italy) and swabbed within a 100 cm2 template; swabs were then transferred to agar plates. For irregular surfaces, a sterile, pre-moistened cotton wool swab was employed to cover the entire hand contact area before inoculating the agar plates.
All plates were incubated within two hours of sampling, and colonies were enumerated at 24–48 h. According to standard thresholds, up to 39 colonies (~2.5 CFU/cm2) is considered minimal growth, while fewer than six colonies (<2.5 CFU/cm2) is scant. A total of 326 samples per cleaning protocol (TT and TG) were taken across floors, furniture, telephones, and sanitary fixtures. Samples traveled in refrigerated, data-logged bags (0–4 °C). After incubation, colonies were counted, isolated, and identified following established protocols [19,20].

2.6. Microbial Identification

After vortexing swab samples to release microbes into solution, aliquots were spread onto 90 mm Petri dishes with 20 mL of TSA, MCA, MSA, or SDA. Plates incubated at 36 °C (SDA at 25 °C) were inspected daily for colony emergence over five days. Colonies with unique phenotypic traits (morphology, shape, color) were isolated and preserved in a 50% (v/v) glycerol solution at −80 °C. Final species identification utilized API kits (bioMérieux, Grassina, FI, Italy) in accordance with the supplier’s guidelines [21].

3. Results

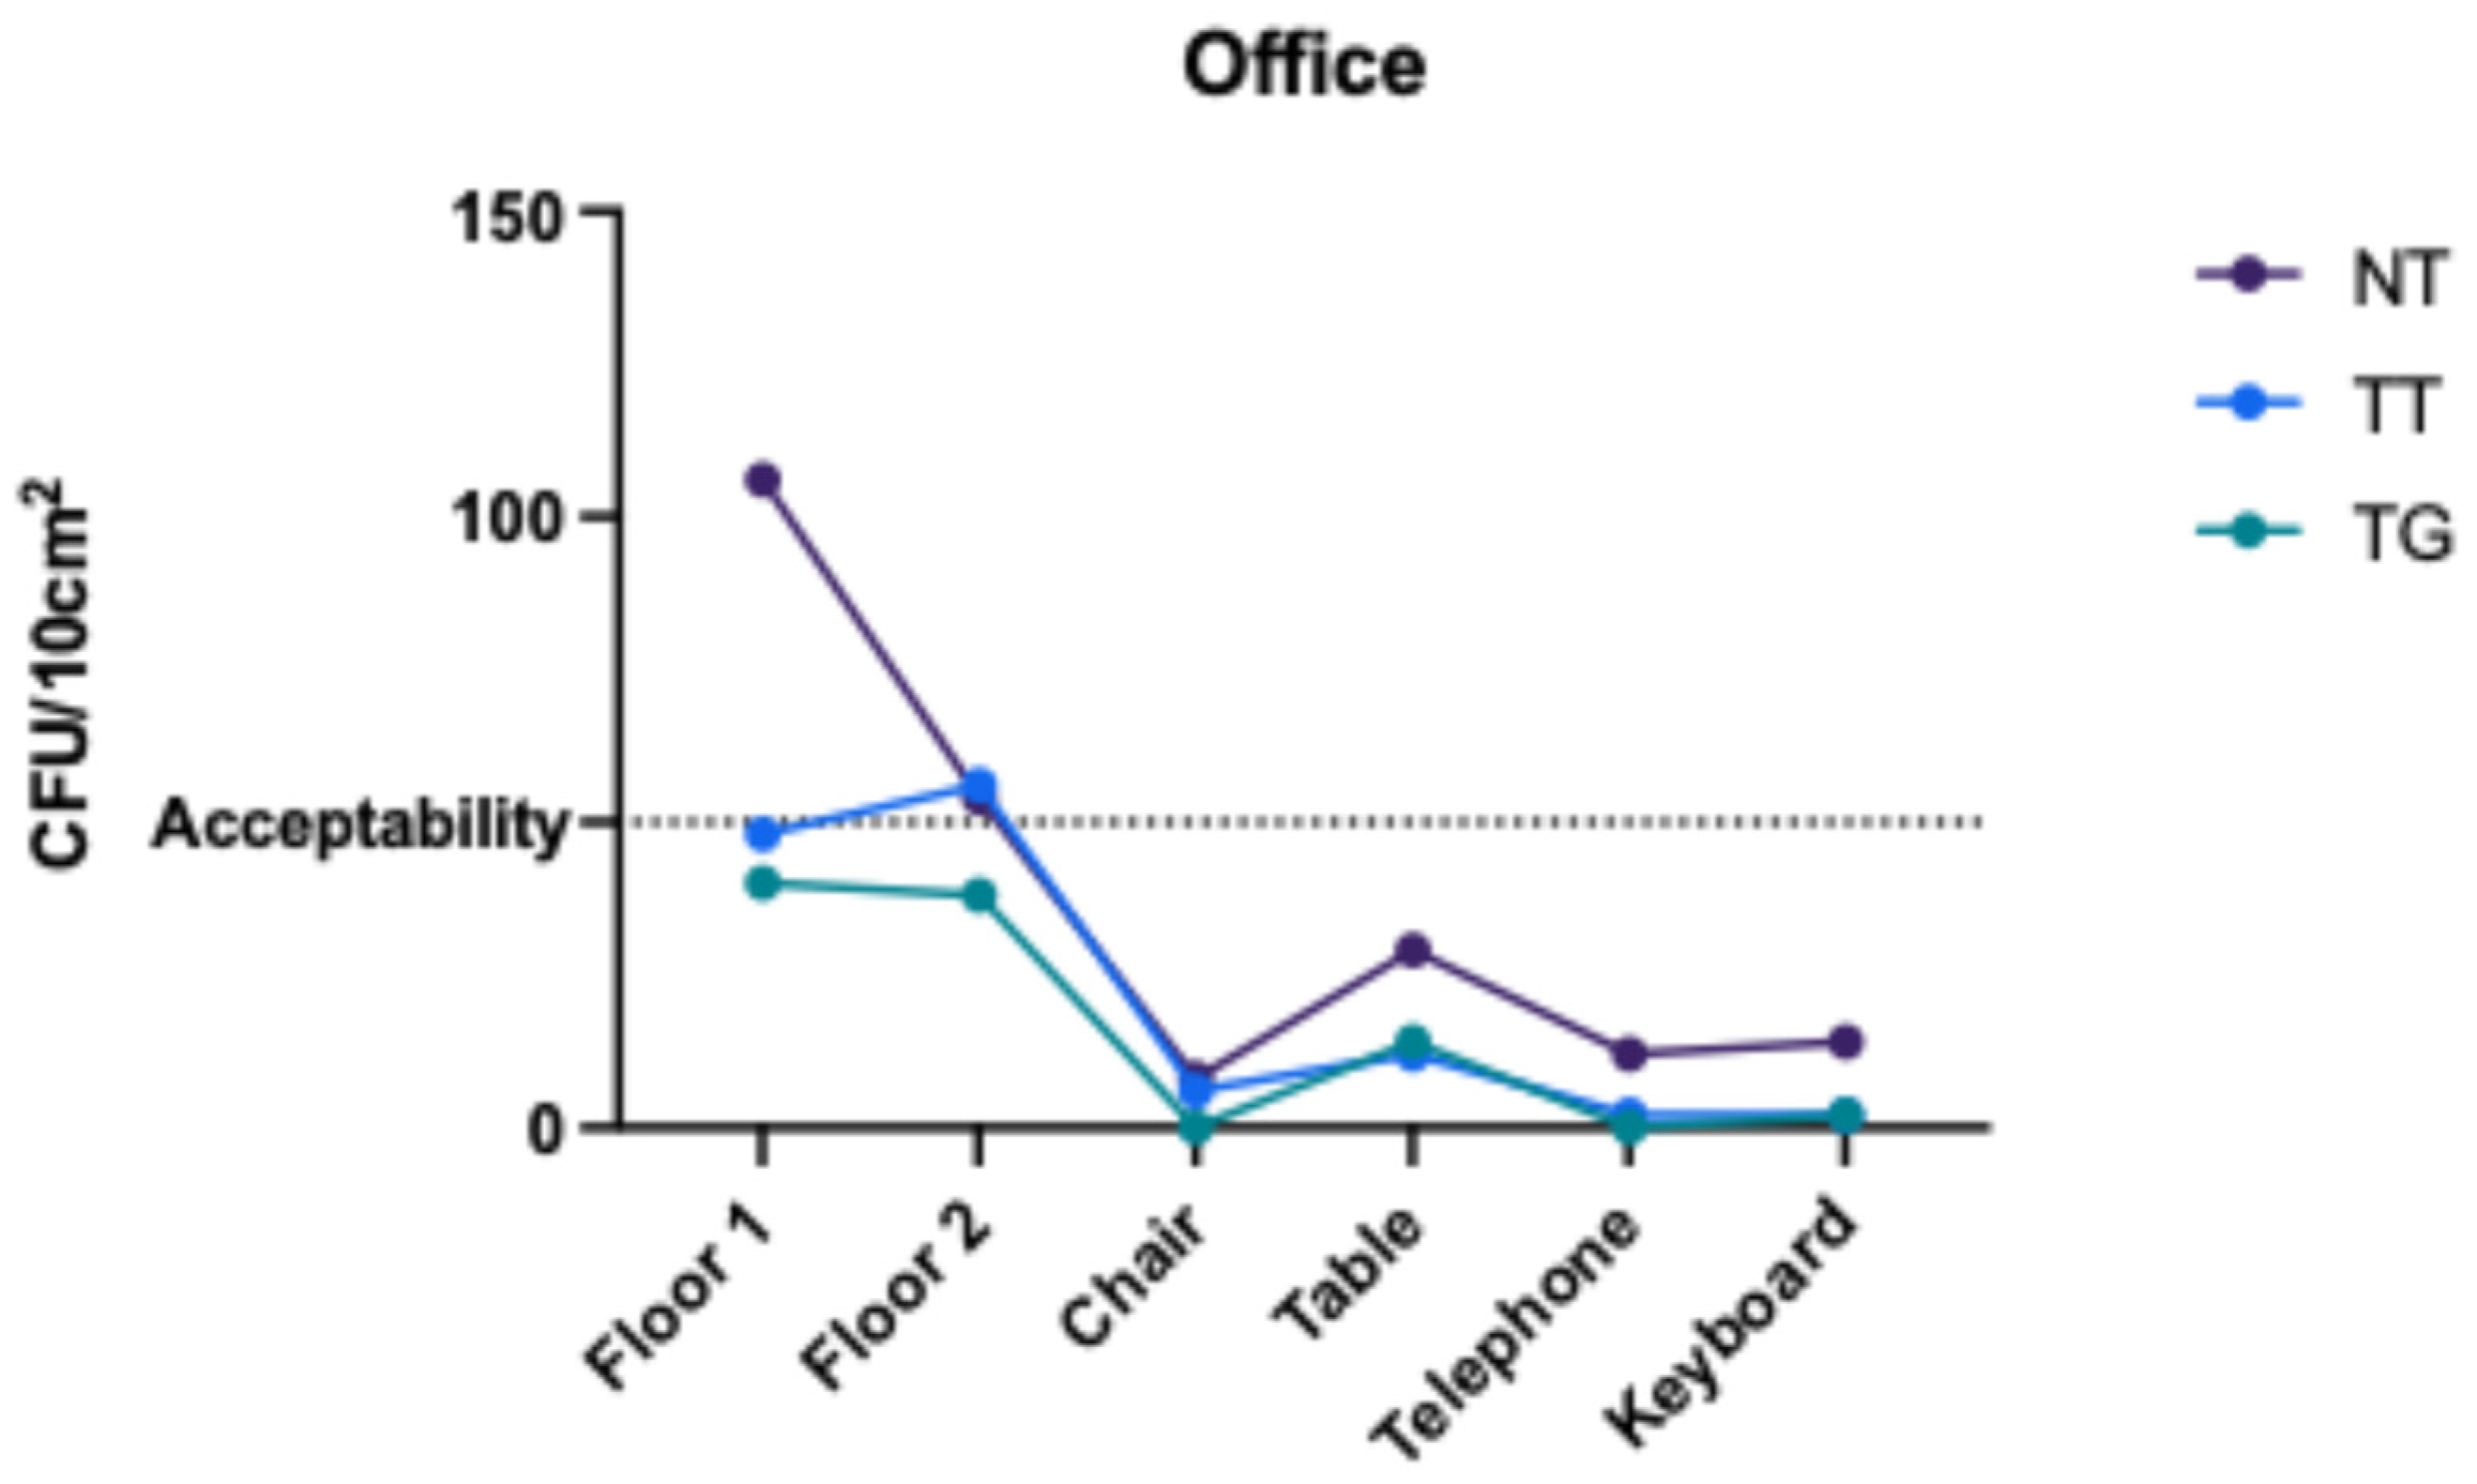
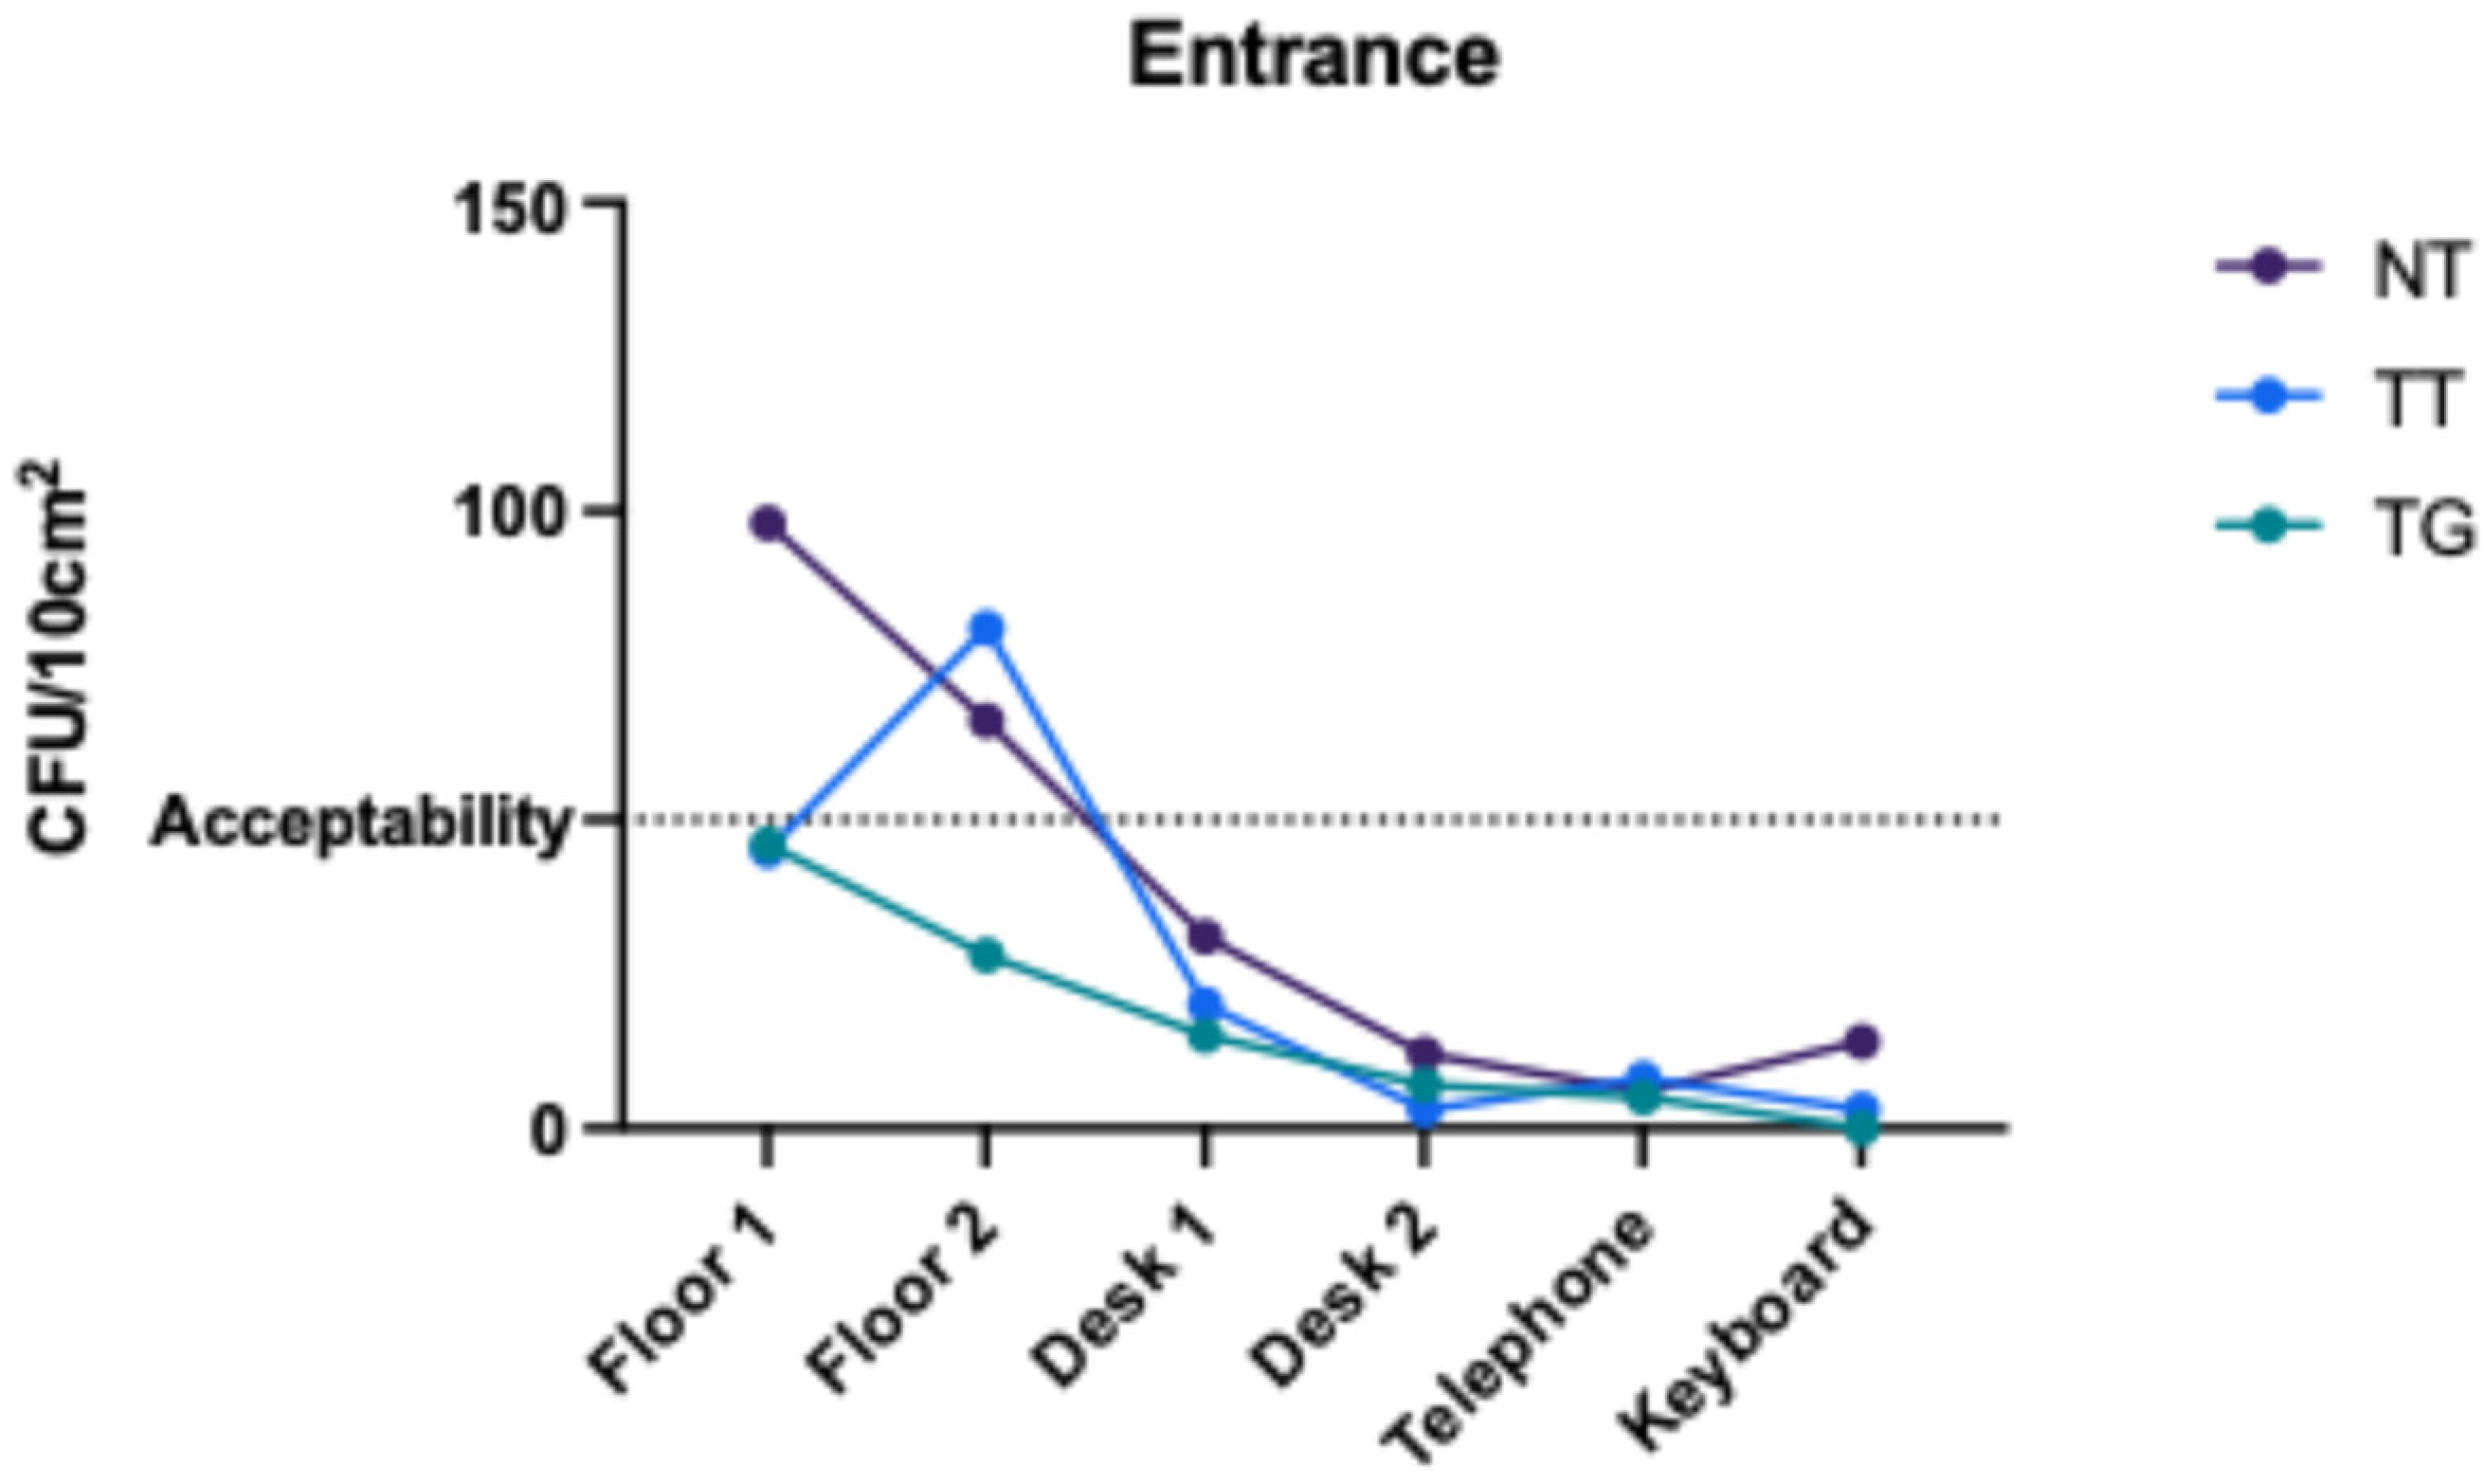
3.1. Microbiological Evaluation

Our microbiological analysis encompassed samples collected from staff-used areas, comparing outcomes after either standard cleaning procedures or the Green Protocol. All samples, whether subjected to traditional cleaning or the Green Protocol, complied with microbiological acceptance limits. This limit, defined by guidelines, represents the highest allowable number of microorganisms (expressed in CFU/10 cm2) for sanitization to be considered acceptable. The Green Protocol showed cleaning and hygiene results that were not only comparable to but often better than those of the traditional cleaning method across all locations sampled, as demonstrated in Figure 2, Figure 3, Figure 4, Figure 5, Figure 6 and Figure 7.
Different areas within the spaces were systematically sampled and plated on selective media to identify various microbial species. Mannitol Salt Agar (MSA) was used for the isolation of Staphylococcus aureus, a common pathogen associated with infections, especially in healthcare and high-traffic environments. MacConkey Agar (MCA) was employed for isolating enterobacteria, such as Escherichia coli, which is often used as an indicator of fecal contamination and hygiene levels. Additionally, Sabouraud Dextrose Agar (SDA) was utilized to isolate yeasts, specifically Candida albicans, and molds, including Aspergillus niger, both of which are known to thrive in humid environments and can pose risks to individuals with weakened immune systems.
The microbiological analysis did not reveal any pathogenic microorganisms in the sampled areas. To further confirm and characterize the microorganisms present, the biochemical API Test (Biomerieux, Grassina, Italy) was conducted. This test enables the isolation and preliminary identification of bacterial and fungal species based on their biochemical properties. The test identified several microorganisms, although none were found to be pathogenic. This suggests that the cleaning protocols in place, whether traditional or Green Protocol, were effective in maintaining microbiological safety in the sampled spaces. The identified microorganisms are typically found in environmental settings, further confirming the adequacy of the cleaning treatments applied. (See Table 2).

3.2. Life-Cycle Comparative Analysis Results

Our comparative LCA highlighted that the Green Cleaning Protocol led to an annual reduction of 35 g CO2e emissions per square meter of cleaned surface when compared to the Traditional Protocol. This environmental benefit became even more significant when the protocol was applied across the entire pilot site—specifically, the COIMA HQ building in Milan. The analysis showed that by following the Green Protocol, the cleaning service at the pilot site avoided emitting 156 kg of CO2 annually. To contextualize this saving: it is equivalent to the carbon emissions generated by a medium-sized car traveling 1297 km, the energy required to charge approximately 19,456 smartphones, or the annual carbon sequestration of around 21 mature trees.
Furthermore, the study found that applying Dussmann Service’s Green Protocol at the pilot site resulted in a 20.0% reduction in the cleaning service’s overall carbon footprint compared to the Traditional Protocol. Table 3 details the specific processes and impact categories of the Protocol that contributed most significantly to this improvement.
The most substantial reduction in CO2e emissions within the Green Cleaning Protocol was linked to chemical consumption. The use of super-concentrated products—with a lower environmental impact per unit of cleaning solution—and larger-volume packaging led to a reduction of 111 kg CO2 per year at the pilot site. This corresponded to a 32% decrease compared to the products used in the Traditional Protocol. Moreover, this product and packaging choice contributed to a reduction in plastic and cardboard packaging waste, as well as a lower transportation footprint.
Energy consumption associated with the use of cleaning machines, such as washing machines and washer-dryers, also saw a significant reduction. By implementing a lower washing temperature in the washing machine and using more energy-efficient settings, the protocol reduced emissions by 74 kg of CO2 per year, a 33% decrease compared to the Traditional Protocol.
Another notable contributor to impact reduction was the extended lifespan of textile equipment. The adoption of more durable textiles, capable of withstanding additional reconditioning cycles, resulted in a further of 9 kg of CO2 reduction per year, equating to a 57% improvement over to the textiles used in the Traditional Protocol.
However, the Green Protocol presented higher environmental impacts than the Traditional Protocol in a few specific areas: water consumption increased CO2 emissions by 0.4 kg/year (+17%), and wastewater treatment added 1.7 kg of CO2/per year (8%). These increases were primarily due to the greater number of textile reconditioning cycles required by the Green Protocol. The most significant increase in the Green Protocol compared to the Traditional Protocol was, however, associated with the production and end-of-life management of machinery and trolleys, which contributed an additional 36.8 kg CO2/year, representing a 22% increase. Among these, trolley production was identified as the most impactful factor.
In terms of the processes contributing most significantly to overall emissions, for the Green Protocol, the production of cleaning chemicals accounted for 17.6% of the total impact, followed by production of laundry chemicals 15.5%. Energy consumption from the washing machine contributed 14.6%, while the washer-dryer accounted for 12.1%. Wastewater treatment from laundry activities contributed 3.9%.
For the Traditional Protocol, the highest impact was observed for the production of cleaning chemicals, which accounted for 29.3% of the total emissions. This was followed by the energy consumption from the washing machine, at 18.4%. The production of the washer-dryer and its energy use both accounted for 10.6%, while the production of laundry chemicals contributed 7.9%, and trolley manufacturing represented 4.8%.

4. Discussion and Conclusions

This comparative life cycle assessment (LCA) study, conducted by Dussmann Service in alignment with the updated Minimum Environmental Criteria (CAMs) outlined in the Ministerial Decree of 29 January 2021, successfully met the required standards by demonstrating both the enhanced efficacy and the reduced environmental footprint of the proposed cleaning techniques. The findings indicate that the implementation of the Green Protocol at the pilot location led to a 20.0% reduction in the service’s carbon footprint compared to the Traditional Protocol. This translates to an annual avoidance of approximately 156 kg of CO2 emissions, underscoring the protocol’s positive impact on sustainability.
Beyond its environmental benefits, the Green Protocol maintained high standards of microbiological quality, ensuring hygiene levels that were appropriately adapted to the specific environmental conditions of the facilities studied. The microbiological analyses, conducted by accredited laboratories and corroborated by relevant scientific literature [22,23,24,25,26], confirmed that the Green Protocol achieved cleaning and sanitization outcomes that were not only on par with but, in many cases, superior to those of conventional cleaning methodologies across all tested locations.
Furthermore, the comparative LCA, carried out in accordance with internationally recognized standards (UNI EN ISO 14040, 14044, and 14067), highlighted the significant reduction in environmental impact associated with the Green Protocol. This assessment reinforced the protocol’s potential as a sustainable alternative to traditional cleaning methods in buildings for civil use and similar settings, demonstrating that ecological considerations can be effectively integrated without compromising hygiene and safety standards.
Future research could explore long-term effects, scalability to different facility types, and potential improvements in waste reduction and resource efficiency. Additionally, further studies may consider the economic feasibility and cost-effectiveness of the Green Protocol in large-scale applications. By prioritizing both environmental responsibility and stringent hygiene requirements, the Green Protocol presents a compelling model for sustainable cleaning practices in professional settings.

Supplementary Materials

The following supporting information can be downloaded at: https://www.mdpi.com/article/10.3390/su17104546/s1.

Author Contributions

Conceptualization, P.M. and C.B.; methodology, P.M., M.B., R.F., C.B., L.V. and B.B.; investigation, R.F., M.B., M.P., A.C., C.N., M.F., L.V. and B.B.; data curation, R.F. and L.V.; writing—original draft preparation, R.F. and L.V.; writing—review and editing, P.M. and C.B.; supervision, P.M. and C.B.; project administration, P.M. and C.B.; funding acquisition, P.M. and C.B. All authors have read and agreed to the published version of the manuscript.

Funding

This research was funded by DUSSMANN Service.

Data Availability Statement

The original contributions presented in this study are included in the article. Further inquiries can be directed to the corresponding author.

Acknowledgments

We would like to thank all the COIMA HQ’s hygiene operators who helped clean and measure product, water, and energy consumption. We want to thank the master thesis students who helped in the laboratory activities, Chiara Bonacina, Mariagrazia Lima and Alessia Mastromatteo.

Conflicts of Interest

L.V., C.B. and B.B. were employed by Punto 3 Srl S.B. The remaining authors declare that the research was conducted in the absence of any commercial or financial relationships that could be construed as a potential conflict of interest. The authors declare that this study received funding from DUSSMANN Service. The funder was not involved in the study design, collection, analysis, interpretation of data, the writing of this article or the decision to submit it for publication.

References

  1. Everard, M. Assessment of the sustainable use of chemicals on a level playing field. Integr. Environ. Assess. Manag. 2023, 19, 1131–1146. [Google Scholar] [CrossRef] [PubMed]
  2. Sonnemann, G.; Gemechu, E.D.; Remmen, A.; Frydendal, J.; Jensen, A.A. Life Cycle Management: Implementing Sustainability in Business Practice. In Life Cycle Management, LCA Compendium-The Complete World of Life Cycle Assessment; Sonnemann, G., Margni, M., Eds.; Springer: Dordrecht, The Netherlands, 2015; pp. 7–21. [Google Scholar] [CrossRef]
  3. Luthin, A.; Traverso, M.; Crawford, R.H. Circular life cycle sustainability assessment: An integrated framework. J. Ind. Ecol. 2023, 28, 41–58. [Google Scholar] [CrossRef]
  4. Zeug, W.; Bezama, A.; Thrän, D. A framework for implementing holistic and integrated life cycle sustainability assessment of regional bioeconomy. Int. J. Life Cycle Assess. 2021, 26, 1998–2023. [Google Scholar] [CrossRef]
  5. Boyce, J.M. Modern technologies for improving cleaning and disinfection of environmental surfaces in hospitals. Antimicrob. Resist. Infect. Control 2016, 5, 1–10. [Google Scholar] [CrossRef] [PubMed]
  6. Nikolić, D.; Jovanović, S.; Skerlić, J.; Šušteršič, J.; Radulović, J. Methodology of life cycle sustainability assessment. Proc. Eng. Sci. 2019, 1, 793–800. [Google Scholar] [CrossRef]
  7. Liu, S.; Qian, S. Towards sustainability-oriented decision making: Model development and its validation via a comparative case study on building construction methods. Sustain. Dev. 2019, 27, 860–872. [Google Scholar] [CrossRef]
  8. ISO 14040:2006; Environmental Management—Life Cycle Assessment—Principles and Framework. ISO: Geneve, Switzerland, 2022. Available online: https://www.iso.org/standard/37456.html (accessed on 10 April 2025).
  9. ISO 14044:2006; Environmental Management—Life Cycle Assessment—Requirements and Guidelines. ISO: Geneve, Switzerland, 2022. Available online: https://www.iso.org/standard/38498.html (accessed on 10 April 2025).
  10. ISO 14067:2018; Greenhouse Gases—Carbon Footprint of Products—Requirements and Guidelines for Quantification. ISO: Geneve, Switzerland, 2022. Available online: https://www.iso.org/standard/71206.html (accessed on 10 April 2025).
  11. Paulillo, A.; Kim, A.; Mutel, C.; Striolo, A.; Bauer, C.; Lettieri, P. Influential parameters for estimating the environmental impacts of geothermal power: A global sensitivity analysis study. Clean. Environ. Syst. 2021, 3, 100054. [Google Scholar] [CrossRef]
  12. Nilsen, S.K.; Dahl, I.; Jhrgensen, O.; Schneider, T. Microfibre and Ultra-Micro-Fibre Cloths, Their Physical Characteristics, Cleaning effect, Abrasion on Surfaces, Friction, and Wear Resistance. 2002. Available online: www.elsevier.com/locate/buildenv (accessed on 10 April 2025).
  13. Fukuzaki, S. Mechanisms of Actions of Sodium Hypochlorite in Cleaning and Disinfection Processes. Biocontrol. Sci. 2006, 11, 147–157. [Google Scholar] [CrossRef] [PubMed]
  14. Tascione, V.; Simboli, A.; Taddeo, R.; Del Grosso, M.; Raggi, A. A comparative analysis of recent life cycle assessment guidelines and frameworks: Methodological evidence from the packaging industry. Environ. Impact Assess. Rev. 2024, 108, 107590. [Google Scholar] [CrossRef]
  15. AR6 Synthesis Report: Climate Change 2023—IPCC. Available online: https://www.ipcc.ch/report/sixth-assessment-report-cycle/ (accessed on 17 April 2025).
  16. ISO 14026:2017; Environmental Labels and Declarations—Principles, Requirements and Guidelines for Communication of Footprint Information. ISO: Geneve, Switzerland, 2023.
  17. Dancer, S. How do we assess hospital cleaning? A proposal for microbiological standards for surface hygiene in hospitals. J. Hosp. Infect. 2004, 56, 10–15. [Google Scholar] [CrossRef] [PubMed]
  18. Griffith, C.; Cooper, R.; Gilmore, J.; Davies, C.; Lewis, M. An evaluation of hospital cleaning regimes and standards. J. Hosp. Infect. 2000, 45, 19–28. [Google Scholar] [CrossRef] [PubMed]
  19. La Contaminazione Microbiologica Delle Superfici Negli Ambienti Lavorativi. 2017. Available online: www.inail.it (accessed on 10 August 2022).
  20. Linee Guida Sugli Standard di Sicurezza e di Igiene del Lavoro nel Reparto Operatorio. Istituto Superiore per la Prevenzione e la Sicurezza del Lavoro. Dipartimento Igiene del Lavoro. Available online: https://www.lisaservizi.it/sites/default/files/old_sitefile/20150820174253-ISPESL-LG-SaleOperatorie.pdf?srsltid=AfmBOopZY26B6wWUrHD_RW8Od6UTrXwqodD9Ofpup08JP4IGlD5LLtZ- (accessed on 10 August 2022).
  21. O’Hara, C.M.; Rhoden, D.L.; Miller, J.M. Reevaluation of the API 20E identification system versus conventional biochemicals for identification of members of the family Enterobacteriaceae: A new look at an old product. J. Clin. Microbiol. 1992, 30, 123–125. [Google Scholar] [CrossRef] [PubMed]
  22. Fontana, R.; Buratto, M.; Marzola, M.; Trioschi, G.; Bandera, B.; Buffone, C.; Vogli, L.; Marconi, P. An Evaluation of Hospital Cleaning Regimes—Microbiological Evaluation and LCA Analysis after Traditional and Sustainable/Green Procedures. Sustainability 2022, 14, 11465. [Google Scholar] [CrossRef]
  23. Fontana, R.; Buratto, M.; Caproni, A.; Nordi, C.; Pappadà, M.; Bandera, B.; Vogli, L.; Buffone, C.; Marconi, P. Evaluating Cleaning Services in Civil Environments: Microbiological and Life Cycle Analysis Comparing Conventional and Sustainable Methods. Sustainability 2024, 16, 487. [Google Scholar] [CrossRef]
  24. Fontana, R.; Marzola, M.; Buratto, M.; Trioschi, G.; Caproni, A.; Nordi, C.; Buffone, C.; Bandera, B.; Vogli, L.; Marconi, P. Analysis of Civil Environments Cleaning Services—Microbiological and LCA Analysis after Traditional and Sustainable Procedures. Sustainability 2022, 15, 696. [Google Scholar] [CrossRef]
  25. Henry, K. Comparing the Current Chemical Cleaning Regime and Chemical-Free Cleaning at The University of Canterbury: A Report and Practical Microbiological Experiment for the Sustainability Office; University of Canterbury: Christchurch, New Zealand, 2011. [Google Scholar]
  26. Quan, X.; Joseph, A.; Jelen, M. Green Cleaning in Healthcare: Current Practices and Questions for Future Research; The Center for Health Design: Concord, CA, USA, 2011. [Google Scholar]
Figure 1. Overview of the system boundary processes, broken down into the upstream, core, and downstream phases.
Sustainability 17 04546 g001
Figure 2. Comparison of total viable counts in the office area for untreated (NT, purple), traditional treatment (TT, blue), and Green Protocol (TG, green). Results are the mean values from two independent experiments performed in triplicate, expressed as CFU/10 cm2. The dashed line denotes the acceptability threshold.
Sustainability 17 04546 g002
Figure 3. Total viable count in the entrance and reception area for untreated (NT, purple), traditional treatment (TT, blue), and Green Protocol (TG, green). Data represent the mean of two independent experiments performed in triplicate, expressed as CFU/10 cm2, with the acceptability threshold indicated by a dashed line.
Sustainability 17 04546 g003
Figure 4. Comparison of total viable counts on stairs and elevators for untreated (NT, purple), traditional treatment (TT, blue), and Green Protocol (TG, green). Data show the mean ± SD from two independent triplicate experiments, the values are expressed as CFU/10 cm2, with the acceptability threshold indicated by a dashed line.
Sustainability 17 04546 g004
Figure 5. Canteen area total viable counts: NT (purple), TT (blue), and TG (green). Values are the average CFU/10 cm2 from two triplicate experiments; the dashed line marks the threshold.
Sustainability 17 04546 g005
Figure 6. Total viable counts on women’s bathroom surfaces under different treatment conditions. Results are shown for untreated (NT, purple), treated (TT, blue), and treated with germicidal agent (TG, green) surfaces. Data represent the mean CFU per 10 cm2 from two independent experiments, each performed in triplicate. The dashed line indicates the acceptability threshold for microbial contamination.
Sustainability 17 04546 g006
Figure 7. Total viable counts on men’s bathroom surfaces under different treatment conditions, non-treated (NT in purple), traditional treatment (TT, blue), and Green Protocol (TG, green). The data represent the mean CFU per 10 cm2 from two independent experiments, each conducted in triplicate. The dashed line denotes the acceptability threshold for microbial contamination.
Sustainability 17 04546 g007
Table 1. Sampling plan for microbial evaluation. (See details in Supplementary Materials).
Men’s bathroomFloor
WC
Door Handle
Sink
Women’s bathroomFloor
WC
Door Handle
Sink
OfficeFloor
Desk
Chair
Keyboard/Computer
Telephone
Entrance/AcceptanceFloor
Desk
Desk
Waiting room table
Break roomFloor
Table
Chair
Keyboard machine/tool
Elevator/StairsStairs-Floor
Lift-Floor
Lift-Keyboard
Stairs-handrail
Table 2. Isolated microorganisms identified with biochemical testing (API Biomerieux).
Brucella spp.Candida dattila
Pseudomonas fluorescensTrichosporon spp.
P. oryzihabitansScolecobasidium humicola
P. luteolaCyphellophora olivacea
Proteus mirabilisExophiala oligosperma
Bacillus—non reactivePenicillium sp.
Bacillus spp.Enterococcus hirae
Lactobacillus paracaseiiEscherichia fergusonii
L. paracaseii spp. paracaseii 2Ochrobactrum anthropi
Acinetobacter baumaniiBordetella alcaligens
Table 3. GWP variations by macro aspect of the protocols analyzed.
AspectΔ% GWP
Green vs. Traditional
Δ GWP
Green vs. Traditional
Unit of Measurement
Chemicals Consumption−32.3%−110.9kg CO2e/site year
Energy Consumption−33.0%−74.3kg CO2e/site year
Textiles Consumption−57.3%−9.3kg CO2e/site year
Water Consumption+17.0%+0.4kg CO2e/site year
Wastewater Treatment+7.6%+1.7kg CO2e/site year
Prod. and End-of-Life Machinery and Trolleys+22.2%+36.8kg CO2e/site year
Disclaimer/Publisher’s Note: The statements, opinions and data contained in all publications are solely those of the individual author(s) and contributor(s) and not of MDPI and/or the editor(s). MDPI and/or the editor(s) disclaim responsibility for any injury to people or property resulting from any ideas, methods, instructions or products referred to in the content.

