Article

Influence Mechanism of Digital Economy on Urban Green Development Efficiency: A Perspective on New Quality Productive Forces

by
Xianmin Li
1,
Shixiang Li
1,2,*,
Qiaosheng Wu
3 and
Jinhua Cheng
3
1
School of Public Administration, China University of Geosciences, Wuhan 430000, China
2
Key Laboratory of Rule of Law, Ministry of Natural Resources, China University of Geosciences, Wuhan 430000, China
3
School of Economics and Management, China University of Geosciences, Wuhan 430000, China
*
Author to whom correspondence should be addressed.
Sustainability 2025, 17(10), 4539; https://doi.org/10.3390/su17104539
Submission received: 14 April 2025 / Revised: 11 May 2025 / Accepted: 13 May 2025 / Published: 16 May 2025

Abstract

:
Improving the efficiency of green development is a crucial step towards achieving the “dual carbon” goal and promoting regional sustainable development. Currently, China has made a decision to foster new quality productive forces, aiming at upgrading traditional productive forces by digitization, which brings new opportunities for urban green transformation. Drawing upon a perspective from new quality productive forces, this paper constructs a framework of impact mechanism about “production factors–productivity–production relations” and uses 108 cities in the Yangtze River Economic Belt to investigate the impact effects, mechanisms, and disparities of the digital economy on urban green development. The research findings indicate the following: (1) The digital economy has a nonlinear influence on green development, with a critical value of 0.149. The conclusion still valid after “Utest” and robustness checks. (2) With the new strategy, digital economy indirectly influences urban green process through nonlinear mediating effects of green technology and green finance, as well as linear mediating effects of resource allocation and industrial structure. (3) There are notable effects heterogeneity across urban agglomerations and individual cities, as well as between resource-based and non-resource-based cities. (4) Furthermore, the policy intensity exerts a stage enhancing effect on the influence. With the promotion of digital policies such as Broadband China, the influence shows a phased increasing trend. The research provides valuable insights for harnessing new quality productive forces to power the digital economy and regional green transformation.

1. Introduction

Green is the symbol of life, the undertone of sustainability. However, in the rapid course of industrialization and urbanization, the crude mode of increasing the input of traditional factors to achieve economic scale expansion has accumulated serious resource and environmental problems [1]. As highlighted by the World Economic Forum’s Global Risks Report (2024), ecological, social, and economic issues such as extreme weather, social fragmentation, and economic recession will be long-term challenges facing the world. Green development has gradually become an international consensus to address multiple challenges. New quality productive forces is a green productivity and a sustainable growth model that is a new strategy for China. Its core is to drive the creative configuration of production factors, the continuous upgrade of productive capacity, and the optimal combination of production relations by key new technologies such as digitization [2,3].
With the depth fusion of digital technologies such as 6G and blockchain with production, life, and ecology, the digital economy has been the key force in transforming the traditional structure. Numerous studies about the influence of digitization focus on the linear relationship and hold varying perceptions about positive incentives and negative impacts [4,5,6]. In fact, the new quality productive forces has promoted the depth fusion of the digitization, and the resulting economic–social impacts are complex and multi-dimensional. Is it empowering or inhibiting green development, and is there a complex nonlinear effect? From which mechanism channels do the new quality productive forces strategy enhance the green value of the digital economy, and does this mechanism also show nonlinear characteristics? Do the effects show heterogeneity due to different constraints? In order to answer the above questions: Firstly, combined with the policy connotation of new quality productive forces, this paper constructs a mechanism analysis framework of digital economy influencing green growth around the dimension of “production factors–productivity–production relations”, and screens mechanism variables under this framework. Secondly, we assess the level of urban digitization and green growth, explore their relationship, and engage in linear and nonlinear discussions on mediating mechanisms. Lastly, we conduct heterogeneity analyses on the influence based on economic agglomeration and resource endowment, as well as test the strengthening effect of policy intensity.
The Yangtze River Economic Belt is the most vigorous area of economic growth in China, as well as a crucial ecological treasure trove. As the center of regional economic, political and social activities, the city’s green growth holds significant importance in stabilizing the green core of new quality productive forces. Therefore, this paper focuses on 108 cities in the area to probe into the impact of digitization on green progression.
Under the strategic background of new quality productivity, how the digital economy drives urban green development remains a “black box” that needs to be clarified. Existing research mostly focuses on simple validation of mediating effects and linear correlation analysis, while overlooking the possible nonlinear transmission paths in real-world scenarios, as well as the heterogeneous characteristics of impact effects under different constraint conditions. Based on this, the potential contributions of this study as follows: (1) The mechanism framework of “production factors–productivity–production relations” is constructed, so as to clarify the channels from which this strategy will strengthen the green influence of the digital economy. (2) We assume that there are two conduction methods for each mechanism, linear or nonlinear, extending the nonlinear effects analysis of the intermediary. This is further supported by empirical analysis using the Environmental Kuznets Curve and technology diffusion threshold theory. (3) As total factor productivity is the assessment standard of this strategy, green total factor productivity is used to represent urban green growth, and the impact difference is investigated from two dimensions of economy and ecology. In addition, the stage enhancement of policy in this relationship is paid attention to.

2. Theoretical Analysis and Hypotheses

2.1. Influence Effect of Digital Economy on Urban Green Development

As an emerging economic pattern, the impact of digital economy on social operation shows multi-level and highly permeable characteristics [7]. Early scholars mostly discussed the dividend brought by digitization to the manufacturing industry and population employment. In recent years, attention has shifted towards to the relevance of digitization with carbon emissions, and green growth [8,9]. Some studies have confirmed the beneficial effects of digitization on green growth, while others have argued that the digital economy has caused environmental pollution, consumption alienation, industrial over-homogeneity, and a digital divide [10].
The new quality productive forces strategy emphasizes promoting the development of production factors, productivity, and production relations by revolutionary technology and emerging industries [11], which has enlarged the possibility for the relationship between digitization and green growth. Since its introduction, scholars have conducted a series of discussions on the connotations, impacts, and pathways of this strategy. In terms of strategic connotations, new quality productivity is grounded in data elements, centered on technological innovation, and driven by industrial upgrading, characterized by “four new” features: new technologies, new elements, new business forms, and new models [12]. This not only represents a qualitative change in production factors and productivity but also an innovation in production relations [13]. In terms of impact scope, scholars have revealed the profound effects of new quality productivity on employment structure, industrial structure, and regional development [14]. In recent years, discussions about the digital economy and new quality productivity have begun to emerge. However, studies exploring the impact of the digital economy on green development under the background of new quality productivity, as well as those further clarifying its mechanisms, are relatively scarce. In terms of implementation paths, green serves as the theoretical core and important standard of new quality productivity, running through the transformation of new quality productivity elements, technological breakthroughs, industrial restructuring, and institutional adaptation. Therefore, from a theoretical perspective, the proposal of the strategy of new quality productivity helps amplify the green empowerment effects of digitalization, which has a certain rationality and scientific basis.
Accordingly, hypothesis H1 is proposed:
H1: 
The digital economy has a nonlinear influence on urban green development under the new strategy.

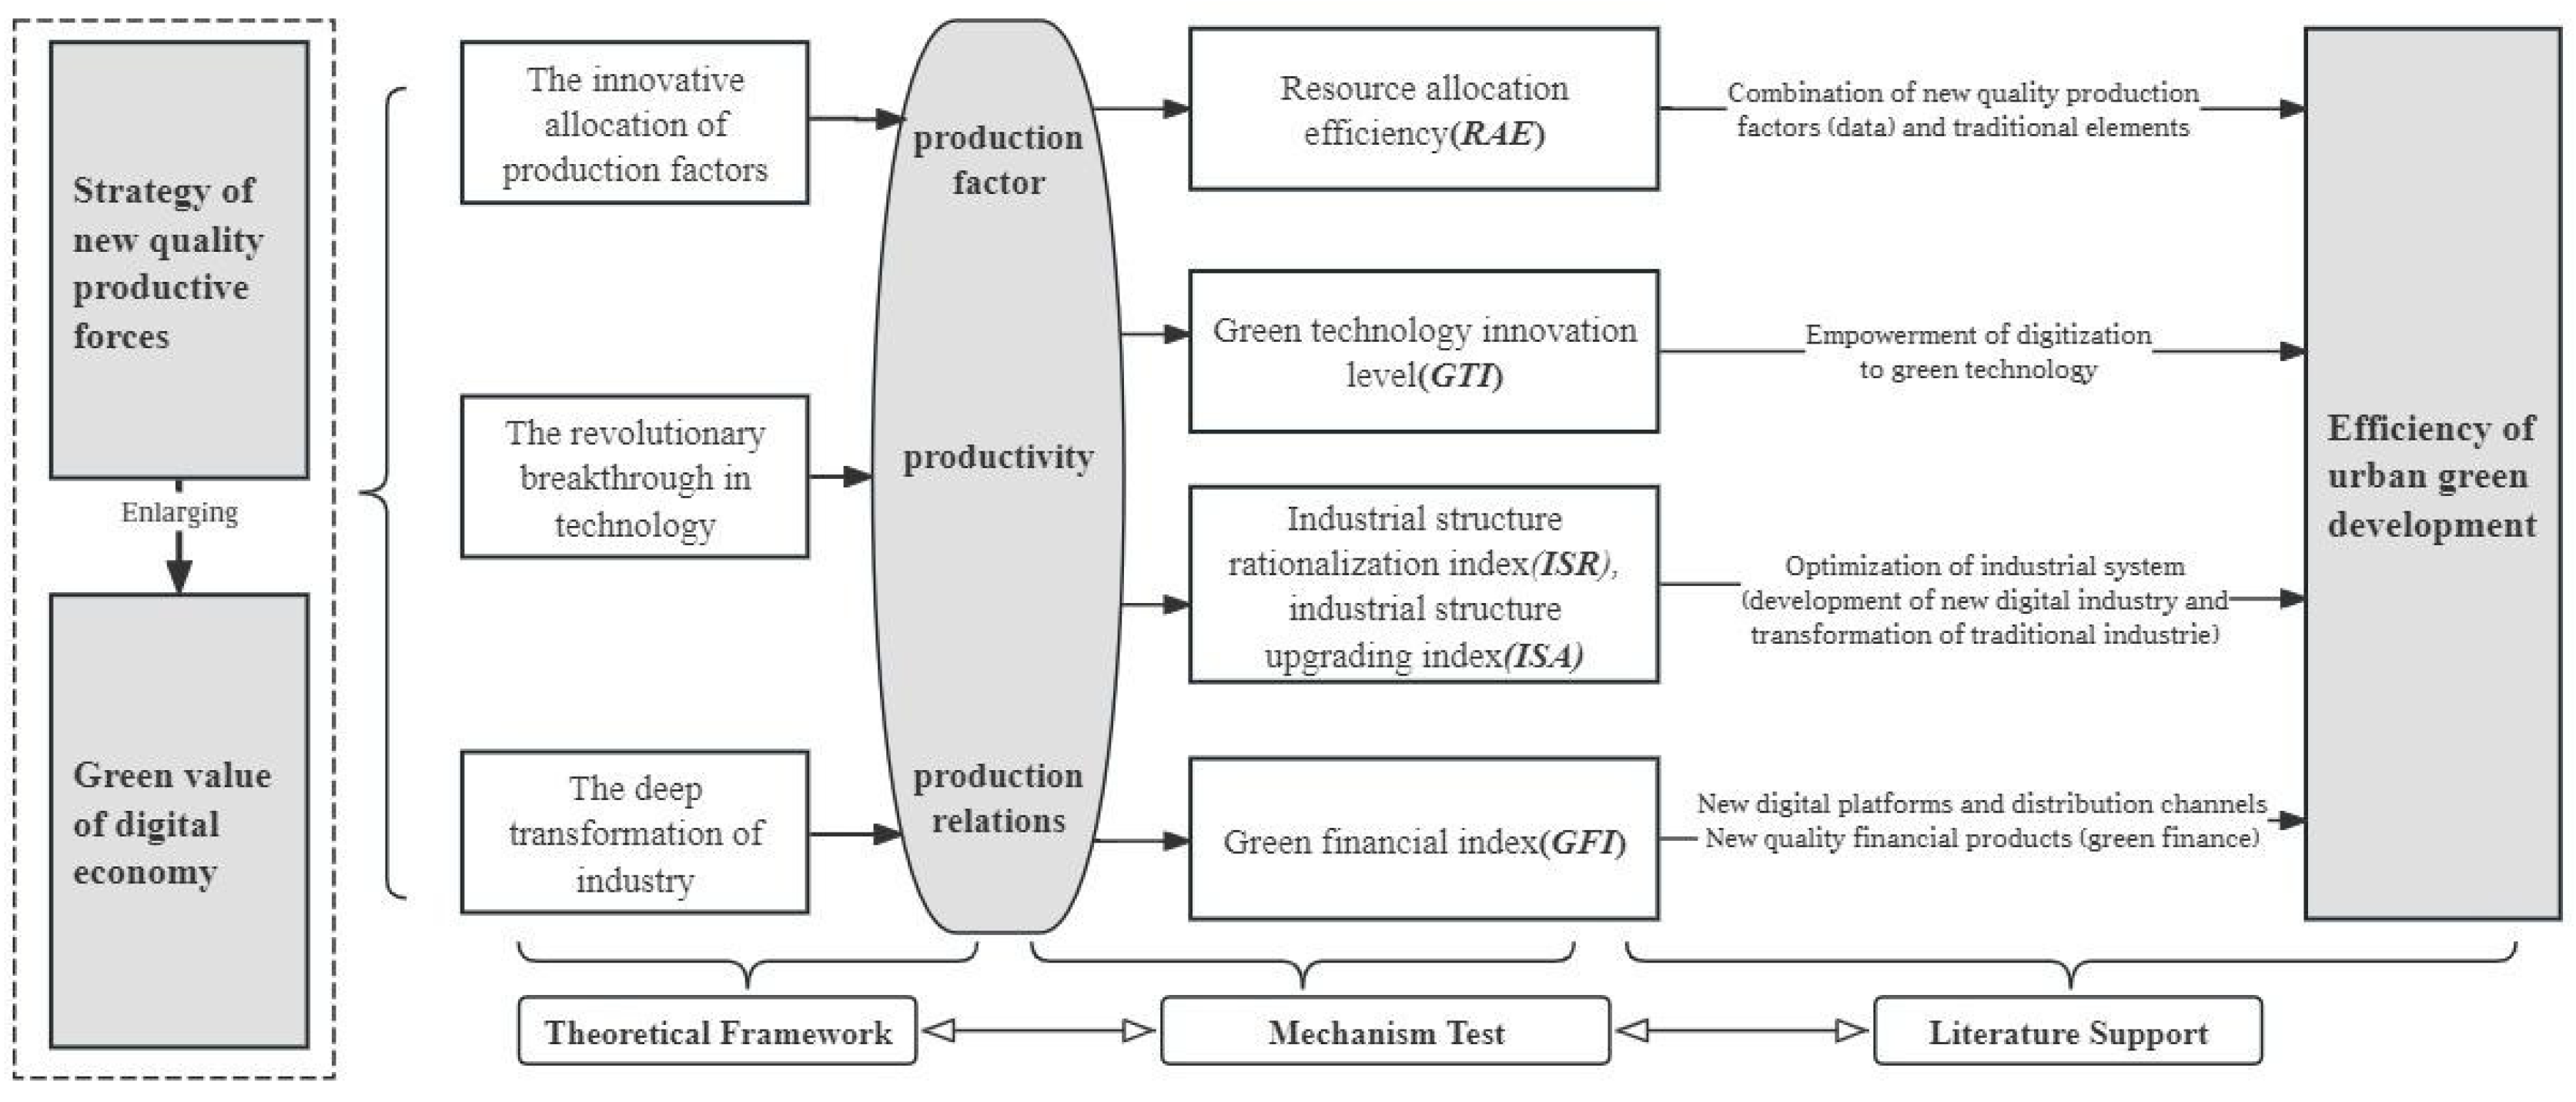
2.2. Influence Mechanism of Digital Economy on Urban Green Development

The White Paper on Global Digital Economy (2023) of the China Academy of Information and Communications Technology defines the categories of the digital economy: data value, digital industrialization, industrial digitization, and digital governance. The proposal and development of new quality productivity may lead the digital economy to further exert its green enabling effect on cities from the aspects of factors of production, productivity, and relations of production. This aligns with the core of new quality productive forces: innovative allocation of factors, significant improvement in production capacity, and optimization of production relations. Thus, we constructed an analytical framework encompassing “production factors–productive forces–production relations” to identify the main intermediary mechanism of digitization affecting green development under the new quality productivity strategy, as shown in Figure 1. From the perspective of production factors, data are a new type of production factor and also a foundational strategic resource for the digital economy; under the strategic guidance of new quality productive forces, data, as a core element, integrate with traditional production factors such as land, capital, and labor, reshaping the factor allocation system and effectively alleviating the dilemma of “resource misallocation” that constrains green development. From the perspective of productive forces, technology, as the primary productive force, is the “crucial point” driving the development of new quality productive forces; in the context of fostering new quality productive forces, emerging digital economy industries like artificial intelligence and big data exhibit vigorous growth trends, significantly enhancing the novelty and green content of economic growth. At the same time, the upgrading of industrial structures is an external manifestation of the transition from traditional to new quality productive forces and an inevitable trend in the development of the digital economy; during the process of developing new quality productive forces, the digital economy drives the transformation of old and new growth drivers through technological spillovers from traditional industries and the vigorous cultivation of strategic emerging industries, becoming a fundamental driving force for green development. From the perspective of production relations, “new quality finance,” including green finance, inherently possesses green attributes, reflecting the integration of digital platforms and digital governance; under the policy incentives for new quality productive forces, new models of digital governance continue to emerge, opening up new tracks for green development.

2.2.1. Digital Economy, Resource Allocation, and Urban Green Development

Studies have confirmed that digital economy alleviates the constraints of “insufficient demand, excess supply” by reducing information friction, which promotes the high-level application of resources [15]. Meanwhile, data, as the new production factor of the new quality productive forces, realize the multiplier effect on the economy due to their non-competitive nature, zero marginal cost, and immediacy [16].
Accordingly, hypothesis H2a is proposed:
H2a: 
The digital economy exerts an influence on urban green progress via the channel of resource allocation.

2.2.2. Digital Economy, Green Technology, and Urban Green Development

The advancement of digital technologies contributes to the green economy, and also causes changes in people’s green behavior at the micro level, thus achieving the multi-dimensional nature of green development [17]. In addition, several surveys also demonstrate that technological innovation has a threshold and rebound effect on green development [18].
Accordingly, hypothesis H2b is proposed:
H2b: 
The digital economy exerts an influence on urban green progress via the channel of green technology.

2.2.3. Digital Economy, Industrial Structure, and Urban Green Development

The upgrade of industries is a concrete form of productivity transformation. Digitization, through the technology spillover of traditional industries and the cultivation of emerging industries, thus forms an industrial system characterized by high technology, minimal resource consumption, and less pollution [19,20]. In the meantime, digital development causes a certain technical attack on the traditional economy [21].
Accordingly, hypothesis H2c is proposed:
H2c: 
The digital economy exerts an influence on urban green progress via the channel of industrial structure.

2.2.4. Digital Economy, Green Finance, and Urban Green Development

Financial innovation is a part of productivity and is related to the shaping of production relations. Relying on digital technology and intelligence platform, the financial elements accurately flow to low-pollution, high-growth industries. Digital technology can also steer the transformation of traditional finance towards “new quality finance”, such as green finance.
Accordingly, hypothesis H2d is proposed:
H2d: 
The digital economy exerts an influence on urban green progress via the channel of green finance.

2.3. Difference in the Influence of Digital Economy on Urban Green Development

Owing to variations in regional resource endowment, economic foundation, and social background, the influences of digitization also present with disparities [22,23,24]. Therefore, for cities with different agglomeration economies and resource endowments, whether the influence of digitization on green transformation is heterogeneous needs further discussion. Additionally, government behavior has a regulating function on regional development. Whether policy intensity plays a certain role in the relationship needs further testing.
Accordingly, hypothesis H3a, H3b are proposed:
H3a: 
The influence is heterogenous owing to agglomeration economic level and resource endowment characteristics.
H3b: 
Policy intensity plays an important guiding role in shaping the influence of digitization on urban green transformation.

3. Variables and Methods

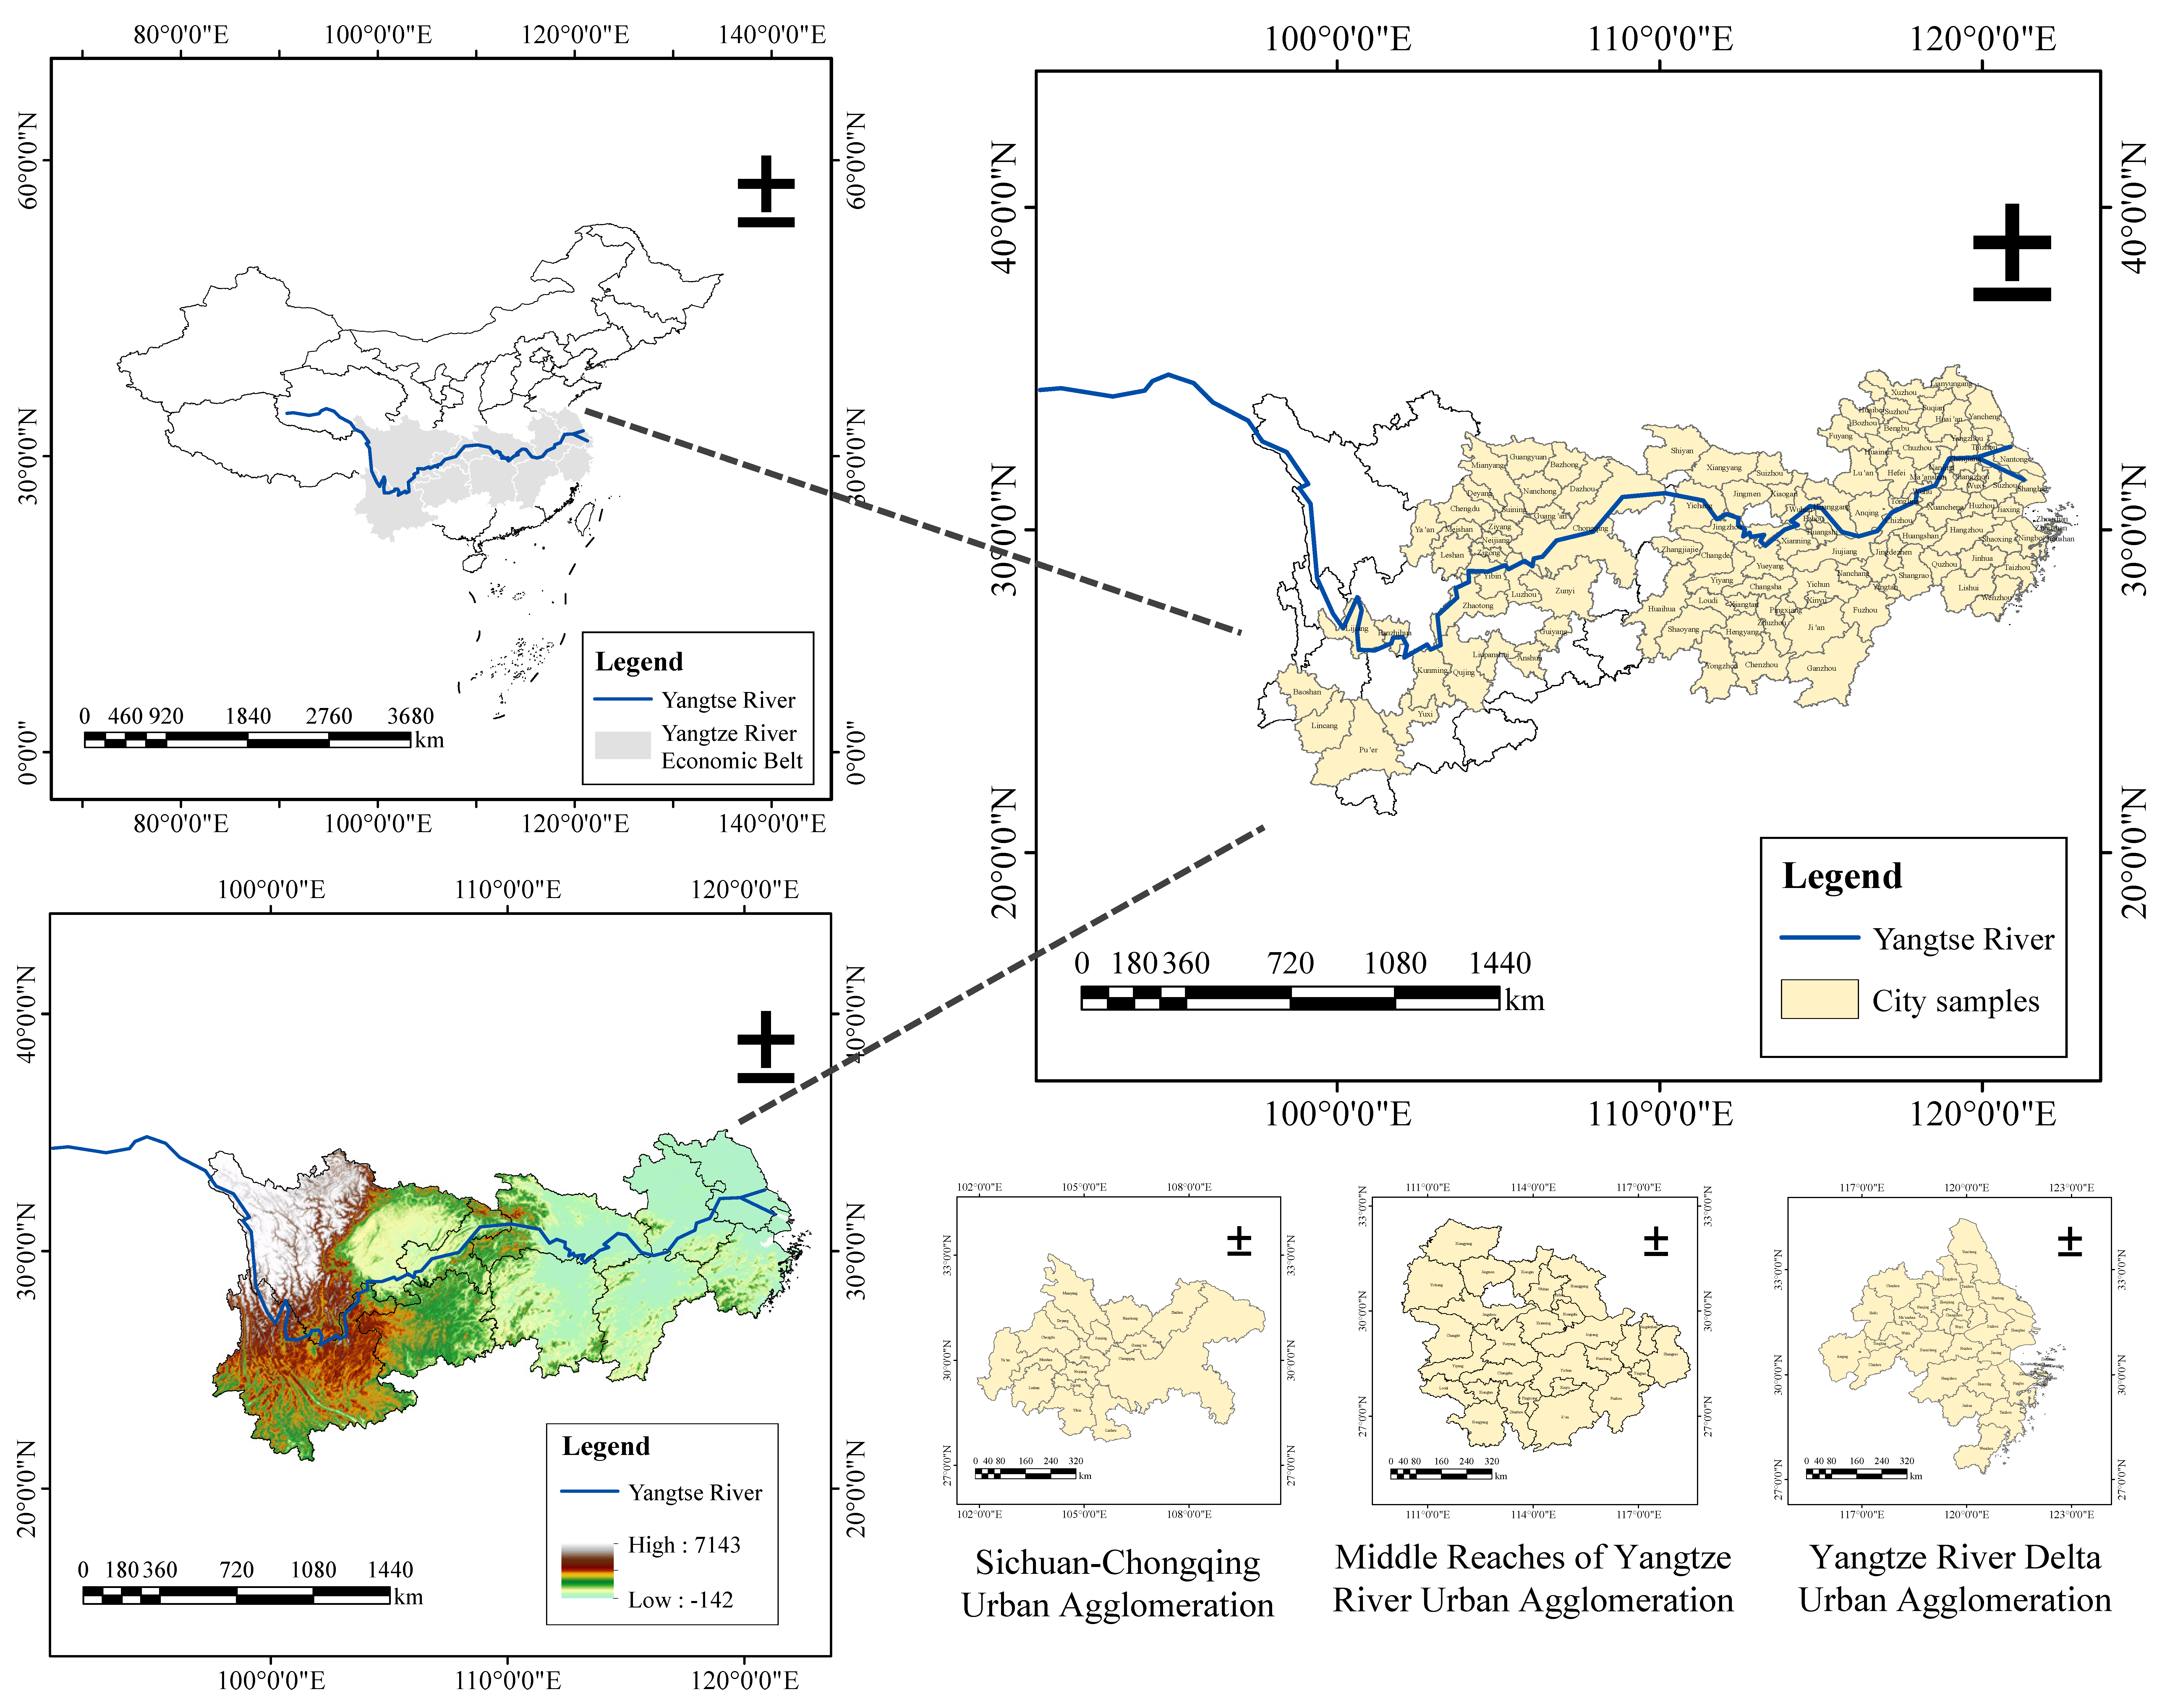
3.1. Research Sample

This research selects 108 prefecture-level and above cities in China’s Yangtze River Economic Belt as the survey area (Bijie and Tongren are excluded due to lack of data). And according to the spatiotemporal trend of digitization and green growth, it pays attention to the three urban agglomerations in Figure 2.

3.2. Variables Description

3.2.1. Explained Variable

Green development efficiency (GE). The new quality productive forces is green productivity. The core of green development lies in achieving higher economic output with reduced resource input and environmental pollution [25]. Thus, an input–output system was established to measure efficiency. In Western economic thought, the fundamental factors driving economic growth include capital and labor. Green total factor productivity further considers the impact of environmental pollution on economic growth, making it more aligned with regional development realities. Moreover, input factors should have a direct causal relationship with output factors. Given that non-desired output variables such as environmental costs are included in the output factors, in terms of inputs, besides capital and labor, resource inputs like energy must also be considered. Referring to previous studies [26,27], capital stock, employment numbers, land use, and energy consumption are chosen to represent capital, labor, and resource factor inputs; GDP is taken as the expected output while the “three wastes” of industry are represented non-expected outputs, as shown in Table A1. In addition, we adopt a slack-based model and the global Malmquist–Luenberger index (SBM-GML) to dynamically depict changes in urban green development. The results are then subdivided into technological efficiency change index (EC) and technological progress change index (TC). The spatiotemporal situation of GE change is shown in Figure 3.
Observing the time trend, the mean value changed from 0.98 in 2011 to 1.02 in 2022 and achieved a breakthrough of 1 in 2016. This indicates that the urban green development efficiency has been in the process of dynamic improvement, and 2016 is an important node. Furthermore, the fluctuations in TC and GE exhibit a more similar pattern, which highlights that urban green growth is more dependent on technological progress. From the spatial trend, the value appears a distribution feature of “high in the east and low in the west”. The Yangtze River Delta Urban Agglomeration is generally in the range [1.10, 1.23]. Certain cities in Sichuan, Hubei, Jiangxi, and Yunnan provinces are areas where the loss of green development efficiency (GE) change value is continuously lower than 1. Notably, approximately half of these cities are resource-based areas.

3.2.2. Explanatory Variable

The digital economy level (DIGE) demonstrates that informatization, internet, and digital transactions constitute the foundation, platform, and essence of the digital economy [28,29]. The index system is constructed accordingly: In the informatization dimension, the total telecom services per capita and the proportion of employees in the information industry are selected; in the internet dimension, the number of mobile phone users and the number of internet users are selected; in the digital trading dimension, the digital financial inclusion index is opted. We compare the DIGE within three urban agglomerations, as shown in Figure 4.
The DIGE core density curve (a) of 108 cities exhibits a unimodal distribution, with the peak shifting toward the right, and the DIGE value basically realizes positive growth. From the urban agglomeration, the single-peak state of the Yangtze River Delta Urban Agglomeration (b) is obvious, and the wave crest continues to move right, indicating that the DIGE is steadily improved. Meanwhile, both the wave crest in the Middle Reaches of Yangtze River Urban Agglomeration (c) and Sichuan–Chongqing Urban Agglomeration (d) fluctuate to the right, with right-tailing and multi-peak phenomena. These suggest that there are differences among cities in digital economy levels. Furthermore, the wave crest changes from “sharp peak” to “wide peak”, indicating that this difference is gradually expanding.

3.2.3. Mediating Variables

Resource allocation efficiency (RAE). The C-D production function was used to calculate resource mismatch index [30].
Green technology innovation level (GTI). The invention patents generate higher profits than utility model patents [31]. Considering the time lag of patent authorization, the proportion of green invention patent applications was finally selected.
Industrial structure rationalization index (ISR), industrial structure upgrading index (ISA). ISR was measured by Theil index, while ISA was calculated based on the relationship between the added value of tertiary industry and secondary industry.
Green financial index (GFI). GFI was computed based on the entropy values of green credit, green insurance, green bonds, green investment, green support, and carbon finance [32].

3.2.4. Control Variables

With reference to the grounding literature, we select economic level (RGDP), industrialization level (IND), foreign investment level (FIL), government intervention level (GIL), science and technology investment level (STL), human capital stock (HCL), and employment structure level (ESL) as control variables.

3.2.5. Data Sources

Absolute value variables undergo logarithmic transformation; price variables are adjusted for inflation. Descriptive statistics are listed in Table 1.

3.3. Model Methods

3.3.1. Baseline Regression Model

The quadratic function model is one statistical method used to verify the effect of a nonlinear curve [33,34]. The quadratic term of digital economy (DIGE2) is applied to set up a benchmark model, as shown in Equation (1):
G E i t = α + α 1 D I G E i t + α 2 D I G E i t 2 + α n c o n t r o l i t + ω i + σ i + ε i
where G E i t   a n d   D I G E i t , respectively, represent green development efficiency and digital economy level of city i in year t; c o n t r o l i t is the control variables set; α is the constant; α 1   a n d   α 2 are the explanatory variable coefficient; α n is the control variable coefficient; ω i   a n d   σ i represent the fixed effect of city and time;   ε i is the random disturbance term.

3.3.2. Mechanism Test Model

Referring to the latest two-step method [34,35], firstly, this paper identifies the main intermediary variables that amplify the green value of digital economy under the strategy of new quality productivity, theoretically proving the rationality of the intermediate variables influence on green growth. It then empirically tests the influence process of the digital economy on intermediate variables. For the intermediate variable, two transmission modes are assumed: In option one, the digitization is linearly correlated with the intermediary variable, and the intermediary variable has a nonlinear effect on green progress. In option two, there exists a nonlinear correlation between digitization and the intermediary variable, as shown in Equations (2) and (3):
M i t = α + α 1 D I G E i t + α n c o n t r o l i t + ω i + σ i + ε i
M i t = α + α 1 D I G E i t + α 2 D I G E i t 2 + α n c o n t r o l i t + ω i + σ i + ε i
where the assumed intermediary variables M i t are, respectively: RAE, GTI, ISR and ISA, GFI. Explanatory variable coefficient of Equation (2) α 1 and Equation (3) α 2 are main concerns. The control variables added in the one-by-one test are the same as the main effect regression; only the control variables with certain homogeneity are removed when verifying a mechanism variables [36].

3.3.3. SBM-GML Method

The explained variables GE are measured by the SBM-GML method. SBM considers the slack of input and output, which can accurately measure the current situation of regional efficiency. The GML index considers the distance between the decision-making unit and the production frontier, which realizes the dynamic comparability of efficiency values. The process as follows:
(1)
Efficiency value ρ
ρ = m i n ( 1 1 m i = 1 m s i x x i o ) / [ 1 + 1 s 1 + s 2 ( k = 1 s 1 s k y y k o + i = 1 s 2 s l z z l 0 ) ] s . t           ( x i o = j = 1 n λ j x j + s i x , i y k o = j = 1 n λ j y j s k y , k z l 0 = j = 1 n λ j z j + s l z , l s i x   0 ,   s k y 0 ,   s l z   0 ,   i ,   j ,   k ,   l )
where ρ is the efficiency value of the decision-making unit, and m, s1, and, s2, respectively, represent the number of variables of input, expected output, and unexpected output.
(2)
Total index M G E and decomposition index M E C , M T C
M G E C G ( x t , y t , z t , x t + 1 , y t + 1 , z t + 1 ) = E C G ( x t + 1 , y t + 1 , z t + 1 ) / E C G ( x t , y t , z t )
M E C = E C t + 1 ( x t + 1 , y t + 1 , z t + 1 ) / E C t ( x t , y t , z t + 1 )
M T C = [ E C G ( x t + 1 , y t + 1 , z t + 1 ) / E C t + 1 ( x t + 1 , y t + 1 , z t + 1 ) ] / [ E C G ( x t , y t , z t ) / E C t ( x t , y t , z t ) ]
where MGE dynamically represents the change of total index. MEC and MTC represent the decomposition indexes. Since MGE is a growth rate, we adjust it to productivity. Assuming that the green total factor productivity is 1 in 2003, the GE of prefecture-level cities from 2004 to 2022 is obtained by multiplying the MGE index in the following years. The calculation of EC and TC is consistent with the above. The results are shown in Section 3.2.1.

4. Results

4.1. Influence Effect Analysis

4.1.1. Baseline Estimation Test

Based on the data characteristics and Hausman proof, we employed the dual fixed-effects model to examine the immediate influence.
Table 2 columns (1) and (2) reveal that after the introduction of quadratic (DIGE2), the test result is at the 1% remarkable level, the fit degree is relatively better, and a nonlinear link between DIGE and GE is more constant. Columns (3)–(9) show that after control variables are gradually introduced, the relationship curves are all “U-shaped”. The inflection value is 0.149. When DIGE is less than the critical value, it is negatively related to the green growth in the short term. When DIGE crosses the critical point, the relation is reversed, and the efficiency of urban green development increases with digital economy in the long run.
In addition, the “Utest” test of nonlinear relations was carried out with reference to previous studies [37,38]. As shown in Table 3, the Slope item presents a first negative and then positive transition in the interval, and the critical value of 0.149 is distributed within the effective range of [0.022, 0.478], which further proves the validity of the “U-shaped” correlation.

4.1.2. Endogenous Processing and Robustness Tests

This part adopts the panel instrumental variable to deal with the endogeneity problem. There may be two endogenous variables after the introduction of a quadratic term. The interaction terms between internet users in the previous year and the number of fixed telephones in 1984, as well as the number of post offices in 1984, are used as tool variables (iv_DIGE, iv_DIGE2). Columns (1)–(3) of Table 4 inform the endogenous test results: All F values in the first stage exceed 10, and the Wald F value is greater than the 10% level critical value of Stock–Yogo, which indicates that the nonlinear effect remains valid after considering endogenous problem. In addition, to avoid endogeneity bias caused by bidirectional causality, the Dumitrescu–Hurlin panel Granger causality test method was used to identify the bidirectional causal relationship between digital economy and urban green development. The test results show that there is a significant positive causal effect of the digital economy on urban green development (Z-bar = 12.598, p < 0.01), further indicating that the digital economy can effectively promote urban green development. The test results for reverse causality (Z-bar = 1.545, p = 0.481) did not reach statistical significance, or due to the time lag in the economic feedback effect of green development, specific institutional conditions are required for it to manifest. See Table A2 for the test results.
To further enhance credibility, tests for robustness are carried out: Firstly, the sample size was reduced. In China, the administrative status of municipalities differs from that of general cities. As indicated in column (4), the two municipalities directly under the central government, Shanghai and Chongqing, are deleted. Secondly, an exceptional year was excluded. In 2020, due to the COVID-19 pandemic, urban data may fluctuate abnormally; therefore, this year was removed in column (5) for re-evaluation. Third, the explained variable was replaced. TC is the decomposition index of GE, which can represent the urban green growth to some extent. As shown in the column (6), it replaces the GE. Results indicate that after undergoing robustness tests, there is no significant alteration in the direction and importance of the influence.

4.2. Influence Mechanism Analysis

Given the nonlinear relation between DIGE and GE, there is also a potential nonlinear possibility in the transmission of intermediate variables.
Table 5 columns (1) and (2) report the DIGE exhibits a negative relatedness with the RAE on the significance level of 1%. Given that RAE is an inverse indicator, the test implies that there is a linear positive correlation between the digitization and the efficiency of resource allocation. Columns (3) and (4) reveal that the “U-shaped” curve connection between DIGE and GTI is remarkable at the level of 1%, which indicates a shift in the influence of digitization on green technology from unfavorable to favorable. Columns (5)–(8), respectively, report the results of the regression between the DIGE and industrial structure. ISR is an inverse indicator, which is negatively correlated with DIGE, indicating that the digitization plays a positive role in the rationalization of industrial structure. Notably, the statistical test of ISA is not evident, which implies that the improving function of digitization on industrial quality and efficiency has not been fully demonstrated. Columns (9)-(10) demonstrate an inverted “U-shaped” correlation between DIGE and GFI, with statistical significance at the 5% level, illustrating that digitization acts on urban green progress through its nonlinear influence on green finance. In view of the nonlinear correlation between the mediating variables GTI, GFI, and the explanatory variable DIGE, the Utest was used to further illustrate. The results show that the critical points of the two groups are within the effective interval, and the Slope term presents a process from negative to positive and from positive to negative, respectively, which are consistent with their respective curve shapes, further providing evidence for nonlinear correlation.

4.3. Further Analysis

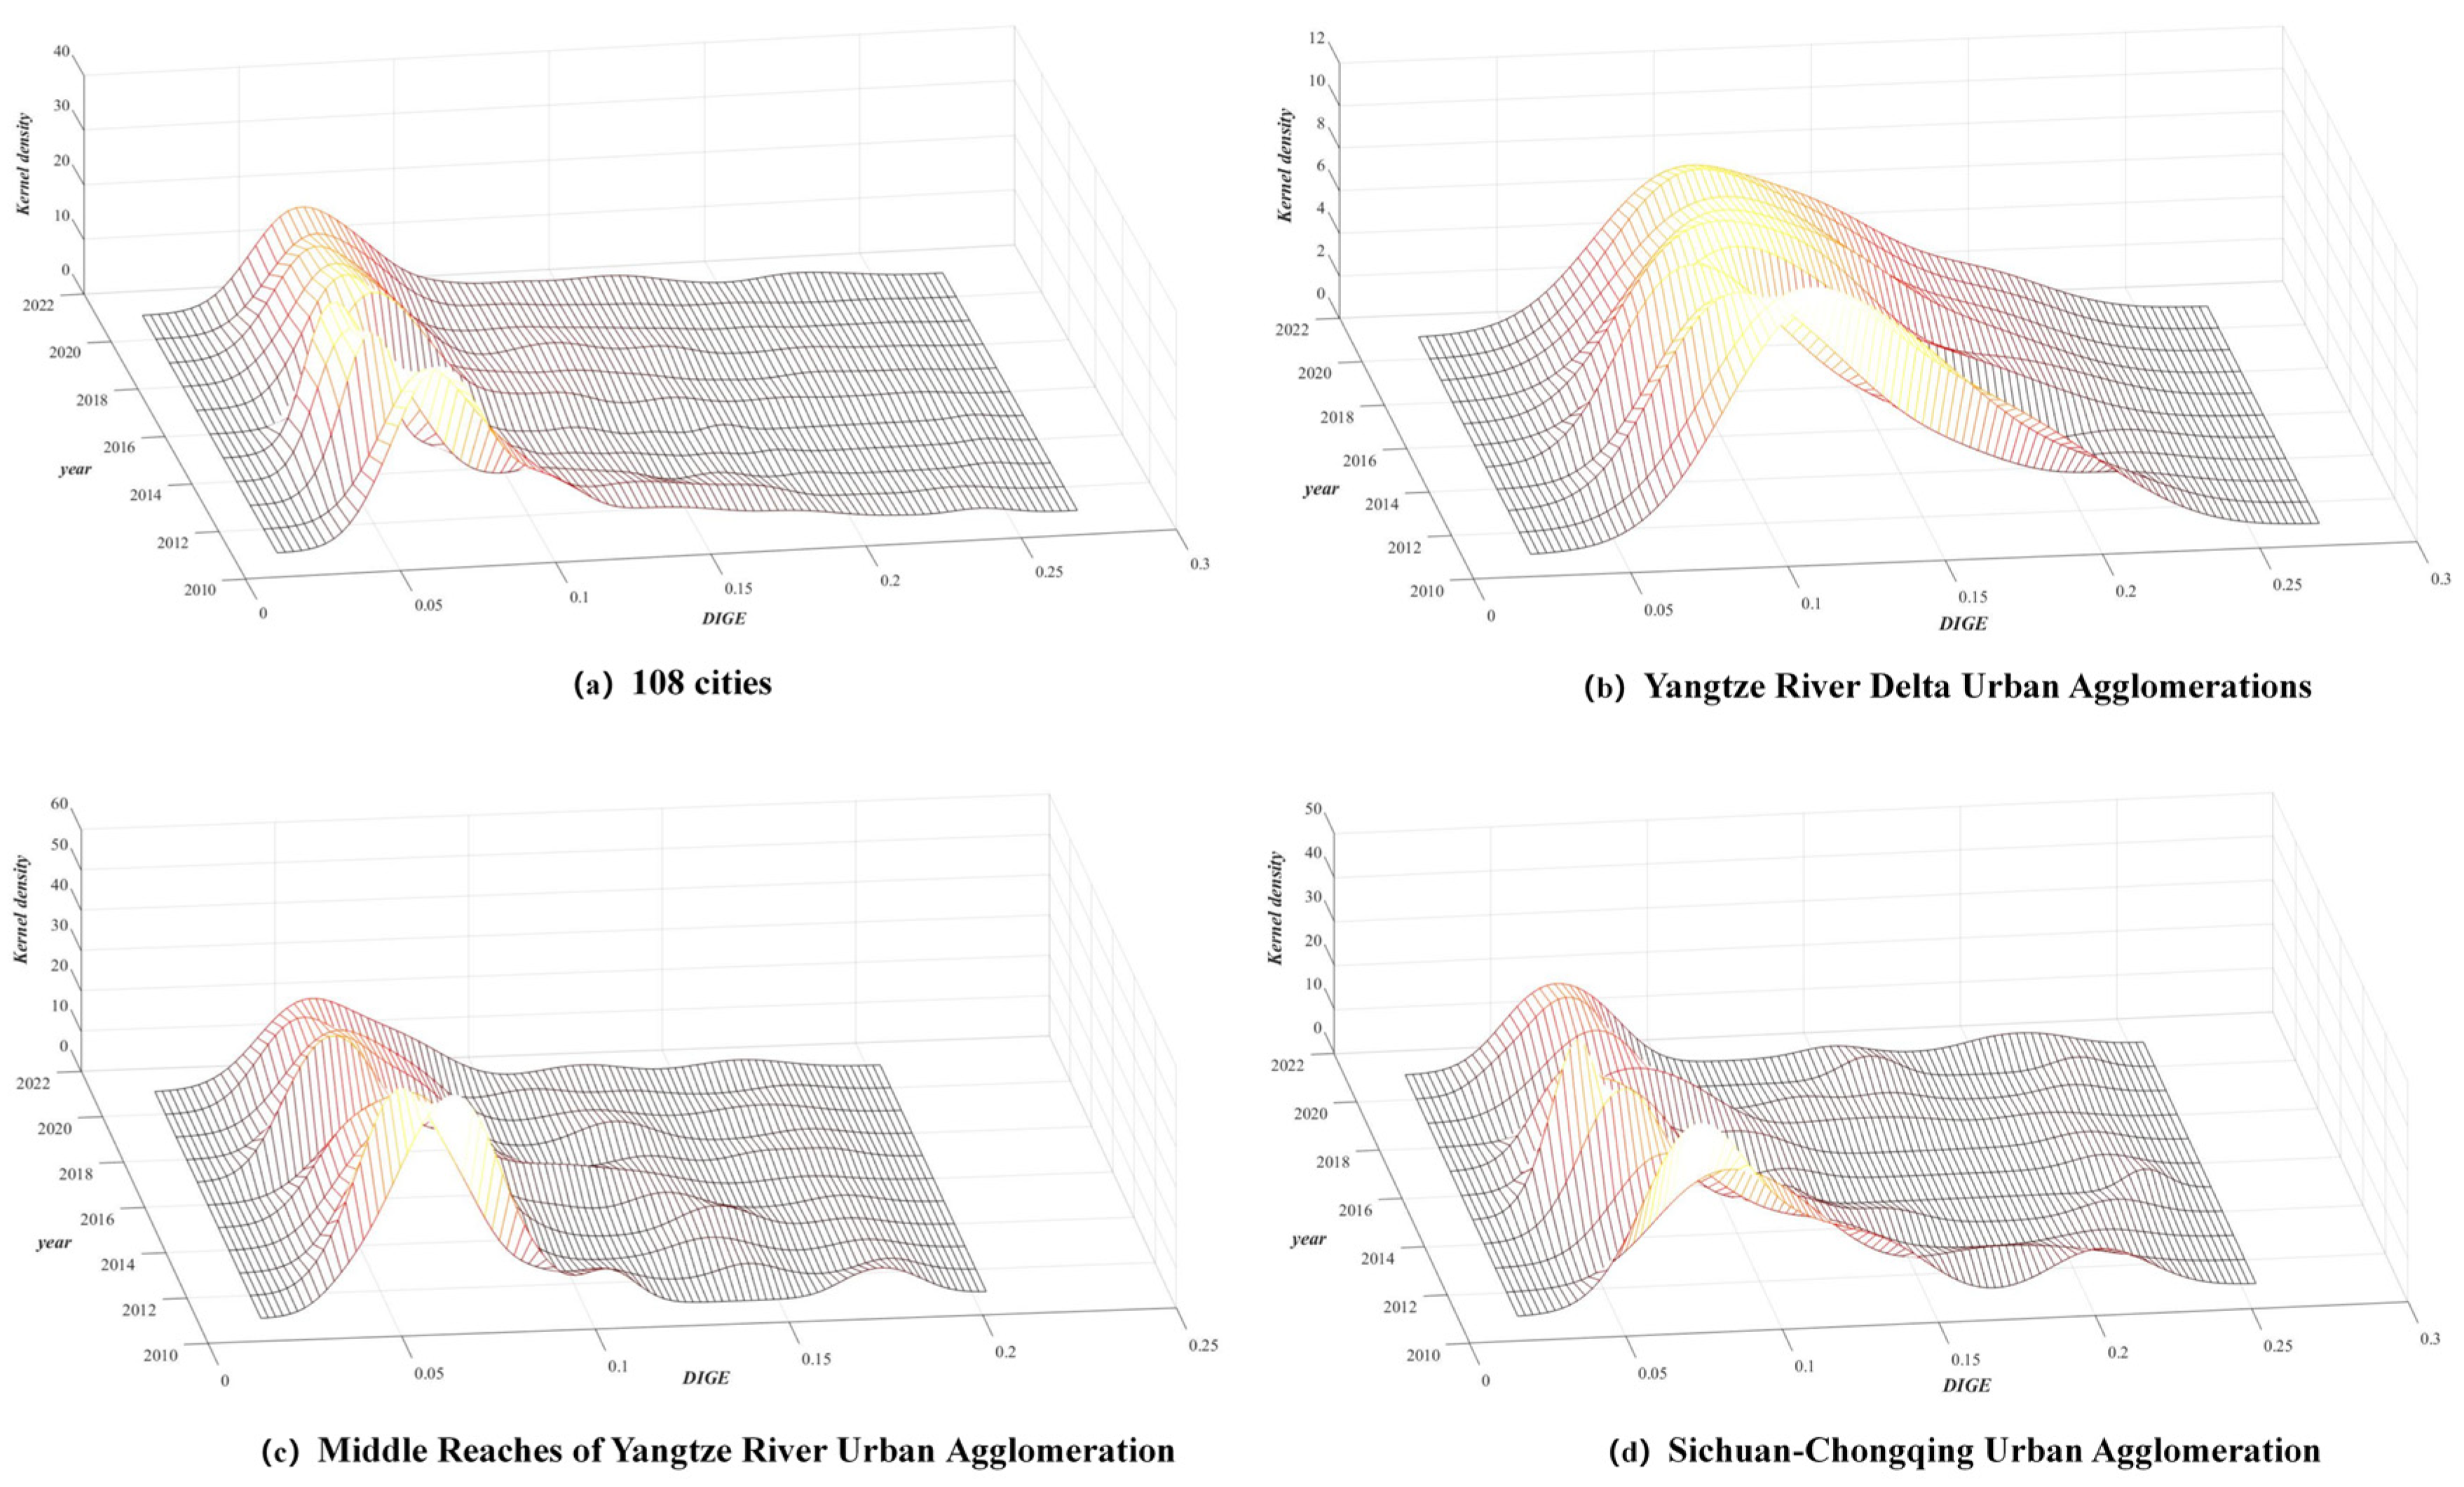
4.3.1. Heterogeneity Among Individual Cities and Urban Agglomerations

Compared with individual cities, urban agglomerations have stronger agglomeration economic effects. This paper selects samples of three urban agglomerations according to the Outline of the Yangtze River Economic Belt Development Plan for heterogeneity analysis.
Table 6 columns (1) and (2), respectively, demonstrate the difference in the contribution of DIGE on GE in urban agglomerations and individual cities. The findings reveal that the impact is more pronounced in urban agglomerations, revealing that the enabling effect of the digitization on green progress exhibits heterogeneity due to varying degrees of agglomeration economies.

4.3.2. Heterogeneity of Urban Resource Endowment

By aligning with The National Sustainable Development Plan for Resource-Based Cities (2013–2020), 108 cities were classified into resource-based and non-resource-based cities, followed by a grouping heterogeneity analysis. Columns (3) and (4) in Table 6 state the effects of the digitization on green transformation in two types, respectively. The findings reveal that the influence is more obvious in non-resource-based cities, exhibiting a “U-shaped” relationship. Conversely, in resource-based cities, the effect is not evident and demonstrates an inverted “U-shaped” pattern, indicating that green evolution in these cities relies more heavily on original resource endowment.

4.3.3. The Guiding Role of Policy Intensity

Broadband China, a policy launched in 2013 to fortify digital infrastructure, was implemented in three batches in 2014, 2015, and 2016, respectively. The stage goal of “establishing a national information infrastructure for meeting the demands of development by the end of 2015” was put forward. Therefore, with 2013 and 2016 as pivotal time nodes, we conducted the subsection test and the difference coefficient test between groups to demonstrate the guiding role of policy intensity.
Table 7 column (1) shows the effect in 2011–2013 before the implementation of this policy. The statistical test is not significant, which may be attributed to be related to the weak policy intensity, policy lag, or short time sample. Columns (2) and (3) demonstrate the impact during 2011–2015 and 2016–2022, respectively. Two groups are significant; we further used Fisher’s permutation to test the difference of coefficients between groups. The test value is significant at the level of 1%, indicating that coefficients of the two groups are comparable. The absolute value of coefficients increases from 1.021 to 1.499, suggesting the contribution of Broadband China to urban green growth was enhanced in stages.

5. Discussion

5.1. Discussion of Influence Effect

The results reveal that a “first inhibition then promotion” nonlinear relationship exists between the digital economy and the efficiency of urban green development. In addition to conducting the robustness test, we added “Utest” analysis to further validate hypothesis H1. This dynamic evolution, characterized by “short-term inhibition–long-term promotion” closely aligns with the U-shaped pattern of the Environmental Kuznets Curve (EKC) and also supports the core perspective of the threshold theory of technology diffusion. During the early stages of digital economic development, its inhibitory effect on green growth matches the left side of the Environmental Kuznets Curve. On one hand, the initial stage of digitalization requires substantial investment in digital infrastructure, which consumes significant energy and resources (such as data center construction and 5G base station deployment). This resource crowding effect may temporarily reduce local governments’ and enterprises’ 2019 investment in green technology research and development [39]. On the other hand, carbon emissions, electronic waste, and ecological impacts such as land occupation generated during the construction of digital infrastructure can directly stress local ecosystems. Moreover, the emergence of digital regional disparities, such as the “digital divide,” leads to an expansion in the gap in digital levels across regions, further inhibiting the overall green transition process in the short term. However, in the long run, as the level of digital economic development crosses critical thresholds, its technological spillover effects and structural optimization effects begin to dominate, driving urban green development into the right side of the EKC. The digital economy is expected to trigger a green reform of production factors, productivity, and production relations; form new quality productive forces with new elements, new technologies, and in new ways; and thus fully empower regional green upgrading [40].

5.2. Discussion of Influence Mechanism

New quality productive forces aims to enhance total factor productivity by driving digitization innovation in production factors, productivity, and production relations. This strategy provides mechanism guidance for digitization to promote urban green development.
One of the research attempts is to establish a framework for analyzing the ways in which the new quality productive force strategy amplify the green impact of the digital economy, thereby more precisely identifying the intermediary variables: resource allocation, green technology, industrial structure, and green finance. Based on the “U-shaped” curve of the main effect, we assume two conduction modes of the intermediary, which expands the nonlinear analysis of the intermediary mechanism, which is another attempt. Finally, in addition to the difference analysis of the impact effect from the economic and social perspectives, this study also pays attention to the influence of government behavior.

5.2.1. Resource Allocation Mechanism

The digital economy enhances the efficiency of urban green development by positively influencing resource allocation. The digitization is not just conducive to the precise docking of factors and the balance between supply and demand, but also activates the potential of new factors of data and contributes to the deeper integrating of the digital economy with the physical economy [41].

5.2.2. Green Technology Mechanism

Consistent with the main effect relationship curve, the digital economy exerts a “U-shaped” effect on green technology. The reasons for the nonlinear relationship may be that green technology has a certain threshold: The input cost of green equipment and talents is high, the integration of green technology is difficult, and the attention paid to green innovation is insufficient [42], which takes a certain period of time for green technical innovation driven by digitization. While the index exceeds the curve inflection point, the “technology dividend” function appears. Combined with the conclusion that technological innovation (TC) is the key internal cause of GE’s growth, it is necessary to transition towards a positive relevance stage between digitization and green technology.

5.2.3. Industrial Structure Mechanism

The digital economy facilitates the green level of cities through positively influencing industrial rationalization. Notably, the statistical test of industrial upgrading is not significant, which may be related to the status quo of the industrial structure in the area. The secondary industry is still the main industry in the Yangtze River Economic Belt as a whole [43]. The heavy reliance on the secondary industry restricts the progress of the digital industry to a certain extent.

5.2.4. Green Finance Mechanism

The digital economy exhibits an inverted “U-shaped” connection with green finance. This relation may be due to the fact that digitization innovates the mode of urban green growth by updating financial means and products [44]. However, when the level of digitization exceeds the reasonable scale, it may have a crowding-out effect on finance, resulting in green finance facing problems such as insufficient supply of funds and intensifying competition.
To sum up, the digital economy enables urban green development through the linear promotion of resource allocation and industrial structure, as well as the nonlinear effect on green technology and green finance. Hypotheses H2a–H2d are supported. However, attention should be given to the financial crowding-out effect and the conduction period to green technology brought by digitization in this process.

5.3. Discussion of Influence Heterogeneity

Firstly, the digital economy has a pronounced role in enhancing green level within urban agglomerations. This is because compared with individual cities, factors such as industry and capital in urban agglomerations are more concentrated, which is more conducive to breaking administrative boundary barriers [45]. Secondly, the green benefits of digitization are more comprehensively reflected in non-resource-based cities. This disparity stems from the resource endowment dependency effect and institutional rigidity constraints. Resource-based cities rely more heavily on their existing resource endowments in green development [46]. Early digitalization efforts may encroach on natural resources, and long-standing coal and steel energy-intensive industrial structures can lead to technological lock-in. The application of digital technologies faces higher barriers to transformation, and the institutional inertia associated with resource rent dependence weakens digital governance efficiency. Results of the two sets of heterogeneity are consistent with the GE spatiotemporal distribution: the efficiency value of urban agglomeration is higher, and most areas with negative efficiency are resource-based cities. Hypothesis H3a is supported.
Furthermore, this research attempts to explore the amplifying influence of policy on the correlation. With the implementation of Broadband China, the role of digital economy is increasing [47]. Building upon this, in conjunction with subsection detection and Fisher’s permutation test, it was determined that 2016 is a pivotal point to enlarge the digital economy’s value. This provides evidence for the phased strengthening in policy intensity. Hypothesis H3b is supported.

5.4. Limitations

The mediating variables and research perspectives in this paper primarily concentrate on the macro and government levels. Micro-level factors such as human concept and family activities also have a certain influence on regional green upgrading [48]. Knowledge workers play a significant role in promoting technological change and regional transformation [49]. Individuals and families effectively drive regional sustainable development through digital behavior [50]. In future research, we will further explore the specific mechanisms of these micro factors to build a more comprehensive and multi-level explanatory framework. Additionally, due to data limitations, the study period selected was from 2011 to 2022. Extending the research period or broadening the sample coverage would help enhance the generalizability of the findings. In the next phase of work, we will attempt to extend the research period and increase the sample size, adopting more diverse research methods to verify and expand existing findings.

6. Conclusions and Policy Recommendations

6.1. Conclusions

Against the policy background of fostering new quality productive forces, digitization will further profoundly affect the regional green transformation from the dimension of “production factors–productivity–production relations”. This study revealed the following: (1) The digital economy has a complex nonlinear influence on urban green development. Most cities have surpassed the critical point and entered into a positive correlation stage. (2) Under the new strategy, the efficiency of urban green growth will be indirectly affected by strengthening the positive influence of digitization on resource allocation and rationalization of industrial structure, and the nonlinear influence on green technology and green finance. (3) In urban agglomerations with a higher degree of agglomeration economy, digitization plays a more pronounced role in enhancing the level of green development. (4) The green value of the digital economy has been more fully utilized in non-resource-based cities. (5) With the gradual promotion of digital policies such as Broadband China, the effect of the digital economy on green growth is also increasing in stages.

6.2. Policy Implications

The following policy recommendations are presented:
  • Fully release the green value of digitization. The 108 cities along the Yangtze River Economic Belt have collectively surpassed the development threshold, transitioning from a short-term phase where digital economy suppressed green development to a new long-term cycle that promotes it. Cities should seize the opportunity of new quality productive forces and promote green development with digital dividends. Simultaneously, concern should be paid to the ecological load and the crowding out of natural resources caused by early over-investment and extensive growth, so as to alleviate the ecological pressure accumulated in the early stage of digital economy development.
  • Focus on the transmission effect of resource allocation, green technology, industrial structure, and green finance. We should fully utilize the integration and penetration effect of digitization on traditional factors and establish a regional environmental data trading platform to activate the value of new production factors such as data. It is also recommended to promote the conversion of innovation achievements towards real productivity; set up special funds to support AI-driven pollution prediction models, blockchain-based carbon footprint traceability systems, and other “digital + green” cross-disciplinary technologies; and shorten the transmission cycle from digitization towards green technological innovation. Meanwhile, based on the current situation of the industrial structure of Yangtze River Economic Belt, cities should weaken their dependence on the secondary sector, formulate negative lists based on digitalization, restrict the expansion of high-energy-consuming enterprises, and provide incentives for traditional enterprises to upgrade through “digital transformation subsidies”. Furthermore, urban regions should reasonably promote the transformation from traditional “cornerstone finance” to “new quality finance” by designing “digital–green” linked bonds or credit products, binding financing interest rates with indicators like carbon emission intensity and digitalization levels.
  • It is the development direction of urban spatial structure to build multi-center urban agglomeration. Relying on the construction of three major urban agglomeration, areas should accelerate the flow and cooperation of digital elements and technologies in surrounding cities. Efforts should be made to pilot a “Digital Green Integrated Demonstration Zone” along the Yangtze River Economic Belt, promoting cross-provincial data sharing and industrial collaboration for emission reduction, thereby addressing efficiency losses caused by administrative divisions.
  • Resource-based and non-resource-based cities should make distinct positioning and choices in the process of digitization and green transformation. Non-resource-based cities should speed up the digitization process and give full impetus to the active influence on green growth. Resource-based cities should be more cautious and formulate rationalized digital economy development plans based on own resource endowment and carrying capacity.
  • Match appropriate policy intensity for urban green upgrading. The government should promote the formulation of special digital economy policies, establish a dynamic evaluation mechanism for policy effects, conduct quantitative evaluation of the implementation effect of policies every year, and make dynamic adjustments according to the implementation effect, so as to continuously expand the scope of benefits and application scope of the policies.

Author Contributions

Conceptualization, X.L. and S.L.; Methodology, X.L.; Data curation, Q.W. and J.C.; Writing—original draft, X.L.; Writing—review & editing, X.L. and S.L.; Funding acquisition, S.L. All authors have read and agreed to the published version of the manuscript.

Funding

This research was funded by [China University of Geosciences] grant number [No. 22YJA790030] And The APC was funded by [Research on Green and Low-carbon Layout Optimization of Tibet Highway Transportation Infrastructure and Application Technology of Autonomous Energy Systems]. Grant number [XZ202303ZY0012G].

Institutional Review Board Statement

Not applicable.

Informed Consent Statement

Not applicable.

Data Availability Statement

The datasets presented in this article are not readily available because the data are part of an ongoing study. Requests to access the datasets should be directed to lixianmin@cug.edu.cn.

Conflicts of Interest

The authors declare no conflict of interest.

Appendix A

Table A1. Index system of urban green development efficiency.
IndexTypesPrimary IndicatorsIndicators Description
Urban green development efficiencyInput dimensionCapital factorCapital stock
Labor force factorNumber of employees
Resource factorsLand use, energy consumption
Expected output dimensionEconomic benefitRegional actual GDP
Non-expected output dimensionEnvironmental pollutionEmissions of industrial pollutants
Table A2. Results of Granger causality test.
Variable RelationshipsZ-BarZ-Bar~pConclusions
DIGE  GE12.598 ***4.878 ***0.000Significant
GE  D1.545−0.7040.481Not significant
Note: p is the significance level, *** p < 0.01. Z-Bar is the standardized statistic and Z-Bar~ is the corrected statistic.

References

  1. Wang, R. Modernization of harmonious coexistence between man and nature: Historical achievements, Contradiction challenges and realization path. Manag. World 2023, 39, 19–30. [Google Scholar] [CrossRef]
  2. Santarius, T.; Dencik, L.; Diez, T.; Ferreboeuf, H.; Jankowski, P.; Hankey, S.; Hilbeck, A.; Hilty, L.M.; Höjer, M.; Kleine, D.; et al. Digitalization and Sustainability: A Call for a Digital Green Deal. Environ. Sci. Policy 2023, 147, 11–14. [Google Scholar] [CrossRef]
  3. He, G.; Jiang, H.Y.; Zhu, Y.N. The effect of digital technology development on the improvement of environmental governance capacity: A case study of China. Ecol. Indic. 2024, 165, 14. [Google Scholar] [CrossRef]
  4. Yi, M.; Chen, D.H.; Wu, T.; Tao, M.M.; Sheng, M.S.; Zhang, Y. Intelligence and carbon emissions: The impact of smart infrastructure on carbon emission intensity in cities of China. Sust. Cities Soc. 2024, 112, 20. [Google Scholar] [CrossRef]
  5. Yang, Z.; Gao, W.J.; Han, Q.; Qi, L.Y.; Cui, Y.J.; Chen, Y.Q. Digitalization and carbon emissions: How does digital city construction affect china’s carbon emission reduction? Sust. Cities Soc. 2022, 87, 14. [Google Scholar] [CrossRef]
  6. Liu, H.; Chen, D.L. Asymmetrical impact of natural resources and the digital economy on green growth in the top five Asian knowledge-based economies. Resour. Policy 2024, 88, 14. [Google Scholar] [CrossRef]
  7. Chatzistamoulou, N. Is digital transformation the Deus ex Machina towards sustainability transition of the European SMEs? Ecol. Econ. 2023, 206, 13. [Google Scholar] [CrossRef]
  8. Chen, X.H.; Li, Y.Y.; Song, L.L.; Wang, Y.J. Digital Economy Theory System and Research Prospects. Manag. World 2022, 38, 208–224+213–216. [Google Scholar] [CrossRef]
  9. Guo, F.; Xiong, Y.J.; Shi, Q.L. Digital economy and economic development in administrative border areas: Evidence from satellite light data. Manag. World 2023, 39, 16–33. [Google Scholar] [CrossRef]
  10. Karlilar, S.; Balcilar, M.; Emir, F. Environmental sustainability in the OECD: The power of digitalization, green innovation, renewable energy and financial development. Telecommun. Policy 2023, 47, 15. [Google Scholar] [CrossRef]
  11. Zhou, W.; Xu, L.Y. The new theory of productivity: The connotation characteristics and important focus. Reform 2023, 1–13. Available online: https://www.cnki.com.cn/article/cjfdtotal-refo202310001.htm (accessed on 10 May 2025).
  12. Hong, Y.X. New quality productive forces and their cultivation and development. Econ. Dyn. 2024, 3–11. Available online: https://www.cnki.com.cn/Article/CJFDTotal-JJXD202401001.htm (accessed on 10 May 2025).
  13. Ren, B.P. The Logic of the Transformation of Productive Forces into New Quality Productive Forces. Econ. Res. 2024, 59, 12–19. [Google Scholar]
  14. Shi, S.H.; Lou, Z.L. Research on the Impact of New Quality Productivity on Employment Scale. J. Xi’an Univ. Financ. Econ. 2025, 4, 1–14. Available online: https://link.cnki.net/doi/10.19331/j.cnki.jxufe.20250423.002 (accessed on 10 May 2025).
  15. Cui, H.Y.; Cao, Y.Q. Do smart cities improve energy efficiency? A test of spatial effects and mechanisms. Sust. Cities Soc. 2024, 101, 21. [Google Scholar] [CrossRef]
  16. He, W.W.; Hou, J.J. Has the digital economy promoted the formation of a unified labor market? Econ. Manag. 2023, 45, 5–21. [Google Scholar] [CrossRef]
  17. Wang, Q.X.; Hu, A.; Xin, Y.J. Can the digital economy boost green development?—Based on energy conservation, emission reduction, the synergistic mechanism of empirical test. Bus. Econ. Manag. 2022, 44–59. [Google Scholar] [CrossRef]
  18. Li, Y.; Zou, C.; Huang, Y.C.; Wan, A.W. Environmental Regulation, Green Innovation, and Corporate Brand Value. Sustainability 2025, 17, 3445. [Google Scholar] [CrossRef]
  19. Zhang, W.; Shu, C.Y.; Chen, B.Y.; Liu, H.L. Research on digital transformation strategy of the energy industry based on differential game under the dual-carbon background in China. Sci. Total Environ. 2024, 906, 18. [Google Scholar] [CrossRef]
  20. Wang, F.; Sun, S.H.; Liu, T.J. Does the development of digital economy Promote the reform of agricultural production mode? Evidence from prefecture-level cities in the Yellow River Basin. China’s Rural. Econ. 2023, 122–143. [Google Scholar] [CrossRef]
  21. Xu, H.; Zhang, Y.L.; Cao, Y.J. Digital economy, technology spillovers and dynamic competition policy. Manag. World 2020, 36, 63–84. [Google Scholar] [CrossRef]
  22. Zhang, S.L.; Li, Y.; Jiu, E.K.; Ji, Q.W. Path dependence, market entry and transformation of resource-based cities. Econ. Theory Econ. Manag. 2016, 36, 14–27. [Google Scholar] [CrossRef]
  23. Xu, J.; Li, Q.H.; Wang, Y.H. Mechanism analysis of supply-side reform driving the transformation of resource-based cities. China Popul. Resour. Environ. 2016, 26, 53–60. [Google Scholar] [CrossRef]
  24. Sun, G.L.; Fang, J.M.; Li, J.N.; Wang, X.L. Research on the impact of the integration of digital economy and real economy on enterprise green innovation. Technol. Forecast. Soc. Change 2024, 200, 123097. [Google Scholar] [CrossRef]
  25. Tao, C.Q.; Yi, M.Y.; Wang, C.S. Coupling coordination analysis and Spatiotemporal heterogeneity between data elements and green development in China. Econ. Anal. Policy 2023, 77, 1–15. [Google Scholar] [CrossRef]
  26. Lu, X.D.; Lian, Y.J. Estimation of the total factor productivity of industrial enterprise in China: 1999–2007. Economics 2012, 11, 541–558. Available online: https://d.wanfangdata.com.cn/periodical/jjx201202008 (accessed on 10 May 2025).
  27. Hu, J.; Yu, X.R.; Han, Y.M. Can ESG rating promote the green transformation of enterprises?—Verification based on multi-point double difference method. Quant. Tech. Econ. Res. 2023, 40, 90–111. [Google Scholar] [CrossRef]
  28. Guo, F.; Wang, J.Y.; Wang, F. Measure of financial development of China digital pratt & Whitney: Index and spatial characteristics. Economics 2020, 19, 1401–1418. [Google Scholar] [CrossRef]
  29. Zhao, T.; Zhang, Z.; Liang, S.K. Digital economy, entrepreneurial activity and high-quality development: Empirical evidence from Chinese cities. Manag. World 2020, 36, 65–76. [Google Scholar] [CrossRef]
  30. Liu, C.; Xia, J.C. Online market, digital platform and resource allocation Efficiency: The role of price mechanism and data mechanism. China’s Ind. Econ. 2023, 84–102. [Google Scholar] [CrossRef]
  31. Qi, S.Z.; Lin, S.B.; Cui, J.B. Can the Environmental Rights trading market induce green innovation?-evidence based on green patent data of listed companies in China. Econ. Stud. 2018, 53, 129–143. [Google Scholar]
  32. Liu, F.; Huang, P.; Tang, D. Carbon reduction effect and the influence of green financial channels research. Financ. Econ. 2022, 37, 144–158. [Google Scholar]
  33. Lin, W.P.; Feng, B.Y. Curve effect in the field of management and statistical test method. Nankai Manag. Rev. 2022, 25, 155–166. [Google Scholar] [CrossRef]
  34. Jiang, T. Mediation effect and adjustment effect in the study of causal inference experience. China’s Ind. Econ. 2022, 100–120. [Google Scholar] [CrossRef]
  35. Wen, Z.L.; Ye, B.J. Intermediary effect analysis: Method and model development. Adv. Psychol. Sci. 2014, 22, 731–745. [Google Scholar] [CrossRef]
  36. Lin, B.Q.; Tan, R.P. Chinese economy agglomeration and green economic efficiency. Econ. Stud. 2019, 54, 119–132. [Google Scholar]
  37. Lind, J.T.; Mehlum, H. With or Without U? The Appropriate Test for a U-Shaped Relationship. Oxf. Bull. Econ. Stat. 2010, 72, 109–118. [Google Scholar] [CrossRef]
  38. He, L.Y.; Qi, X.F. Environmental regulation and green total factor productivity: Evidence from Chinese industrial firms. Economics 2022, 97–114. Available online: https://www.cnki.com.cn/article/cjfdtotal-jjxd202206007.htm (accessed on 10 May 2025).
  39. Wu, D.S.; Xie, Y.; Lyu, S. Disentangling the complex impacts of urban digital transformation and environmental pollution: Evidence from smart city pilots in China. Sust. Cities Soc. 2023, 88, 24. [Google Scholar] [CrossRef]
  40. Ma, L.; Li, X.M.; Pan, Y. Employee allocation efficiency in the context of the digital economy: Evidence from “Broadband China” demonstration cities. Econ. Anal. Policy 2024, 82, 735–752. [Google Scholar] [CrossRef]
  41. Jing, W.J.; Sun, W.B. Digital economy promotes the high quality and economic development: A theoretical analysis framework. Economist 2019, 66–73. [Google Scholar] [CrossRef]
  42. Yang, Z.; Ling, H.C.; Chen, J. Urban green development awareness and green technology innovation. World Econ. 2024, 47, 211–232. [Google Scholar] [CrossRef]
  43. Liu, J.; Yu, S.W. The impact of industrial structure optimization on ecological efficiency in Green development: A case study of the Yangtze River Economic Belt. Environ. Econ. Res. 2019, 4, 73–91. [Google Scholar] [CrossRef]
  44. Zhao, Y.Z.; Xing, R.N.; Niu, Z.M. New Quality Productivity, Digital Economy and High-quality Development of Manufacturing. Reg. Financ. Res. 2024, 23–32. Available online: https://xueshu.baidu.com/usercenter/paper/show?paperid=1w3602707d2c0mg0qj540ev0eq268925&site=xueshu_se&hitarticle=1 (accessed on 10 May 2025).
  45. Miao, X.; Chen, M.K.; Tu, J.Y.; Tian, Y.Z.; Hao, Y. The environmental consequences of industrial agglomeration: New evidence from city-level data in China. Struct. Change and Econ. Dyn. 2024, 71, 630–645. [Google Scholar] [CrossRef]
  46. Wu, S.; Wang, P.; Sun, B.; Turok, I. Internet, transportation infrastructure and the spatial structure of urban employment in China. Reg. Stud. 2024, 58, 1033–1046. [Google Scholar] [CrossRef]
  47. Peldon, D.; Banihashemi, S.; Lenguyen, K.; Derrible, S. Navigating urban complexity: The transformative role of digital twins in smart city development. Sust. Cities Soc. 2024, 111, 18. [Google Scholar] [CrossRef]
  48. Schloer, H.; Venghaus, S. Measuring resilience in the food-energy-water nexus based on ethical values and trade relations. Appl. Energy 2022, 323, 15. [Google Scholar] [CrossRef]
  49. Corò, G.; Plechero, M.; Rullani, F.; Volpe, M. Industry 4.0 technological trajectories and traditional manufacturing regions: The role of knowledge workers. Reg. Stud. 2021, 55, 1681–1695. [Google Scholar] [CrossRef]
  50. Taylor, M.; Street, P. Learning to (not quite) buy nothing: Digital gift economies and household innovations reducing consumption. Environ. Innov. Soc. Transit. 2024, 53, 100929. [Google Scholar] [CrossRef]
Figure 1. The analysis framework of influence mechanism.
Sustainability 17 04539 g001
Figure 2. Research area.
Sustainability 17 04539 g002
Figure 3. Spatiotemporal situation of GE change, 2011–2022.
Sustainability 17 04539 g003
Figure 4. Situation of the DIGE core density curve, 2011–2022.
Sustainability 17 04539 g004
Table 1. Descriptive statistics of main variables.
VariablesStatistical InterpretationNMSDp50
GEGreen total factor productivity12961.000.041.00
DIGEDigital economy index12960.100.050.09
RGDPNatural logarithm of per capita GDP12961.170.581.17
INDIndustrial value added/gross regional product12960.400.100.40
FILActual utilization of foreign capital/gross product12960.020.020.02
CILGeneral expenditure of government finance/gross product12960.200.080.18
STLExpenditure on science and technology/general expenditure of government finance12960.020.020.02
HCLNatural logarithm of number of students in ordinary colleges and universities129610.771.1710.61
ESLEmployment in the tertiary sector/total employment12960.530.140.53
RAEResource mismatch index12961.190.301.16
GTINumber of patent applications for green inventions/total patent applications12960.130.050.12
ISRIndustrial rationalization index12960.320.240.27
ISAIndustrial upgrading index12960.970.440.91
GFIGreen finance index12960.320.100.32
Note: observations (N), mean (M), standard deviation (SD), median (p50).
Table 2. Results of baseline estimation.
VariablesGEGEGEGEGEGEGEGEGE
(1)(2)(3)(4)(5)(6)(7)(8)(9)
DIGE0.162 **−0.264 *−0.246 *−0.250 *−0.272 *−0.287 *−0.291 *−0.291 *−0.295 **
(2.06)(−1.81)(−1.65)(−1.68)(−1.83)(−1.92)(−1.96)(−1.96)(−1.98)
DIGE2 0.961 ***0.898 ***0.964 ***1.027 ***1.054 ***1.010 ***1.008 ***0.993 ***
(3.12)(2.78)(2.98)(3.17)(3.25)(3.11)(3.10)(3.06)
RGDP −0.009−0.008−0.002−0.005−0.003−0.0020.001
(−0.64)(−0.63)(−0.14)(−0.37)(−0.23)(−0.17)(0.08)
STL −0.331 **−0.377 ***−0.375 ***−0.335 **−0.335 **−0.301 **
(−2.55)(−2.87)(−2.86)(−2.52)(−2.52)(−2.25)
IND −0.053 **−0.052 **−0.053 **−0.053 **−0.045 *
(−2.11)(−2.09)(−2.12)(−2.11)(−1.79)
GIL −0.053−0.040−0.041−0.040
(−1.44)(−1.07)(−1.08)(−1.06)
FIL −0.258 *−0.260 *−0.247 *
(−1.93)(−1.94)(−1.84)
HCL −0.002−0.001
(−0.33)(−0.27)
ESL 0.030 **
(2.03)
Constant0.974 ***0.991 ***0.997 ***1.003 ***1.023 ***1.035 ***1.037 ***1.052 ***1.026 ***
(256.28)(147.59)(88.07)(87.24)(68.71)(60.33)(60.43)(21.13)(20.01)
City fixedYesYesYesYesYesYesYesYesYes
Year fixedYesYesYesYesYesYesYesYesYes
R20.3360.3420.3420.3460.3480.3500.3520.3520.355
Cities108108108108108108108108108
Sample size129612961296129612961296129612961296
Note: Bracketed clustering robust standard deviation, p is the significance level,* p < 0.1, ** p < 0.05, *** p < 0.01. Below table has the same meaning.
Table 3. “Utest” results of nonlinear relationship of main effects.
VariablesLower BoundUpper Bound
Interval0.0260.335
Slope−0.2420.369
t-value−1.8223.778
p > |t|0.0340.000
Extreme point interval: Min = 0.022; Max = 0.478
Note: “Utest” generates p values through rank distribution. When this test is borrowed, the data type must be continuous or ordered categorical.
Table 4. Results of endogeneity processing and robustness tests.
Variables2SLSGETC
(1) The First Stage(2) The First Stage(3) The Second Stage(4)(5)(6)
DIGE −2.674 *−0.279 *−0.291 *0.495 ***
(−1.48)(−1.89)(−1.81)(2.75)
DIGE2 5.019 *0.976 ***0.959 ***1.429 ***
(1.54)(3.03)(2.68)(3.64)
iv_DIGE0.001 ***
(2.86)
iv_DIGE2 0.001 ***
(2.43)
Constant0.147 ***0.174 *** 1.046 ***1.051 ***1.086 ***
(2.89)(3.68) (17.88)(17.46)(21.65)
F18.6117.25
Cragg–Donald Wald F 10.216 [7.03]
Control variablesYesYesYesYesYesYes
City fixedYesYesYesYesYesYes
Year fixedYesYesYesYesYesYes
R20.9240.9190.9150.2810.3550.349
Cities108108108106108108
Sample size129612961296127211881296
Note: Bracketed clustering robust standard deviation, p is the significance level,* p < 0.1, *** p < 0.01.
Table 5. Results of influence mechanism test.
VariablesRAEGTIISRISAGFI
(1)(2)(3)(4)(5)(6)(7)(8)(9)(10)
DIGE−1.362 ***1.4300.021−0.332 **−0.484 *−0.4890.127−0.6890.0740.302 **
(−3.40)(1.66)(0.25)(−2.17)(−1.72)(−0.64)(0.20)(−0.45)(1.20)(2.28)
DIGE2 −6.542 *** 0.827 *** 0.012 1.922 −0.540 *
(−3.71) (2.79) (0.01) (0.51) (−1.68)
RGDP0.0930.0100.0250.0350.0930.093−0.081−0.0580.006−0.001
(0.64)(0.07)(0.86)(1.22)(1.05)(0.99)(−0.71)(−0.54)(0.55)(−0.07)
GIL1.503 **1.748 ** −0.068−0.0690.033−0.0360.1240.147
(2.15)(2.32) (−0.11)(−0.11)(0.03)(−0.03)(0.92)(1.07)
HCL−0.047−0.0020.0090.005 −0.0030.001
(−0.25)(−0.01)(0.32)(0.16) (−0.12)(0.04)
STL−0.361−0.3170.0690.062−0.300−0.3000.3700.3540.122 ***0.126 ***
(−1.24)(−1.10)(1.20)(1.08)(−0.88)(−0.89)(0.56)(0.54)(4.51)(4.60)
IND−0.002−0.0040.0050.0050.0360.0360.0740.074−0.006 **−0.006 **
(−0.04)(−0.07)(0.73)(0.78)(0.69)(0.69)(1.17)(1.18)(−2.02)(−2.06)
FIL 0.340 *0.359 **−0.870−0.8701.7051.762−0.065−0.080
(1.96)(2.11)(−1.04)(−1.02)(1.52)(1.57)(−0.48)(−0.57)
ESL −0.026−0.026 0.0140.015
(−1.01)(−1.03) (0.99)(1.04)
Constant1.298 **1.179 *0.034 *0.048 **0.0510.0510.1530.1850.334 ***0.324 ***
(2.12)(1.96)(0.45)(0.64)(0.09)(0.09)(0.21)(0.25)(9.12)(8.61)
City fixedYesYesYesYesYesYesYesYesYesYes
Year fixedYesYesYesYesYesYesYesYesYesYes
R20.8640.8670.5870.5890.6960.6960.8830.8830.9520.953
Sample size1296129612961296129612961296129612961296
Note: Bracketed clustering robust standard deviation, p is the significance level, * p < 0.1, ** p < 0.05, *** p < 0.01. The Utest results of GTI show that the critical point of 0.116 falls within the effective range of [0.027, 0.335], and the Slope changes from negative to positive, which is significant at the level of 1%. The Utest of GFI showed that the critical point of 0.311 was in a limited range, and the Slope changed from positive to negative, which was significant at the level of 10%.
Table 6. Results of two heterogeneity analyses.
VariablesGEGEGEGE
(1)(2)(3)(4)
DIGE−0.342 **−0.214−0.074−0.317 *
(−2.01)(−0.54)(−0.18)(−1.81)
DIGE21.152 ***1.3180.2231.029 ***
(3.16)(1.00)(0.16)(2.87)
Constant1.075 ***0.924 ***0.942 ***1.057 ***
(16.03)(11.44)(9.39)(16.82)
Control variablesYesYesYesYes
City fixedYesYesYesYes
Year fixedYesYesYesYes
R20.3840.3300.2860.286
Cities71373969
Sample size852444468828
Note: Bracketed clustering robust standard deviation, p is the significance level,* p < 0.1, ** p < 0.05, *** p < 0.01.
Table 7. Test results of policy intensity effect.
VariablesGEGEGE
(1)(2)(3)
DIGE−0.470−0.347 *−0.470 *
(−0.83)(−1.82)(−1.66)
DIGE20.0601.021 **1.499 ***
(0.03)(2.57)(2.76)
Constant1.019 ***1.007 ***1.056 ***
(3.65)(16.39)(11.67)
Control variablesYesYesYes
City fixedYesYesYes
Year fixedYesYesYes
R20.1650.2110.216
Sample size324540756
Time segment2011–20132011–20152016–2022
Fisher’s permutation test/−2.883 ***
Note: Bracketed clustering robust standard deviation, p is the significance level,* p < 0.1, ** p < 0.05, *** p < 0.01. p-value for the coefficient difference between groups was calculated using Fisher’s permutation test (1000 samples).
Disclaimer/Publisher’s Note: The statements, opinions and data contained in all publications are solely those of the individual author(s) and contributor(s) and not of MDPI and/or the editor(s). MDPI and/or the editor(s) disclaim responsibility for any injury to people or property resulting from any ideas, methods, instructions or products referred to in the content.

