Abstract
Efficient urban water management is crucial for sustainability, especially in contexts such as Mexico. Therefore, assessing the performance of Water Utility Organizations (WUOs) is very important. This study assesses the technical efficiency of 49 Mexican WUOs using cross-sectional data for 2020 and investigates the effect of geographic location as a potential determinant. A two-stage approach was applied. First, Data Envelopment Analysis (DEA) oriented to inputs (under Constant (CRS) and Variable (VRS) Returns to Scale assumptions) was used to evaluate technical efficiency with input measures of employment and costs, and output measures of volume produced and population served. The second stage involved Tobit regression modeling to examine the determinants of technical inefficiency derived from the DEA (censored left at zero), testing the effect of geographic microregions. The DEA results presented a rather significant average inefficiency (mean scores of 0.73 CRS, 0.82 VRS), which implies input savings of 18–27% could still be in the shelves. Notably, the subsequent Tobit modeling found that wide geographical microregions were not statistically significant (p > 0.79) in accounting for those inefficiencies, implying zero explanatory power. The findings indicate that improvements in efficiency require going beyond broad geography to probably focus on local managerial, institutional, or operational considerations. The present study provides empirical benchmarks for Mexican WUOs and evidence on the limited role of broad geography, thereafter directing future research toward specific performance determinants.
1. Introduction
Urbanization poses challenges in drinking water supply and sewerage management due to higher demand and greater wastewater generation, necessitating an integrated approach to infrastructure and resource optimization. Increasing urban development increases the demand for drinking water, which may go beyond the capacity of existing infrastructure [1]. Furthermore, the concentration of people intensifies the generation of domestic wastewater [2]. This requires much more efficient sewerage systems [3,4]. Efficiency in management becomes crucial to have an adequate and continuous supply [5,6]. Urbanization, on the other hand, has negative implications in terms of aggravating the impact of climate change [7], requiring adaptations [8]. Water management in this scenario will be transversal to include efficiency, sustainability, and adaptation to climate change. Therefore, it is necessary to examine how WUOs have decided to use resources for this purpose and whether geography influences their performance.
Efficiency in the water sector is critical to ensuring universal access to drinking water, sustainability of water resources, and user satisfaction; several studies have shown that inefficiency in water management can have adverse effects in terms of economic losses, waste of resources, and deterioration in service quality [9,10]. In this context, DEA has emerged as an important tool to examine the efficiency of water utilities, their ability to identify best practices, and guide performance improvement decisions [11].
DEA faces problems related to data comparability and underlying assumptions regarding production frontiers. Different data quality [12], information availability [13,14] and data collection methods [15] do not allow for comparisons across firms. Ferro et al. [16] indicate that data comparability is important. The definition of production frontier [17] is also likely to be affected by external factors [18] and assumptions related to technology [19]. When comparing companies from different geographical locations [20] or companies with different structures [21], the idiosyncrasies of each scenario are paramount. Camanho et al. [22] indicated that the selection of variables is important in performance evaluation. It can even distort the analysis and require some specific models [23] since there could be results that are not useful, such as unaccounted for water [24]. These are key obstacles that need to be addressed to ensure that efficiency analyses remain valid in the water industry.
There is a spatial component included in the DEA, which speaks of all those regional influences on the efficiency of the WUOs. Previous work has shown that population density, water resource availability, socioeconomic conditions, and management policies can significantly affect water utilities [25,26,27]. Spatial analysis allows to model spatial dependence and capture the interactions of WUOs with their geographic environment, thus allowing a more comprehensive view of the factors that cause their efficiency.
This work was carried out with data from 2020 and deals with the efficiency of water management in 49 WUOs in Mexico, by applying a methodology through the DEA model with Tobit. DEA evaluates the relative efficiency of these WUOs in obtaining resources (total employment, total costs) for the production and distribution of drinking water (volume produced, population served). The premise is that the geographic location of WUOs in Mexico significantly affects their performance due to differences in socioeconomic conditions, population density, geographic conditions, and access to resources. To demonstrate this, a Tobit model is deployed that analyzes the influence of geographic location on the efficiency estimated by DEA.
This paper is organized in several stages: first, the literature on water sector efficiency, governance, and the use of DEA and Tobit models in this context is reviewed. The methodology employed is described, which combines DEA to assess the technical efficiency of WUOs and a Tobit model to analyze the effect of geographic location. Next, the PIGOO-CONAGUA data and the selected variables (employment, costs, production volume, and population served) are presented. The results of the DEA are shown, accompanied by estimates of average efficiency for WUOs under CRS and VRS, as well as the least and most efficient WUOs identified. Finally, a Tobit analysis is performed to test whether geographic location is a factor in efficiency, after which the discussion of the results is presented, and a comparison with the previous literature, the limitations of the study, and lines for future research are outlined.
2. Literature Review
Governance in the water sector is essential for efficiency and public trust. Transparent, accountable, and participatory governance [28,29] is often linked to more efficient resource management, though its impact may vary based on local implementation and political dynamics [30,31], process optimization [32], and continuous service improvement [33]. Control has incorporated transparency into trust generation [1], while public participation [34] legitimizes actions and facilitates adaptive solutions. Pinto et al. [35] and Molinos-Senante et al. [36] have confirmed the importance of governance for efficiency and optimization of services. Public participation enhances public trust, as noted by Walker et al. [37]. Strong governance ensures the efficiency, sustainability, and legitimacy of water companies.
Since the 1983 reform, the institutional framework for water in Mexico aimed to decentralize management and grant greater autonomy to WUOs, adopting a client-oriented approach. However, challenges remain in separating service provision from political influence. However, this model failed to sever the ties between the service and politics, maintaining subordination to mayors and governors. Although private participation was encouraged, it prospered mainly in the construction of treatment plants, not in the operation of services, which are mostly maintained in the public sphere with a “low-level equilibrium” [38].
The evaluation of water companies’ performance takes into account parameters other than technical and economic efficiency. Service quality, which includes aspects such as continuity of supply [39], water quality [40] and customer service [41], has a considerable impact on customer satisfaction.
Environmental sustainability also acquires much greater importance and studies that analyze eco-efficiency [25,42], greenhouse gas emissions [43], and water loss management [10,44] have identified it as one of the main indicators.
Several factors influence firm performance, including efficiency, service quality, and financial sustainability. These factors are regulations [12,45], incentives [46,47], ownership structure [48,49,50], responsiveness [35,51], and governance structure [52,53]. Finally, asset management, including investment planning and infrastructure maintenance, is crucial for future service continuity and quality [54,55].
Performance evaluation and benchmarking are crucial for water utilities to optimize their efficiency and improve customer service. Techniques such as DEA [21,46,56,57] and the Malmquist index [8,24], among others, allow identifying best practices and inefficiencies [57,58]. This process of learning and sharing successful strategies [59,60], which is facilitated by benchmarking and comparison between companies [32,61] or operational units [62], promotes efficiency in the use of resources [63], encourages innovations [15,47], and drives improvements in service quality [46,64]. Studies such as Marques et al. [65], Marques and De Witte [66], and Molinos-Senante et al. [67] attest to these tools for service optimization and improvement. Combined, they result in efficient, transparent, and customer-oriented management.
The decision to combine the DEA with a Tobit model in efficiency studies arises from the need to have a broader and more precise view of the subject. The DEA allows the relative efficiency of a set of decision units to be assessed without restrictions on the functional form of the production frontier [68] as it is a non-parametric technique. However, on its own, the DEA does not allow the identification of those factors that explain the differences in efficiency between decision units. This is where the Tobit model complements the analysis. It is a regression model for limited or censored dependent variables, so Tobit allows the impact of various explanatory variables on the efficiency scores obtained in the DEA to be analyzed [69]. In the specific case of water efficiency, this means that factors such as regulation, investment in infrastructure, socioeconomic characteristics, and climatic conditions that influence the performance of water companies can be identified [70]. DEA-Tobit therefore presents a robust methodology through which efficiency and its determinants can be analyzed, thereby leading to a more complete understanding of the phenomenon and more precise recommendations for improving it. This study aims to provide an understanding of the very complex interactions underpinning efficiency and to equip decision making with such knowledge. It is therefore particularly designed to analyze whether geographical location has a significant influence on the efficiency of WUOs.
There is a debate about the role of geography in the efficiency of water industries. Some studies indicate that companies located in rural areas tend to be inefficient due to population dispersion and extensive distribution networks [23,61], while others argue that rurality alone is not a determining factor, but interacts with variables such as customer density and available infrastructure [46,59]. Ferro et al. [51] and Zschille and Walter [71] emphasize that regional factors, including resource availability, socioeconomics, and ownership structure, affect efficiency. However, there is no clear link between region and efficiency, according to Peda et al. [72]. This interrelation is complex and requires a multifactorial analysis, according to the particularities of each context [19,73].
Most research on water efficiency in industry has opened some gaps in terms of research on how the interaction between region and demand-side management influences performance. Although there have been studies on the effect of population density [46,47,59,61,63] and water availability [61], only a few have explored how demand-side management strategies such as tariffs [74], public education [34], and saving technologies [6] interact with regional specificities. With this in mind, a study is proposed that combines DEA with a quantitative approach and examines the impact of DEA on various microregions to analyze their strategies. Studies such as Suárez-Varela et al. [75], Molinos-Senante and Sala-Garrido [76], Ferro et al. [51], and Zschille and Walter [71] have highlighted the need to analyze this interaction between regional factors and demand management.
Studies combining DEA and Tobit models provide a more comprehensive analysis of water use efficiency. While DEA identifies efficient and inefficient units [21,46,56,57], Tobit models analyze which factors lead to inefficiency [21,60]. This combination also allows for the study of relationships such as regulation, ownership, and management. Simar and Wilson [21] applied this approach to the study of efficiency in water services and found ownership and organizational structure to be key. Renzetti and Dupont [60] applied it to the analysis of municipal water agencies and included environmental factors. Together, it is a powerful combination that provides analysis to measure inefficiency and directs the identification of its determinants.
The Tobit model: It is useful for investigating censored or limited dependent variables. It has been used quite successfully along with DEA to identify the different factors affecting water use efficiency. Integration of both techniques can facilitate the measurement of efficiency and an investigation into how regulation, ownership, and management influence the level of efficiency across firms. Chakraborty et al. [77] in education and Rangan et al. [78] in the banking sector reveal its usefulness. The Tobit model along with DEA provides a very strong argument for efficiency analysis in the water sector.
3. Methodology
To analyze water efficiency, a two-phase methodological scheme is suggested, first using DEA to obtain efficiency scores for each company [21,56,57], comparing it with best practices [57,58], then detecting potential input reductions [58,60]. The approach is supported by studies such as those by Charnes et al. [56] and Ferreira da Cruz et al. [79]. Second, a Tobit model is used to study the impact of uncontrollable factors on inefficiencies [21,60], such as regulations, population density, and water availability. Maddala [80] describes the combination of DEA and Tobit, which provides a deeper understanding of the determinants of efficiency and helps identify gaps in this area and formulate more effective policies.
This is a DEA model in which inputs seek to minimize resources, even to produce a specific quantity of products [17]. In the study of water, this will be the evaluation of how resource inputs such as water, energy, and capital can be reduced in companies while maintaining the level of services [63,81]. The efficient frontier is the one that represents those companies that cause production maximization from the lowest input [21,56,57] that also function as a ‘reference point’. Inefficient companies will be projected on this frontier to identify possible reductions [58,60] and show how much reduction of resources they would have if they had produced at the same level of efficiency as the best. Studies such as Ferreira da Cruz et al. [79] and Charnes et al. [56] have validated this approach. Therefore, the input-oriented treatment of DEA theory studies would guide water utilities towards optimization, cost reduction, and improved sustainability of their operations [64,82].
The choice of an input-oriented DEA model is concerned with assessing the efficiency of public utilities, especially when cost reductions and optimal use of resources must be achieved without affecting the quality of services provided. This model can identify best practices in the management of inputs [17], such as water, energy, and capital [63,81], to achieve a certain level of service. Faraia et al. [83] advocate for the same model. In water utilities, efficiency, sustainability [82], cost reduction [63,84], and supply optimization [2] are crucial. The input-oriented DEA model identifies opportunities for improvement [58,60] with service levels being maintained [85]. Furthermore, by comparing companies [19,32], it encourages learning and the adoption of more efficient strategies [59,60]. Therefore, this model is promising with respect to improving efficiency and sustainability, ensuring optimal use of resources without compromising service.
The DEA of this study to determine efficiency among water companies has considered as inputs EmplTotal (number of employees) [86,87] and CostoTotal (total costs) [28,63], reflecting human and financial resources (See Table 1). As outputs, there are VolProd (production volume) [28,84] and PoblAtend (population served) [31]. It is assumed that a greater number of employees and costs are related to greater production and attention. However, efficiency is maximizing production with minimum resources [21,56,57]. At this stage, the DEA would only be responsible for identifying efficient and inefficient companies for decision making.

Table 1.
A list of input and output variables of the DEA study.
In an environment that demands efficiency and transparency in public services, tools such as DEA are essential to assess performance and improve management functions. DEA offers a comparison between several units in terms of their relative efficiency [56,57], presents an objective picture of the company’s performance [19,32], and identifies best practices [59,60]. By including multiple inputs and outputs, DEA offers a more comprehensive assessment than traditional methods [58]. Charnes et al. [56] and Carvalho and Marques [5] prove the effectiveness of DEA in assessing efficiency. Furthermore, by considering the particularities of each company [21,60], the DEA promotes equity in comparisons, thus avoiding bias [19,20]. Through the DEA, efficient and transparent management of public services is achieved, promoting continuous improvement.
CRS and VRS models are used in DEA for efficiency evaluation. CRS (Constant Returns to Scale) stands for constant return to scale [56]. VRS (Variable Returns to Scale) indicates that the returns are variable [57]. The selection of requirements is made based on whether the increase in inputs leads to an equivalent increase in outputs or not.
According to Charnes et al. [56], the input-oriented CRS model within data envelopment analysis is recognized as a robust framework for assessing the efficiency of data measurement units. The model minimizes the inputs required to produce a predetermined level of output, which lends itself particularly well to measuring efficiency based on given quantities of resources generated in the outputs. Input reduction especially benefits organizations that focus on optimizing resources and improving their performance in terms of productivity.
Mathematical Model
In this context, we consider n Decision-Making Unit(s) (DMUs), each with m inputs and s outputs. We define:
- : quantity of input i used by DMU j (where i varies from 1 to m and j to 1 to n).
- : quantity of product r produced by DMU j (where r varies from 1 to 1).
The objective is to evaluate the efficiency of a specific DMU, say DMU k. Efficiency is measured by minimizing the total amount of inputs used, given a desired level of output.
The input-oriented CRS model can be expressed as a linear programming problem that seeks to minimize the amount of inputs used by the DMU k, subject to the constraint that at least the output levels of the outputs must be achieved. This is formulated as follows:
Using the CRS input-DEA model, the efficiency of a DMU is analyzed using the θk criterion. The value of θk is set equal to 1 so that it is considered efficient by the DMU, that is, with the minimum amount of inputs to produce it. If θk were greater than 1, the DMU would be inefficient and could reduce the use of inputs. Additionally, in the model, the relative importance of each input (vi) is determined to minimize its use in production.
On the other hand, the VRS Model in DEA, according to Banker [57], evaluates efficiency on the basis that the relationship between inputs and products, according to the size of each DMU, varies with the scale of operation. This allows us to observe how the quantity of inputs and their volume influences efficiency itself. The input-oriented VRS model specifies the minimization of inputs given the products obtained, and thus performs a more precise evaluation in reference to DMUs of different scales. The objective function is expressed as
where xij represents the inputs used by DMU j, yrj are the products obtained, vi are the weights assigned to the inputs, and ur are the weights assigned to the products.
To ensure the validity of the evaluation, constraints are imposed to ensure that the level of inputs used by DMU j is not lower than that of the other DMUs in the set. This can be expressed as follows:
where J is the set of all DMUs.
To incorporate the concept of variable returns to scale, an additional restriction is imposed that allows the sum of the weights to be less than or equal to one:
This restriction allows the efficiency frontier to be properly adjusted to the operating scale of each DMU, given that not all DMUs operate under fully optimized conditions with respect to their inputs.
After the DEA, the Tobit model in the second stage will include the variable “region” [70] in order to analyze whether the geographic location (microregions: the selected WUOs, which will be part of the analysis, belong to the Central, Center-West, Northeast, Northwest, and South-Southeast regions) has an effect on the efficiency scores of the WUOs, thus completing the DEA and allowing a greater understanding of whether there are regional disparities in performance. Smithson and Merkle [92] explain that the Tobit model is used to analyze censored variables, assuming that the dependent variable follows a normal distribution. It is expressed as
where is the latent inefficiency variable for WOU i, xi is a vector of explanatory variable (including microregion dummies), β is a vector of coefficients reflecting the impact of xi on latent inefficiency, and is the normally distributed error, assumed normally distributed with mean zero and standard deviation σ (variance σ2) [93]. Censoring is defined based on the observed inefficiency , bounded below by zero:
The parameters of the model (β and σ) are estimated using Maximum Likelihood Estimation (MLE), which enables one to make inferences regarding the relationships between the explanatory variables and latent inefficiency. In fact, the estimation procedure provides estimates of the coefficient vector β, which contains a constant term (or intercept), which refers to the level of latent inefficiency when all explanatory variables are held at their reference level. In parallel, MLE estimates the standard deviation σ of the error term, which expresses the magnitude of the residual variation. The usual outputs from statistics software such as the one used in this analysis, namely RStudio (4.5.0), report this estimate for the constant term in the β vector as ‘(Intercept):1’. The parameter related to the dispersion of the error term, usually the estimate of the natural logarithm of the standard deviation (ln(σ)), is frequently reported either as ‘(Intercept):2’ or simply as a ‘Scale’ parameter [93]. With these insights, one is now in a position to interpret the Tobit regression results which will follow later.
We resort to the Tobit model because DEA-based scores are inherently limited and thus ordinary least square regression would be unsuitable and might produce biased outputs [21]. Specifically, the dependent observed variable we use in the Tobit models for each WUO is the technical inefficiency score, calculated as one minus the efficiency score obtained from DEA under either CRS or VRS. This measure of inefficiency, by definition, cannot be lower than zero, being one for completely efficient units. The Tobit model postulates the existence of an underlying and unobservable latent variable of inefficiency that represents an underlying tendency towards inefficiency, linearly related to the explanatory variables (including the microregion categories in Table 2) and one normally distributed random error component. The link between the observed inefficiency and this latent propensity is established by a left-censoring mechanism at zero: if the latent propensity to inefficiency is positive, the observed inefficiency takes that value; but if the latent propensity is zero or negative, the observed inefficiency is recorded as zero. This structure is essential since it guarantees that the model respects the natural lower bound of the inefficiency measure [80]. By estimating the model by Maximum Likelihood, we can critically evaluate how geographic factors affect the observed inefficiency, a robust and validated methodological approach in more recent studies on performance determinants in the water sector [70].
Table 2.
Definition and categorization of the “Microregions” variable.
Investigations of the determinants of efficiency scores derived from DEA are conducted through a Tobit model in a second stage. This is a quite important methodological choice since the DEA efficiency scores are inherently restricted (mostly between zero and one), and thus, the usual regression techniques such as Ordinary Least Squares would yield biased results [21]. The Tobit model has been specifically devised to handle this “censorship” in the data by assuming some latent efficiency and also considering that the observation has a bound on it (that is, it cannot be more than one), which allows one to obtain more reliable estimates of how different variables come in to play [80].
The Tobit model is here applied for analyzing whether location, captured by the categorical variable “Microregions” (Table 2), influences significantly the efficiency of WUOs in Mexico. Using Maximum Likelihood Estimation, the model quantifies the impact of these “microregions” in conjunction with other factors, taking due consideration of the limited nature of the efficiency score. Such a two-step approach has become a common practice for accounting for contextual variables and further understanding performance determinants within the water sector, rather than just measuring relative efficiency [94].
Table 2 defines the independent variable “Microregions”, as used in the Tobit analysis directly according to the classification shown in the image data. Grouping the WUOs studied into these five particular regions allows the model to study if, and to what extent, general regional factors of this very scheme influence technical efficiency levels in Mexico. Numerical codes thereby assigned allow for the regression model to include this categorical variable.
Finally, this study was developed with information from the Program of Management Indicators of Operating Agencies (PIGOO) available on the official portal of the Mexican Institute of Water Technology (http://www.pigoo.gob.mx/) (accessed on 12 October 2024), which depends on the National Water Commission (CONAGUA) for the year 2020. The technical efficiency analysis was carried out using the DEA methodology with the DEAP software version 2.1. In addition, the Tobit model analysis was carried out with RStudio (4.5.0), thus guaranteeing a robust and adequate statistical treatment of the analyzed data.
4. Results
Table 3 shows the results of the descriptive statistics for the WUOs, which reflect a fairly high variability between the variables considered, so the differences in operation and capacities are significant. The variable EmplTotal registers a maximum of 4684 and a minimum of 127, obtaining a standard deviation of 787.06, indicating a medium dispersion between the numbers of workers among the agencies. The coefficient of variation (CV) of 1.12 (112%) reflects a marked heterogeneity in the labor structure of the agencies, which could be due to differences in size and scope in their operations. On the other hand, the variable Vprod presents an extremely wide range—from a maximum of 8,501,117,672.79 to a minimum of 52,474,136.00 with a standard deviation of 1,306,895,758.27 and a CV of 1.70 (170%). This highlights significant differences in productivity and revenue-generating capacity between agencies.
Table 3.
Results of descriptive statistics of input and output variables.
For the variable TotalCost, values range from a maximum of MXN 478,689,022.10 to a minimum of MXN 935,663.00, with a standard deviation of MXN 85,065,234.75 and a CV of 1.28 (128%). This reflects a large dispersion between operating costs, which probably originates from variations in the scale of operation, efficiency, and characteristics of the areas served. Finally, the variable PobAtend has a maximum of 4,957,280 people and a minimum value of 105,201, with an associated standard deviation of 931,248.79 and a CV of 1.36 (136%), showing differences within the population served by each agency, probably due to density and territory factors that influence the amount of population served.
In Table 4, the correlation matrix comprises the correlation coefficients of variables, which analyze the linear relationships between them. First, total employment versus total costs is correlated at a level of 0.95, which represents a highly positive linear relationship. This means that, in general, the increase in the total number of employees is related to higher expenditures incurred on operating costs.
Table 4.
Analysis of correlation coefficients of variables.
EmplTotal correlates with Vprod at a coefficient of 0.93, again suggesting a strong positive linear correlation. From the above correlations, it can be seen that higher staff strength tends to be associated with higher outputs measured as value, reflecting the value placed on human resources to achieve production capability.
On the other hand, EmplTotal and PobAtend represent a correlation of 0.95, so this indicates a very substantial and strong positive linear correlation. This indicates that cities or entities with a larger number of employees tend to serve larger populations, which is indicative of a possible larger operational scale as well.
For example, the correlation between CostTotal and Vprod is 0.92, indicating a strong association. However, this does not establish causality between the variables. This would mean that if total costs were to increase, the value of output would follow suit, probably due to the cost factor of the inputs and materials that the stakeholders have to produce.
CostTotal and PobAtend have a correlation of 0.91, indicating a strong positive linear relationship, but not as strong as some other combinations. This suggests that costs have generally increased with a population being served, but the relationship is not as close as in other cases. Between Vprod and PobAtend, the correlation is 0.96, the highest.
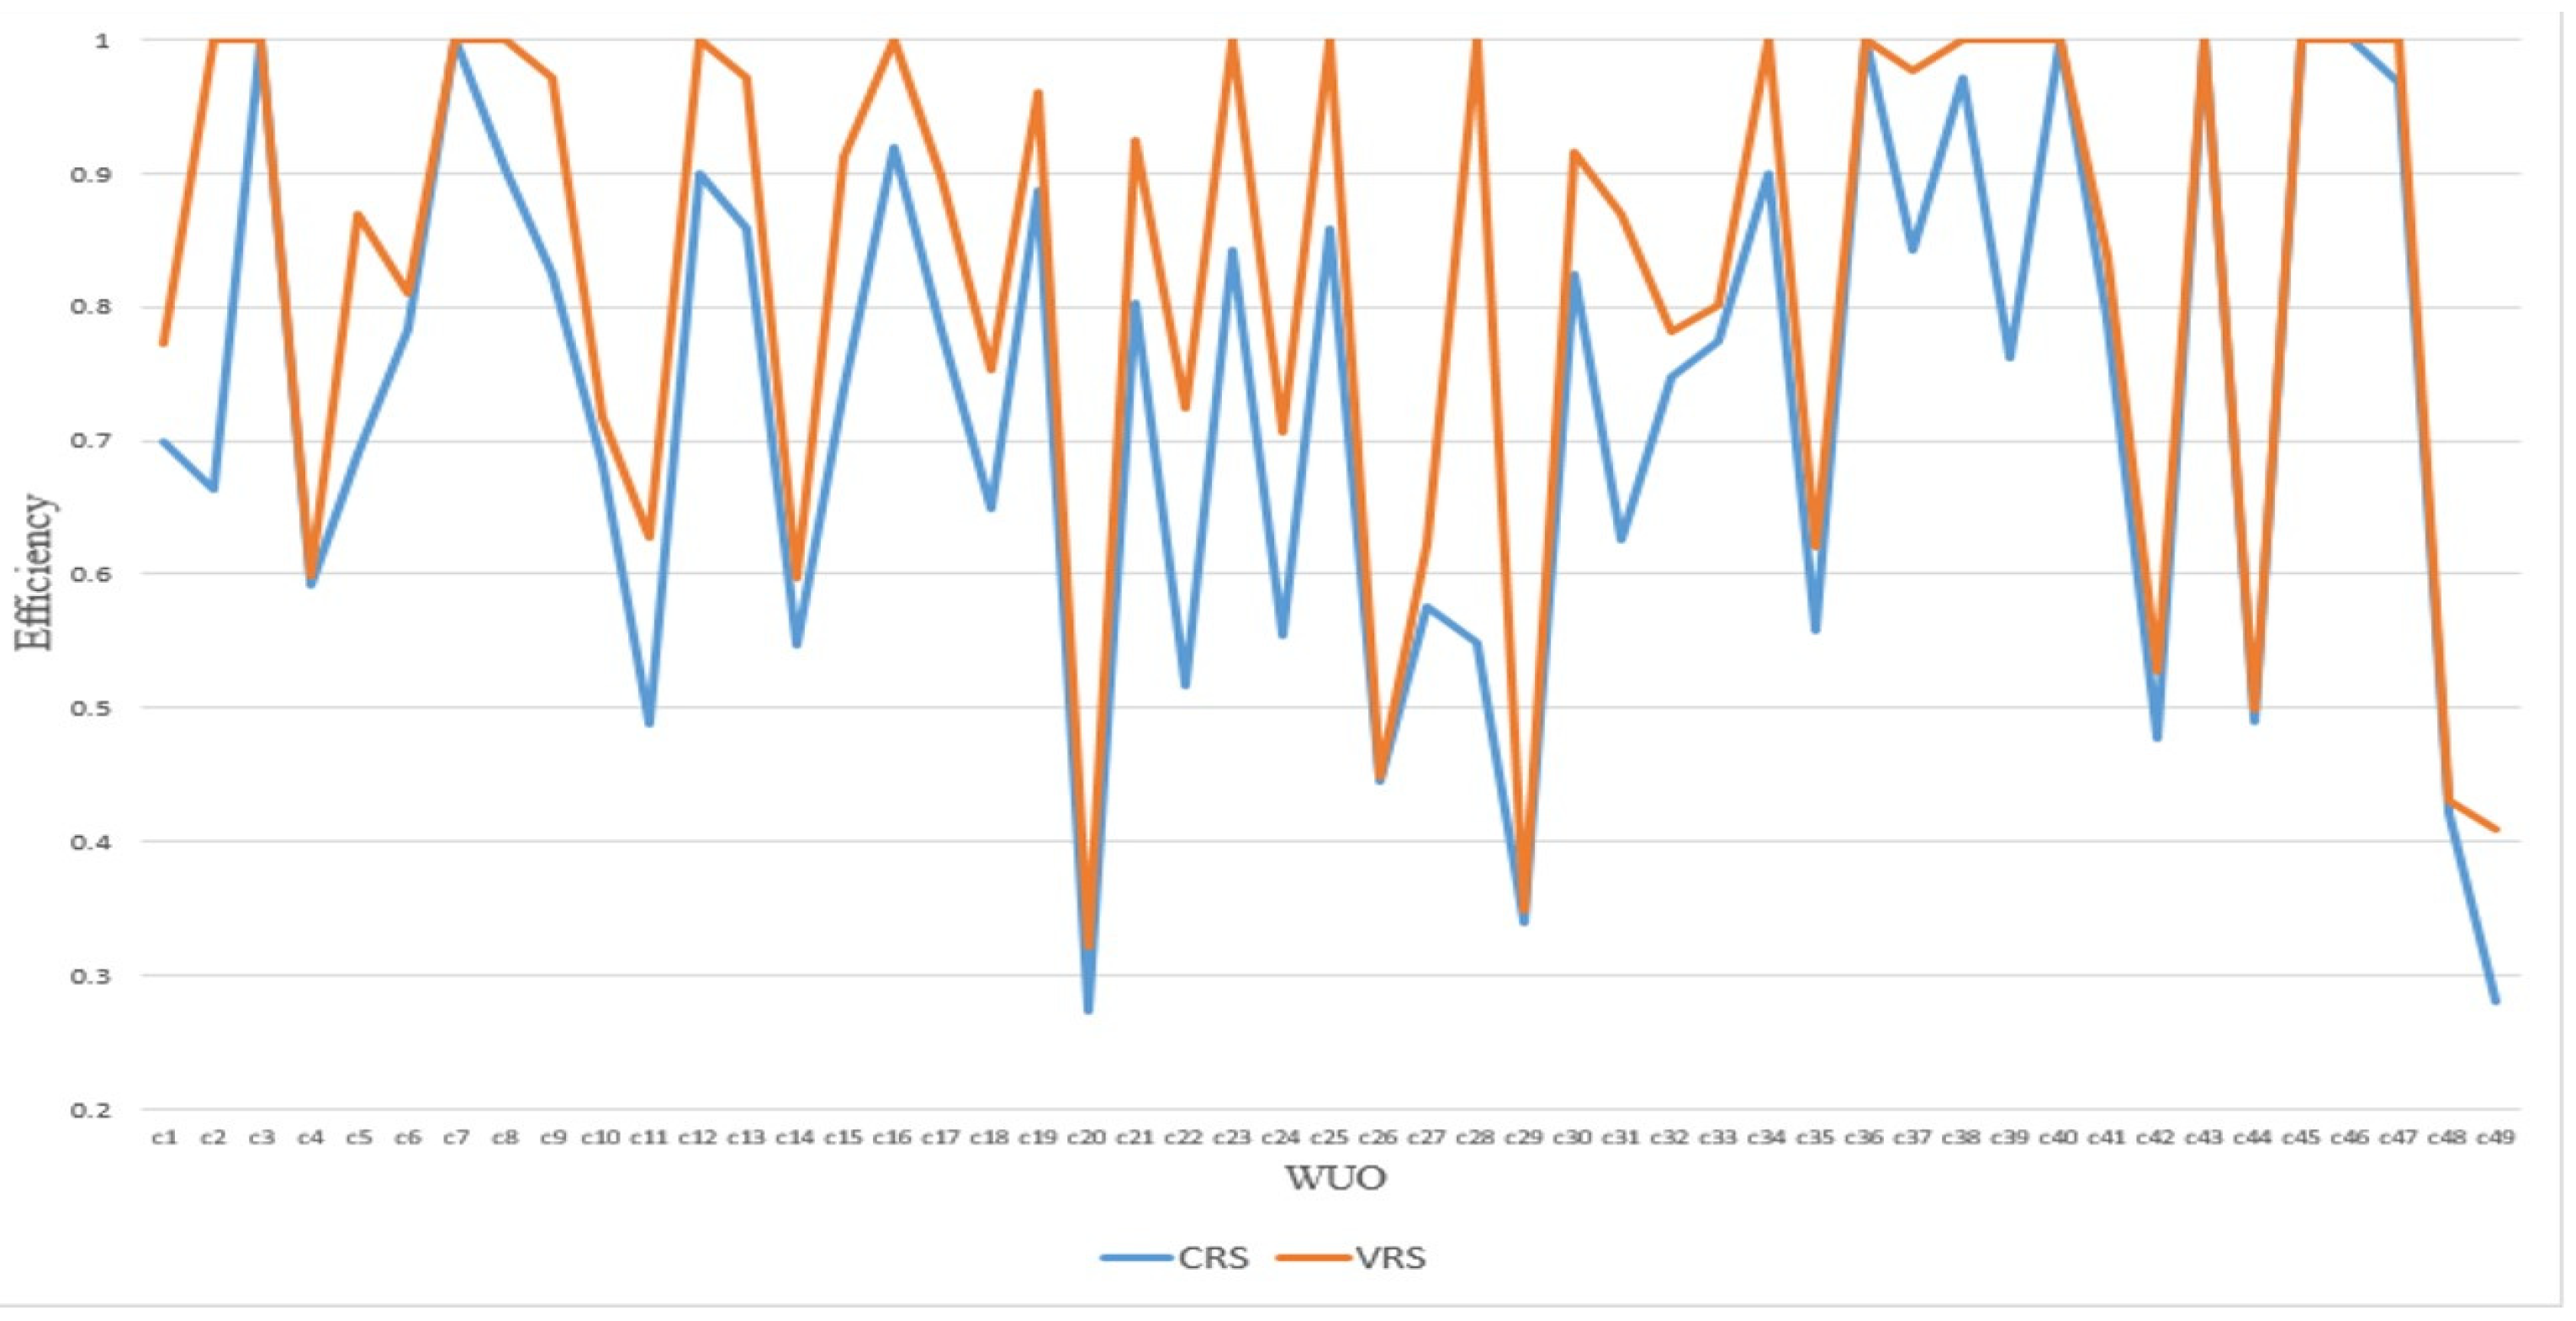
In Figure 1, the DEA shows an average efficiency of 0.73 under CRS and 0.82 under VRS. This means that, on average, cities could reduce their inputs by 27% (under CRS) or 18% (under VRS) without affecting their level of output.
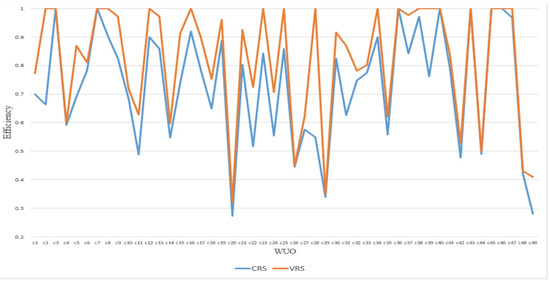
Figure 1.
Relative efficiency by DEA of the WUO in 2020. Source: prepared by the authors using data from PIGOO-CONAGUA.
The cities with the lowest efficiencies (Huixquilucan, Zihuatanejo, Naucalpan, Zacatecas, and Matamoros) exhibit substantial potential for improvement. Conversely, seven cities are efficient under CRS and 18 under VRS, making them exemplary cases.
Optimizing resource management primarily requires cities, especially those lagging behind in efficiency, to measure inefficiency in various areas, learn from and adopt best practices, optimize their resource allocations, reduce waste, and improve technology and staff training.
In order to better understand the differences in terms of efficiency, it would be possible to complement the DEA with a Tobit model, because the DEA alone does not consider external factors that may influence the efficiency of the WUOs, adding the geographical location as an independent variable. This will then allow taking into account the external factors that determine efficiency and also understanding regional differences, thus improving the accuracy of the analysis and, consequently, the decisions that are taken.
A first Tobit analysis was performed on the efficiency data from the DEA-CRS analysis in 49 WUOs and “microregions” was used to denote geography. The results suggest that this variable has no statistically significant effect on efficiency (p-value = 0.814). This means that geography, as interpreted here, does not account for the differences in efficiency. The constant coefficients of the model, 0.731 and −1.466, are statistically significant (p-value < 2 × 10⁻¹⁶), and no reliability problems in the estimates, such as the Hauck–Donner effect, were detected.
Despite these observations, the model has very low explanatory power with an R2 of only 0.003 and a correlation of 0.055 between the fitted and observed values. “Microregions” are not a significant factor in explaining service delivery efficiency in the cities studied; greater explanatory power could come from the inclusion of additional variables.
A second Tobit analysis was performed with the efficiency data from the DEA-VRS analysis in 49 WUOs and the variable microregions was used to denote geography. This analysis reveals that this variable has no statistically significant influence on efficiency (p-value = 0.794). In other words, according to the requested representation, the region does not explain the differences in efficiency between the cities considered.
Among the key results of the model, the coefficients for the constant “(Intercept):1” are at 0.871 and at −1.215 for “(Intercept):2”; both are highly significant with a p-value < 2 × 10⁻¹⁶. The log-likelihood of the model is −21.2935 with 95 degrees of freedom and no Hauck–Donner effect was found, supporting the reliability of the estimates. The explanatory capacity of the model, however, is small, as evidenced by the low coefficient of determination (R2 = 0.002) and only a correlation of 0.045 between the fitted and observed values under the VRS model. In other words, the analysis suggests that “Microregions” are not a significant factor in terms of efficiency in public service provision in the cities focused on.
Table 5 contains the results of Tobit model estimations that seek to explain the technical inefficiency (1—DEA efficiency score) of 49 Mexican OUs in 2020, based on the scores obtained with both CRS and VRS. The dependent variable (technical inefficiency) is left-censored below zero in both models. The main objective was to evaluate the effect of geographic location using dummy variables for five microregions, considering the “Central” category as the reference base.
Table 5.
Results of the Tobit model estimation for determinants of the technical inefficiency of WUOs.
Key results suggest that geographic location, within these broad microregions, is not a statistically significant determinant of differences in inefficiency. This is confirmed not only by the joint significance test for the group of microregion variables (Wald test, if computed), but also by examining the individual coefficients presented in Table 5: none of these particular microregions (Center-West, Northeast, Northwest, South-Southeast) show a statistically significant difference in their respective levels of latent inefficiency with respect to the reference Central region (all p-values > 0.10), in both the CRS and VRS models.
On the other hand, the structural parameters of the Tobit model will be truly significant. The constant, which indicates the base level of estimated latent inefficiency for the central region, is statistically significant in both equations (p < 0.001 in CRS, p < 0.10 in VRS). Very similarly, the scale parameter (ln(Sigma)), which captures unexplained variability, is always highly significant in both cases (p < 0.001).
These findings have virtually no explanatory power for the variations in technical inefficiency observed across the OUs studied. They suggest that other factors, possibly related to management, investment, operational scale, or other more site-specific characteristics omitted from the model, are likely much more relevant in explaining such performance.
5. Discussion
This DEA-Tobit analysis assessed the water management efficiency of 49 Mexican water utilities, analyzing employment, costs, production volume, and population served at the water utility level. The DEA results indicated average efficiencies of 0.73 (CRS) and 0.82 (VRS), which were consistent with previous studies but still show potential for improvement. Aguascalientes, Celaya, and Saltillo were identified as efficient water utilities, while Huixquilucan, Zihuatanejo, and Naucalpan were identified as having potential optimization possibilities, among others.
According to Tobit analysis, geographic location does not affect efficiency. We take this opportunity to acknowledge the relevance of applying regional factors such as resource availability, socioeconomics, and climatic conditions; these factors could have an effect on the efficiency of WUOs.
Some limitations of this study, such as the selection of variables and the possible omission of other important factors such as water quality, customer satisfaction, and demand management, deserve to be pointed out. Although digitalization and new technologies are changing the way water is managed, the existing literature largely fails to address their effect on the efficiency of water utilities. This calls for research into how the adoption of information and communication technologies (ICTs), remote sensing, data analytics, and other technologies can lead to more efficient management of water resources, with cost reduction and improved service delivery.
The literature on water efficiency has mainly focused on factors such as regulation, ownership, operations management, and environmental variables. However, climate change and increasing uncertainty about the availability of water resources pose new challenges in water management [94]. There is a need to investigate how uncertainty and climate change affect the efficiency of WOUs and the means by which water utilities can adapt to these challenges to ensure sustainability.
While the result is valid, it would be worth investigating the possible reasons for this lack of significance. The lack of significance of “microregions” in the Tobit model, which indicates that geographic location does not affect the efficiency of WUOs, may be the result of several factors. First, efficiency may be more closely related to management, investment, water quality, and consumer satisfaction than to region [95]. Second, the variable “Microregions” used in this analysis represents broad geographic categories. Its lack of granularity may obscure finer regional differences such as socioeconomic conditions or infrastructure levels [95]. Third, heterogeneity between microregions can blur the regional effect [9,27].
This article therefore contributes to understanding the efficiency of water management in Mexico, showing the need to optimize resources and take into account contextual factors. Future research should examine the determinants of efficiency in the sector to contribute to improving the management of this vital resource.
6. Conclusions
The DEA assessed the water management efficiency of 49 water utility organizations in Mexico, showing significant potential for improvement. Cities such as Aguascalientes, Celaya, and Saltillo were identified as performing efficiently, but could be examples of best practices for those with greater room for improvement, such as Huixquilucan, Zihuatanejo, and Naucalpan.
The Tobit model did not show a significant effect of geographic location on efficiency; however, this research provided an avenue for further studies that delved deeper into regional-specific factors such as water availability, population density, and climatic conditions on WUO performance.
The evidence from the Tobit model reinforces that the strategies to improve performance must go beyond just the input optimization at the managerial internal level but would also require investment in infrastructure besides considering the economies/diseconomies of scale and density and an approach to the regional and spatial conditions that limit the whole sector efficiency.
It is very important to highlight the importance of this type of study in decision making in the water sector in Mexico. A clear identification of the areas where there are inefficiencies and the factors that affect performance could help WUOs to optimize resource management, improve service quality, and contribute to environmental sustainability.
The inherent timeliness limitations of this study may affect the interpretation of the results and outline directions for future research. First, while the variables selected for the DEA model are based on existing data and the past literature, the design inevitably excludes potentially influential factors such as water and service quality, the condition of the grid infrastructure (related to physical losses and energy costs), the adoption of specific technologies, or customer satisfaction indicators, all of which could have improved the measurement of technical efficiency [95]. The analysis of determinants using the Tobit model is limited by the coarse granularity of the “Microregions” variable, which likely erased considerable heterogeneities and effects of any more localized environmental or socioeconomic variables due to the broad geographical categories it presents [95]. Third, because the data are cross-sectional and correspond only to the year 2020, dynamic analysis on efficiency and its determinants or on the effects of temporal trends such as climate change or digitalization in the sector is precluded [95]. Finally, while the Tobit-DEA approach is quite robust and widely used in the field, the approach adopted in this study is limited exclusively to this methodology and does not include complementary approaches such as Stochastic Frontier Analysis (SFA), which would allow for explicit modeling of statistical noise. These limitations warrant caution when generalizing the findings and initiating future research with more detailed longitudinal data that incorporate a broader nexus of operational, quality, and contextual variables.
Future studies should include additional variables such as water quality, customer satisfaction, and demand management to gain a more complete understanding of water management efficiency; further exploration of the application of complementary techniques such as stochastic frontier analysis for more robust analysis is also recommended.
In fact, this study advances the understanding of the efficiency of the water sector in Mexico and contributes to laying the foundations for future research aimed at improving this key service.
Author Contributions
G.N.L.: Writing—original draft, Methodology; Conceptualization, Administration; J.A.S.R.: Writing—review and editing; R.d.C.L.B.: Writing—original draft, Methodology; L.A.C.R.: Conceptualization and Methodology. All authors have read and agreed to the published version of the manuscript.
Funding
This research received no external funding.
Institutional Review Board Statement
Not applicable.
Informed Consent Statement
Not applicable.
Data Availability Statement
The original contributions presented in this study are included in this link: https://drive.google.com/drive/folders/1mF8sGhLyKjTlaW6j4THqFXgsarGXO_dj.
Conflicts of Interest
The authors declare that they do not have any conflicts of interest.
Abbreviations
The following abbreviations are used in this manuscript:
| WUOs | Water Utility Organizations |
| DEA | Data Envelopment Analysis |
| CRS | Constant Returns to Scale |
| VRS | Variable Returns to Scale |
| DMUs | Decision-Making Unit(s) |
| CV | Coefficient of variation |
| SD | Standard Deviation |
| PoblAtend | Population served |
| EmplTotal | Number of employees |
| CostoTotal | Total costs |
| VolProd | Total volume of drinking water |
| PIGOO | Program of Management Indicators of Operating Agencies |
| CONAGUA | National Water Commission |
References
- Marques, R.C.; Berg, S.; Yane, S. Nonparametric benchmarking of Japanese water utilities: Institutional and environmental factors affecting efficiency. J. Water Resour. Plan. Manag. 2014, 140, 562–571. [Google Scholar] [CrossRef]
- Cetrulo, T.B.; Marques, R.C.; Malheiros, T.F. An analytical review of the efficiency of water and sanitation utilities in developing countries. Water Res. 2019, 161, 372–380. [Google Scholar] [CrossRef]
- Gidion, D.K.; Hong, J.; Adams, M.Z.; Khoveyni, M. Network DEA models for assessing urban water utility efficiency. Util. Policy 2019, 57, 48–58. [Google Scholar] [CrossRef]
- Golder, P.N.; Mitra, D.; Moorman, C. What is quality? An integrative framework of processes and states. J. Mark. 2012, 76, 1–23. [Google Scholar] [CrossRef]
- Carvalho, P.; Marques, R.C. The influence of the operational environment on the efficiency of water utilities. J. Environ. Manag. 2011, 92, 2698–2707. [Google Scholar] [CrossRef] [PubMed]
- Kirkpatrick, C.; Parker, D.; Zhang, Y.F. An empirical analysis of state and private-sector provision of water services in Africa. World Bank Econ. Rev. 2006, 20, 143–163. [Google Scholar] [CrossRef]
- Calabrese, A. Service productivity and service quality: A necessary trade-off? Int. J. Prod. Econ. 2012, 135, 800–812. [Google Scholar] [CrossRef]
- Feng, Y.; Zhu, Q.; Lai, K.H. Corporate social responsibility for supply chain management: A literature review and bibliometric analysis. J. Clean. Prod. 2017, 158, 296–307. [Google Scholar] [CrossRef]
- Molinos-Senante, M.; Maziotis, A. Drivers of productivity change in water companies: An empirical approach for England and Wales. Int. J. Water Resour. Dev. 2020, 36, 972–991. [Google Scholar] [CrossRef]
- Amaral, A.L.; Martins, R.; Dias, L.C. Drivers of water utilities’ operational performance–An analysis from the Portuguese case. J. Clean. Prod. 2023, 389, 136004. [Google Scholar] [CrossRef]
- Sharif, O.; Hasan, M.; Kurniasari, F.; Hermawan, A.; Gunardi, A. Productivity and efficiency analysis using DEA: Evidence from financial companies listed in bursa Malaysia. Management Sci. Lett. 2019, 9, 301–312. [Google Scholar] [CrossRef]
- Coelho, B.; Andrade-Campos, A. Efficiency achievement in water supply systems—A review. Renew. Sustain. Energy Rev. 2014, 30, 59–84. [Google Scholar] [CrossRef]
- Mann, P.C.; Mikesell, J.L. Ownership and water system operation 1. JAWRA J. Am. Water Resour. Assoc. 1976, 12, 995–1004. [Google Scholar] [CrossRef]
- Moher, D.; Cook, D.J.; Eastwood, S.; Olkin, I.; Rennie, D.; Stroup, D.F. Improving the quality of reports of meta-analyses of randomised controlled trials: The QUOROM statement. Lancet 1999, 354, 1896–1900. [Google Scholar] [CrossRef] [PubMed]
- Molinos-Senante, M.; Hernández-Sancho, F.; Sala-Garrido, R. Economic feasibility study for wastewater treatment: A cost–benefit analysis. Sci. Total Environ. 2010, 408, 4396–4402. [Google Scholar] [CrossRef]
- Ferro, G.; Romero, C.A.; Covelli, M.P. Regulation and performance: A production frontier estimate for the Latin American water and sanitation sector. Util. Policy 2011, 19, 211–217. [Google Scholar] [CrossRef]
- Romano, G.; Guerrini, A. Measuring and comparing the efficiency of water utility companies: A data envelopment analysis approach. Util. Policy 2011, 19, 202–209. [Google Scholar] [CrossRef]
- Grossman, P.J.; Mavros, P.; Wassmer, R.W. Public sector technical inefficiency in large US cities. J. Urban Econ. 1999, 46, 278–299. [Google Scholar] [CrossRef]
- De Witte, K.; Marques, R.C. Designing performance incentives, an international benchmark study in the water sector. Cent. Eur. J. Oper. Res. 2010, 18, 189–220. [Google Scholar] [CrossRef]
- Byrnes, J.; Crase, L.; Dollery, B.; Villano, R. The relative economic efficiency of urban water utilities in regional New South Wales and Victoria. Resour. Energy Econ. 2010, 32, 439–455. [Google Scholar] [CrossRef]
- Simar, L.; Wilson, P.W. Estimation and inference in two-stage, semi-parametric models of production processes. J. Econom. 2007, 136, 31–64. [Google Scholar] [CrossRef]
- Camanho, A.S.; Silva, M.C.; Piran, F.S.; Lacerda, D.P. A literature review of economic efficiency assessments using Data Envelopment Analysis. Eur. J. Oper. Res. 2024, 315, 1–18. [Google Scholar] [CrossRef]
- Bottasso, A.; Conti, M. Scale economies, technology and technical change in the water industry: Evidence from the English water only sector. Reg. Sci. Urban Econ. 2009, 39, 138–147. [Google Scholar] [CrossRef]
- Daraio, C.; Simar, L. Introducing environmental variables in nonparametric frontier models: A probabilistic approach. J. Product. Análisis 2005, 24, 93–121. [Google Scholar] [CrossRef]
- Sala-Garrido, R.; Mocholí-Arce, M.; Molinos-Senante, M.; Maziotis, A. Comparing operational, environmental and eco-efficiency of water companies in England and Wales. Energies 2021, 14, 3635. [Google Scholar] [CrossRef]
- Cheng, L.; Song, S.; Xie, Y. Evaluation of water resources utilization efficiency in Guangdong Province based on the DEA–Malmquist model. Front. Environ. Sci. 2022, 10, 819693. [Google Scholar] [CrossRef]
- Tourinho, M.; Barbosa, F.; Santos, P.R.; Pinto, F.T.; Camanho, A.S. Productivity change in Brazilian water services: A benchmarking study of national and regional trends. Socio-Econ. Plan. Sci. 2023, 86, 101491. [Google Scholar] [CrossRef]
- Estache, A.; Kouassi, E. Sector Organization, Governance, and the Inefficiency of African Water Utilities; World Bank Policy Research Working Paper 2890; World Bank: Washington, DC, USA, 2002; 21p, Available online: https://papers.ssrn.com/sol3/papers.cfm?abstract_id=636253 (accessed on 10 November 2024).
- Walter, M.; Cullmann, A.; von Hirschhausen, C.; Wand, R.; Zschille, M. Quo vadis efficiency analysis of water distribution? A comparative literature review. Util. Policy 2009, 17, 225–232. [Google Scholar] [CrossRef]
- Levidow, L.; Lindgaard-Jørgensen, P.; Nilsson, Å.; Skenhall, S.A.; Assimacopoulos, D. Process eco-innovation: Assessing meso-level eco-efficiency in industrial water-service systems. J. Clean. Prod. 2016, 110, 54–65. [Google Scholar] [CrossRef]
- Tupper, H.C.; Resende, M. Efficiency and regulatory issues in the Brazilian water and sewage sector: An empirical study. Util. Policy 2004, 12, 29–40. [Google Scholar] [CrossRef]
- Färe, R.; Grosskopf, S.; Norris, M.; Zhang, Z. Productivity growth, technical progress, and efficiency change in industrialized countries. Am. Econ. Rev. 1994, 84, 66–83. Available online: http://www.jstor.org/stable/2117971 (accessed on 12 November 2024).
- Meeusen, W.; van Den Broeck, J. Efficiency estimation from Cobb-Douglas production functions with composed error. Int. Econ. Rev. 1977, 18, 435–444. [Google Scholar] [CrossRef]
- Aigner, D.; Lovell, C.K.; Schmidt, P. Formulation and estimation of stochastic frontier production function models. J. Econom. 1977, 6, 21–37. [Google Scholar] [CrossRef]
- Pinto, F.S.; Simões, P.; Marques, R.C. Raising the bar: The role of governance in performance assessments. Util. Policy 2017, 49, 38–47. [Google Scholar] [CrossRef]
- Molinos-Senante, M.; Maziotis, A.; Sala-Garrido, R. Assessment of the total factor productivity change in the English and Welsh water industry: A Färe-primont productivity index approach. Water Resour. Manag. 2017, 31, 2389–2405. [Google Scholar] [CrossRef]
- Walker, N.L.; Styles, D.; Gallagher, J.; Williams, A.P. Aligning efficiency benchmarking with sustainable outcomes in the United Kingdom water sector. J. Environ. Manag. 2021, 287, 112317. [Google Scholar] [CrossRef]
- Pineda Pablos, N. Urban water management between opportunism and adaptive development. In Water in Mexico, Actors, Sectors and Paradigms for An Ecological Social Transformation; Denzin, C., Taboada, F., Pacheco-Vega, R., Eds.; Friedrich-Ebert-Stiftung: Mexico City, Mexico, 2017; pp. 171–193. Available online: http://centro.paot.org.mx/documentos/paot/libro/aguaen_mexico.pdf (accessed on 15 November 2024).
- Maziotis, A.; Sala-Garrido, R.; Mocholi-Arce, M.; Molinos-Senante, M. Cost and quality of service performance in the Chilean water industry: A comparison of stochastic approaches. Struct. Change Econ. Dyn. 2023, 67, 211–219. [Google Scholar] [CrossRef]
- García-Rubio, M.A.; González-Gómez, F.; Guardiola, J. Performance and ownership in the governance of urban water. Proc. Inst. Civ. Eng.-Munic. Eng. 2010, 163, 51–58. [Google Scholar] [CrossRef]
- Mugisha, S. Performance assessment and monitoring of water infrastructure: An empirical case study of benchmarking in Uganda. Water Policy 2007, 9, 475–491. [Google Scholar] [CrossRef]
- Villegas, A.; Molinos-Senante, M.; Maziotis, A. Impact of environmental variables on the efficiency of water companies in England and Wales: A double-bootstrap approach. Environ. Sci. Pollut. Res. 2019, 26, 31014–31025. [Google Scholar] [CrossRef]
- Molinos-Senante, M.; Maziotis, A. The impact of greenhouse gas emissions on the performance of water companies: A dynamic assessment. Environ. Sci. Pollut. Res. 2021, 28, 48284–48297. [Google Scholar] [CrossRef]
- Mocholi-Arce, M.; Sala-Garrido, R.; Molinos-Senante, M.; Maziotis, A. Performance assessment of water companies: A metafrontier approach accounting for quality of service and group heterogeneities. Socio-Econ. Plan. Sci. 2021, 74, 100948. [Google Scholar] [CrossRef]
- See, K.F. Exploring and analysing sources of technical efficiency in water supply services: Some evidence from Southeast Asian public water utilities. Water Resour. Econ. 2015, 9, 23–44. [Google Scholar] [CrossRef]
- Hana, U. Competitive advantage achievement through innovation and knowledge. J. Compet. 2013, 5, 82–96. [Google Scholar] [CrossRef]
- Pinto, F.S.; Simões, P.; Marques, R.C. Water services performance: Do operational environment and quality factors count? Urban Water J. 2017, 14, 773–781. [Google Scholar] [CrossRef]
- Filippini, M.; Hrovatin, N.; Zoric, J. Cost efficiency of Slovenian water distribution utilities: An application of stochastic frontier methods. J. Prod. Anal. 2008, 29, 169–182. [Google Scholar] [CrossRef]
- Mbuvi, D.; De Witte, K.; Perelman, S. Urban water sector performance in Africa: A step-wise bias-corrected efficiency and effectiveness analysis. Util. Policy 2012, 22, 31–40. [Google Scholar] [CrossRef]
- Molinos-Senante, M.; Villegas, A.; Maziotis, A. Are water tariffs sufficient incentives to reduce water leakages? An empirical approach for Chile. Util. Policy 2019, 61, 100971. [Google Scholar] [CrossRef]
- Ferro, G.; Lentini, E.J.; Mercadier, A.C.; Romero, C.A. Efficiency in Brazil’s water and sanitation sector and its relationship with regional provision, property and the independence of operators. Util. Policy 2014, 28, 42–51. [Google Scholar] [CrossRef]
- Rodrigues, M.; Tavares, A.F. The same deep water as you? The impact of alternative governance arrangements of water service delivery on efficiency. J. Strateg. Contract. Negot. 2017, 3, 78–101. [Google Scholar] [CrossRef]
- Nyathikala, S.A.; Jamasb, T.; Llorca, M.; Kulshrestha, M. Utility governance, incentives, and performance: Evidence from India’s urban water sector. Util. Policy 2023, 82, 101534. [Google Scholar] [CrossRef]
- Heather, A.I.J.; Bridgeman, J. Water industry asset management: A proposed service-performance model for investment. Water Environ. J. 2007, 21, 127–132. [Google Scholar] [CrossRef]
- Vilarinho, H.; D’Inverno, G.; Nóvoa, H.; Camanho, A.S. The measurement of asset management performance of water companies. Socio-Econ. Plan. Sci. 2023, 87, 101545. [Google Scholar] [CrossRef]
- Charnes, A.; Cooper, W.W.; Rhodes, E. Measuring the efficiency of decision making units. Eur. J. Oper. Res. 1978, 2, 429–444. [Google Scholar] [CrossRef]
- Banker, R.D.; Charnes, A.; Cooper, W.W. Some models for estimating technical and scale inefficiencies in data envelopment analysis. Manag. Sci. 1984, 30, 1078–1092. [Google Scholar] [CrossRef]
- Carvalho, P.; Marques, R.C.; Berg, S. A meta-regression analysis of benchmarking studies on water utilities market structure. Util. Policy 2012, 21, 40–49. [Google Scholar] [CrossRef]
- Anwandter, L. Can public sector reforms improve the efficiency of public water utilities? Environ. Dev. Econ. 2002, 7, 687–700. [Google Scholar] [CrossRef]
- Renzetti, S.; Dupont, D.P. Measuring the technical efficiency of municipal water suppliers: The role of environmental factors. Land Econ. 2009, 85, 627–636. [Google Scholar] [CrossRef]
- Saal, D.S.; Parker, D.; Weyman-Jones, T. Determining the contribution of technical change, efficiency change and scale change to productivity growth in the privatized English and Welsh water and sewerage industry: 1985–2000. J. Product. Anal. 2007, 28, 127–139. [Google Scholar] [CrossRef]
- De Witte, K.; Marques, R.C. Influential observations in frontier models, a robust non-oriented approach to the water sector. Ann. Oper. Res. 2010, 181, 377–392. [Google Scholar] [CrossRef]
- Xu, S.; Zhang, X.; Feng, L.; Yang, W. Disruption risks in supply chain management: A literature review based on bibliometric analysis. Int. J. Prod. Res. 2020, 58, 3508–3526. [Google Scholar] [CrossRef]
- Picazo-Tadeo, A.J.; Sáez-Fernández, F.J.; González-Gómez, F. Does service quality matter in measuring the performance of water utilities? Util. Policy 2008, 16, 30–38. [Google Scholar] [CrossRef]
- Marques, R.C.; Simões, P.; Pires, J.S. Performance benchmarking in utility regulation: The worldwide experience. Pol. J. Environ. Stud. 2011, 20, 125–132. Available online: https://www.pjoes.com/Performance-Benchmarking-in-Utility-Regulation-r-nthe-Worldwide-Experience,88538,0,2.html (accessed on 10 November 2024).
- Marques, R.C.; De Witte, K. Towards a benchmarking paradigm in European water utilities. Public Money Manag. 2010, 30, 42–48. [Google Scholar] [CrossRef]
- Molinos-Senante, M.; Donoso, G.; Sala-Garrido, R.; Villegas, A. Benchmarking the efficiency of the Chilean water and sewerage companies: A double-bootstrap approach. Environ. Sci. Pollut. Res. 2018, 25, 8432–8440. [Google Scholar] [CrossRef]
- Cooper, W.W.; Seiford, L.M.; Tone, K. Data Envelopment Analysis: A Comprehensive Text with Models, Applications, References and DEA-Solver Software; Springer: New York, NY, USA, 2007; Volume 2, p. 489. [Google Scholar]
- Worthington, A.C. Efficiency, Technology, and Productivity Change in Australian Urban Water Utilities; Griffith University: Brisbane, Australia, 2011. [Google Scholar] [CrossRef]
- Buendía Hernández, A.; André, F.J.; Santos-Arteaga, F.J. On the Evolution and Determinants of Water Efficiency in the Regions of Spain. Water Resour. Manag. 2024, 38, 3093–3112. [Google Scholar] [CrossRef]
- Zschille, M.; Walter, M. The performance of German water utilities: A (semi)-parametric analysis. Appl. Econ. 2012, 44, 3749–3764. [Google Scholar] [CrossRef]
- Peda, P.; Grossi, G.; Liik, M. Do ownership and size affect the performance of water utilities? Evidence from Estonian municipalities. J. Manag. Gov. 2013, 17, 237–259. [Google Scholar] [CrossRef]
- Lambert, D.K.; Dichev, D.; Raffiee, K. Ownership and sources of inefficiency in the provision of water services. Water Resour. Res. 1993, 29, 1573–1578. [Google Scholar] [CrossRef]
- Berg, S.; Lin, C. Consistency in performance rankings: The Peru water sector. Appl. Econ. 2008, 40, 793–805. [Google Scholar] [CrossRef]
- Suárez-Varela, M.; de los Ángeles García-Valiñas, M.; González-Gómez, F.; Picazo-Tadeo, A.J. Ownership and performance in water services revisited: Does private management really outperform public? Water Resour. Manag. 2017, 31, 2355–2373. [Google Scholar] [CrossRef]
- Molinos-Senante, M.; Sala-Garrido, R. The impact of privatization approaches on the productivity growth of the water industry: A case study of Chile. Environ. Sci. Policy 2015, 50, 166–179. [Google Scholar] [CrossRef]
- Chakraborty, K.; Biswas, B.; Lewis, W.C. Measurement of technical efficiency in public education: A stochastic and nonstochastic production function approach. South. Econ. J. 2001, 67, 889–905. [Google Scholar] [CrossRef]
- Rangan, N.; Grabowski, R.; Aly, H.Y.; Pasurka, C. The technical efficiency of US banks. Econ. Lett. 1988, 28, 169–175. [Google Scholar] [CrossRef]
- Ferreira da Cruz, N.; Marques, R.C.; Romano, G.; Guerrini, A. Measuring the efficiency of water utilities: A cross-national comparison between Portugal and Italy. Water Policy 2012, 14, 841–853. [Google Scholar] [CrossRef]
- Maddala, G.S. Limited-Dependent and Qualitative Variables in Econometrics; Cambridge University Press: Cambridge, UK, 1983; Volume 149. [Google Scholar]
- Deng, G.; Li, L.; Song, Y. Provincial water use efficiency measurement and factor analysis in China: Based on SBM-DEA model. Ecol. Indic. 2016, 69, 12–18. [Google Scholar] [CrossRef]
- Abbott, M.; Cohen, B. Productivity and efficiency in the water industry. Util. Policy 2009, 17, 233–244. [Google Scholar] [CrossRef]
- Faraia, R.C.D.; Moreira, T.B.S.; Souza, G.S. Public versus private water utilities: Empirical evidence for Brazilian companies. Econ. Bull. 2005, 8, 1–7. Available online: https://papers.ssrn.com/sol3/papers.cfm?abstract_id=662421 (accessed on 2 November 2024).
- Molinos-Senante, M.; Sala-Garrido, R.; Lafuente, M. The role of environmental variables on the efficiency of water and sewerage companies: A case study of Chile. Environ. Sci. Pollut. Res. 2015, 22, 10242–10253. [Google Scholar] [CrossRef]
- Lannier, A.L.; Porcher, S. Efficiency in the public and private French water utilities: Prospects for benchmarking. Appl. Econ. 2014, 46, 556–572. [Google Scholar] [CrossRef]
- De la Higuera-Molina, E.J.; Campos-Alba, C.M.; López-Pérez, G.; Zafra-Gómez, J.L. Efficiency of water service management alternatives in Spain considering environmental factors. Util. Policy 2023, 84, 101644. [Google Scholar] [CrossRef]
- García-Sánchez, I.M. Efficiency measurement in Spanish local government: The case of municipal water services. Rev. Policy Res. 2006, 23, 355–372. [Google Scholar] [CrossRef]
- Correia, T.; Marques, R.C. Performance of Portuguese water utilities: How do ownership, size, diversification and vertical integration relate to efficiency? Water Policy 2011, 13, 343–361. [Google Scholar] [CrossRef]
- Setiawan, A.R.; Gravitiani, E.; Rahardjo, M. Production cost efficiency analysis of regional water companies in eastern Indonesia. In IOP Conference Series: Earth and Environmental Science; IOP Publishing: Bristol, UK, 2021; Volume 724, p. 012012. [Google Scholar] [CrossRef]
- Anh, N.V.; Tran, H.H.T. Evaluation of performance indicators of selected water companies in Viet Nam. Vietnam. J. Sci. Technol. 2020, 58, 42–53. [Google Scholar] [CrossRef]
- Chang, J.; Li, W.; Zhou, Y.; Zhang, P.; Zhang, H. Impact of public service quality on the efficiency of the water industry: Evidence from 147 cities in China. Sustainability 2022, 14, 15160. [Google Scholar] [CrossRef]
- Smithson, M.; Merkle, E.C. Generalized Linear Models for Categorical and Continuous Limited Dependent Variables; CRC Press: Boca Raton, FL, USA, 2013. [Google Scholar]
- Kleiber, C.; Zeileis, A. Applied Econometrics with R; Springer: New York, NY, USA, 2008. [Google Scholar]
- Bennich, A.; Engwall, M.; Nilsson, D. Operating in the shadowland: Why water utilities fail to manage decaying infrastructure. Util. Policy 2023, 82, 101557. [Google Scholar] [CrossRef]
- Molinos-Senante, M.; Maziotis, A.; Sala-Garrido, R.; Mocholi-Arce, M. Assesing the influence of environmental variables on the performance of water companies: An efficiency analysis tree approach. Expert Syst. Appl. 2023, 212, 118844. [Google Scholar] [CrossRef]
Disclaimer/Publisher’s Note: The statements, opinions and data contained in all publications are solely those of the individual author(s) and contributor(s) and not of MDPI and/or the editor(s). MDPI and/or the editor(s) disclaim responsibility for any injury to people or property resulting from any ideas, methods, instructions or products referred to in the content. |
© 2025 by the authors. Licensee MDPI, Basel, Switzerland. This article is an open access article distributed under the terms and conditions of the Creative Commons Attribution (CC BY) license (https://creativecommons.org/licenses/by/4.0/).