Article

A Methodology for Identifying Critical Success Factors and Performance Measurement for Sustainable Schools

Department of Industrial Engineering, Yıldız Technical University, Istanbul 34349, Türkiye
*
Author to whom correspondence should be addressed.
Sustainability 2025, 17(10), 4497; https://doi.org/10.3390/su17104497
Submission received: 16 April 2025 / Revised: 12 May 2025 / Accepted: 13 May 2025 / Published: 15 May 2025

Abstract

:
There are conflicting findings in the literature regarding the factors that influence school success. This uncertainty complicates the effective allocation of resources. The present study aims to identify critical success factors (CSFs) for schools by incorporating the perspectives of various stakeholders and addressing this gap in the literature. Additionally, a comprehensive performance measurement model is developed to ensure the sustainability of success. A three-phase complementary methodology was employed with 330 participants, including school administrators, students, and parents, from 23 high schools in Istanbul. Fuzzy cognitive mapping (FCM) was utilized to identify critical success factors (CSFs) by calculating centrality index values. Additionally, a SWOT (Strengths, Weaknesses, Opportunities, and Threats) analysis was conducted to assess the institutional context, and a balanced scorecard (BSC) was developed for performance measurement. According to the results from FCM and SWOT analysis, the factors related to teachers, students, and school physical conditions were identified as the most critical success factors. The BSC model was employed in four high schools, yielding performance scores of 81.12 and 92.52, 67.89, 77.58, respectively. With its unique methodological approach integrating three analytical techniques, this study highlights the critical role of teacher experience, student quality, and appealing physical conditions in school success. It offers school administrators a scientifically grounded, practical performance evaluation tool. This study is significant as it establishes a foundation for monitoring large-scale investment performance in schools, encompassing Environmental, Social, and Governance (ESG) dimensions, and providing a basis for sustainability initiatives within educational institutions.

1. Introduction

Corporate success and performance are critical issues that necessitate overcoming various challenges [1]. The multidimensional nature of success complicates its definition and measurement [2]. The concept of Critical Success Factors (CSFs) was developed to address the informational needs of managers [3]. As businesses concentrate on creating customer value, educational institutions similarly face mounting pressure to generate value [4]. This pressure has prompted schools to explore strategies for achieving success.
Numerous researchers have investigated critical success factors in the field of education [5,6,7,8,9]. However, the concept of school success and its performance indicators remain ambiguous. This ambiguity may arise from the varied expectations of stakeholders. The existing literature lacks studies that thoroughly examine the differences in stakeholders’ perceptions of success.
Managing stakeholders is becoming increasingly complex due to the diversity of their characteristics—such as levels of power, interest, and influence—and the intricate nature of their interconnections. This complexity is well illustrated in the stakeholder “onion diagram” (Figure 1) [10], which emphasizes the layered structure and varying proximity of stakeholder groups to the core functions of educational institutions. While the literature has extensively addressed stakeholder identification and analysis, relatively little attention has been paid to how stakeholder characteristics relate to performance measurement systems, particularly in the context of CSFs [11]. There remains a significant gap concerning the relationship between the combination of stakeholder evaluations and their impact on CSFs and organizational performance. By incorporating a diverse set of stakeholder perspectives in the development and evaluation of CSFs, our study aims to address this gap and contribute to a more inclusive and applicable performance measurement framework in education.
In studies on school success, some researchers identified teachers and students as critical success factors [12], while others emphasized the role of teachers and school administration [13,14]. Sayın and Gelbal [12] argued that teacher competencies and student motivation directly influence success whereas Yılmaz and Celik [13] suggested that the primary determinants of success are school administrators’ leadership styles and teacher satisfaction. These conflicting results stem from methodological differences and variations in research contexts. While the teacher factor emerges as a key element in most studies, student and administrative factors are highlighted in a limited number of studies. While 15 factors affecting the success of schools were evaluated in the study by Sayın and Gelbal [12] and 30 factors were evaluated in the study by Yılmaz et al., our study expanded this scope by evaluating a total of 50 factors. In the study by Yılmaz and Celik [13], a semi-structured interview form asked open-ended questions to the participants, did not set a certain limit, and stated that they could write as many items as they wanted. This method made it difficult to consolidate and categorize the responses. In our study, since the participants selected the success factors from a specific list, the evaluation and analysis of the data could be done easily and quickly. Additionally, Sayın and Gelbal [12] asked participants questions on six different subjects in their study, which diverted attention from the core focus of the research—school success—and made it more challenging for participants to respond effectively. Our study, on the other hand, limited the number of questions to three, all of which were directly aligned with the aim of evaluating success and performance in schools. Furthermore, the study by Titrek et al. [14] was a literature review, which, while informative, did not involve the application of any model in a specific school context. It neither adapted a method to a particular sector nor employed a combination of methodologies. In contrast, our study aims to clarify these inconsistencies in the literature. Our study is noteworthy in that it is based on both literature and participant evaluation, uses a combination of several methods, and aims to measure not only critical success factors but also organizational performance. It is also distinguished by its streamlined data collection and analysis processes, and its focused research purpose and questions, which enhance the overall effectiveness and applicability of our study.
In 1979, Rockart [15] defined critical success factors as essential elements for achieving objectives. When Rockart [15] first introduced the CSF concept in the context of business strategy, the goal was to identify the most essential elements for organizational success, to meet the informational needs of managers, to monitor key activities, and to align the leadership team around shared strategic objectives. This business-oriented approach focused primarily on financial outcomes, competitive advantage, and managerial efficiency. Over time, however, the CSF approach began to be applied in the field of education, particularly as expectations grew for schools to demonstrate higher performance, financial sustainability, and alignment with their vision and mission—similar to private sector organizations. In the educational context, while the ultimate aim remains organizational success, the CSFs are adapted to emphasize stakeholder satisfaction (e.g., students and parents), academic outcomes, and institutional development, rather than profit maximization.
Previous research on CSFs has predominantly focused on the field of information technology [16] and, more recently, on the construction sector [17,18,19,20]. In contrast, studies exploring CSFs within the context of educational institutions remain limited. Existing research in education primarily concentrates on universities [2] and distance education models [9] leaving a notable gap in the literature regarding CSFs applicable to pre-university educational settings such as primary and secondary schools. This study seeks to address that gap by focusing specifically on CSFs relevant to school-level institutions.
Although CSFs are used in many industries, today, most industries identify between three and six critical success factors [21]. Identifying CSFs helps mitigate strategic risks, enhances managerial approaches, and supports continuous improvement [22]. Figure 2 illustrates the importance of critical success factors and performance evaluation in achieving schools’ vision and mission (Figure 2) [23].
But in order to achieve this goal, institutions must be analyzed. The SWOT method is widely used to analyze organizations. Institutes define their strategies, aiming to transform potential threats into opportunities by SWOT [24,25].
To ensure the sustainability of their success, educational institutions adopt performance evaluation systems such as the balanced scorecard (BSC) [26]. The BSC serves as an effective tool for strategic coordination and performance measurement [27]. While evaluating school performance is essential, it remains challenging due to the diversity of variables involved [28]. Therefore, the BSC must be adapted to the specific context of schools to be widely applicable [29].
The literature includes 65 different studies on the use of the BSC in educational institutions [30]. In the literature of performance management, educational institutions rank as the third most frequently researched sector in terms of scientific publications [31], highlighting the significant need for further studies in this field. Research can provide high-quality findings and insights to enhance school success.
In order to implement the BSC, CSFs and KPIs must be determined. For this purpose, the FCM method is used. Fuzzy cognitive maps are used for modeling critical success factors [9].
The literature includes diverse studies that have independently utilized FCM [32,33], SWOT [24], and BSC [34] methods. Additionally, SWOT-BSC [35,36,37] and FCM-BSC [38] combinations have been explored. However, to comprehensively address the complex nature of school success, integrating all three methods can yield more precise results. While FCM models stakeholder perceptions and the intricate relationships between them, SWOT analyzes the institutional context, and the BSC systematically measures performance. This integrated approach unifies fragmented analyses in the literature, offering a more holistic evaluation framework for school success. However, there is no school-based study in the literature employing all three methods together.
Lee and Sai On Ko [39] conducted one of the first studies that combined SWOT analysis with the BSC method to adapt Sun Tzu’s martial arts principles to the competitive strategies of businesses. Ip and Koo [37] employed the SWOT and BSC methods as a pragmatic approach for managers and consultants to translate vague strategies into actionable plans. Yildiz [36] added a SWOT analysis to the BSC framework to assist in identifying effective strategies. Manteghi [40] integrated SWOT with the BSC method to examine and implement the competitive strategies identified through SWOT analysis.
Keok [41] emphasizes that all strategic approaches can be more effective when they are integrated and applied collectively to reach new customers and create new markets. Keok aims to develop a comprehensive strategy by linking organizational analysis with environmental analysis.
Glykas [38] aimed to address the challenges of the balanced scorecard (BSC) by utilizing FCM. The study seeks to uncover the interactions between FCM and KPIs in contrast to the static nature of traditional performance measurement systems. By employing FCMs in the development of a BSC, the insights of potential decision makers can be integrated into the model, allowing for the selection of preferred KPIs, the addition of new KPIs, and the visualization of comprehensive results.
Research indicates that Türkiye’s PISA (Programme for International Student Assessment) scores remain below the OECD (Organisation for Economic Co-Operation and Development) average [42,43]. In such a large education system, systematically identifying success factors is essential for the efficient use of resources and the enhancement of quality standards. This study is significant as its findings can be adapted to countries with similar educational profiles [44].
The UN’s 2030 strategy aims to provide better education for young people [45]. With its 17 Sustainable Development Goals (SDGs) and 169 targets, the United Nations has clearly acknowledged education as a key factor in achieving Agenda 2030 (Figure 3) [46].
This present study seeks to contribute to four of the UN’s 17 Sustainable Development Goals (SDGs): Quality Education (4), Peace, Justice and Strong Institution (16), Reduced Inequalities (10), and No Poverty (1) [47]. In particular, identifying success factors in schools and developing performance measurement systems directly support the goal of quality education by enhancing educational standards. It also helps determine factors that improve the success of disadvantaged students, and reduce educational inequalities. According to the BM Sustainable Development Goals report the proportion of indicators that provide a snapshot of global SDG performance has steadily increased year after year. The report also revealed some findings regarding education. Three-hundred million students will drop out of school by 2030 as a result of years of underinvestment in education and learning losses. Investing in education must become a national priority. Furthermore, it is crucial to implement policies like making education free and mandatory, hiring more instructors, and upgrading the fundamental facilities of schools. The standard of education is far from universal and varies greatly by location. Additionally, parents stated that two-thirds of students had learning difficulties as a result of spending a lot of time at home [48].
Furthermore, this study establishes a foundational framework for monitoring large-scale investment performance in schools, encompassing Environmental, Social, and Governance (ESG) domains. This enables schools to become strong institutions that lead social and environmental change in line with public values [49]. According to current empirical data from OECD nations, strong ESG practices increase operational effectiveness and decision-making ability in addition to long-term organizational value [50].
This study aims to systematically identify the factors influencing school success and develop a performance measurement model based on these factors. By doing so, it seeks to enhance school management effectiveness and overall performance. It focuses on high schools due to their role as a primary sample source in PISA research [51], their correlation with university success [52], the opportunities they provide for disadvantaged students [53], and the high dropout rates at this educational level [54].
This study addresses the following research questions:
  • What are the CSFs and KPIs for schools?
  • What are the SWOT factors for schools?
  • Can a school-specific BSC be developed and implemented?
This study was conducted using data collected from schools in Istanbul. The subsequent sections present the methodology and findings, followed by a discussion of theoretical and practical implications.
By introducing a novel perspective to critical success factors, this study presents an original model that holistically examines the interaction between teachers, students, and structural factors. The conceptual framework explains not only the multidimensional nature of school success, but also performance measurement approaches in education.

2. Materials and Methods

2.1. Conceptual Design

This study employs a three-phase mixed-methods approach that integrates both quantitative and qualitative elements:
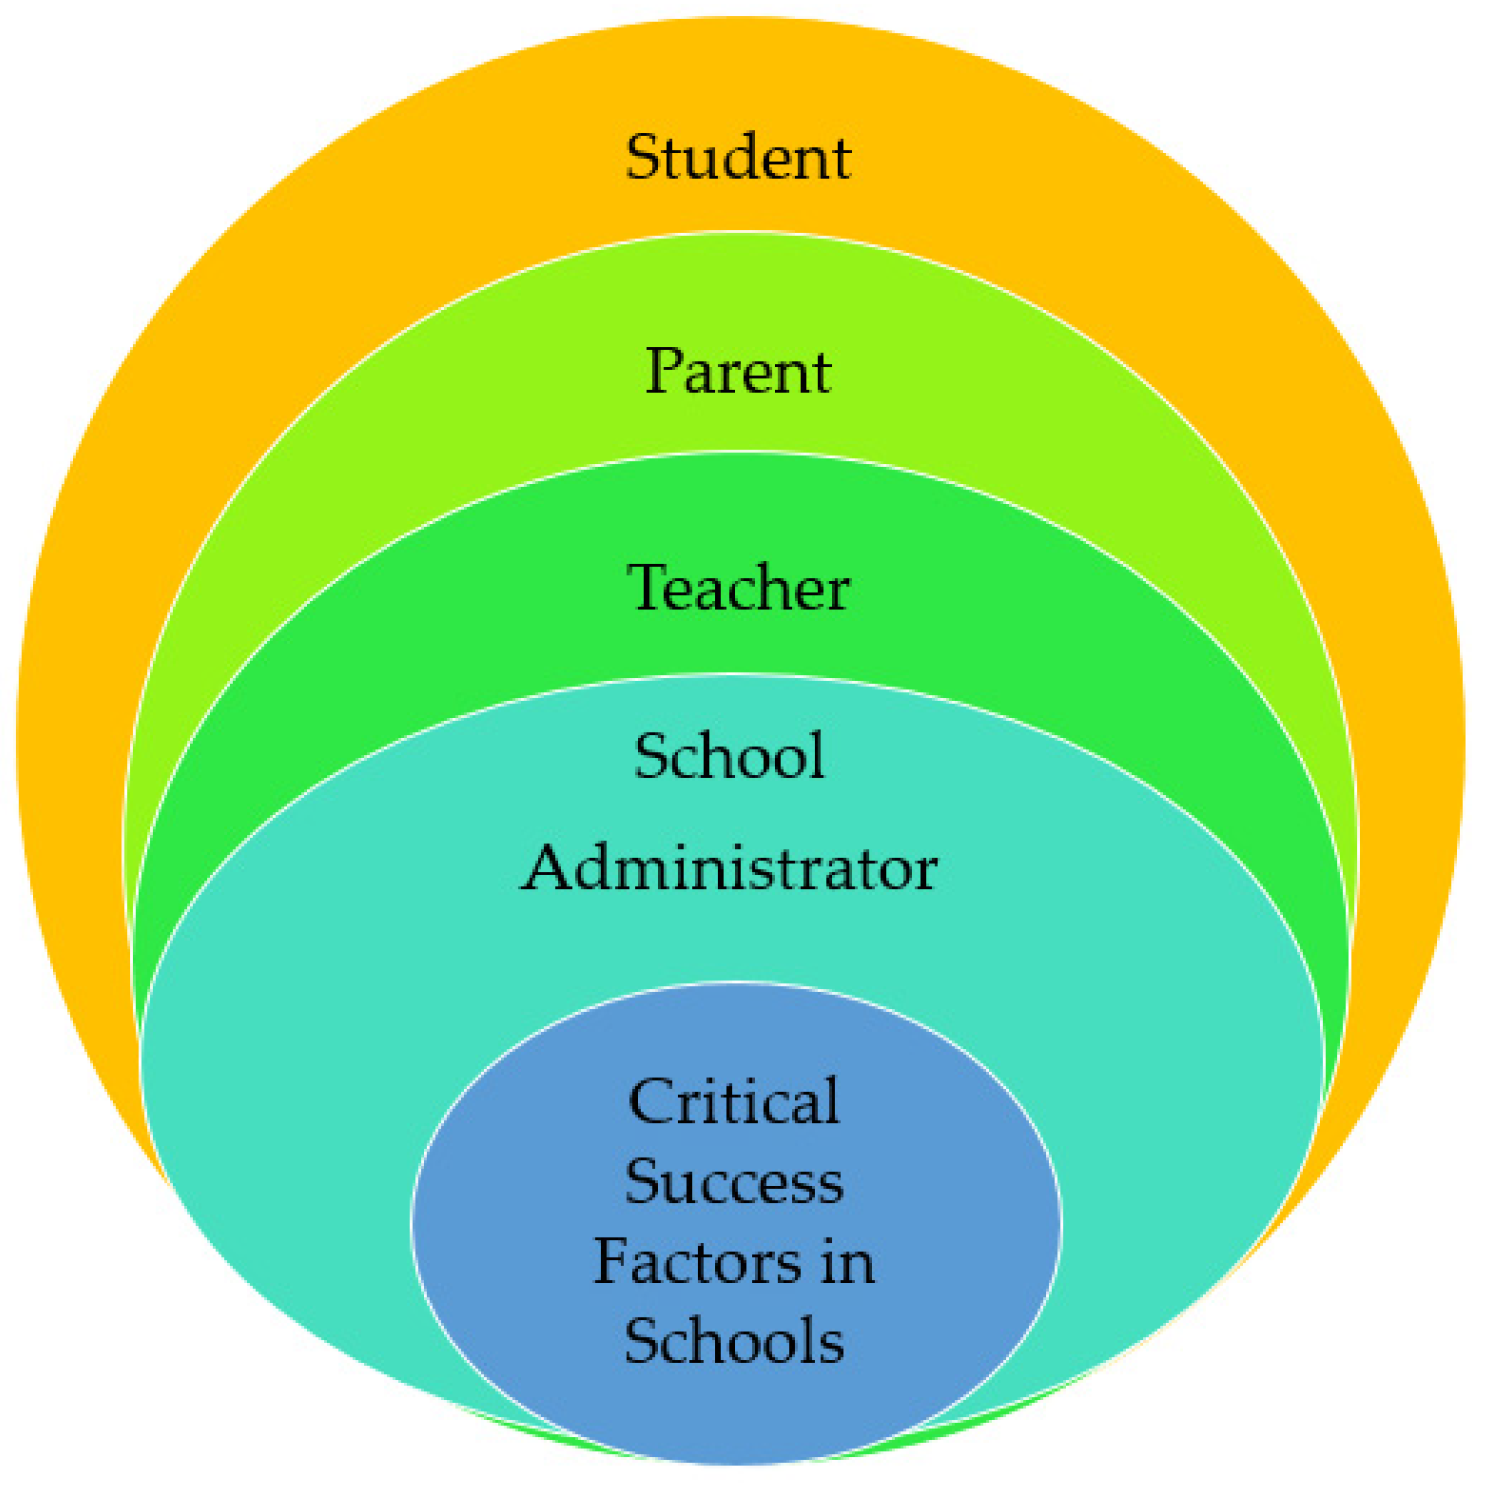
  • Identification of CSFs for schools using the FCM method;
  • Determination of SWOT factors specific to schools;
  • Development of a BSC model for schools, based on the factors identified in the first two phases.
Figure 4 illustrates the conceptual framework and methodological steps of this study [1].
In order to measure the performance of an organization with the BSC method, strategic goals (CSFs) and key performance indicators (KPIs) need to be determined [55]. However, the level of impact and prioritization of strategic objectives should also be determined [56]. Institutes determine their strategic goals by using KPIs with BSC, measure their corporate performance, and take the necessary actions to achieve their strategic goals. Without KPIs, organizations cannot know whether they have achieved their goals. Without CSFs, organizations cannot focus on, control, and manage the most important ones among many goals. CSFs are created on the basis of the strategies and mission of the organizations, and they implement the critical activity areas necessary for the realization of these objectives. After the critical activity areas are identified, KPIs related to CSFs are created. KPIs are key performance indicators for the realization of activities that contribute to the achievement of CSFs, strategies, vision, and mission. These indicators show organizations which area of activity they provide guidance on how to improve [57]. BSC is a performance measurement method covering the elements of CSFs and KPIs.
An extensive literature review has been conducted to identify the critical success factors and performance indicators that influence success in educational institutions. As a result, a total of 50 factors were identified—24 CSFs and 26 KPIs. To ensure both relevance and validity, these factors were further evaluated through stakeholder input. Analyses based on stakeholder evaluations were used to determine which factors are essential for schools and which ones reflect their current conditions. This approach allowed us to ground this study in established academic literature while also tailoring the framework to the realities of today’s educational institutions through expert and practitioner insights.

2.2. Methods

This section explains the three methods used in this study.
  • Fuzzy Cognitive Mapping:
FCM is a proven method in management decision making, including business management [58], implementation of strategies in the retail sector [59], and supply chain management in the fashion industry [60]. It is widely used as an effective tool for constructing and modeling human-centered systems [33]. In this study, the FCM method was employed to identify CSFs for schools.
FCM is a modeling technique that combines fuzzy logic and artificial neural networks [61]. It is particularly notable for its ability to visualize causal relationships between concepts across a system [62] and to represent human thoughts as neural networks. Compared to other quantitative research methodologies, FCM offers several key advantages: it adopts a participatory approach that allows stakeholders to express their perceptions in an evidence-based decision-making process, reveals hidden feedback mechanisms within a system, and effectively models complex systems [63].
  • SWOT Analysis:
The second method used in this study is SWOT analysis, which was conducted to capture the perspectives of key school stakeholders—students, parents, and administrators—toward educational institutions. The analysis was structured around the following definitions [64]:
    • Strengths: A resource or capability related to stakeholders’ perspectives on the school.
    • Weaknesses: A limitation or deficiency related to stakeholders’ perspectives on the school.
    • Opportunities: A favorable condition or unmet need related to stakeholders’ perspectives on the school.
    • Threats: A potential obstacle or constraint that may cause problems.
Evaluating an institution’s performance requires extensive knowledge of its objectives, processes, and stakeholders. SWOT analysis was chosen for this study because it provides a comprehensive snapshot of a school’s current state in relation to the community, other schools, and students’ future educational institutions [65].
  • Balanced Scorecard Approach:
BSC was utilized to measure school performance. It is a strategic tool that facilitates organizations in achieving their objectives by providing comprehensive performance indicators across four key dimensions: financial, customer, business process, and learning and growth [66]. Although initially developed for corporate settings, BSC has become a widely adopted performance evaluation framework for nonprofit and public institutions, including educational organizations [67].

3. An Actual Evaluation

The proposed methodology was implemented with the primary stakeholders of schools, including students, school administrators, and parents. The entire study was conducted through face-to-face interactions with participants. The research was conducted during the 2024–2025 academic year, involving a total of 330 students, parents, and school administrators from high schools. A convenience sampling was employed for FCM, while a stratified random sampling was used for SWOT analysis. For FCM, the sample size was determined as 21 participants, with seven individuals selected from each group (students, administrators, and parents).
We preferred to use the FCM method, as it has been shown to yield meaningful results even with relatively small sample sizes. As highlighted by Özesmi et al. [68], FCM relies more on participants’ domain knowledge than on large sample sizes. Accordingly, we based our FCM value thresholds on prior studies in the literature. For instance, Erkan et al. [69,70] conducted FCM studies with as few as 3 participants, while Tuncer et al. [71] used 12 participants. In comparison, our study involved 21 participants, which is considered sufficient given the nature of the FCM methodology. We acknowledge that the use of a small sample size and the convenience sampling method may pose limitations and potential bias. However, to minimize this risk, we ensured equal representation from all key stakeholder groups—students, administrators, and parents. In selecting student participants, we prioritized class presidents and academically successful students across 12 classes. For parent participants, we selected individuals actively involved in school affairs, such as members of the Parent–Teacher Association (PTA) and those known for their engagement with their children’s education. To further mitigate the potential limitations of the FCM phase, we conducted a second study using the SWOT method with a considerably larger sample size (n = 300). This additional analysis helped to balance and validate the findings derived from the FCM component.
FCMs are created with different people until the population to be represented has been sampled sufficiently. To determine this, we can examine accumulation curves of the total number of variables versus number of interviews as well as the number of new variables added per interview. For defining sample size we use average accumulation curves. It can be made by using accumulation curves based on Monte Carlo techniques [68]. We created three cognitive maps in our study; therefore, 21 samples were sufficient according to the number of new variables added per map.
Here, in order to avoid any bias and outlier data in the results, while considering the effects of different segments of the population in a fair manner, the sample selection process is accomplished using the proportional sampling method [72]. The population is classified into different segments and the samples are randomly selected among all segments. This method is very similar to the regular sample selection; nevertheless, the segments are chosen based on the students’ class to cover the entire school. There are three stakeholders’ participant groups consisting of school administrators, students, and parents. The selected segments (students and parents) are math classes and nature sciences classes in academic high school, technical and non-technical parts in technical high school. The number of participants in the school administration varied between three and seven and all of them participated in the research.
The fact that cognitive maps are created by the participants and that they are given the freedom to define the ideas they want and change them at any stage demonstrates the validity of this method [73]. Jenkins [74] stated that the most appropriate approach to validity is “allowing the participant to have a clear and meaningful response for themselves” [75,76]. In terms of reliability, it is important that the researcher’s influence is limited. The researcher is only there to record what the participant says without skipping. During this time, the participant can see and check every recorded data. Therefore, there is no participant bias [75].
For SWOT analysis, a sample size of 300 participants was designed, where the required sample size was calculated using the following formula at a 95% confidence level [77]:
n = N × t2 × p × q/(α2 × (N − 1) + t2 × p × q)
Using the parameters N = 2064, t = 1.96, p = 0.75, q = 0.25, and α = 0.05, the minimum required sample size was determined as 253 participants. Considering potential data losses, a final target sample of 300 participants was set.

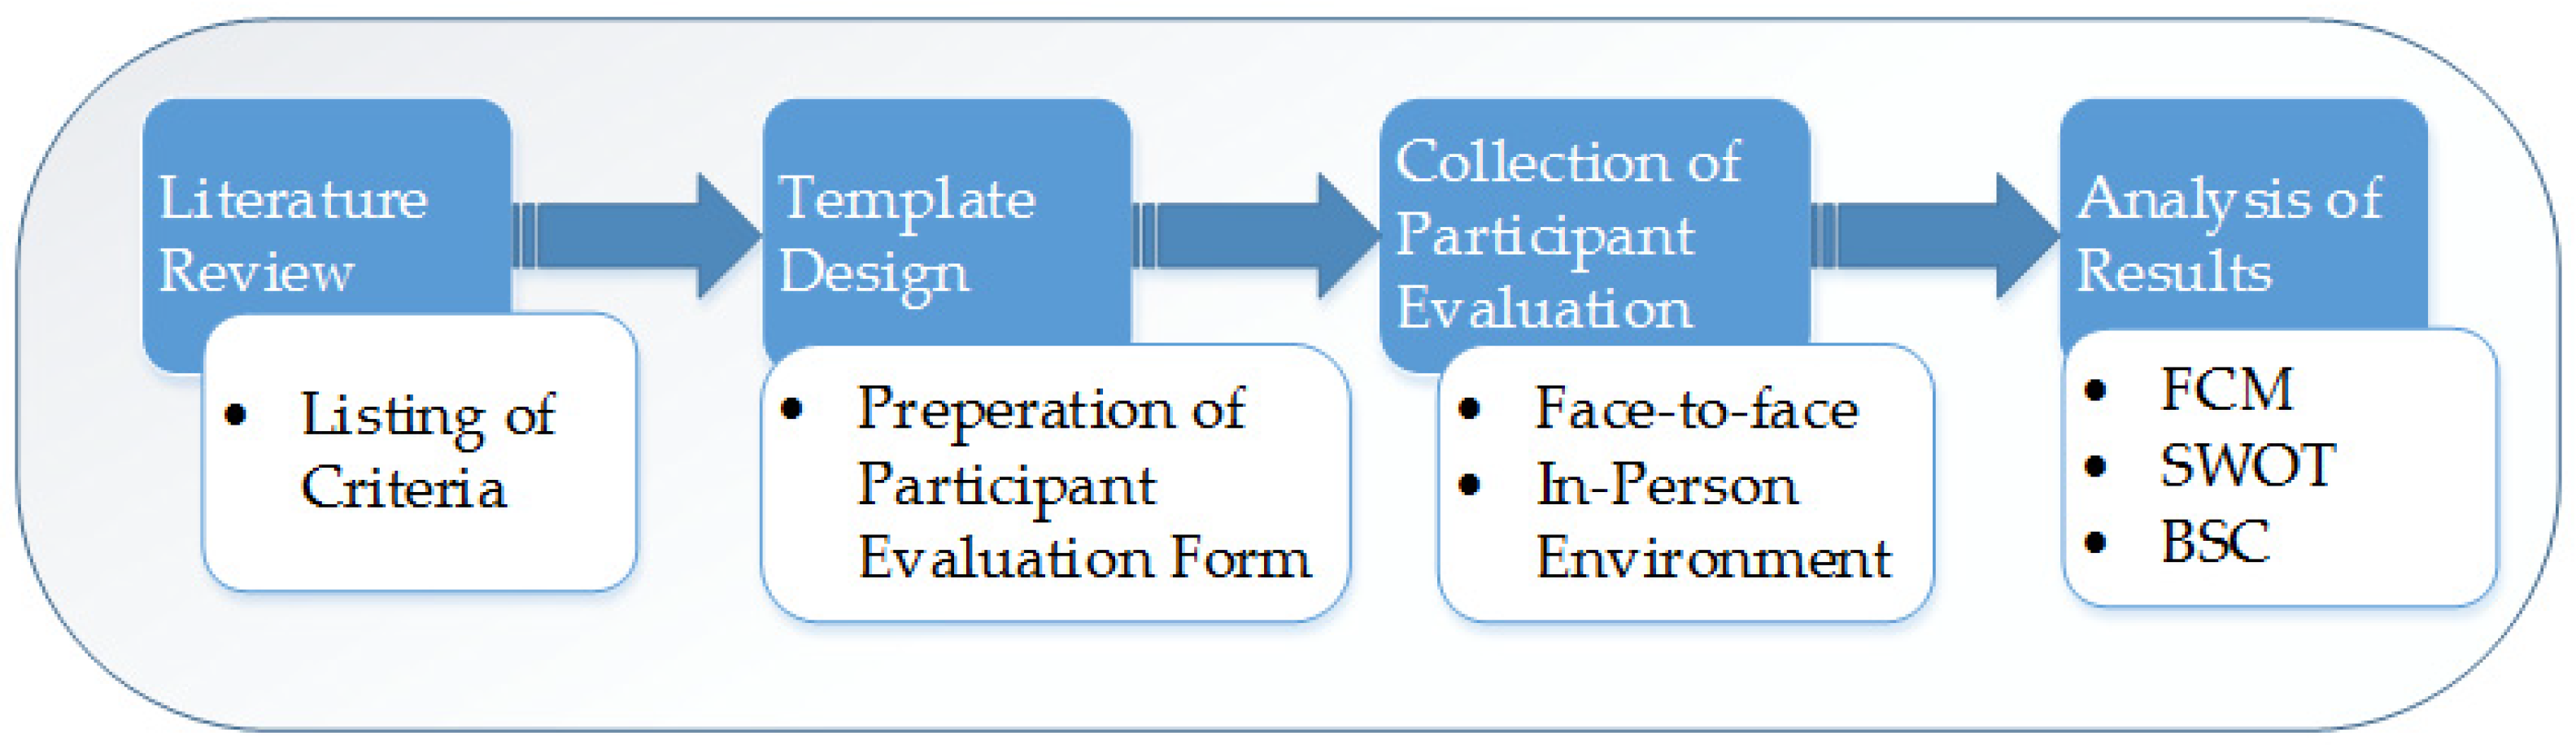
3.1. Steps of Methodology

Step 1: Identification of CSFs for Schools by Using FCM
The model designed to determine CSFs and KPIs for schools consists of two phases: the initial phase and the analysis phase. In the initial phase, factors identified through a literature review were presented to participants, and linguistic expressions were converted into numerical values using fuzzy logic methods. In the analysis phase, participants’ cognitive maps were aggregated to construct a group model, upon which domain, centrality, indegree, and outdegree index analyses were conducted.
Step 2: Identification of KPIs by Using FCM for BSC
Based on the prioritized CSFs, relevant KPIs were selected in alignment with BSC dimensions.
Step 3: Identification of CSFs of Schools by Using SWOT
Potential SWOT factors affecting school performance were identified through literature review and presented to the participants. The participants selected the factors they deemed critical. The collected participant forms were subjected to frequency analysis to quantify the significance of each factor.
Step 4: Statistical Analysis
For cognitive mapping (CM), Decision Explorer Banxia v3.3 software was utilized, and both domain and centrality analyses were performed. Additionally, for FCM analyses, FC Mapper® v 1.0 software was employed to compute the centrality index, indegree index, and outdegree index.
Furthermore, Cronbach’s alpha analysis was conducted to assess the internal consistency reliability of the scales used in this study. An alpha value above 0.70 was considered an acceptable level of reliability.
For SWOT data analysis and BSC scoring, Microsoft Excel software was used. The statistical significance levels of the factors were determined based on FCM index values and SWOT frequencies, categorized as follows:
Highly significant (p < 0.001): FCM value > 6.0 or SWOT frequency > 200;
Significant (p < 0.01): FCM value between 4.0 and 6.0 or SWOT frequency between 130 and 200;
Moderately significant (p < 0.05): FCM value between 2.0 and 4.0 or SWOT frequency between 100 and 130;
Not statistically significant (p > 0.05): FCM value < 2.0 or SWOT frequency < 100. These thresholds were established by the research team based on the outcomes of the analyses.
Step 5: School BSC Development
Based on the results of FCM and SWOT analysis, a BSC template was developed for schools. Out of 50 criteria identified through literature review, participant evaluations led to the selection of 10 criteria as CSFs and 9 criteria as KPIs. Additionally, from the 30 criteria identified for SWOT analysis, the 8 factors with the highest frequency were designated as CSFs (Figure 4).
Below, Figure 5 presents the dimensions and descriptions of the developed educational BSC model for further examination (Figure 5).
Figure 5 presents a customized BSC model adapted for educational institutions. It is structured into four key perspectives. Each section includes relevant strategic focus areas for school performance evaluation.
After conducting the FCM analyses, we identified nine critical key performance indicators (KPIs). These KPIs have been categorized into four new dimensions developed for schools. 1. Students and Parents Dimension: 1.1. Quality of Students Admitted via the High School Entrance Exam (HSEE)—HSEE Percentile (25)—1.2. Higher Education Entrance Exam (HEEE) and Practice Test Results (30)—1.3. Percentage of Satisfied Students (32). 2. Teaching Dimension: 2.1. HEEE Equivalent Question Solving (34)—2.2. Frequency of HEEE Practice Exams—2.3. Percentage of Achievement of the Objectives of the Student Recovery Plan (37). 3. School Administration Dimension: 3.1. Ratio of Financial Assets to Liabilities (41). 4. Human Resources Dimension: 4.1. Percentage of New Graduates, Interns, and Trainee Teachers (43)—4.2. Percentage of Successful Teachers (46).
Step 6: School BSC Implementation
Measurement and calculation methods were developed for the nine KPIs identified through FCM analyses. For each KPI, five intervals within a range of 0 to 1 were defined, and a fixed BSC score was assigned to each interval. The KPI score calculations and BSC score conversions are presented in Table 1. The weight of each KPI was determined by dividing its FCM index value by the total sum of all KPI index values. The BSC score was obtained by multiplying the BSC score by the KPI weight.
To improve the understanding of KPI-to-BSC score calculations, an example is provided using KPI 46: Percentage of Successful Teachers. This calculation is carried out in two steps:
Step 1: The KPI score is determined by dividing the number of successful teachers (36) by the total number of teachers (60), resulting in a ratio of 0.6.
Step 2: This KPI score (0.6) is then converted into a BSC score using the thresholds defined in Table 1. A ratio of 0.6 falls within the range of 0.41 ≤ KPI ≤ 0.60, which corresponds to a BSC score of 0.6.
Thus, the final BSC score for this KPI is 0.6.

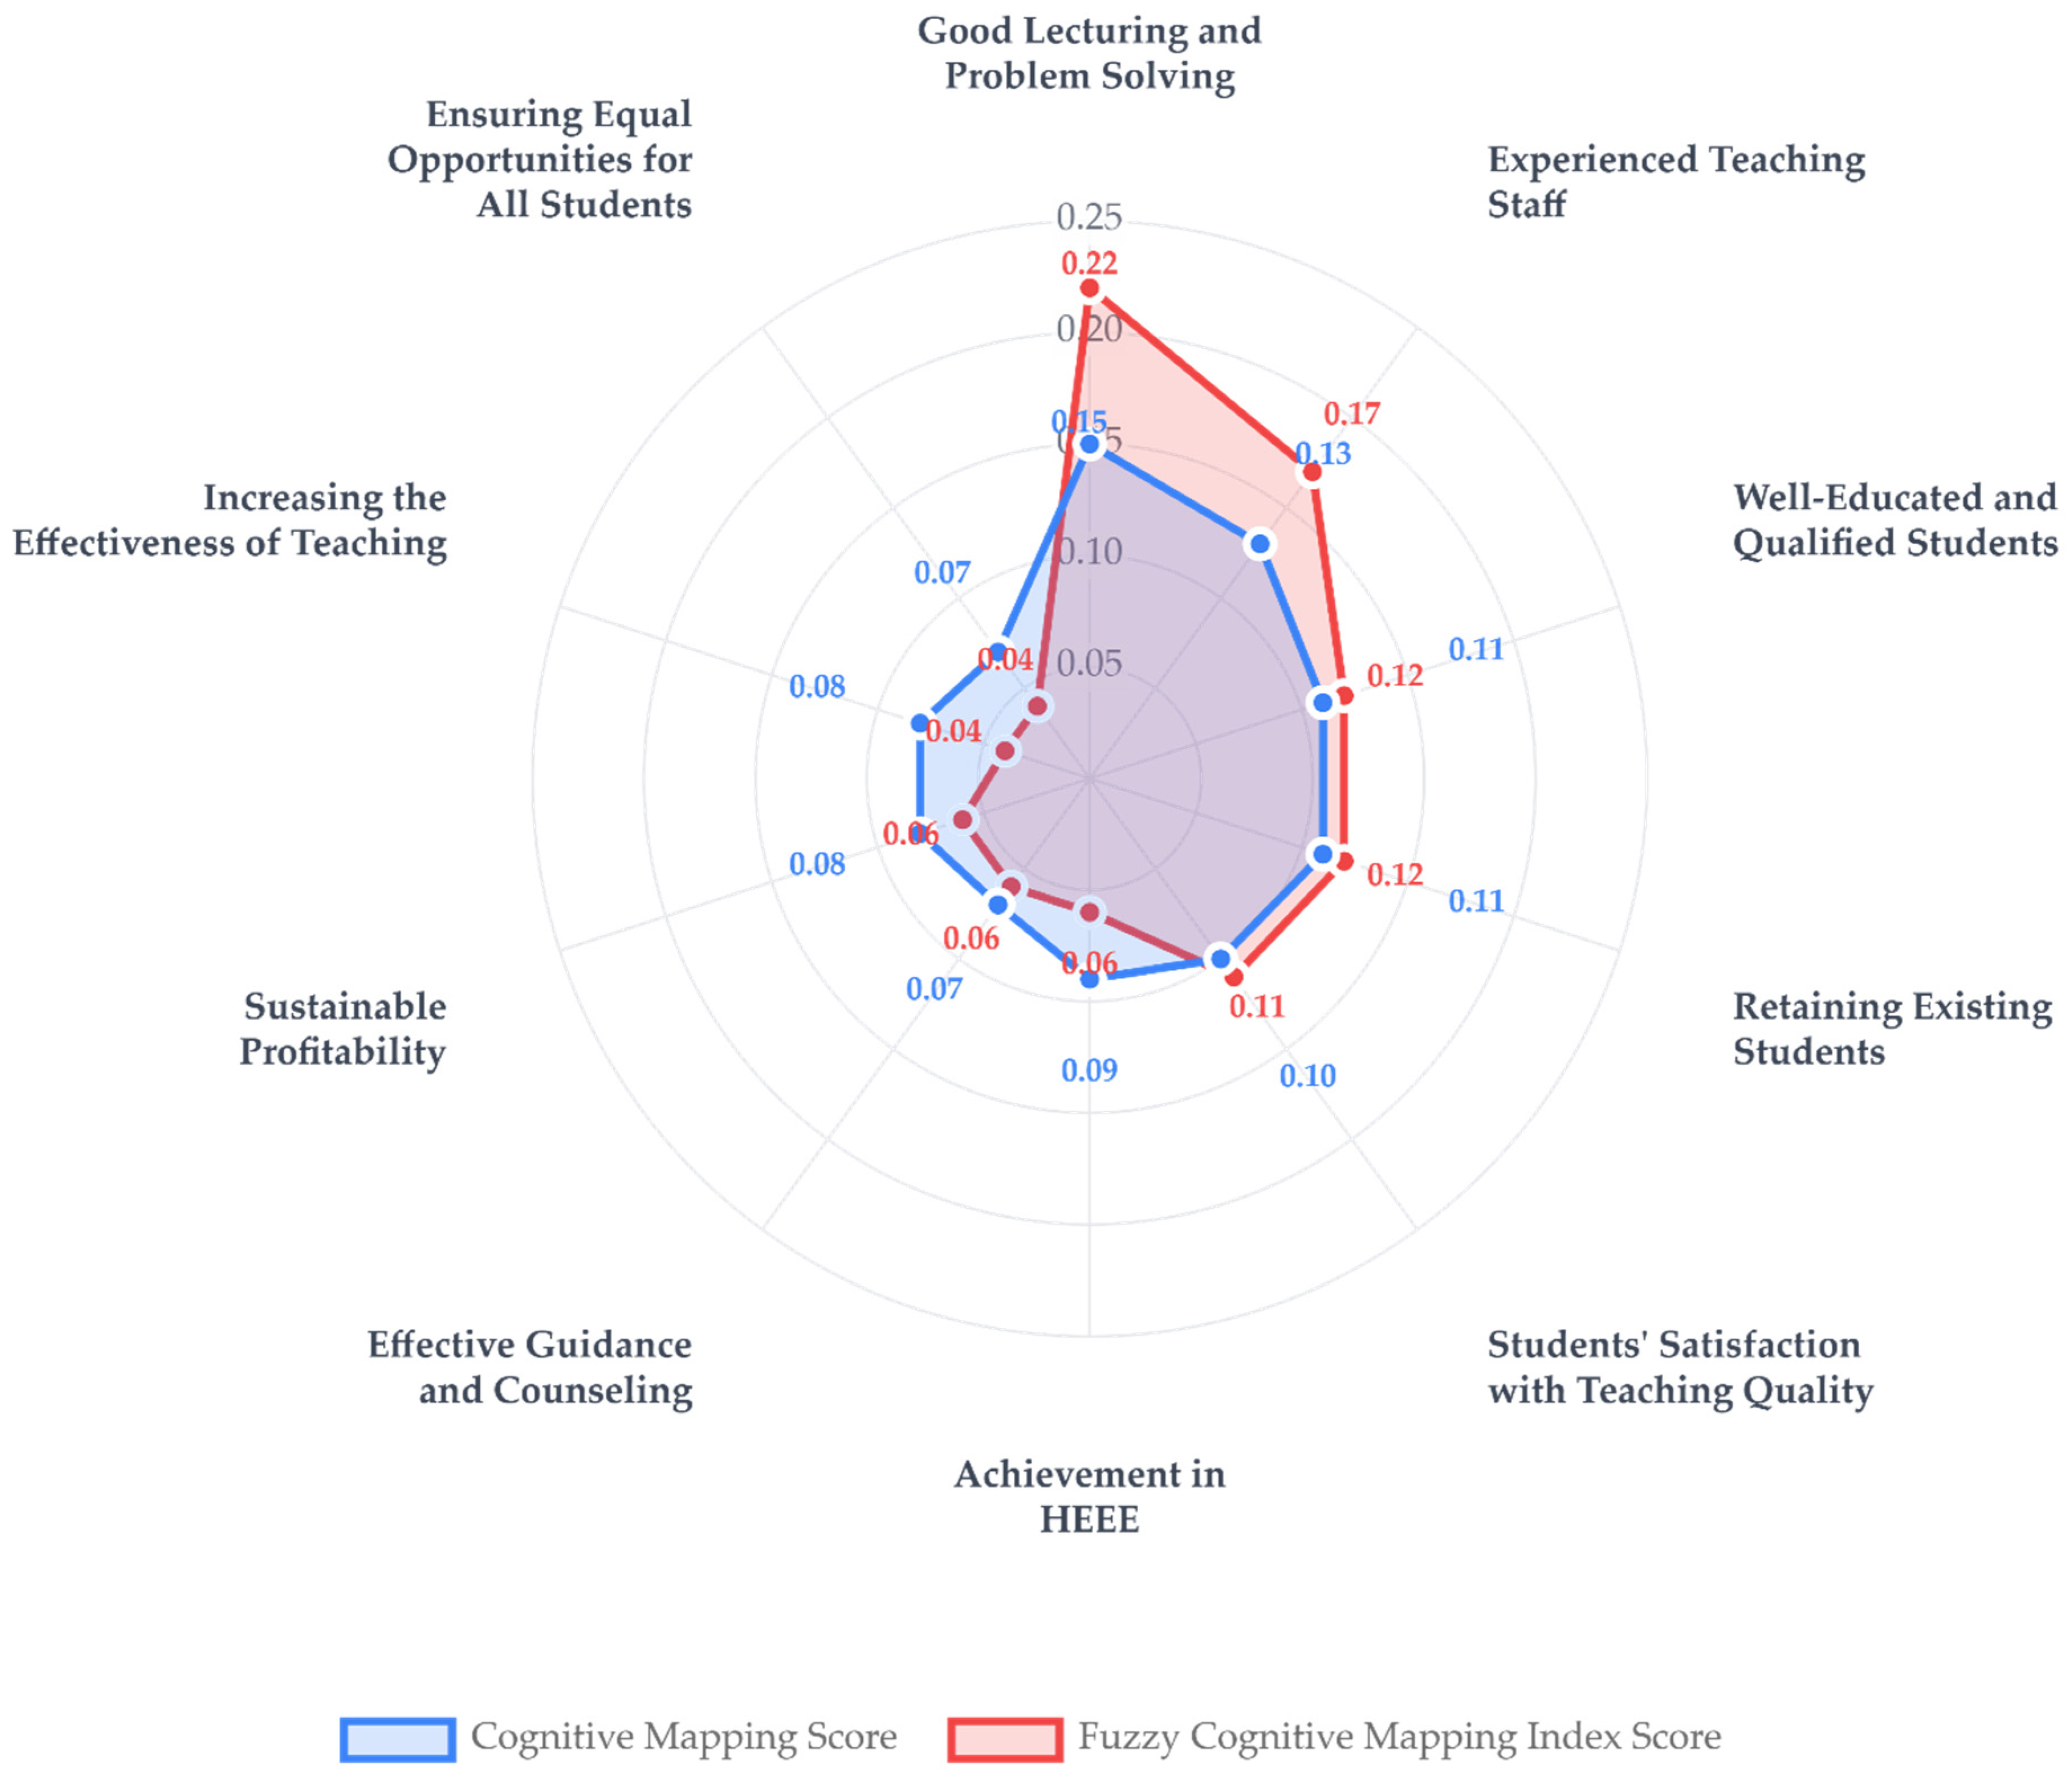
3.2. Results and Discussion

This study was designed and performed in three phases. In the first phase, the CM (cognitive mapping) method was used to identify the factors affecting success in schools. This analysis is based on data collected from 27 participants and from three high schools. A common group model was obtained by combining the individual cognitive maps of the participants. This model visually illustrates the relationships and interactions among the CSFs of the schools. In the created map, each number represents a factor and the arrows between the factors indicate the direction of influence. Some factors are positioned more centrally than others, forming the focal point of interactions within the system. Figure 6 presents the fuzzy cognitive map of the group model.
Each box in the FCM visualization represents the most frequently mentioned CSFs and KPIs by participants, while the arrows between the boxes indicate the perceived relationships between these factors. In general, arrows between concepts in a cognitive map indicate that one concept “causes” or “may lead to” another. If a concept appears to be a consequence of another, directional links are drawn accordingly to represent the outcome. These arrows are primarily used to illustrate conceptual relationships or logical sequences between factors. However, the thickness or length of the arrows does not reflect the strength of influence. Furthermore, contrary to common assumptions, node sizes do not represent influence levels within the FCM visualization. The actual strength of influence between concepts—based on participant evaluations—can only be examined through the evaluation matrices [78].
The cognitive mapping analysis determined the significance levels of each critical success factor. Both traditional cognitive mapping values and fuzzy cognitive mapping index values for the factors were calculated and presented comparatively. The results of the domain and centrality analyses performed on the cognitive mapping outcomes of critical success factors are shown in by a radar graph in Figure 7. For ease of comparison, total cognitive mapping scores and total fuzzy cognitive mapping index scores values are normalized and the radar graphs are plotted. According to the analysis results, the critical success factors with the highest values were “Good Lecturing and Problem Solving” (0.15 and 0.22), “Experienced Teaching Staff” (0.13 and 0.17), and “Retaining Existing Students” (0.11 and 0.12). These results emphasize the critical role of educational quality and teacher expertise in school success. The analysis values for key performance indicators are presented by a radar graph in Figure 8. Accordingly, the key performance indicators with the highest values were the “Percentage of Satisfied Students” (0.15 and 0.22), “Ratio of New Graduates, Intern and Trainee Teachers” (0.14 and 0.17), and “Percentage of Successful Teachers” (0.11 and 0.16).
Cognitive mapping score means sum of raw mapping scores. Fuzzy cognitive mapping index score means weighted scores based on fuzzy logic scaling.
Cognitive mapping score reflects results obtained from direct field (domain) and central analyses. Fuzzy cognitive mapping index score indicates the overall weighted importance scores derived using centrality, indegree, and outdegree measures. Both scores assess the importance of each factor through different analytical approaches.
In the second phase, a SWOT analysis was conducted to identify the Strengths, Weaknesses, Opportunities, and Threats of schools. This analysis is based on data collected from 309 participants and from 20 high schools. The results of the SWOT analysis are presented in Table 2. Accordingly, the most important strengths are “Experienced Teaching Staff” (208), “Good Communication with Teachers” (143), and “Well-Educated and Qualified Students” (138). Among the opportunities, “Ideal Student Population in Classrooms” (152) and “School Being in the City-District Center” (146) were highlighted. As for weaknesses, “Social and Sportive Activities” (103) emerged as the most prominent factor, while “Improper Use of Internet” (95) stood out as a significant threat (Table 2).
The critical factors identified through FCM and SWOT analyses were categorized and assessed, and their statistical significance levels were examined. The factors were grouped into five main categories: teacher factors, student factors, educational process factors, physical and structural factors, and institutional factors. The statistical significance levels calculated based on the FCM index values and SWOT frequencies determined which factors would be included in the BSC template development phase. For example, the factors “Experienced Teaching Staff” and “Good Lecturing and Problem Solving” exhibited very high significance at p < 0.001 level (Table 3).
In the third phase, a BSC was applied in two high schools based on the identified critical success factors and key performance indicators. The four main dimensions of the BSC (parent and student, teaching, school administration, human resources) were adapted to educational institutions, and key performance indicators were determined for each dimension. The results of the high school applications of the developed BSC template are shown in Table 4. Accordingly, Beşiktaş Anatolian High School (BAHS) achieved a weighted BSC score of 81.12, while Cağaloğlu Anatolian High School (CAHS) achieved a weighted BSC score of 92.52, while Selçuk Technical High School (SETHS) achieved a weighted BSC score of 67.89, while Sultanahmet Technical High School (SUTHS) achieved a weighted BSC score of 77.58. These results indicated that Cağaloğlu Anatolian High School performed better in terms of the identified critical success factors. By explaining one of the KPIs, calculations made it easier to understand KPI 32 (Percentage of Satisfied Students) and were calculated as follows. In the first step, we found the KPI score by dividing the number of satisfied students by the total number of students. In the second step, we converted the KPI score to the BSC score with the help of Table 1. We obtained the KPI weights as a result of analysis. They are presented in Table 3. In the final step, we multiplied the BSC score by the KPIs weights. The result we found was the weighted BSC Score.
Reliability analyses were conducted for the scales used in this study and Cronbach’s alpha values were calculated accordingly. The calculated values are shown in Table 5. The FCM Critical Success Factors Scale has a Cronbach’s alpha value of 0.87; the SWOT Analysis Factors Scale has a value of 0.83. These values indicate that the scales have high and good levels of reliability.
Threshold values such as an FCM score greater than 6.0 or a SWOT frequency count above 200 (for p < 0.001) were determined based on prior studies in the literature, as well as a review of value distributions within our dataset. The highest FCM values (i.e., >6.0) represent factors that were consistently identified as critical by a broad range of stakeholders, aligning with findings from earlier research and supporting their statistical validity.
To assess the reliability of our measurement tools, we calculated Cronbach’s alpha coefficients. The FCM scale demonstrated high reliability (α = 0.87), as did the SWOT scale (α = 0.83). Values exceeding 0.80 indicate a strong level of internal consistency, confirming that the instruments used in this study are both valid and reliable.
Educational institutions are of vital importance to every society due to their contributions to the development of students’ knowledge and skills, the maintenance of social order, and the creation of a sustainable world [2]. Our study focuses on three main research questions: identifying CSFs and KPIs for schools, determining SWOT factors, and whether a school-specific performance measurement system can be developed. To address these questions, FCM and SWOT analyses were conducted and a school-specific BSC model was developed using the findings. This integrated approach has facilitated both a deeper understanding of success factors and the possibility of sustainable performance measurement.
The most striking finding of our study is that the teacher factor stands out dominantly in both FCM and SWOT analyses. In the FCM results, “Good Lecturing and Problem Solving” (0.22) and “Experienced Teaching Staff” (0.17) had the highest values, while in the SWOT analysis, “Experienced Teaching Staff” (208) was identified as the factor with the highest frequency. These results align with those of similar studies in the literature. Sayın and Gelbal [12] conducted a study with university students and argued that teaching strategies and teacher qualifications were among the most important factors affecting success. A common characteristic of countries that perform well in international evaluation systems PISA and TIMSS (Trends in International Mathematics and Science Study) is effective and high-performance teachers [93]. These consistent findings confirm the central role of education quality and teacher competence in school success. This may indicate that the teacher factor is often overlooked and not sufficiently emphasized in educational institutions.
Following the teacher factor, student-related factors have been observed to emerge significantly. In the FCM analyses, “Well-Educated and Qualified Students” (0.12), “Retaining Existing Students” (0.12), and “Students’ Satisfaction with Teaching Quality” (0.11) demonstrated high values. Similarly, in the SWOT analysis, “Well-Educated and Qualified Students” (138), “Having High Achievement of the School” (131), “Rise in Demand for Higher Education” (112), “Increasing and Changing Student Population” (105), “Improper Use of Internet” (85), and “Students’ Preference for Anatolian High Schools” (74) emerged as notable factors. These results highlight the critical role of the student factor in determining a school’s success. Nunes et al. [45] identified students’ academic self-efficacy as one of the most significant determinants of success. Similarly, Galyon et al. [94] emphasized that well-qualified students exhibit higher levels of engagement and effort in classes, which directly enhances academic achievement. These results underscore the importance of attracting successful students, ensuring their satisfaction, and fostering their commitment to the institution as critical elements for institutional success.
Interestingly, while physical infrastructure-related factors did not prominently appear in the FCM analyses, they were among the most frequently mentioned factors in the SWOT analysis, including “Ideal Student Population in Classrooms” (152), “School Being in the City-District Center” (146), and “Social and Sportive Activities” (103). This outcome underscores the importance of utilizing both analytical methods together in research. The significance of a school’s physical infrastructure is also supported by previous SWOT studies in the literature. Ozan et al. [55] and Ozkul et al. [95] have demonstrated that school facilities and location are among the key success factors for educational institutions. Another commonly noted advantage of centrally located schools is that they tend to attract more experienced teachers [55]. However, this finding is based solely on participant opinions and does not establish a correlation, as the study does not include a comparative analysis of student achievement levels between centrally and remotely located schools. Similarly, Ozan et al. [55] conducted a SWOT analysis focusing on the general strengths and weaknesses of schools but did not compare academic performance based on variations in physical infrastructure. The authors themselves noted the need for future studies that include schools from both urban and rural areas to provide a more comprehensive evaluation. Therefore, the study does not offer any evidence of correlation or causality regarding the impact of infrastructure on performance.
Furthermore, while Nunes et al. [45] examined several factors influencing school and student achievement—including academic self-efficacy and socioeconomic status—the study did not consider school physical infrastructure as a variable. As such, despite exploring potential correlations, it overlooks a critical component that may significantly affect student outcomes.
However, the literature also includes studies that have yielded different conclusions. Bosworth [96] and Cruz-Jesus et al. [97] have argued that the impact of class sizes on student achievement is limited. These conflicting results suggest that data-driven approaches, such as machine learning, as proposed by Fischer et al. [98], may yield more precise results. In contrast, Multan et al. [2] confirmed that school location is a critical success factor This may be because schools situated in central locations offer students broader social, cultural, and logistical opportunities, making them more attractive to high-achieving students.
The integration of SWOT, BSC, and ESG frameworks in this study offers both a continuation and a contextual advancement of earlier models. The studies of Aydın and Varıcı [99], Yıldız [36] and Ozkul et al. [95] are especially important. While Aydın and Varıcı [99] considered sustainability factors as a separate dimension, we included them in the existing dimensions. While our study was conducted in a pre-university educational institution, this study differs from the previous one in that it was conducted in a university providing health education. The study is likely to give more reliable results because it uses data from the last three years. It is important in terms of its utilization. The star gives separate BSC scores to each dimension and weights the dimensions. However, the study was conducted by a for-profit organization. Since it was carried out in small enterprises, the financial and individual performance measurement aspects are predominant. Since the study was conducted in a single enterprise, it is impossible to make a comparison; possibilities are limited.
While Ozkul et al. [95] limited their study to SWOT analysis, we used three different methods together. The three most important factors identified in this study align with the results of our research. Our study incorporated three distinct stakeholder groups, whereas Ozkul et al. [95] focused solely on administrators. Additionally, while our research concentrated on a single school level, their study gathered data from four different school levels. Given that their study was conducted in a smaller region compared to the area of our research, the representativeness of their population may be lower. Furthermore, Ozkul et al. [95] did not consider ESG factors in their analysis.
Based on our research results, we have certain recommendations to school policy makers. Educational policies aim to enhance the overall quality of education [100]. In our study, we developed new perspectives and factors for schools. Unfortunately, research focuses on generic BSC architects implemented by schools. However, additional perspectives or items should be developed under existing perspectives that are specific to the management of schools [34]. Our research aims to increase schools’ performance. Governments should think of the shutting down of ineffective schools [101] and the relocation of affected students to high-performing schools [53].
The most striking finding of our study in Türkiye is the importance of teacher factors. Similarly to Türkiye, Saudi Arabian and Malaysian governments are enhancing the quality of education through a targeted emphasis on teacher training [100]. The similarity of the results may be due to the similarities in the economic size, population, and social structure of these countries. In Karatay and Kurtulus’s [102] research on Türkiye’s education policies, four of the six most important factors among the current problems in the education system are directly related to teachers. This result is compatible with the results of our research. This may be due to the fact that the study was conducted in the same country on similar dates with similar sample groups. The ministries of education of the countries should improve the knowledge and skills of teachers in order to have experienced teaching staff, and for this purpose they should train existing teachers and improve the quality of teaching by activating the lifelong education system.
To retain experienced and talented teachers, the Ministry of National Education of Türkiye should consider implementing policies that enhance both the financial and professional well-being of educators. These may include increasing teacher salaries, reducing teaching hours and the number of working days per week, and providing additional support such as housing, meal services, and transportation. In addition, teacher training policies should be made more practice-oriented to better prepare candidates for the realities of the classroom. In this context, the duration of school-based internships for education faculty graduates should be extended, and full-time employment should begin only after candidates have demonstrated sufficient professional competence.
The second important finding of our study is related to student factors. To support the development of well-educated and high-achieving students, the Ministry of National Education should provide successful and motivated students with support mechanisms such as free meals, scholarships, dormitory accommodation, and transportation services. Additionally, efforts should be made to improve students’ access to high-quality schools and qualified teachers.
The third key finding concerns factors related to physical infrastructure. In order to achieve an optimal student-to-classroom ratio, the Ministry of National Education should prioritize the construction of new school buildings and classrooms, particularly in city and district centers. Furthermore, these new facilities should be equipped with appropriate amenities—such as sports halls and conference spaces—to support students’ participation in social, cultural, and athletic activities.
While ministries strive to implement policies that foster the development of their countries, companies aim to enhance their profits through new and strategic investments [103]. For this reason, they are increasingly examining Environmental, Social, and Governance (ESG) factors. Organizational decision making and the evaluation of prospective business performance increasingly take ESG factors into account [103]. According to Khamisu et al. [103], organizations are currently under pressure to disclose their ESG practices, whether through voluntary initiatives or mandated requirements. ESG factors are being progressively integrated into risk management, performance evaluation, and strategic decisionmaking [103]. By increasing dividends and improving their ESG practices, corporations cultivate stronger relationships with all stakeholders [104]. However, Parameswar et al. [105] note that achieving consistent and reliable ESG procedures is challenging due to a lack of awareness and expertise in ESG matters.
In our study, ESG’s governance, social, and environmental dimensions have been identified with their corresponding CSFs and KPIs. These factors are crucial for contributing to the sustainability perspective of the school BSC model. For the governance dimension of ESG, the critical success factor is “Sustainable Profitability” (17) and the performance indicator is “Ratio of Financial Assets to Liabilities” (41) in BSCs school administration dimension. These criteria reflect whether the highest benefit is obtained from school investments for investors. Furthermore, the study is significant for its ethical approach, considering all key stakeholders—students, parents, and school administrators (also teachers)—ensuring equal treatment and safeguarding stakeholder rights. In literature, the same critical success factor and performance indicator under financial dimension were found by Aydın and Varıcı [99].
For the social dimension of ESG, the critical success factors are “Ensuring Equal Opportunities for All Students” (14), “Ideal Student Population in Classrooms” (68), “Social and Sportive Activities” (61) “Being a Free Public Service Provided by the State” (62) and “Improper Use of Internet” (76) in BSCs teaching and students and parents dimensions. Our results correspond to Lin et al. [106]: the goal of “Ensuring Equal Opportunities for All Students” emphasizes the importance of equality in rights and opportunities among students, highlighting diversity and inclusion. Investments in new classrooms and decisions regarding the hiring of new teachers are significant in protecting student rights and improving educational conditions, particularly to avoid overcrowded classrooms. The availability of sports facilities for young people living in the local area, outside the educational hours, is important due to its positive contribution to meeting the needs of the youth in the region. The provision of education as “a Free Public Service Provided by the State” (62) facilitates the expansion of public schools and the increase in scholarships for low-income families in private schools, thus supporting disadvantaged families and students. Activities aimed at preventing “Improper Use of Internet” (76) ensure that students become more social, successful, and diligent, leading to greater contributions from graduates to a productive society.
For the environmental dimension of ESG, the critical success factors are “School Being in the City-District Center” (71) and “Increasing the Effectiveness of Teaching” (23) in BSCs school administration and teaching and dimensions. Our results correspond to Li et al. [107]. The farther schools are from residential areas, the more transportation vehicles will be required for students to reach their schools, resulting in longer travel times and higher carbon emissions. Having schools centrally located within residential areas will reduce fuel consumption for transportation. The increased effectiveness of teaching is also a factor of efficiency, starting from classroom instruction and continuing with the school’s reduced consumption of electricity, fuel, and water. With the increase in the efficiency of teaching, schools will fill their student capacity, and the unit energy consumption per student will decrease both in building lighting and heating per student. As the capacity utilization rates of classrooms, computer classrooms, and sports halls will increase, less facility construction will be needed. Fewer school buildings and social and sportive facilities for students will be constructed and therefore construction materials, electricity, and transport vehicles will be saved. With increased teaching effectiveness, all schools will be able to offer a certain quality of education that meets the basic expectations of students and parents. In this case, parents and students will not prefer more qualified schools located far from their homes, but will go to the school in their own neighborhood. Thus, there will be no need for shuttle buses to transport students to school, and the vehicles and fuel used for traveling will be saved.
As another notable result of our study, the scores assigned to CSFs were significantly higher than those assigned to KPIs. This result suggests that school administrators should focus more on the fundamental factors that drive success rather than solely on detailed performance measurement. Such an approach could lead to more effective resource allocation and better identification of strategic priorities.
The application of our BSC model in two different high schools demonstrated its practical usability. Beşiktaş Anatolian High School achieved a weighted BSC score of 81.12, while Cağaloğlu Anatolian High School scored 92.52. These results provide a framework for comparing school performances and identifying areas for improvement. The schools scored highest on the factors of “Percentage of Satisfied Students” and “Experienced Teaching Staff”, which aligns with our core results.

4. Conclusions and Future Studies

The presented study answered the following research questions:
  • What are CSFs and KPIs for schools? We firstly identified 19 different CSFs and KPIs that influence the success of schools through literature research, participant evaluations, and statistical analyses.
  • What are the SWOT factors for schools? We have identified 50 CSFs and KPIs for schools as a result of literature research and identified the 18 most important ones through participant evaluations and statistical analyses.
  • Can a school-specific BSC be developed and implemented? We developed a performance measurement system with school-specific objectives and measurement criteria and implemented it in four schools.
This study presents an integrated approach for identifying critical success factors and measuring performance in schools. Through the FCM and SWOT analyses, “Experienced Teaching Staff”, “Lecturing”, and “Qualified Students” were identified as the most critical success factors. The developed BSC model was successfully implemented at Beşiktaş Anatolian High School (81.12), Cağaloğlu Anatolian High School (92.52), Selçuk Technical High School (67.89), and Sultanahmet Technical High School (77.58).
This model promotes sustainable success by facilitating the systematic measurement of school performance and the enhancement of underperforming areas. School administrations will conduct an annual review of their CSFs and KPIs, recalculating their BSC scores. In doing so, they will align key performance indicators with institutional goals. Consequently, institutions can take the necessary actions to achieve their strategic objectives. Identifying which CSFs require improvement to boost school performance will assist institutions in progressing toward a more promising future and increasing managerial effectiveness. Resources can be allocated to the most critical areas, ensuring a more strategic and impactful utilization of institutional capabilities.
The BSC is a strategic framework that extends beyond financial evaluations by offering a comprehensive assessment of an institution’s past, present, and future positioning. By translating strategic objectives into clear and understandable targets, the model enhances stakeholder engagement and fosters institutional commitment. Furthermore, the BSC mobilizes the institution by uniting stakeholders with diverse objectives and interests around a shared goal.
The BSC enables schools to recognize their shortcomings and take corrective measures. Meetings and training can be organized involving all stakeholders on issues related to low BSC results in critical success factors. High BSC results can be used in the performance evaluation and remuneration policies of school employees. As a result of BSC studies, the school ensures its financial sustainability by increasing its revenues and reducing its expenses. According to BSC results, school administrations can find the opportunity to compare themselves with schools of similar quality and close location. Schools with high BSC scores are encouraged to take positive actions by telling other schools about how they achieved this success. Differences between BSC practices at different levels such as primary school and university can be analyzed and new sample practices can be tried.
However, we would still caution against an over-reliance on quantitative indicators such as KPIs in complex educational environments. Schools are dynamic institutions characterized by frequent disruptions, high levels of student and parent mobility, and varying levels of awareness regarding performance measurement practices. To address these challenges and ensure a more comprehensive and context-sensitive evaluation, we recommend that KPI-based assessments be complemented with professional judgment and qualitative insights.
Our model demonstrates that implementing the BSC in schools is one of the most effective tools for assessing institutional sustainability performance. The three dimensions of sustainability—social, environmental, and economic—can be seamlessly integrated into the traditional BSC framework. Furthermore, schools can enhance the developed school BSC model by incorporating a new sustainability dimension that encompasses social, economic, and environmental perspectives. This integration allows schools to effectively monitor and measure their progress in sustainability [108,109,110]. As emphasized by Aydın and Varıcı (Aydın) [99], the weighting of sustainability variables should be increased. This study aims to enhance the social dimension of sustainability by focusing on social benefits in public schools, the economic dimension through parent and student satisfaction in private schools, and the environmental dimension by improving the efficiency of institutions operating at full capacity.
The balanced scorecard (BSC) model can be adapted to different levels of education, including primary schools. In this context, the combined “students and parents” dimension should be separated into two distinct dimensions, as parental involvement is typically more prominent in primary education than in secondary education. Moreover, new factors related to student safety, security, and psychological well-being should be integrated into the student dimension. The “teaching” dimension may also be reframed as “gaming and curiosity” to better reflect pedagogical approaches appropriate for younger learners. To enhance clarity and usability, the CSFs, KPIs, and dimensions currently presented in textual form should be supplemented with figures and visual elements. The overall BSC template should also be simplified by reducing the number of evaluation criteria for easier implementation at the primary school level.
The BSC model can also be applied in international contexts. Initially, countries with high PISA scores—particularly developed nations—could be considered for adaptation using customized templates for each educational level. For example, primary education may require more dimensions and factors compared to a more general model. Conversely, in countries with lower PISA scores, a single simplified BSC template could be developed for use across all education levels, thereby increasing applicability and ease of use. As a starting point, pilot studies could be conducted in relatively more developed institutions, such as universities, to assess and refine the implementation process.
This model that we have developed could be adapted to schools in other countries, especially countries like Mexico, Brazil, Indonesia, and the Philippines, whose PISA scores are similar to Türkiye [51]. Also, Azerbaijan, Greece, Italy, and Romania, which are geographically close to Türkiye and have a similar social structure, can adapt the model for their countries easily.
Some countries have more experience and know-how in BSC implementation. Performance measurement is of interest in these countries. Trial of this study in these countries will increase the chances of success of the application. The most prolific countries for BSC research are 1. The United States (Total Publications (TP): 198), 2. The United Kingdom (TP: 174), 3. Australia (TP: 102), 4. Taiwan (TP: 73), 5. Italy (TP: 63), 6. Canada (TP: 54), and 7. Spain (TP: 53) [111].
Based on our research findings, we have several recommendations for school administrators. Prioritizing the recruitment and professional development of qualified and experienced teachers is essential. It is important to improve teachers’ financial conditions and provide them with opportunities to enhance their effectiveness and motivation. Diverse strategies should be developed to attract high-achieving students and increase current students’ satisfaction with their education. Support programs should be implemented to alleviate performance anxiety and improve study techniques for high-achieving students. Additionally, the physical conditions of schools should be enhanced, and educational institutions should leverage the advantages offered by central locations. School performance should be assessed periodically and monitored using integrated methods, such as the BSC.
Our study does not assess the long-term impacts of BSC implementation in schools. As noted by Pereira and Melão [29], regulatory changes and the potential obsolescence of BSC may present challenges in practice. Future research should investigate the continuity and impact of BSC applications, ensuring that, as proposed by Yıldız [36], updates are made at the conclusion of each academic term.
We must take a precaution to validate the model longitudinally. The aims and priorities of schools may change due to changes in student behavior, the education system, and environmental conditions. Therefore, CFSs and KPIs within the BSC should be re-evaluated and updated every year. Research findings should be transferred to postgraduate students so that they can be the subject of new scientific studies. The researcher should base their new publications on this research. The research topic should be included in the scope of scientific publication incentives and the study should be supported by the public with scholarships.
This study has certain limitations, including sample size and regional constraints. The sample of our study is limited to one city and one country. However, the fact that Istanbul receives intensive migration from every city in the country and every country in the region will increase the representativeness of the sample. Since all participating schools operate under the same National Ministry of Education, consistency in the education system provides a degree of comparability across institutions. However, since Istanbul is a metropolitan city, it may be difficult to generalize to schools in small cities. Furthermore, the applicability of the findings to countries with different educational structures, climatic conditions, or cultural contexts may be limited. Future studies involving diverse regions and international comparisons are recommended to improve the generalizability of the model. Future studies should explore the sustainability of BSC applications, place greater emphasis on sustainability variables, and conduct research with larger and more diverse samples to ensure enhanced generalizability.

Author Contributions

Conceptualization: C.Ş. and D.Ö.; Formal analysis: D.Ö. and C.Ş.; Methodology: C.Ş. and D.Ö.; Project administration: D.Ö.; Resources: İ.H., D.Ö. and C.Ş.; Software: C.Ş.; Supervision: C.Ş. and D.Ö.; Validation: C.Ş.; Visualization: İ.H. and D.Ö.; Writing—original draft: İ.H.; Writing—review and editing: İ.H. and C.Ş. All authors have read and agreed to the published version of the manuscript.

Funding

This research received no external funding.

Institutional Review Board Statement

This study was conducted in accordance with the Declaration of Helsinki (1975, revised in 2013), and the protocol was approved by the Ethics Committee of Social Sciences and Humanities Research of Yıldız Technical University (project identification code: 20241003382) on [date of approval: 31 October 2024]. Additionally, approval for research and statistical purposes was obtained from the Istanbul Provincial Directorate of National Education.

Informed Consent Statement

Not applicable.

Data Availability Statement

The raw data supporting the conclusions of this article will be made available by the authors on request.

Conflicts of Interest

The authors declare no conflicts of interest.

Abbreviations

The following abbreviations are used in this manuscript:
CSFsCritical Success Factors
KPIsKey Performance Indicators
ESGEnvironmental, Social, and Governance
BSCBalanced Scorecard
FCMFuzzy Cognitive Mapping
CMCognitive Mapping
SWOTStrengths, Weaknesses, Opportunities, and Threats
HEEEHigher Education Entrance Exam
HSEEHigh School Entrance Exam
PISAProgramme for International Student Assessment
TIMSSTrends in International Mathematics and Science Study
BAHSBeşiktaş Anatolian High School
CAHSCağaloğlu Anatolian High School
SETHSSelçuk Technical High School
SUTHSSultanahmet Technical High School

References

  1. Gunduz, M.; Almuajebh, M. Critical success factors for sustainable construction project management. Sustainability 2020, 12, 1990. [Google Scholar] [CrossRef]
  2. Multan, E.; Wójcik-Augustyniak, M.; Sobotka, B.; Bis, J. Application of performance and efficiency indicators in measuring the level of success of public universities in Poland. Sustainability 2023, 15, 13673. [Google Scholar] [CrossRef]
  3. Fayaz, A.; Kamal, Y.; Amin, S.U.; Khan, S. Critical success factors in information technology projects. Manag. Sci. Lett. 2017, 7, 73–80. [Google Scholar] [CrossRef]
  4. Mittal, V.; Jung, J. Revitalizing educational institutions through customer focus. J. Acad. Mark. Sci. 2024, 52, 1323–1342. [Google Scholar] [CrossRef]
  5. Helmy, R.; Khourshed, N.; Wahba, M.; Bary, A.-A.-E. Exploring critical success factors for public private partnership case study: The educational sector in Egypt. J. Open Innov. Technol. Mark. Complex. 2020, 6, 142. [Google Scholar] [CrossRef]
  6. Kulminskaya, A. “Success Formula”: Factors of educational success/failure in the assessments of Russian schoolchildren. In INTED2021 Proceedings; IATED: Seville, Spain, 2021; pp. 8318–8323. [Google Scholar] [CrossRef]
  7. Alqahtani, A.Y.; Rajkhan, A.A. E-learning critical success factors during the covid-19 pandemic: A comprehensive analysis of e-learning managerial perspectives. Educ. Sci. 2020, 10, 216. [Google Scholar] [CrossRef]
  8. König, C.M.; Karrenbauer, C.; Breitner, M.-H. Critical success factors and challenges for individual digital study assistants in higher education: A mixed methods analysis. Educ. Inf. Technol. 2022, 28, 4475–4503. [Google Scholar] [CrossRef]
  9. Salmeron, J.L. Augmented fuzzy cognitive maps for modelling LMS critical success factors. Knowl.-Based Syst. 2009, 22, 275–278. [Google Scholar] [CrossRef]
  10. Alexander, I.; Robertson, S. Understanding project sociology by modeling stakeholders. IEEE Softw. 2004, 21, 23–27. [Google Scholar] [CrossRef]
  11. Nguyen, T.S.; Mohamed, S. Mediation Effect of Stakeholder Management between Stakeholder Characteristics and Project Performance. J. Eng. Proj. Prod. Manag. 2021, 11, 2. [Google Scholar]
  12. Sayın, A.; Gelbal, S. Scaling the importance levels of factors affecting success using the successive intervals method. Amasya Univ. J. Fac. Educ. 2014, 3, 1–26. [Google Scholar]
  13. Yılmaz, K.; Celik, M. The views of teachers and school administrators on effective school. J. Turk. Educ. Sci. 2023, 21, 260–286. [Google Scholar] [CrossRef]
  14. Titrek, O.; Delioglan, M.; Ipekli, N. Effective school research in Turkey: Content analysis of articles (2000–2020). Bartın Univ. J. Fac. Educ. 2021, 10, 586–597. [Google Scholar] [CrossRef]
  15. Rockart, J.F. Chief executives define their own data needs. Harv. Bus. Rev. 1979, 57, 81–93. [Google Scholar] [PubMed]
  16. Rodriguez-repiso, L.; Sethchi, R.; Salmeron, J.L. Modelling IT projects success with fuzzy cognitive maps. Expert Syst. Appl. 2007, 32, 543–559. [Google Scholar] [CrossRef]
  17. AbuMoeilak, L.; AlQuraidi, A.; AlZarooni, A.; Beheiry, S. Critical success factors for building information modeling implementation as a sustainable construction practice in the UAE. Buildings 2023, 13, 1406. [Google Scholar] [CrossRef]
  18. Rasebotsa, A.R.; Agumba, J.N.; Adebowale, O.J.; Edwards, D.J.; Posillico, J. A Critical Success Factors Framework for the Improved Delivery of Social Infrastructure Projects in South Africa. Buildings 2024, 15, 92. [Google Scholar] [CrossRef]
  19. Kineber, A.F.; Oke, A.; Aliu, J.; Hamed, M.M.; Oputu, E. Exploring the adoption of cyber (digital) technology for sustainable construction: A structural equation modeling of critical success factors. Sustainability 2023, 15, 5043. [Google Scholar] [CrossRef]
  20. Zahoor, M.H.; Ali, M. Assessment of Critical Success Factors for Building Projects through the Literature. Eng. Proc. 2023, 53, 45. [Google Scholar] [CrossRef]
  21. Daniel, D.R. Management information crisis. Harv. Bus. Rev. 1961, 39, 111–121. [Google Scholar]
  22. Howell, M.T. Critical Success Factors Simplified: Implementing the Powerful Drivers of Dramatic Business Improvement; CRC Press: Boca Raton, FL, USA, 2009. [Google Scholar]
  23. Sezer, N. Critical Success Factors. Available online: https://neslihansezerblog.com/2018/02/23/kritik-basari-faktorleri/ (accessed on 7 April 2025).
  24. Wang, H.; Wu, J.; Muhedaner, M.; Maihemuti, S. College students online education evaluation through SWOT analysis during COVİD-19. IEEE Access 2022, 10, 88371–88385. [Google Scholar] [CrossRef]
  25. Cıkmaz, E.; Kılıç, B. SWOT analysis in educational institutions: The example of universities in Turkey. Int. J. Discip. Econ. Adm. Sci. Stud. 2023, 9, 1239–1253. [Google Scholar] [CrossRef]
  26. Peris-Ortiz, M.; García-Hurtado, D.; Devece, C. Influence of the balanced scorecard on the science and innovation performance of Latin American universities. Knowl. Manag. Res. Pract. 2019, 17, 373–383. [Google Scholar] [CrossRef]
  27. Hladchenko, M. Balanced Scorecard—A strategic management system of the higher education institution. Int. J. Educ. Manag. 2015, 29, 167–176. [Google Scholar] [CrossRef]
  28. Kokcam, A.H.; Kubat, C. A model for measuring school performance. In Proceedings of the 3rd International Symposium on Innovative Technologies in Engineering and Science (ISITES 2015), Valencia, Spain, 3–5 June 2015; pp. 465–471. [Google Scholar]
  29. Pereira, M.M.; Filipe Melão, N. The implementation of the balanced scorecard in a school district: Lessons learned from an action research study. Int. J. Product. Perform. Manag. 2012, 61, 919–939. [Google Scholar] [CrossRef]
  30. de Jesus Alvares Mendes Junior, I.; Alves, M.-D.-C. The balanced scorecard in the education sector: A literature review. Cogent Educ. 2022, 10, 2160120. [Google Scholar] [CrossRef]
  31. Sahin, Y.; Kasap, S.S. Organizational Performance: A National Literature Review. Kocaeli Univ. J. Sci. 2021, 4, 83–93. [Google Scholar] [CrossRef]
  32. Meechang, K.; Watanabe, K. Modeling to achieve area business continuity management implementation via a fuzzy cognitive map. Sustainability 2023, 15, 13531. [Google Scholar] [CrossRef]
  33. Sudhagar, C. Role of fuzzy cognitive maps in smart education system. In Proceedings of the 2019 4th MEC International Conference on Big Data and Smart City (ICBDSC), Muscat, Oman, 15–16 January 2019; pp. 1–6. [Google Scholar] [CrossRef]
  34. Coskun, A.; Nizaeva, M. Strategic Performance Management Using the Balanced Scorecard in Educational Institutions. Open Educ. Stud. 2023, 5, 20220198. [Google Scholar] [CrossRef]
  35. Zohrabi, A.; Manteghi, N. A proposed model for strategic planning in educational organizations. Procedia-Soc. Behav. Sci. 2011, 28, 205–210. [Google Scholar] [CrossRef]
  36. Yıldız, D. Balanced Scorecard, SWOT Analysis and Application in Strategic Management. Alanya Acad. Rev. J. 2021, 5, 1181–1193. [Google Scholar] [CrossRef]
  37. Ip, Y.K.; Koo, L.C. BSQ strategic formulation framework: A hybrid of balanced scorecard, SWOT analysis and quality function deployment. Manag. Audit. J. 2004, 19, 533–543. [Google Scholar] [CrossRef]
  38. Glykas, M. Fuzzy cognitive strategic maps in business process performance measurement. Expert Syst. Appl. 2013, 40, 1–14. [Google Scholar] [CrossRef]
  39. Lee, S.F.; Sai On Ko, A. Building balanced scorecard with SWOT analysis, and implementing “Sun Tzu’s The Art of Business Management Strategies” on QFD methodology. Manag. Audit. J. 2000, 15, 68–76. [Google Scholar] [CrossRef]
  40. Manteghi, N.; Zohrabi, A. A proposed comprehensive framework for formulating strategy: A Hybrid of balanced scorecard, SWOT analysis, porter‘s generic strategies and Fuzzy quality function deployment. Procedia-Soc. Behav. Sci. 2011, 15, 2068–2073. [Google Scholar] [CrossRef]
  41. Keok, C.B.; Thong, L.K. Work in progress-integrating bos, swot analysis, balanced scorecard and outcome-based framework for strategy formulation of engineering school. In Proceedings of the 2007 37th Annual Frontiers In Education Conference-Global Engineering: Knowledge Without Borders, Opportunities Without Passports, Milwaukee, WI, USA, 10–13 October 2007; p. S4F-13-S4F-14. [Google Scholar]
  42. OECD. PISA 2022 Results (Volume I and II)—Country Notes: Türkiye. 2023. Available online: https://www.oecd.org/en/publications/pisa-2022-results-volume-i-and-ii-country-notes_ed6fbcc5-en/turkiye_d67e6c05-en.html (accessed on 26 March 2025).
  43. Sarıer, Y. Turkey’s Performance in PISA Applications and Variables Predictive of Student Success. Turk. J. Soc. Res. 2021, 25, 905–926. [Google Scholar]
  44. Republic of Türkiye Ministry of National Education. 2023–2024 Education Statistics Announced. 2023. Available online: https://www.meb.gov.tr/2023-2024-egitim-ogretim-istatistikleri-aciklandi/haber/34977/tr (accessed on 26 March 2025).
  45. Nunes, C.; Oliveira, T.; Santini, F.-D.-O.; Castelli, M.; Cruz-Jesus, F. A weight and meta-analysis on the academic achievement of high school students. Educ. Sci. 2022, 12, 287. [Google Scholar] [CrossRef]
  46. United Nations. Sustainable Development Goals. Guidelines for the Use of the SDG Logo. 2023. Available online: https://www.un.org/sustainabledevelopment/wp-content/uploads/2019/01/SDG_Guidelines_AUG_2019_Final.pdf (accessed on 11 May 2025).
  47. United Nations. Sustainable Development Goals. 2024. Available online: https://unstats.un.org/sdgs/indicators/indicators-list/ (accessed on 26 March 2025).
  48. United Nations. UN Department of Economic and Social Affairs. 2023. UN Department of Economic and Social Affairs. The Sustainable Development Goals Report 2023. Available online: https://unstats.un.org/sdgs/report/2023/ (accessed on 11 May 2025).
  49. Alenezi, M.; Alanazi, F. Integrating environmental social and governance values into higher education curriculum. Int. J. Eval. Res. Educ. 2024, 13, 3493–3503. [Google Scholar] [CrossRef]
  50. Dsouza, S.; Krishnamoorthy, K.; Kayani, U.; Kayani, F.; Hasan, F. Sustainable investing: ESG effectiveness and market value in OECD regions. Cogent Econ. Financ. 2025, 13, 2445147. [Google Scholar] [CrossRef]
  51. Republic of Türkiye Ministry of National Education. PISA Results Show That Türkiye Has Consistently İncreased İts Success in the 20-Year Period. 2022. Available online: https://www.meb.gov.tr/pisa-results-show-that-turkiye-has-consistently-increased-its-success-in-the-20-year-period/haber/31839/en (accessed on 26 March 2025).
  52. Kleemola, K.; Hyytinen, H. Exploring the Relationship between Law Students’ Prior Performance and Academic Achievement at University. Educ. Sci. 2019, 9, 236. [Google Scholar] [CrossRef]
  53. Jackson, C.K.; Kiguel, S.; Porter, S.C.; Easton, J.Q. Who benefits from attending effective high schools? J. Labor Econ. 2024, 42, 717–751. [Google Scholar] [CrossRef]
  54. Eranıl, A.K. School Dropout Causes in Turkish Education System (2009–2022): A Pareto Analysis by Grade Level. J. Theor. Educ. Sci. 2024, 17, 451–477. [Google Scholar] [CrossRef]
  55. Ozan, M.B.; Polat, H.; Gunduzalp, S.; Yaras, Z. SWOT analysis in educational institutions. Turk. J. Educ. Stud. 2015, 2, 1–28. [Google Scholar]
  56. Cobbold, I.; Lawrie, G. The development of the balanced scorecard as a strategic management tool. Perform. Meas. Assoc. 2002, 35, 37–56. [Google Scholar]
  57. Cavlak, H. The Relationship Between Key Performance Indicators And Critical Success Factors: An Airline Company Application. Marmara Univ. J. Econ. Adm. Sci. 2021, 43, 78–99. [Google Scholar]
  58. Groumpos, P.P. Modelling business and management systems using fuzzy cognitive maps: A critical overview. IFAC-Pap. 2015, 48, 207–212. [Google Scholar] [CrossRef]
  59. Buyukozkan, G.; Vardaloglu, Z. Analyzing CPFR success factors using fuzzy cognitive maps in the retail industry. Expert Syst. Appl. 2012, 39, 10438–10455. [Google Scholar] [CrossRef]
  60. Bevilacqua, M.; Ciarapica, F.E.; Marcucci, G.; Mazzuto, G. Fuzzy cognitive maps approach for analysing the domino effect of factors affecting supply chain resilience: A fashion industry case study. Int. J. Prod. Res. 2020, 58, 6370–6398. [Google Scholar] [CrossRef]
  61. Azadeh, A.; Salehi, V.; Arvan, M.; Dolatkhah, M. Assessment of resilience engineering factors in high-risk environments by fuzzy cognitive maps: A petrochemical plant. Saf. Sci. 2014, 68, 99–107. [Google Scholar] [CrossRef]
  62. Nápoles, G.; Papageorgiou, E.; Bello, R.; Vanhoof, K. On the convergence of sigmoid fuzzy cognitive maps. Inf. Sci. 2016, 349, 154–171. [Google Scholar] [CrossRef]
  63. Singh, P.K.; Chudasama, H. Pathways for climate resilient development: Human well-being within a safe and just space in the 21st century. Glob. Environ. Change 2021, 68, 102277. [Google Scholar] [CrossRef]
  64. Institute for Manufacturing (IFM). SWOT (Strengths, Weaknesses, Opportunities, Threats). 2016. Available online: https://www.ifm.eng.cam.ac.uk/research/dstools/swot/ (accessed on 26 March 2025).
  65. Balamuralikrishna, R.; Dugger, J.C. SWOT Analysis--A management tool for initiating new programs in vocational schools. J. Vocat. Tech. Educ. 1995, 12, 36–41. [Google Scholar] [CrossRef]
  66. Kaplan, R.S.; Norton, D.P. The Strategy-Focused Organization, 1st ed.; Harvard Business Review Press: Cambridge, MA, USA, 2001; p. 29. ISBN 13-978-1578512508. [Google Scholar]
  67. al-Bahi, A.M.; abd-Elwahed, M.S.; Soliman, A.Y. Implementation of sustainability indicators in engineering education using a combined balanced scorecard and quality function deployment approaches. Sustainability 2021, 13, 7083. [Google Scholar] [CrossRef]
  68. Ozesmi, U. The Wants and Desires of the Local Population Based on Cognitive Mapping, Yusufeli Damlake Resettlement Plan), State Hydraulic Works; Sahara Engineering: Ankara, Turkey, 2001; pp. 154–169. [Google Scholar]
  69. Erkan, E.F.; Uygun, O.; Demir, H.I. An Evaluation Model for Green Supply Chain Management Using Fuzzy Cognitive Maps. Acad. Platf.-J. Eng. Sci. 2017, 5, 26–34. [Google Scholar]
  70. Erkan, E.F.; Uygun, O.; Kiraz, A. A novel approach for institutionalization analysis based on fuzzy cognitive maps. Sak. Univ. J. Sci. 2018, 22, 557–571. [Google Scholar]
  71. Tuncer, A.I.; Tuncer, M.U. Evaluation of Factors Affecting Public Relations Decision Making Processes by Cognitive Mapping Method. Galatasaray Univ. J. Commun. 2017, 27, 33–56. [Google Scholar]
  72. Arvan, M.; Omidvar, A.; Ghodsi, R. Intellectual capital evaluation using fuzzy cognitive maps: A scenario-based development planning. Expert Syst. Appl. 2016, 55, 21–36. [Google Scholar] [CrossRef]
  73. Altun, F. A Comparative Regional Mapping Study on The Obstacles Perceived by Tourism Students in Front of Their Entrepreneurial Activities. Master’s Thesis, Kocaeli University, Kocaeli, Turkey, 2021. [Google Scholar]
  74. Jenkins, M. Thinking about growth: A cognitive mapping approach to understanding small business development. J. Small Bus. Enterp. Dev. 1994, 1, 29–37. [Google Scholar] [CrossRef]
  75. Ambrosini, V.; Bowman, C. Reducing Causal Ambiguity To Facilitate Strategic Learning. Manag. Learn. 2005, 36, 493–512. [Google Scholar] [CrossRef]
  76. Yavas, A. Using Cognitive Map Method in Strategy Development: An Application. Ph.D. Thesis, Kocaeli University, Kocaeli, Turkey, 2009. [Google Scholar]
  77. Saruhan, S.C.; Ozdemirci, A. Science, Philosophy and Methodology: Method Problem in Research-SPSS Applied, 2nd ed.; Beta Press: Istanbul, Turkiye, 2011; p. 180. ISBN 978-605-377-499-0. [Google Scholar]
  78. Desicion Explorer. Desicion Explorer Users Guide. 2017. Available online: https://banxia.com/pdf/de/DEGuide.pdf (accessed on 10 May 2025).
  79. Cıgır, T. Performance Appraising Systems Application in Education Sector. Master’s Thesis, Marmara University, Istanbul, Turkey, 2006. [Google Scholar] [CrossRef]
  80. Pineno, C.J. The Business School Strategy: Continuous Improvement by Implementing the Balanced Scorecard. Res. High. Educ. J. 2007, 1, 77. [Google Scholar]
  81. O’Neil, H.F., Jr.; Bensimon, E.M.; Diamond, M.A.; Moore, M.R. Designing and implementing an academic scorecard. Change Mag. High. Learn. 1999, 31, 32–40. [Google Scholar] [CrossRef]
  82. Schobel, K.; Scholey, C. Balanced Scorecards in education: Focusing on financial strategies. Meas. Bus. Excell. 2012, 16, 17–28. [Google Scholar] [CrossRef]
  83. Ozmantar, Z.K. Using Balanced Scorecard as a Strategic Performance Management Tool in Schools. Ph.D. Thesis, Gaziantep University, Gaziantep, Türkiye, 2011. [Google Scholar]
  84. Karathanos, D.; Karathanos, P. Applying the balanced scorecard to education. J. Educ. Bus. 2005, 80, 222–230. [Google Scholar] [CrossRef]
  85. Gursoy, E.C. Developing a Model for Evaluation of Customer Relationship Management Technology Investment Decision and an Application. Master’s Thesis, Yıldız Technical University, Istanbul, Turkiye, 2013. [Google Scholar]
  86. Brown, R.S.; Wohlstetter, P.; Liu, S. Developing an indicator system for schools of choice: A balanced scorecard approach. J. Sch. Choice 2009, 2, 392–414. [Google Scholar] [CrossRef]
  87. Tanoba, T. Developing Balanced Scorecard in Official Secondary Schools and a Model Proposal. Master’s Thesis, Marmara University-Istanbul Sabahattin Zaim University, Istanbul, Turkiye, 2019. [Google Scholar]
  88. Bailey, A.R.; Chow, C.W.; Haddad, K.M. Continuous Improvement in Business Education: Insights from the For-Profit Sector and Business School Deans. J. Educ. Bus. 1999, 74, 165–180. [Google Scholar] [CrossRef]
  89. Agaoglu, E.; Simsek, Y.; Altınkurt, Y. Application of SWOT analysis in vocational high schools before strategic planning. Educ. Sci. 2006, 140, 43–55. [Google Scholar]
  90. Yelken, T.Y.; Kılıc, F.; Ozdemir, C. The strategic planning (SWOT) analysis outcomes and suggestions according to the students and the lecturers within the distance education system. Turk. Online J. Distance Educ. 2012, 13, 267–276. [Google Scholar]
  91. Karaman, A. SWOT Analysis in Strategic Plans of Universities. Master’s Thesis, Inonu University, Malatya, Turkiye, 2011. [Google Scholar]
  92. Pucciarelli, F.; Kaplan, A. Competition and strategy in higher education: Managing complexity and uncertainty. Bus. Horiz. 2016, 59, 311–320. [Google Scholar] [CrossRef]
  93. Barber, M.; Mourshed, M.; Whelan, F. Improving education in the Gulf. McKinsey Q. 2007, 3947, 101–116. [Google Scholar]
  94. Galyon, C.E.; Blondin, C.A.; Yaw, J.S.; Nalls, M.L.; Williams, R.L. The relationship of academic self-efficacy to class participation and exam performance. Soc. Psychol. Educ. 2012, 15, 233–249. [Google Scholar] [CrossRef]
  95. Ozkul, R.; Demirtas, H.; Ustuner, M. Perceptions of school principals regarding their schools (A study of a SWOT analysis). E-Int. J. Educ. Res. 2023, 14, 184–201. [Google Scholar] [CrossRef]
  96. Bosworth, R. Class size, class composition, and the distribution of student achievement. Educ. Econ. 2014, 22, 141–165. [Google Scholar] [CrossRef]
  97. Cruz-Jesus, F.; Castelli, M.; Oliveira, T.; Mendes, R.; Nunes, C.; Sa-Velho, M.; Rosa-Louro, A. Using artificial intelligence methods to assess academic achievement in public high schools of a European Union country. Heliyon 2020, 6, e04081. [Google Scholar] [CrossRef]
  98. Fischer, C.; Pardos, Z.A.; Baker, R.S.; Williams, J.J.; Smyth, P.; Yu, R.; Slater, S.; Baker, R.; Warschauer, M. Mining big data in education: Affordances and challenges. Rev. Res. Educ. 2020, 44, 130–160. [Google Scholar] [CrossRef]
  99. Aydın, A.; Varıcı, I. Use of Sustainability Balanced Scorecard Method in Performance Measurement: An Application In The Faculty of Dentistry. J. Account. Tax. Stud. 2022, 15, 183–211. [Google Scholar]
  100. Siambi, J.K. The Impact of Saudi Arabia’s Education Policies Under Vision 2030 on Student Performance: Saudi’s Progress Benchmarked with Malaysia’s Education Blueprint 2025. Adv. Soc. Sci. Manag. 2023, 1, 14–30. [Google Scholar]
  101. Brummet, Q. The effect of school closings on student achievement. J. Public Econ. 2014, 119, 108–124. [Google Scholar] [CrossRef]
  102. Karatay, Z.; Kurtulus, F.T.E. Public Policy Analysis: Primary Education Policies. Manag. Political Sci. Rev. 2022, 4, 108–128. [Google Scholar]
  103. Khamisu, M.S.; Paluri, R.A.; Sonwaney, V. Stakeholders’ perspectives on critical success factors for environmental social and governance (ESG) implementation. J. Environ. Manag. 2024, 365, 121583. [Google Scholar] [CrossRef]
  104. Afridi, S.A.; Ali, S.Z.; Zahid, R.M.A. Nurturing environmental champions: Exploring the influence of environmental-specific servant leadership on environmental performance in the hospitality industry. Environ. Sci. Pollut. Res. 2024, 31, 46281–46292. [Google Scholar] [CrossRef]
  105. Parameswar, N.; Hasan, Z.; Shri, C.; Saini, N. Exploring the barriers to ESG adoption using modified TISM approach. Kybernetes 2024, 53, 5775–5800. [Google Scholar] [CrossRef]
  106. Lin, M.H.; Hu, J.; Tseng, M.L.; Chiu, A.S.; Lin, C. Sustainable development in technological and vocational higher education: Balanced scorecard measures with uncertainty. J. Clean. Prod. 2016, 120, 1–12. [Google Scholar] [CrossRef]
  107. Li, X.; Dang, W.; Li, Y. Can ESG Performance Promote Corporate Green Transformation? Evidence from Green OFDI in China. Sustainability 2025, 17, 3255. [Google Scholar] [CrossRef]
  108. Hansen, E.G.; Schaltegger, S. Sustainability balanced scorecards and their architectures: Irrelevant or misundertood? J. Bus. Ethics 2018, 150, 937–952. [Google Scholar] [CrossRef]
  109. Ozcelik, F. Sustainability Performance Report Card. Yaşar University E-Journal. 2013, 8, 30. [Google Scholar] [CrossRef]
  110. White, G.B. How to report a company’s sustainability activities. Manag. Account. Q. 2005, 7, 36–44. [Google Scholar]
  111. Kumar, S.; Lim, W.M.; Sureka, R.; Jabbour, C.J.C.; Bamel, U. Balanced scorecard: Trends, developments, and future directions. Rev. Manag. Sci. 2024, 18, 2397–2439. [Google Scholar] [CrossRef]
Figure 1. Onion diagram of critical success factors in schools: This diagram presents a layered (onion-like) visualization of key school stakeholders surrounding the core concept of “Critical Success Factors in Schools.” The inner circle represents the central theme, while the outer layer includes four primary stakeholders: Student, Teacher, Parent, and School Administrator. This visual emphasizes the interconnected roles of each stakeholder group in achieving school success.
Sustainability 17 04497 g001
Figure 2. How individual actions link to organizational vision via KPIs (key performance indicators) and CSFs.
Sustainability 17 04497 g002
Figure 3. Agenda 2030 and the 17 sustainable development goals.
Sustainability 17 04497 g003
Figure 4. Stages of the proposed methodology: FCM is a method for modeling and analyzing causal relationships between concepts; SWOT is a strategic tool for evaluating internal and external factors; BSC is a framework for measuring organizational performance across multiple dimensions.
Sustainability 17 04497 g004
Figure 5. School BSC model and dimensions.
Sustainability 17 04497 g005
Figure 6. Fuzzy cognitive map of the group model.
Sustainability 17 04497 g006
Figure 7. Radar graph for analysis scores of critical success factors [29,55,79,80,81,82,83,84,85].
Sustainability 17 04497 g007
Figure 8. Radar graph for analysis scores of key performance indicators [29,80,82,86,87,88].
Sustainability 17 04497 g008
Table 1. Calculation table for KPIs score and BSC score.
NoKey Performance IndicatorKPI Score Calculation BasisKPI Score RangeBSC Score
25Quality of Students Admitted HSEE-HSEE Percentile(Current—Achieved Percentile Rank)/
(Current—Targeted Percentile Rank)
0.81 ≤ KPI ≤ 1.00
0.61 ≤ KPI ≤ 0.80
0.41 ≤ KPI ≤ 0.60
0.21 ≤ KPI ≤ 0.40
0.00 ≤ KPI ≤ 0.20
1.0
0.8
0.6
0.4
0.2
30HEEE and Practice Test ResultsNumber of Students Placed in
University/Number of Students
Taking the Exam
Same ranges as KPI 25Same scores as KPI 25
32Percentage of Satisfied StudentsSatisfied Students/Total StudentsSame ranges as KPI 25Same scores as KPI 25
34Sample Question Applications
Similar to HEEE
Weekly HEEE Preparation Course Hours/Total Weekly Course HoursSame ranges as KPI 25Same Scores as KPI 25
35Frequency of HEEE Practice Exam ApplicationsWeekly: 1.00
Every 15 Days: 0.80
Every 3 Weeks: 0.60
Monthly: 0.40
Over 1 Month: 0.20
Direct Score Assignments1.0
0.8
0.6
0.4
0.2
37Percentage of Achievement of the Objectives of the Student
Recovery Plan
Ratio of Students Accepted to their Targeted ProgramsSame ranges as KPI 25Same scores as KPI 25
41Ratio of Financial Assets to LiabilitiesFinancial Payments and Liabilities/
Financial Assets and Revenues
≥1.00
0.81–0.99
0.61–0.80
0.41–0.60
0.00–0.40
1.0
0.8
0.6
0.4
0.2
43Percentage of New Graduates, InternNumber of New Graduates, Intern and0.00 ≤ KPI ≤ 0.201.0
and Trainee TeachersTrainee Teachers/0.21 ≤ KPI ≤ 0.400.8
Total Number of Teachers0.41 ≤ KPI ≤ 0.600.6
0.61 ≤ KPI ≤ 0.800.4
0.81 ≤ KPI ≤ 1.000.2
46Percentage of Successful TeachersNumber of Successful Teachers/
Total Number of Teachers
Same ranges as KPI 25Same scores as KPI 25
Abbreviations: HSEE: High School Entrance Exam HEEE: Higher Education Entrance Exam.
Table 2. Critical SWOT factors.
Strengths [55,89,90,91]Frequency Count of ResponsesWeaknesses [89,92]Frequency Count of Responses
1. Experienced Teaching Staff (51)2081. Social and Sportive Activities (61)103
2. Good Communication with Teachers (58)1432. Being a Free Public Service Provided by the State (62)80
3. Well-Educated and Qualified Students (52)138
4. Having High Achievement of the School (53) 131
Opportunities [55,91,92]Frequency Count of ResponsesThreats [65,89]Frequency Count of Responses
1. Having Ideal Class Size in Classrooms (68)1521. Improper Use of Internet (76)95
2. School Being in the City-District Center (71)1462. Students’ Preference for Academic High Schools (74)74
3. Rise in Demand for Higher Education (64)112
4. Increasing and Changing Student Population (65)105
Table 3. Statistical significance levels of CSFs and KPIs weights.
Main DimensionsCritical Success Factors (CSFs)Stat. Sig. (CSFs)Key Performance Indicators (KPIs)Stat. Sig. (KPIs)KPIs Weights (%)
Students and Parents1. Well-Educated and Qualified Students (2)p < 0.01 *1.1. Quality of Students Admitted HSEE-HSEE Percentile (25)p > 0.054.54
1.2. Successful Results in HEEE (5)p < 0.05 1.2. HEEE and Practice Test Results (30)p > 0.0510.10
1.3. Proper Use of the Internet (76)
1.4. Retaining Existing Students (8)p < 0.01
1.5. Students’ Satisfaction with Teaching Quality (4)
1.6. Effective Guidance and Counseling (7)1.3. Percentage of Satisfied Students (32)p < 0.05 22.22
1.7. Having Ideal Class Size in Classrooms (68)
1.8. Good Communication with Teachers (58)p < 0.01
1.9. Social and Sportive
Activities (61)
Teaching2.1. Good Lecturing and
Problem Solving (10)
p < 0.001 2.1. HEEE Equivalent Question Solving (34)p > 0.053.03
2.2. Increasing the Effectiveness of Teaching (23)2.2. Frequency of HEEE Practice Exam Applications (35)p > 0.053.03
2.3. Ensuring Equal Opportunities for All Students (14)2.3. Percentage of Achievement of the Objectives of the Student Recovery Plan (37)p > 0.0514.64
2.4. Having High Achievement of the School (53)p < 0.01
School Administration3.1. Sustainable Profitability (17)p < 0.05 3.1. Ratio of Financial Assets to Liabilities (41)
3.2. School Being in the
City-District Center (71)
Human Resources4.1. Experienced Teaching Staff (22, 51)p < 0.001 4.1. Percentage of New Graduates, Intern and Trainee Teachers (43)p > 0.0516.68
4.2. Percentage of Successful Teachers (46)p > 0.0515.64
Total 100.00
Note: HSEE: High School Entrance Exam. HEEE: Higher Education Entrance Exam. “*” indicates statistical significance at the level of p < 0.01.
Table 4. BSC table of high schools.
Critical Success Factors
and Dimensions
Key Performance
Indicators (KPIs)
Weighted BSC Score
(BAHS)
Weighted BSC Score
(CAHS)
Weighted BSC Score
(SETHS)
Weighted BSC Score
(SUTHS)
Students and Parents
1.1. Well-Educated and Qualified Students (2.52)1.1. Quality of Students Admitted HSEE-HSEE Percentile (25)4.544.540.910.91
1.2. Successful Results in HEEE (5)1.2. HEEE and Practice Test Results (30)10.1010.106.064.04
1.3. Proper Use of the Internet (76)
1.4. Retaining Existing Students (8)
1.5. Students’ Satisfaction with Teaching Quality (4)
1.6. Effective Guidance and Counseling (7)1.3. Percentage of Satisfied Students (32)17.7822.2222.2222.22
1.7. Having Ideal Class Size in Classrooms (68)
1.8. Good Communication with Teachers (58)
1.9. Social and Sportive
Activities (61)
Teaching
2.1. Good Lecturing and Problem Solving (10)2.1. HEEE Equivalent Question Solving (34)1.821.821.213.03
2.2. Increasing the Effectiveness of Teaching (23)2.2. Frequency of HEEE Practice Exam Applications (35)3.033.030.610.61
2.3. Ensuring Equal Opportunities for All Students (14)2.3. Percentage of Achievement of the Objectives of the Student Recovery Plan (37)11.7214.645.868.79
2.4. Having High Achievement of the School (53)
School Administration
3.1. Sustainable Profitability (17)3.1. Ratio of Financial Assets to Liabilities (41)6.0610.1010.1010.10
3.2. School Being in the City-District Center (71)
Human Resources
4.1. Experienced Teaching Staff (22, 51)4.1. Percentage of New Graduates, Intern and Trainee Teachers (43)16.6816.6816.6813.34
4.2. Percentage of Successful Teachers (46)9.399.396.2612.51
81.1292.5267.8977.58
Abbreviations: BSC: Balanced Scorecard. HEEE: Higher Education Entrance Exam. HSEE: High School Entrance Exam. KPIs: Key Performance Indicators.
Table 5. Reliability analysis results of the scales used in this study.
ScaleNumber of ItemsCronbach’s AlphaReliability Assessment
FCM Critical Success Factors Scale 3090.87High Reliability
SWOT Analysis Factors Scale270.83High Reliability
Note: A Cronbach’s alpha value > 0.80 is considered to indicate high reliability, while values between 0.70 and 0.80 indicate good reliability.
Disclaimer/Publisher’s Note: The statements, opinions and data contained in all publications are solely those of the individual author(s) and contributor(s) and not of MDPI and/or the editor(s). MDPI and/or the editor(s) disclaim responsibility for any injury to people or property resulting from any ideas, methods, instructions or products referred to in the content.

