Article

A Unified Generalized Extreme Value Distribution Framework for Estimating Lake Reference Nutrient Conditions with Confidence Intervals: A Case Study of Hongze Lake, China

1
School of Environmental Science and Engineering, Yangzhou University, Yangzhou 225127, China
2
School of Hydraulic Science and Engineering, Yangzhou University, Yangzhou 225127, China
3
Jiangsu Rural Water Conservancy Science and Technology Development Center, Nanjing 210029, China
4
Huaihe River Basin Eco-Environmental Monitoring and Scientific Research Center of Huaihe River Basin Ecological Environmental Supervision and Administration Bureau, Ministry of Ecology and Environment of People’s Republic of China (MEE), Bengbu 233000, China
*
Author to whom correspondence should be addressed.
Sustainability 2025, 17(10), 4465; https://doi.org/10.3390/su17104465
Submission received: 31 March 2025 / Revised: 30 April 2025 / Accepted: 12 May 2025 / Published: 14 May 2025
(This article belongs to the Special Issue Lakes and Rivers Ecological Protection and Water Quality)

Abstract

:
The scientific determination of reference conditions for lake nutrients is fundamental for establishing ecologically sustainable nutrient criteria. This study developed a novel method for determining lake reference nutrient conditions based on generalized extreme value distribution theory. The method establishes a unified framework by integrating Weibull, Gumbel, and Fréchet distributions. It was applied to estimate the reference nutrient conditions in Hongze Lake, the fourth-largest freshwater lake in China. The results indicated that the extreme value sequences of total nitrogen (TN) and total phosphorus (TP) followed the generalized extreme value distribution, thereby confirming the method’s feasibility. The recommended reference conditions for TN and TP in Hongze Lake were 0.65 mg/L and 0.031 mg/L, respectively, with 95% confidence intervals of 0.56–0.74 mg/L for TN and 0.026–0.035 mg/L for TP. The proposed method could avoid the artificial errors associated with data grouping in descriptive statistical methods and assist in formulating adaptive water management strategies by providing confidence intervals for reference nutrient concentrations. The spatial distribution of the reference TN and TP concentrations across various watersheds in China revealed that the eastern watersheds exhibited higher reference concentrations of TN and TP compared to the western watersheds. This study provides valuable insights for developing nutrient criteria for lakes, contributing to the sustainable management of water quality in regional lake ecosystems.

1. Introduction

As an important integral transit sink of a basin, the aquatic ecosystems of shallow lakes are increasingly facing mounting pressures worldwide [1]. Frequent human activities, such as land use changes and emissions from industrial and agricultural sources, are the primary stressors contributing to nutrient overload as well as disruptions of the ecological balance and functions of shallow lakes [2,3,4]. As a result, the average concentrations of nutrients in Chinese lakes have increased by over 200% since 1850, and projections indicate that this trend will continue until 2100 [5]. The average concentrations of the total phosphorus (TP) were observed to range from 0.15 mg/L to 0.51 mg/L in 224 lakes and 141 reservoirs in China [6], which were 7.5–25.5 times higher than the concentration threshold for eutrophication (0.02 mg/L) [7]. These high nutrient concentrations had various adverse effects on aquatic ecosystems, such as eutrophication, deterioration of water quality, and loss of biodiversity [8,9]. Therefore, it is essential to accurately assess the anthropogenic impacts on shallow lake ecosystems to determine the maximum acceptable nutrient concentrations that can cause ecological effects in water while maintaining ecosystem functions (i.e., scientific nutrient criteria).
The reference condition serves as a crucial indicator for assessing water quality conditions in the absence of human disturbance or alteration [10]. It establishes a baseline for the development of nutrient criteria for lakes [11]. The establishment of reference nutrient conditions is a key task in evaluating water pollution and formulating pollution control strategies for shallow lakes [12]. Given the practical challenges of identifying observational data that fully meet the reference condition requirements, several specialized methods have been developed and applied to assess reference nutrient conditions in lakes [12,13]. These methods are primarily classified into three categories: processed-based models [14], historical data analysis [15], and inferential models [13,14,16]. Among them, process-based models typically integrate watershed models with dynamic system theory, requiring less observational data compared to the other two methods [17]. Salerno et al. [14] proposed a novel process-based watershed model that integrates a hydrological transport model with the Vollenweider model to estimate the TP reference condition in Pusiano Lake, located in northern Italy. Their findings indicated a TP reference concentration of 0.008 mg/L. Chapra et al. [18] focused on developing a more parsimonious, process-based model specifically designed for calculating nutrient loading in shallow, periphyton-dominated streams. However, this approach necessitated a comprehensive understanding of the effects of human activities on biogeochemical lake processes, which limited its practical application.
Historical data analysis methods rely on univariate descriptive statistics and quantile selection to determine the reference conditions of shallow lakes [12]. Nutrient observations are analyzed, and the selected quantiles serve as reference conditions. Cardoso-Silva et al. [15] employed two representative historical data analysis methods, the lake population distribution method and the trisection method, to establish reference nutrient conditions for reservoirs in São Paulo State, Brazil. The results indicated that the reference condition concentrations were 0.25 mg/L for total nitrogen (TN) and 0.01 mg/L for TP. Huo et al. [19] and Sánchez-Montoya et al. [20] also employed the lake population distribution method to establish nutrient criteria for lakes in southeastern China and Mediterranean streams. However, the precision of historical data analysis methods largely depends on the quantity and independence of the observational data.
In contrast to the historical data analysis methods, which utilize observations directly, inferential models aim to extrapolate the nutrient population based on measured nutrient concentrations. The inferential model methods include regression models, such as the morpho-edaphic index (MEI) model, paleolimnological reconstruction method, and stressor–response model. Gu et al. [21] developed an improved MEI model to determine the reference TP concentration in Taihu Lake, with results indicating a value of 0.025 mg/L. However, the MEI model estimates the TP concentration using conductivity and alkalinity as proxies without considering the entire TP load that enters the lake [14]. Bennion et al. [16] determined the reference conditions in nine enriched lakes in Europe using the paleolimnological reconstruction method. This method relies on sediment data from a long time ago and cannot be applied to shallow lakes, where sediments are prone to disturbance from wind and wave activity [13]. Hua and Han [22] determined the reference TP concentration in Taihu Lake to be 0.018 mg/L by employing a nonparametric robust regression stressor–response model. In most stressor–response models, chlorophyll a (Chl-a) typically serves as the response variable, while nutrients are regarded as the stressors. Consequently, the application of stressor–response models necessitates the prior estimation of reference Chl-a conditions.
A novel methodology with a unified framework was established based on generalized extreme value distribution theory. This theory serves as a fundamental statistical framework designed to model and predict extreme events [23]. It is widely applied to forecast extreme occurrences such as floods, droughts, heavy rainfall, and extreme temperatures in the fields of hydrology and meteorology [24]. This method integrates the Weibull, Gumbel, and Fréchet distributions to overcome artificial errors arising from data grouping in traditional descriptive statistical methods. It also aims to reduce management risks by providing quantifiable confidence intervals for reference nutrient concentrations. The applicability and effectiveness of the proposed method were verified in a national-level water conservancy and ecological hub in eastern China, i.e., Hongze Lake. The objectives of this study were to (1) provide insights into the estimation of reference conditions of lakes; (2) analyze the spatiotemporal distribution patterns of TN and TP in Hongze Lake; and (3) compare the reference conditions of TN and TP across nine Chinese watersheds while exploring the key factors driving the reference concentrations. This study offers valuable insights for establishing suitable nutrient criteria in shallow lakes, thereby contributing to the development of a scientific basis for the sustainable management of lake ecosystems and the promotion of water quality protection.

2. Materials and Methods
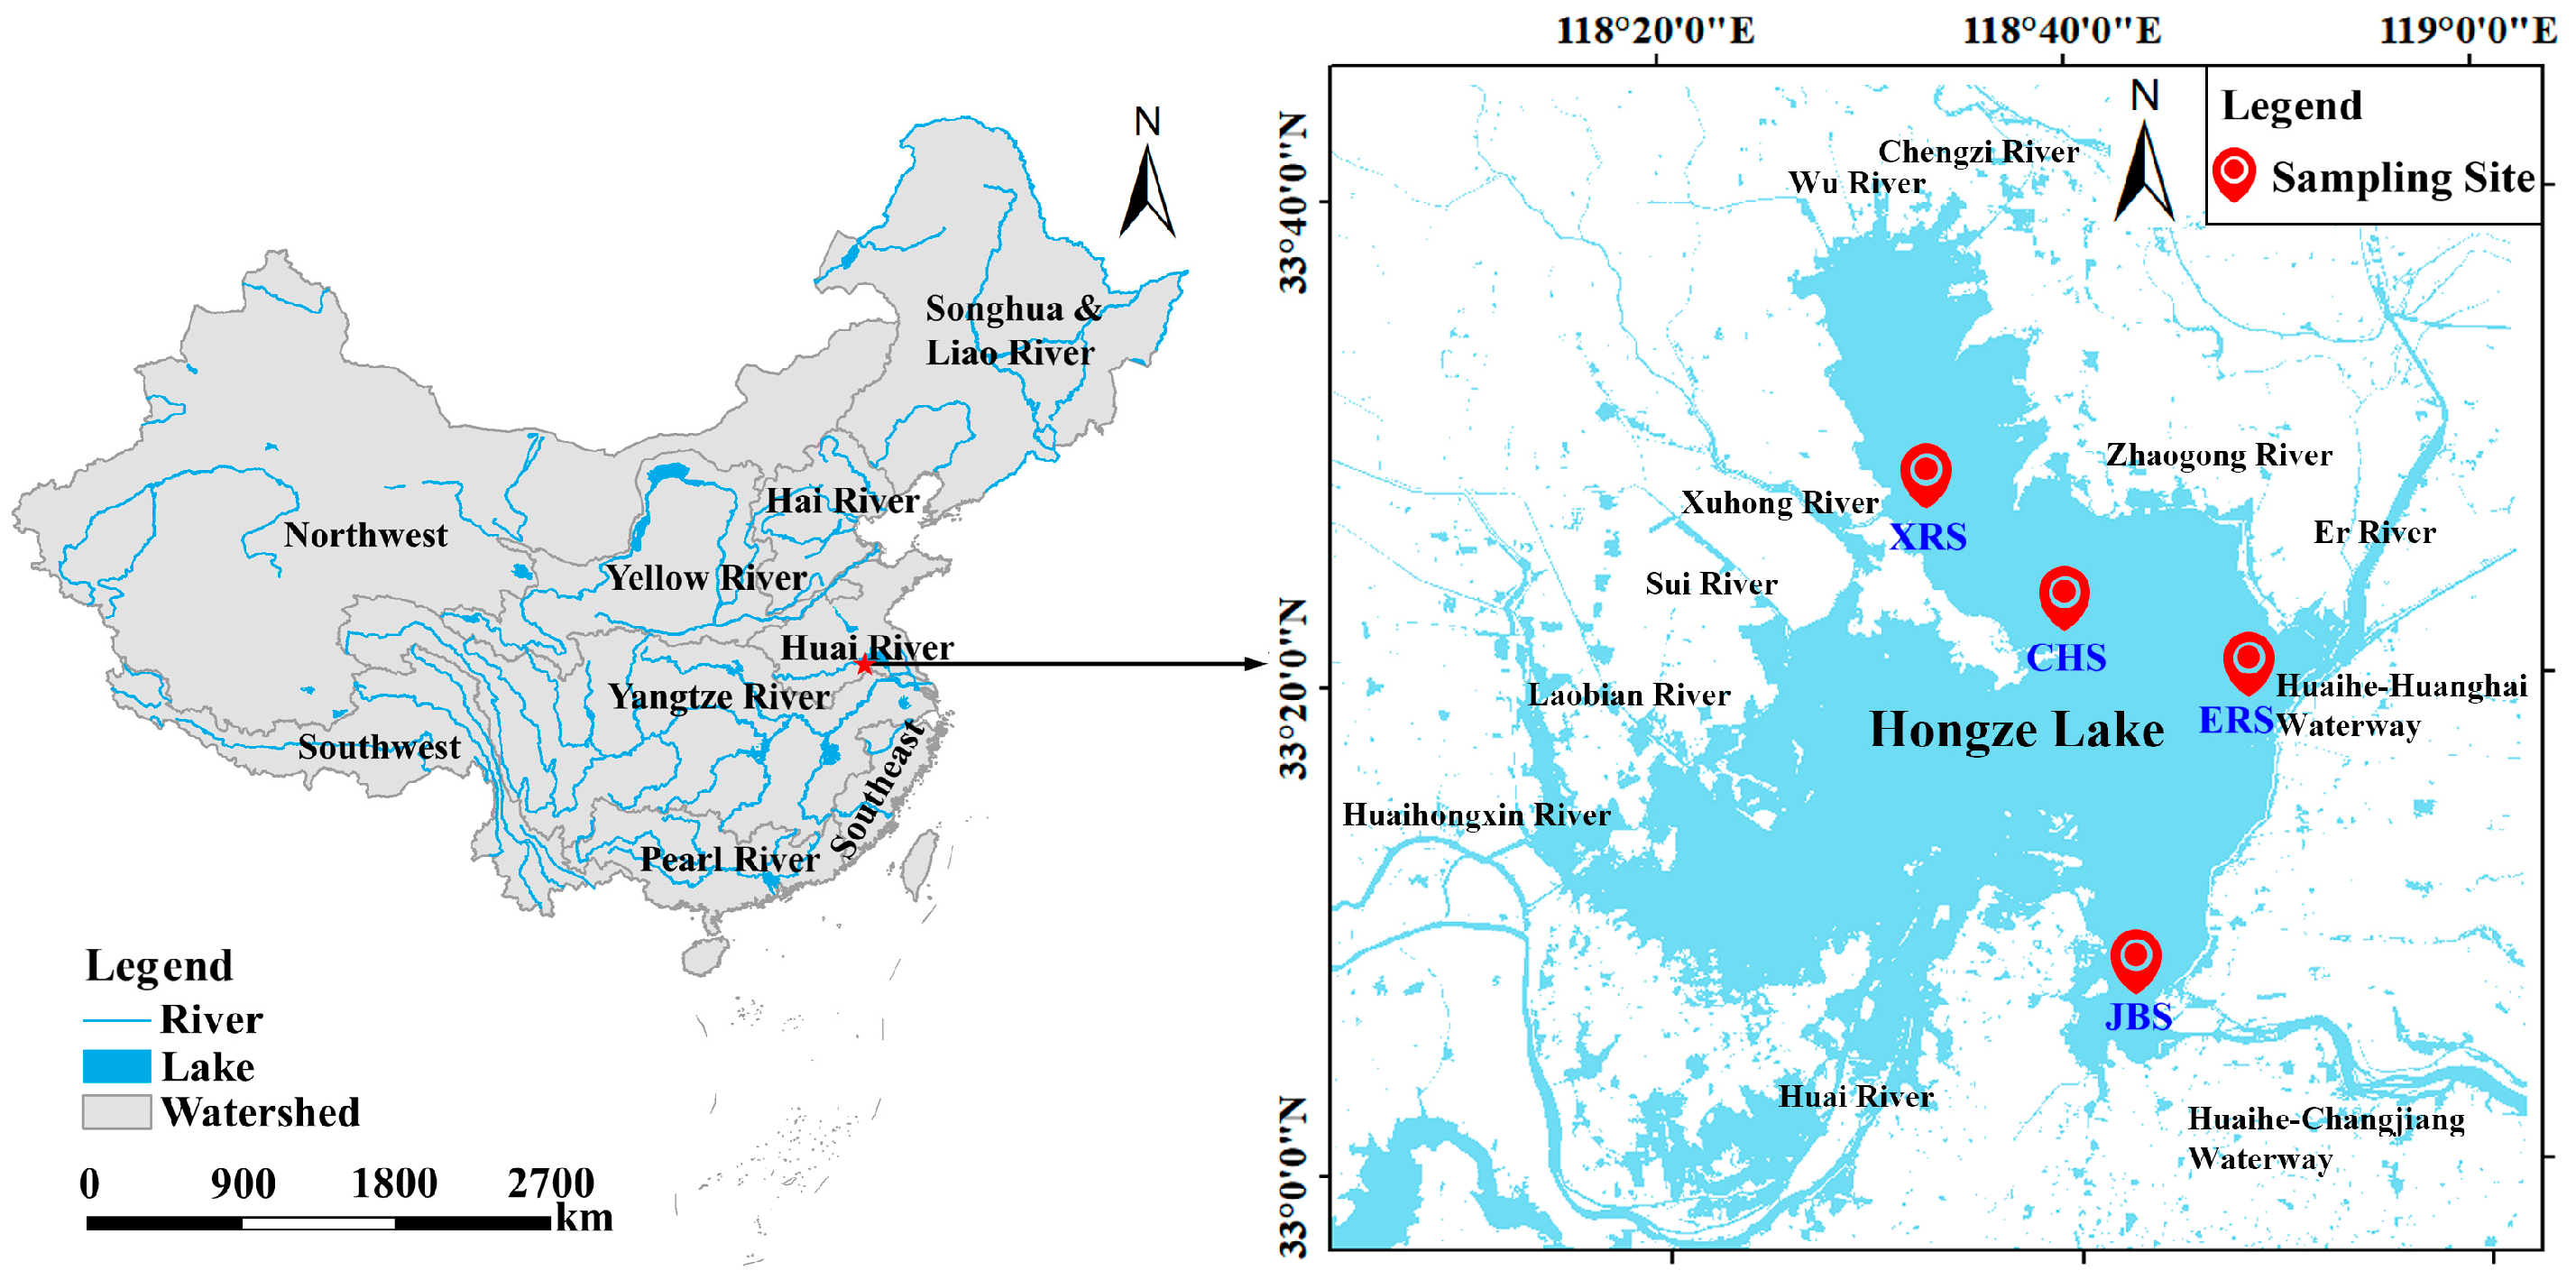
2.1. Study Area

Hongze Lake (33°06′~33°40′ N, 118°10′~118°52′ E) is located in eastern China and is the fourth largest freshwater lake in the country. This lake functions as a national-level water conservancy and ecological hub, covering an average area of 2135 km2, with a coastline approximately 365 km long [25]. It is a large, shallow lake with an average water depth of 1.9 m and a maximum depth of 4.5 m [26]. Hongze Lake is situated in a semi-humid monsoon climate zone, with an average annual precipitation of 959 mm [27,28]. It serves as the largest plain reservoir in the Huaihe River basin and plays a crucial role as a water channel and regulating lake for the Eastern Route of the South-to-North Water Diversion Project [29,30]. Consequently, the lake provides multiple services, including agricultural irrigation, urban and rural water supply, transportation and shipping, aquaculture, and the maintenance of the ecological balance [31]. Additionally, Hongze Lake serves as a receptor of non-point-source pollution resulting from the agricultural and industrial activities in the surrounding regions [32].

2.2. Sample Collection and Analysis

Field observations for this study were conducted over a 21-year period, from 2003 to 2023. The geographical locations of the four sampling sites in Hongze Lake are illustrated in Figure 1, which presents the nutrient levels in the lake. The four sampling sites were named Xuhong River (XHS), Cheng Hexiang (CHS), Er River (ERS), and Jiang Ba (JBS). The sampling periods for each site were as follows: XHS (2015–2022), CHS (2016–2023), ERS (2004–2022), and JBS (2003–2022). Sampling at JBS was not conducted in 2010 due to operational constraints. Water samples were collected monthly throughout the year, specifically between the 14th and 20th of each month at each sampling site. The sample locations at each site were positioned at a depth of one-quarter of the water surface. The samples were collected in polyethylene bottles, stored at 4 °C, and transported to the laboratory within 24 h. The detailed sampling methodology adhered to the Environmental Quality Standards for Surface Water [33].
The monthly nutrient concentrations of water samples collected at each sampling site were analyzed during the experimental period, focusing on TN and TP concentrations. Each water sample was filtered through a 0.45 μm membrane filter. The TN and TP concentrations were determined using the alkaline potassium persulfate digestion–UV spectrophotometric method and the ammonium molybdate spectrophotometric method, respectively [34,35]. All samples were analyzed in triplicate, along with a procedural blank to monitor potential interference and contamination. No target compounds were detected in the procedural blank. The recovery rates for TN in the water samples ranged from 92.3% to 105.4%. The recovery rates for TP in the water samples ranged from 93.7% to 106.5%.

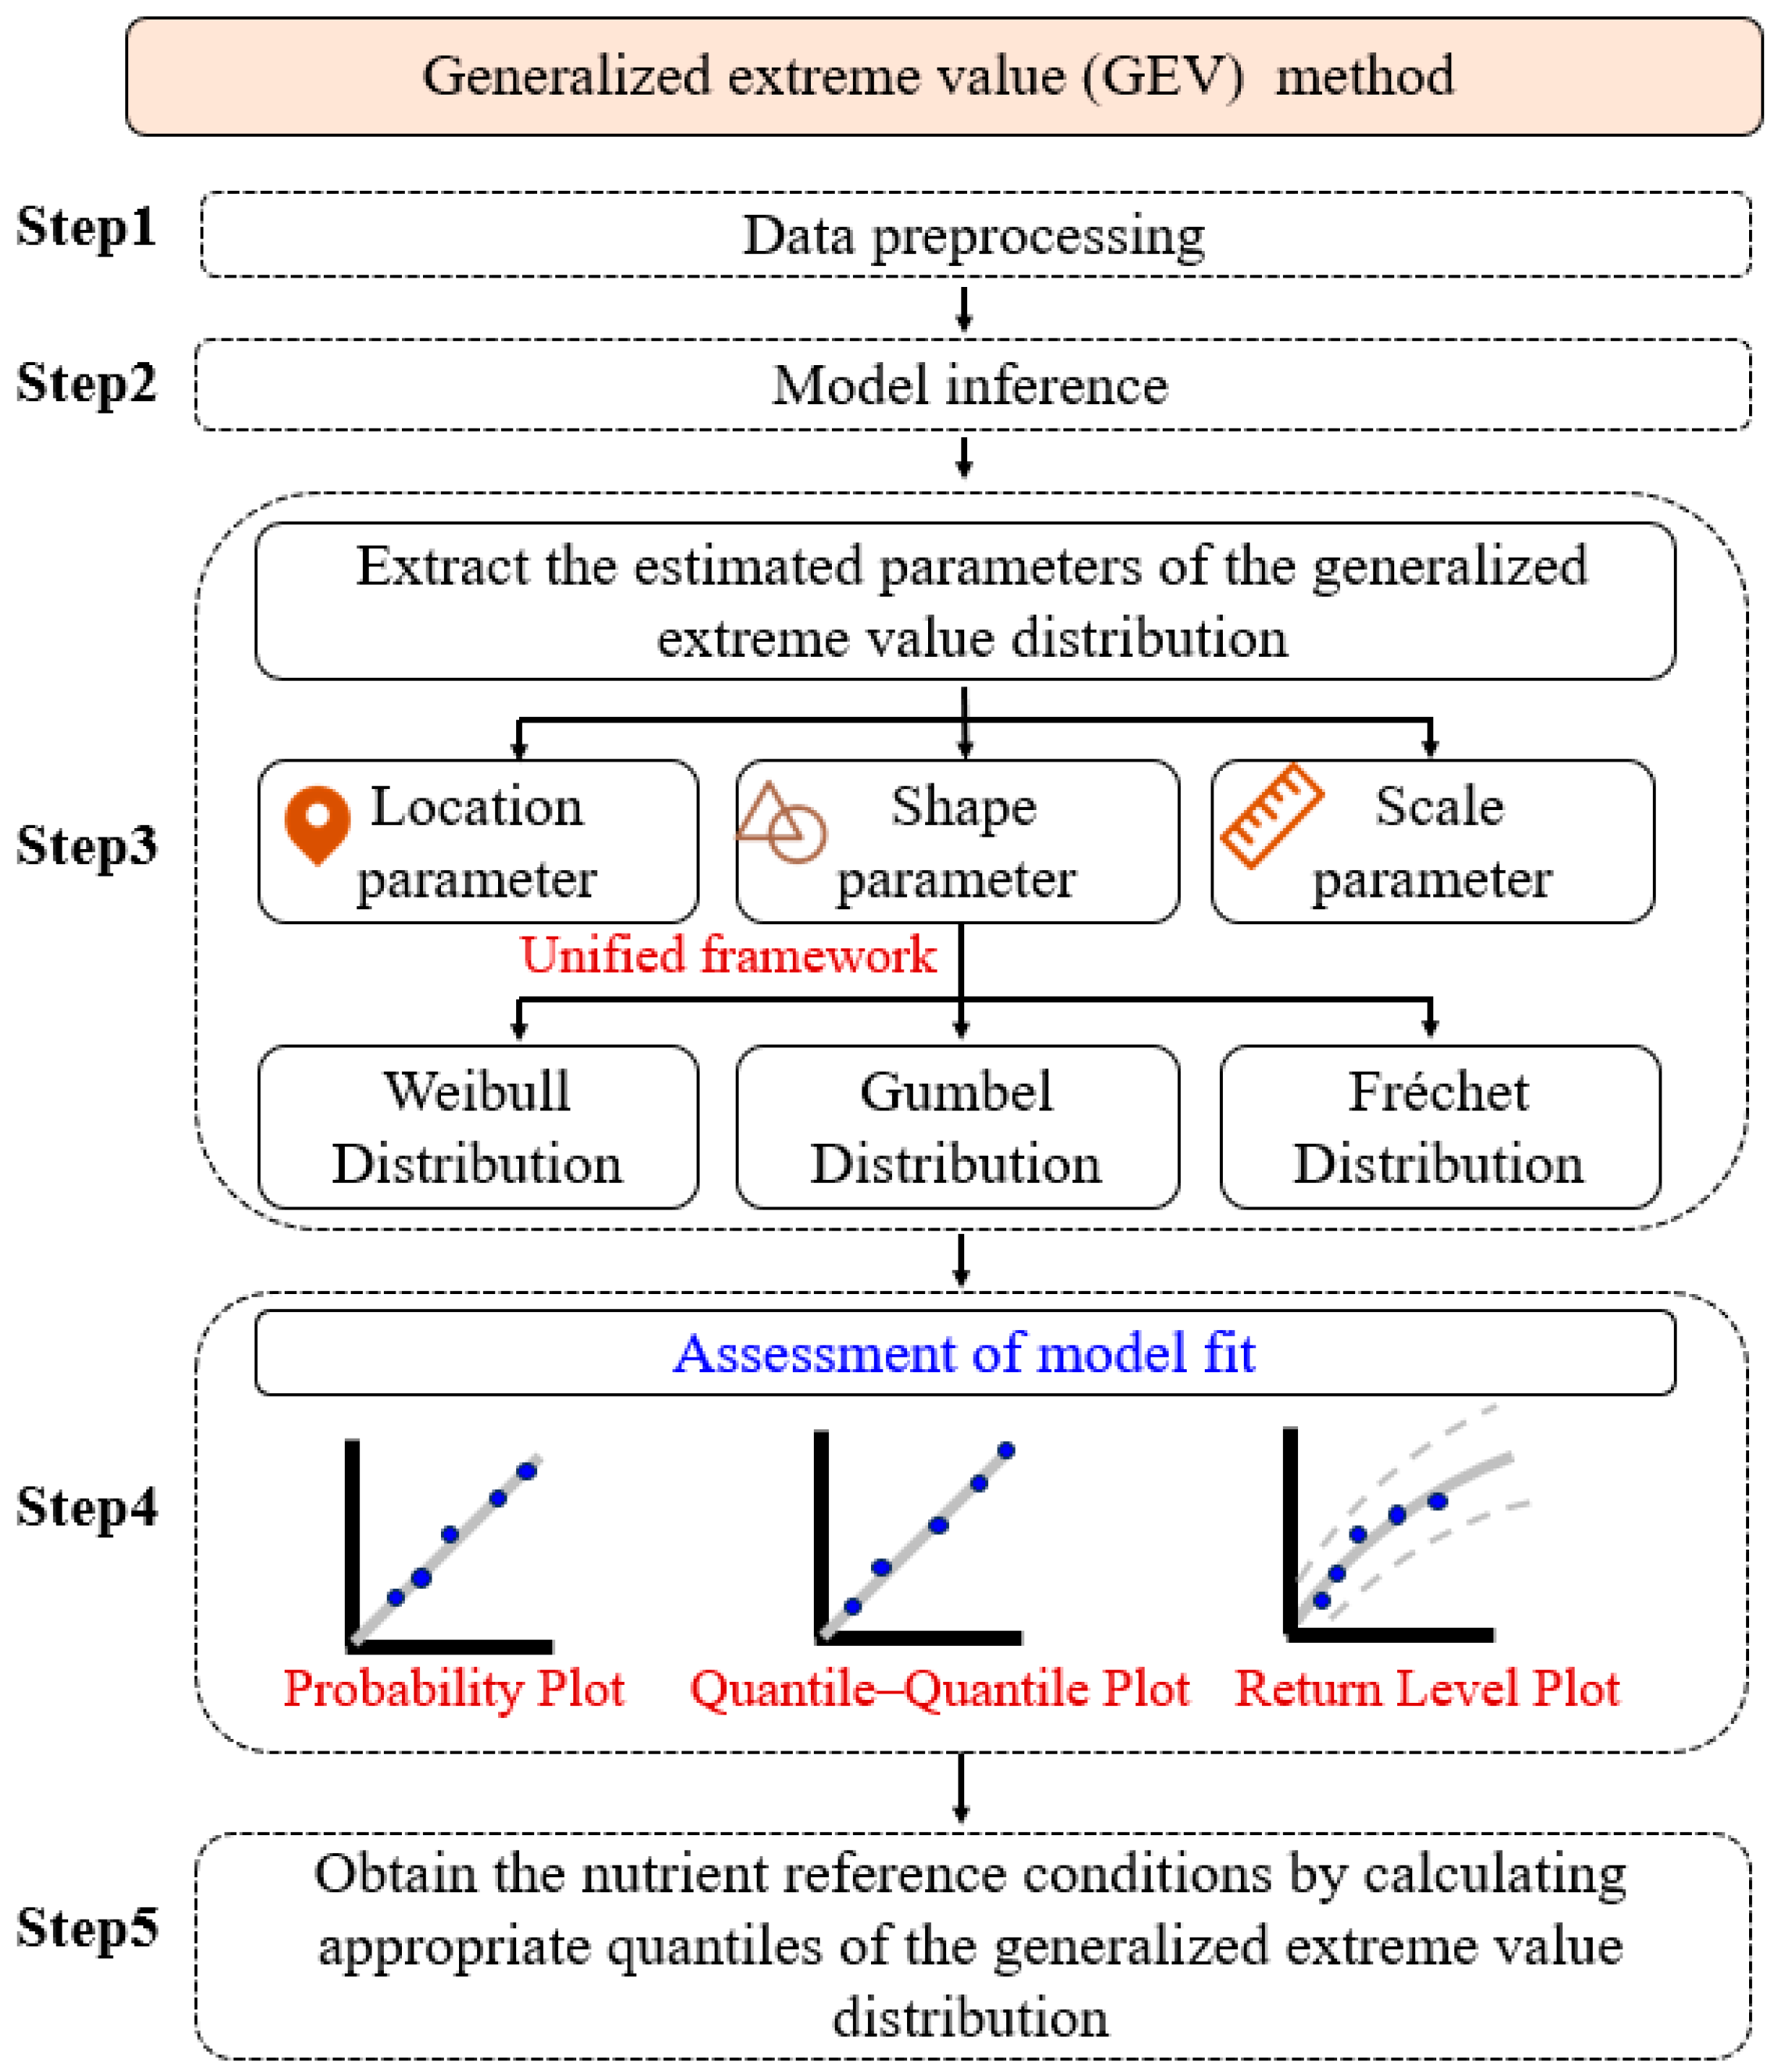
2.3. Generalized Extreme Value (GEV) Method

A novel GEV method was established to assess the reference nutrient conditions of shallow lakes. Based on the parametric flexibility characteristics of generalized extreme value distribution theory, the GEV method establishes a unified framework with Weibull, Gumbel, and Fréchet distributions. The Environmental Protection Agency (EPA) recommends the reference lake method for lakes within the same ecoregion that are minimally impacted by human activities [8]. However, locating natural lakes that meet these criteria is challenging in China. While descriptive statistical methods, such as frequency analysis, address issues related to data sources, they also exhibit certain limitations that are difficult to overcome. For instance, the results are significantly influenced by subjective grouping factors, making it challenging to draw statistical inferences and conduct credibility evaluations [36]. The GEV method avoids the reliance on pristine lake data inherent in the traditional reference lake method, overcomes the subjective grouping biases introduced by descriptive statistical partitioning, and provides quantifiable confidence intervals for reference conditions. The main steps of the methodology are illustrated in Figure 2 and detailed as follows.
Step 1: Data preprocessing: The monthly nutrient observations are transformed by taking their negative values. Then, the data are sorted in ascending order to form an extreme value sequence. If the monthly observations of specific substances in a lake are stationary time series without long-term autocorrelation, then, according to the generalized extreme value distribution theory, it can be proven that the sequence Mn, which consists of the opposite numbers of the minimum annual observations, should satisfy the following equation [23]:
lim n M n b n a n x P = H ( x )
where an and bn are two constant sequences that must exist, and n is the number of samples. P(A) denotes the probability of occurrence of event A; x is a definite value. H(x) is the generalized extreme value distribution function. If H(x) is non-degenerate, it must satisfy the following equation:
H ( x ) = exp 1 + ξ x μ σ 1 / ξ ,   1 + ξ x μ σ > 0
where μ is the location parameter. σ is the scale parameter. ξ is the shape parameter.
In practical applications, because the number of observations is always limited, the sequence of the opposite numbers of the annual minimum value can be rewritten from Equation (1) as the following equation:
P ( M n x ) H { ( x b n ) / a n }
Step 2: Model inference: Based on the data preprocessed in Step 1, the key parameters of the generalized extreme value distribution, i.e., μ, σ, and ξ in Equation (2), are estimated by maximum likelihood estimation [37]. The logarithmic likelihood function needs to be given first. If the number of samples is n, then the log-likelihood function of the corresponding generalized extreme value distribution is
L ( μ , σ , ξ ) = n ln σ ( 1 + 1 / ξ ) i = 1 n ln 1 + ξ x i μ σ i = 1 n 1 + ξ x i μ σ 1 / ξ
where xi is the ith observed value.
According to maximum likelihood estimation method, L takes the partial derivatives with respect to μ, σ, and ξ, and sets them equal to zero. This yields a system of equations involving three parameters. In general, this system of equations does not have an analytical solution. Numerical methods, such as the Gauss iteration method, need to be employed to solve it. The quantile yp for 0 < p < 1 can be obtained using the following equation:
y p = μ σ ξ [ 1 ( ln p ) ξ ]
Step 3: Extract the estimated parameters of the generalized extreme value distribution: After estimating the key parameters, the estimated values, along with their corresponding standard errors and covariance matrix, are extracted from the fitted model object. The extreme value distribution of specific types can be determined based on their parameter characteristics. Additionally, the parameter covariance matrix is obtained to assess the uncertainty and interdependence among the estimates.
Step 4: Assessment of model fit: The model demonstrates excellent goodness-of-fit when three key diagnostic criteria are met: (1) the probability plot reveals good alignment of data points along the 45° reference line; (2) the quantile–quantile plot demonstrates near-linear alignment between theoretical and empirical quantiles; (3) the return level plot exhibits observed extremes consistently distributed around the theoretical return-level curve.
Step 5: Obtain the reference nutrient conditions by calculating the appropriate quantiles of the generalized extreme value distribution: after confirming that the model provides an excellent fit to the data, the reference nutrient conditions for the lake are established by calculating extreme value quantiles through the quantile function of the generalized extreme value distribution.
After obtaining the reference nutrient conditions, the return level and 95% confidence interval are calculated by the following formulas:
x T = μ + σ ξ ( ln ( 1 1 / T ) ) ξ 1
C I lower = x T 1.96 S E ( x T )
C I upper = x T + 1.96 S E ( x T )
where T (year) is the return period. SE(xT) is the standard error of the return level.

3. Results and Discussion

3.1. Spatiotemporal Distribution Pattern of Nutrients

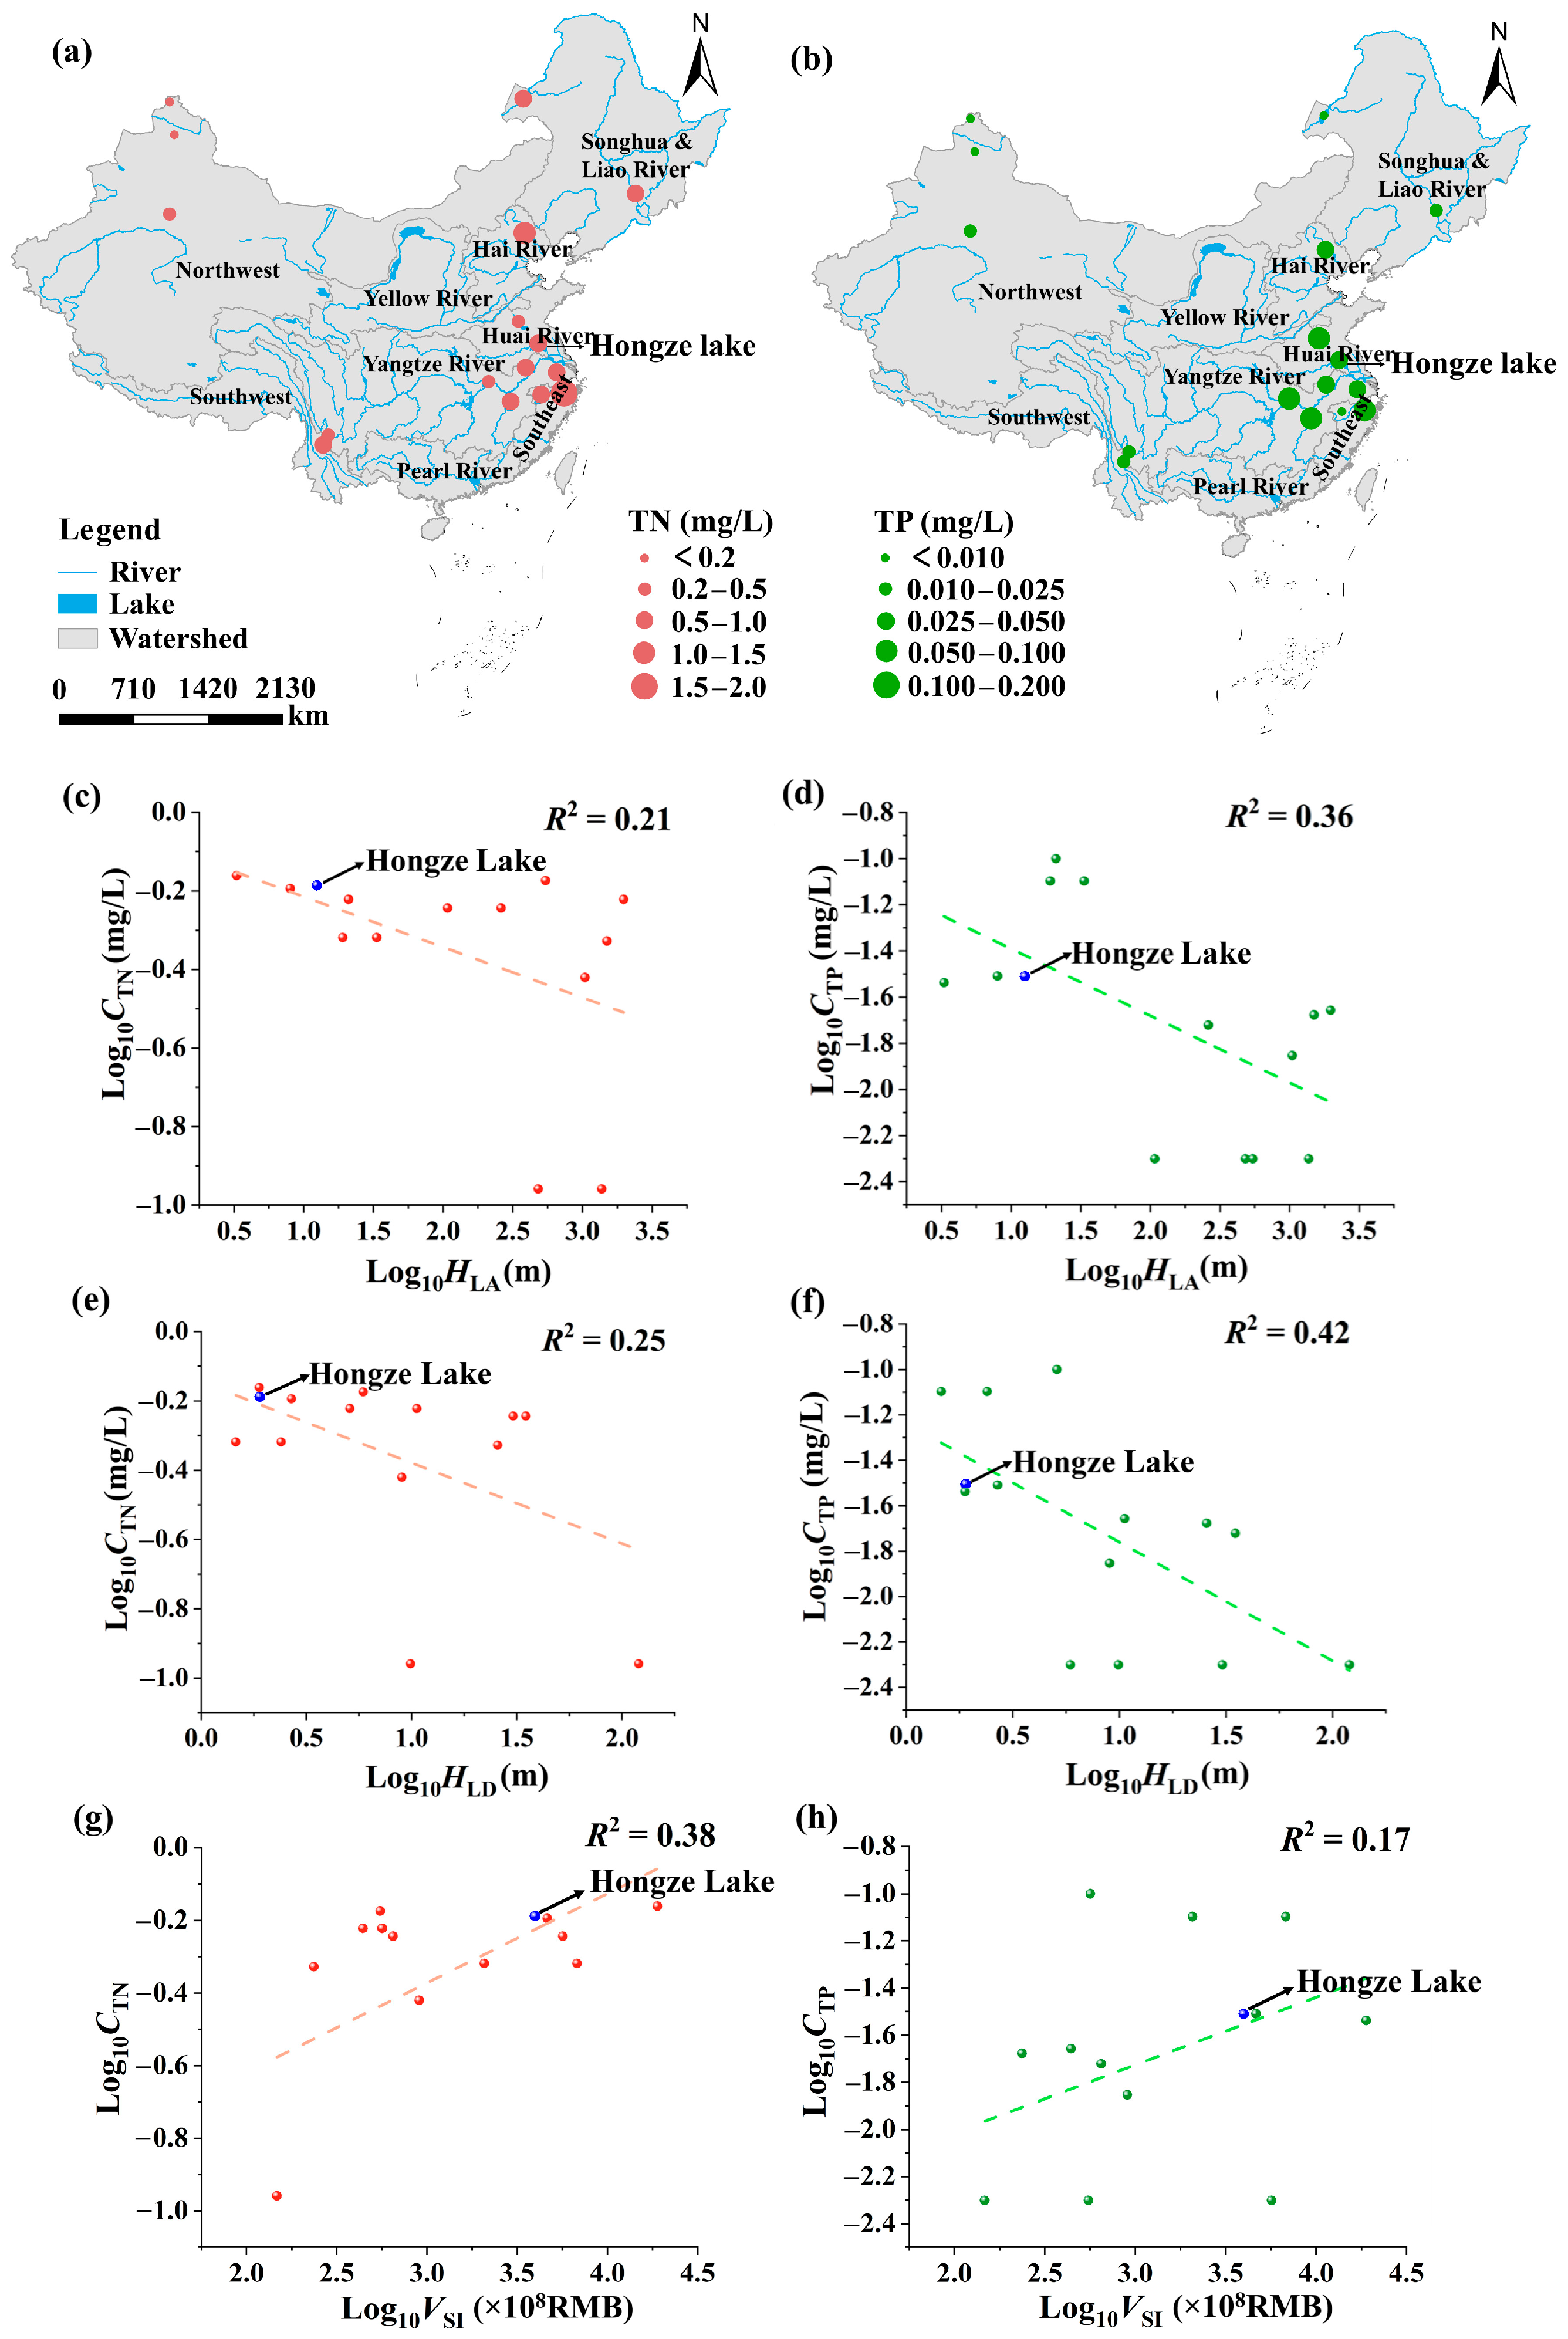
3.1.1. Spatial Distribution Pattern of Nutrients

The spatiotemporal distribution patterns of the TN and TP at the four sampling sites are illustrated in Figure 3. The spatial patterns of the TN and TP concentrations exhibited distinct regional variations across Hongze Lake during the observation period. Generally, the central lake zone exhibited lower TN and TP concentrations compared to the southern and northern regions. This spatial distribution is consistent with the research results of Li et al. [38]. During the sampling period following 2015, the average TN concentrations were highest at XHS (2.09 mg/L), located in the northern part of the lake, closely followed by JBS (2.08 mg/L) in the southern region, ERS (1.78 mg/L) in the eastern central zone, and CHS (1.45 mg/L) in the western central zone. Similarly, the TP demonstrated a comparable spatial distribution pattern: XHS (0.134 mg/L) > JBS (0.115 mg/L) > ERS (0.113 mg/L) > CHS (0.099 mg/L). The spatial variation in the TN and TP concentrations could be attributed to the differing degrees of influence exerted by the inflow rivers across various regions of the lake. For instance, the nutrient input from the Huaihe River was an important reason why the concentrations of TN and TP in the southern region of Hongze Lake remained at a high level [38,39].
The average TN concentration in Hongze Lake during the eight-year period following 2015 was 1.85 mg/L. Gao et al. [40] reported TN concentrations in six lakes located in the eastern plains of China from 2016 to 2020, with average concentrations ranging from 1.04 to 1.77 mg/L. It was indicated that the TN concentration in Hongze Lake was slightly higher than the average levels observed in the lakes across the eastern plains of China. Additionally, it was reported that the average TP concentrations in northeast China had the highest average at 0.51 mg/L, followed by northwest China at 0.41 mg/L, and East China at 0.15 mg/L during the period from 2012 to 2017 [6]. For the sampling period after 2015, the average TP concentration in Hongze Lake was 0.116 mg/L. This result is consistent with the characteristically low TP concentrations reported for lakes in East China and falls within the lower range of values observed across this region.

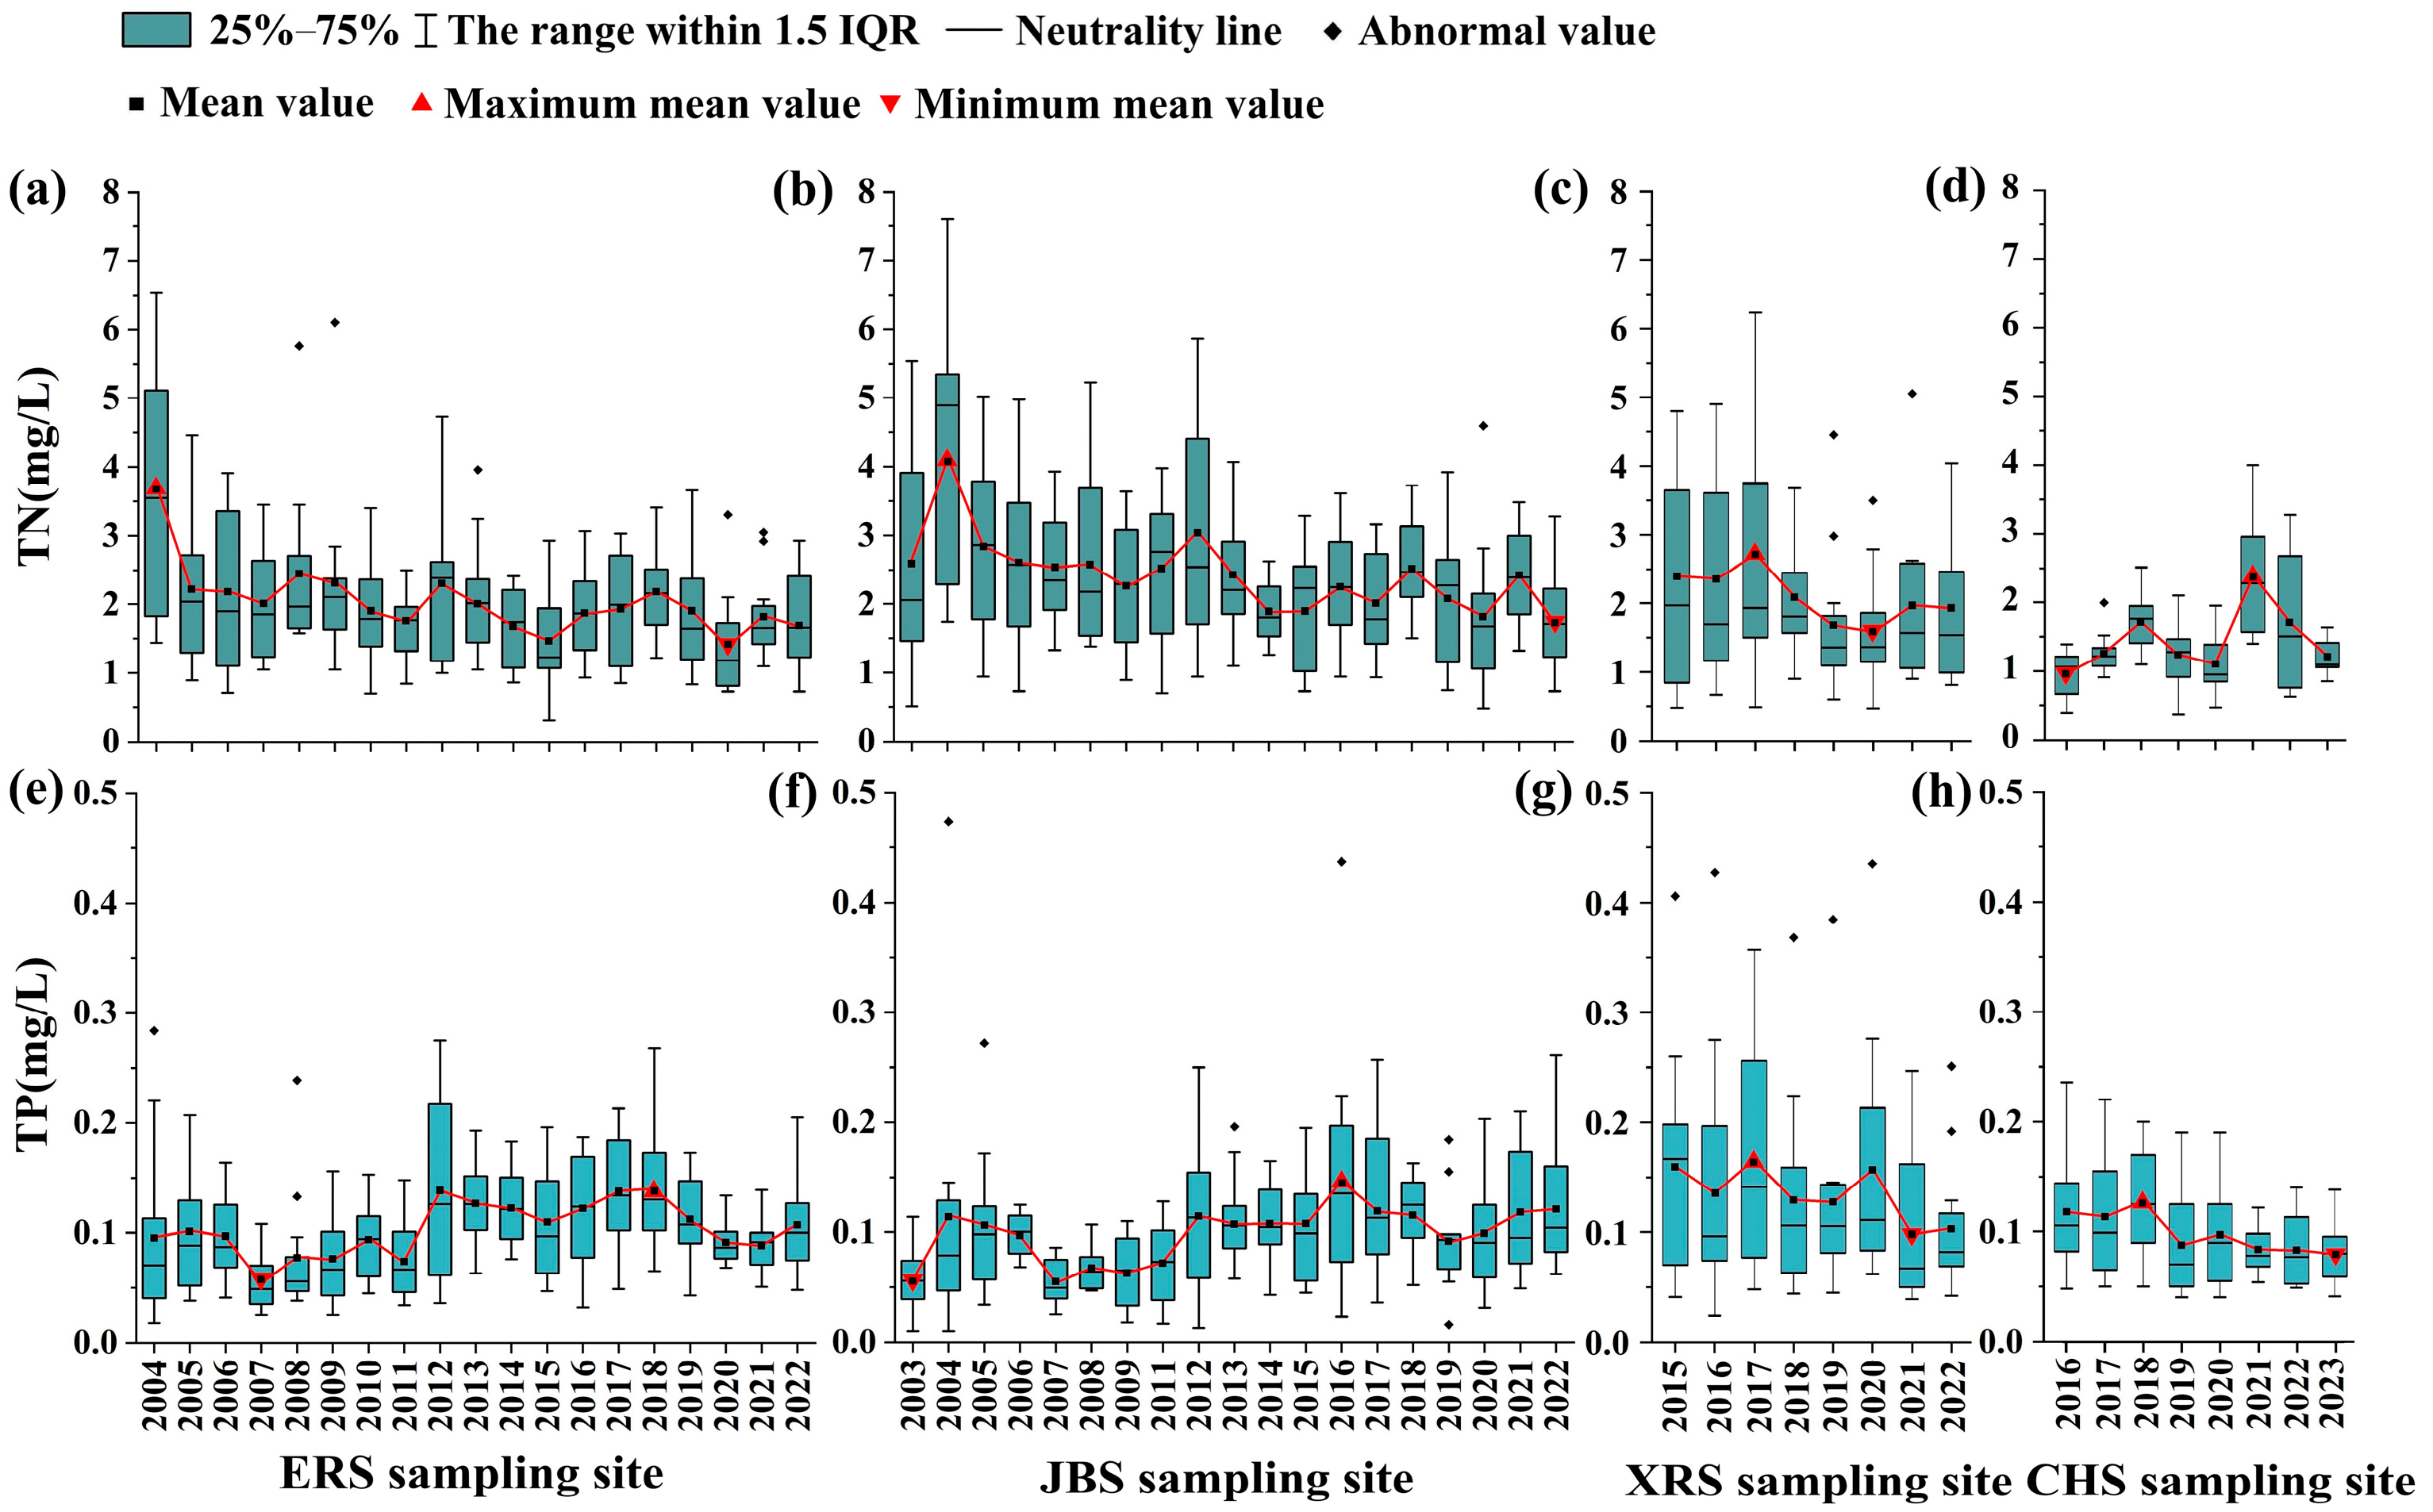
3.1.2. Temporal Distribution Pattern of Nutrients

The temporal distribution patterns of TN and TP across the sampling sites in Hongze Lake exhibited distinct characteristics, as illustrated in Figure 3. During the observation period, the multi-year average concentrations of TN at the ERS, JBS, XRS, and CHS sampling sites were 2.04 mg/L, 2.43 mg/L, 2.09 mg/L, and 1.45 mg/L, respectively. The high relative standard deviations of 23.8%, 22.4%, 18.3%, and 32.1% indicated significant interannual variability. The ERS and JBS sampling sites exhibited a gradual decline in TN concentrations over the observation period (p < 0.01). The annual average TN concentration at the XRS sampling site fluctuated, decreasing from a peak of 2.72 mg/L in 2017 to 1.93 mg/L in 2022.
Both the ERS and JBS sampling sites demonstrated a consistent TP trajectory over the 20-year period. The annual average concentrations showed a fluctuating upward trend, peaking at 0.140 mg/L for ERS in 2018 and 0.147 mg/L for JBS in 2016, followed by a fluctuating decline to 0.108 mg/L for ERS and 0.121 mg/L for JBS in 2022. Additionally, over the 8-year observation period, a progressive decline in the TP concentration was noted at the CHS sampling site (p < 0.01). Overall, the concentration levels of TN and TP in Hongze Lake exhibited a declining trend in recent years, which is consistent with the research results of Zhang et al. [39]. The primary driver of this trend was the operational impacts of the South-to-North Water Diversion Project, which significantly increased the water exchange rates and enhanced the self-purification efficiency of Hongze Lake [41]. Furthermore, a series of ecological conservation policies, such as pollutant discharge controls and wetland restoration initiatives, implemented by local authorities have played a crucial role (https://www.js.gov.cn/).

3.2. Reference Conditions for TN and TP

3.2.1. Reference Conditions

After conducting the model inference processes using the GEV method, the parameters were obtained and are presented in Table 1. The shape parameter (ξ) exhibited negative values for both the TN and TP. It was found that the calculated distribution aligned with the Weibull distribution, which is characterized by the presence of an upper endpoint. The distributions of the TN and TP concentrations in Hongze Lake exhibited lower limits due to the data taking the opposite number, which was consistent with the actual situation.
The results of the model fit assessment are presented in Figure 4. The probability plot and the quantile–quantile plots in Figure 4a,b,d,e show that all the data points approximately aligned along a straight line. This alignment indicated that the fitted extreme value statistical distribution successfully passed the statistical tests, demonstrating its reliability in a statistical context. The return level plots (Figure 4c,f) show that all observed values fell within the 95% confidence interval of the distribution, further validating the proposed extreme value model and its statistical assumptions.
Although some scholars have used the fifth percentile of the observed data as the reference condition for eutrophic lakes [36,42], the annual minimum values of the TN and TP in Hongze Lake represented optimal conditions each year. As illustrated in Figure 4c,f, the 95% confidence intervals for return periods ranging from 1 to 10 years were relatively narrow, indicating that the estimated values within this range exhibited high precision. Meanwhile, the EPA recommended using the 25th percentile as the reference condition for lakes in practice [8]. Therefore, in this study, the 25th quantile was employed as the reference condition for TN and TP concentrations. Based on the proposed GEV method, the TN and TP reference conditions for Hongze Lake were determined, as presented in Table 2. The reference condition concentrations are 0.65 mg/L for TN and 0.031 mg/L for TP.
As shown in Table 2, the 95% confidence intervals for TN and TP were 0.56–0.74 mg/L and 0.026–0.035 mg/L, respectively. These confidence intervals quantify the uncertainty associated with estimating reference conditions, which is crucial for risk-averse policymaking. Policymakers can flexibly adjust management targets within scientifically defined ranges, thereby coordinating ecological conservation with economic development objectives.

3.2.2. Comparison of Reference Conditions with Previous Studies

To identify and verify the reliability of the results obtained from the proposed GEV method, it was necessary to compare them with the TN and TP reference conditions of similar aquatic ecosystems. Hongze Lake, Taihu Lake, and Chaohu Lake are shallow lakes situated in eastern China, all of which are located within the subtropical monsoon climate zone. Zhou et al. determined that the reference nutrient conditions for Chaohu Lake are 0.64 mg/L for TN and 0.031 mg/L for TP using the model extrapolation method [11]. Zheng et al., employing a typical historical data analysis method (i.e., frequency analysis), estimated the nutrient reference concentrations for Taihu as 0.60 mg/L for TN and 0.030 mg/L for TP [36]. Their findings support the conclusion that the TN and TP reference conditions for Hongze Lake, as estimated by the GEV method, are appropriate.
To further assess the nutrient reference concentrations in Hongze Lake, this study compiled the distribution of the TN and TP in the surface water across different watersheds in China (Figure 5a,b). The Huaihe River Basin, where Hongze Lake is located, exhibited a relatively high reference concentrations of TN and TP. Shallow lakes in the Yangtze, Yellow, and Huaihe River Basins (e.g., Taihu and Chaohu Lakes; mean depth < 3 m, altitude < 20 m) exhibited high mean reference nutrient concentrations (TN > 0.55 mg/L, TP > 0.05 mg/L) [11,17]. In contrast, lakes in the southwest and northwest basins (e.g., Erhai Lake and Kanas Lake) are situated at higher average altitudes (>1000 m) and have greater depths (>30 m), exhibiting significantly lower reference nutrient concentrations (TN < 0.35 mg/L, TP < 0.02 mg/L) [43,44]. In addition, the reference concentrations of TP in lakes were significantly positively correlated with the population density in prefecture-level cities (p < 0.05). The analysis of the spatial patterns and correlations indicates that both natural factors (i.e., altitude and water depth) and socioeconomic factors (i.e., secondary industry value added and population density) are key determinants of the reference concentrations of the TN and TP in the lakes. Low-altitude, shallow lakes exhibit higher reference concentrations of TN and TP, which can be attributed to greater external nutrient inputs and the sediment resuspension caused by wind and waves (internal loading) [45]. High-altitude, deep lakes show lower reference concentrations, likely due to lower external nutrient inputs and the inhibitory effects of low temperatures on microbial decomposition [46]. This observation further supports the spatial pattern noted, where eastern watersheds in China exhibit higher reference concentrations of TN and TP, while western watersheds demonstrate lower levels.
Table 3 shows the reference concentrations of TN and TP for various water systems worldwide. The reference concentrations of TN (0.65 mg/L) and TP (0.031 mg/L) in Hongze Lake are significantly higher than those reported for reservoirs in Brazil (TN: 0.25–0.35 mg/L; TP: 0.010 mg/L) [15,47]. This pattern reflects regional disparities in baseline nutrient levels, which are influenced by variations in climate, geology, and hydrological characteristics.
Figure 5. Reference concentrations of total nitrogen (TN) and total phosphorus (TP) of different watersheds in China (a,b). Relationships between reference TN and TP concentrations and lake altitude, average lake depth, and gross value added of secondary industry in jurisdiction cities (ch) [11,17,34,43,44,48,49]. CTN: total nitrogen reference concentration. CTP: total phosphorus reference concentration. HLA: lake altitude. HLD: lake depth. VSI: secondary industry value added.
Sustainability 17 04465 g005
Table 3. Reference concentrations of total nitrogen (TN) and total phosphorus (TP) in water ecosystems across different countries and regions.
Ecosystem (Country or Region)MethodTN (mg/L)TP (mg/L)Reference
220 lakes and reservoirs in Kansas, USAReference water body and trisection method0.20–0.700.019–0.062[50]
Red River basin, USALinear regression model and classification and regression tree method0.75–2.110.100–0.220[51]
Streams, Genesee River watershed, USASoil and water assessment tool model-0.076[52]
49 reservoirs of São Paulo State, BrazilLake population distribution method and trisection method0.250.010[15]
17 reservoirs of São Paulo State, BrazilTrisection method0.350.010[47]
319 sampling sites in rivers and streams in São Paulo State, BrazilTrisection method0.340.040[10]
Nine lakes, EuropePaleolimnological reconstruction method-0.013–0.067[16]
Pusiano Lake, ItalyProcess-based watershed model-0.008[14]

4. Conclusions

The main contribution of this study is developing a novel method for estimating reference nutrient conditions based on generalized extreme value distribution theory. By establishing a unified framework that integrates the Weibull, Gumbel, and Fréchet distributions, the advantages of the proposed methodology can be summarized as follows: (1) effectively overcoming the artificial errors introduced by data grouping in descriptive statistical methods, such as the frequency analysis method; (2) reducing aquatic ecosystem management risk by establishing statistically reliable nutrient reference ranges, thereby addressing traditional methods’ inability to quantify uncertainty.
The proposed method was employed to determine the reference TN and TP conditions in Hongze Lake. The 25th quantile of the model was recommended as the reference concentration. The results indicate that the reference concentrations for TN and TP are 0.65 mg/L and 0.031 mg/L, respectively. The 95% confidence intervals for TN and TP are 0.56–0.74 mg/L and 0.026–0.035 mg/L, respectively. The differences in the reference TN and TP concentrations among the lakes are influenced by a combination of natural factors (e.g., altitude and water depth) as well as socioeconomic factors (e.g., the secondary industry value added). The eastern watersheds exhibits higher reference concentrations of TN and TP, while the western watersheds demonstrates lower levels. The results of this study provide a baseline for the development of lake nutrient criteria and assist decision-makers in formulating water pollution control strategies.

Author Contributions

Conceptualization, A.W. and H.C.; methodology, L.W.; formal analysis, F.Y.; investigation, W.J.; resources, W.M.; writing—original draft preparation, A.W.; writing—review and editing, H.C.; visualization, A.W.; supervision, L.Z.; project administration, X.J. All authors have read and agreed to the published version of the manuscript.

Funding

This research was funded by the National Natural Science Foundation of China (grant Nos. 52479076 and 42177365) and the Yangzhou city-school cooperation project (grant No. YZ2023216). It was also sponsored by Qing Lan Project of Yangzhou University, China, and by the High-end Talent Support Program of Yangzhou University. All funding recipients were Haomiao Cheng.

Institutional Review Board Statement

Not applicable.

Informed Consent Statement

Not applicable.

Data Availability Statement

The original contributions presented in this study are included in the article. Further inquiries can be directed to the corresponding author.

Acknowledgments

The authors thank the anonymous reviewers for their valuable comments and suggestions on this article.

Conflicts of Interest

The authors declare no conflicts of interest.

References

  1. Ríos-Henríquez, C.; Fuentes, N. Temporal Environmental Status of a Shallow Lake Using Alpha and Beta Diversity on Phytoplankton Communities. Water 2024, 16, 274. [Google Scholar] [CrossRef]
  2. Azman, M.H.A.; Hamdan, R.; Ali, Z.M.; Siddiqui, Z.; Azlan, M.A.N. Inventory of Pollution Sources for The Lakes of Universiti Tun Hussein Onn Malaysia. Int. J. Integr. Eng. 2024, 16, 104–112. [Google Scholar] [CrossRef]
  3. Husk, B.; Julian, P.; Simon, D.; Tromas, N.; Phan, D.; Painter, K.; Baulch, H.; Sauve, S. Improving water quality in a hypereutrophic lake and tributary through agricultural nutrient mitigation: A Multi-year monitoring analysis. J. Environ. Manag. 2024, 354, 120411. [Google Scholar] [CrossRef]
  4. Cheng, H.M.; Xu, H.Y.; Guo, M.; Zhu, T.Y.; Cai, W.; Miao, L.Z.; Ji, S.; Tang, G.L.; Liu, X. Spatiotemporal dynamics and modeling of thiacloprid in paddy multimedia systems with the effect of wetting-drying cycles. Environ. Pollut. 2024, 343, 123187. [Google Scholar] [CrossRef]
  5. Ji, P.P.; Chen, J.H.; Chen, R.J.; Liu, J.B.; Yu, C.Q.; Chen, F.H. Nitrogen and phosphorus trends in lake sediments of China may diverge. Nat. Commun. 2024, 15, 2644. [Google Scholar] [CrossRef]
  6. Wen, Z.D.; Song, K.S.; Lyu, L.L.; Fang, C.; Shang, Y.X.; Liu, G.; Du, J. A national-scale data set for dissolved carbon and its spatial pattern in lakes and reservoirs across China. Sci. Data 2020, 7, 82. [Google Scholar] [CrossRef]
  7. Kuang, W.M.; Zhang, M.; Zhang, J.M.; He, Z.J.; Peng, X.L.; Xu, J.; Liu, Z.G. Comparative limnological study on annual dynamic pattern of nutrients in water column of three suburb lakes adjacent to Lake Poyang. J. Lake Sci. 2016, 28, 1293–1305. [Google Scholar]
  8. United States Environment Protection Agency. Nutrient Criteria Technical Guidance Manual: Lakes and Reservoirs; United States Environment Protection Agency, Office of Water: Washington, DC, USA, 2000; pp. 3–58.
  9. Qin, B.; Wang, R.; Yang, X.D.; Zhang, Q.H.; Zheng, J.A. Reconstruction and Trends of Total Phosphorus in Shallow Lakes in Eastern China in The Past Century. Sustainability 2023, 15, 10893. [Google Scholar] [CrossRef]
  10. Cunha, D.G.F.; Dodds, W.K.; Calijuri, M.D. Defining Nutrient and Biochemical Oxygen Demand Baselines for Tropical Rivers and Streams in So Paulo State (Brazil): A Comparison Between Reference and Impacted Sites. Environ. Manag. 2011, 48, 945–956. [Google Scholar] [CrossRef]
  11. Zhou, Y.L.; Jin, J.L.; Liu, L.; Zhang, L.B.; He, J.; Wang, Z.S. Inference of reference conditions for nutrient concentrations of Chaohu Lake based on model extrapolation. Chin. Geogr. Sci. 2013, 23, 35–48. [Google Scholar] [CrossRef]
  12. Huo, S.L.; Ma, C.Z.; Xi, B.D.; Zhang, Y.L.; Wu, F.C.; Liu, H.L. Development of methods for establishing nutrient criteria in lakes and reservoirs: A review. J. Environ. Sci. 2018, 67, 54–66. [Google Scholar] [CrossRef] [PubMed]
  13. Herlihy, A.T.; Kamman, N.C.; Sifneos, J.C.; Charles, D.; Enache, M.D.; Stevenson, R.J. Using multiple approaches to develop nutrient criteria for lakes in the conterminous USA. Freshw. Sci. 2013, 32, 367–384. [Google Scholar] [CrossRef]
  14. Salerno, F.; Viviano, G.; Carraro, E.; Manfredi, E.C.; Lami, A.; Musazzi, S.; Marchetto, A.; Guyennon, N.; Tartari, G.; Copetti, D. Total phosphorus reference condition for subalpine lakes: A comparison among traditional methods and a new process-based watershed approach. J. Environ. Manag. 2014, 145, 94–105. [Google Scholar] [CrossRef]
  15. Cardoso-Silva, S.; Frascareli, D.; Silva, D.; Figueira, R.C.L.; Bittencourt, M.D.; Moschini-Carlos, V.; Pompêo, M. An abiotic typology and reference conditions for nutrients and chlorophyll-a in subtropical reservoirs (Sao Paulo State, Brazil). Environ. Sci. Pollut. Res. Int. 2021, 28, 16029–16041. [Google Scholar] [CrossRef]
  16. Bennion, H.; Simpson, G.L.; Anderson, N.J.; Clarke, G.; Dong, X.H.; Hobaek, A.; Guilizzoni, P.; Marchetto, A.; Sayer, C.D.; Thies, H.; et al. Defining ecological and chemical reference conditions and restoration targets for nine European lakes. J. Paleolimnol. 2011, 45, 415–431. [Google Scholar] [CrossRef]
  17. Wang, L.; Wang, Y.L.; Cheng, H.M.; Cheng, J.L. Estimation of the Nutrient and Chlorophyll a Reference Conditions in Taihu Lake Based on A New Method with Extreme-Markov Theory. Int. J. Environ. Res. Public Health 2018, 15, 2372. [Google Scholar] [CrossRef]
  18. Chapra, S.C.; Flynn, K.F.; Rutherford, J.C. Parsimonious Model for Assessing Nutrient Impacts on Periphyton-Dominated Streams. J. Environ. Eng. 2014, 140, 04014014. [Google Scholar] [CrossRef]
  19. Huo, S.L.; Ma, C.Z.; Xi, B.D.; Su, J.; Zan, F.Y.; Jiang, T.T. Defining Reference Nutrient Concentrations in Southeast Eco-Region Lakes, China. Clean-Soil Air Water 2014, 42, 1066–1075. [Google Scholar] [CrossRef]
  20. Sánchez-Montoya, M.D.; Arce, M.I.; Vidal-Abarca, M.R.; Suárez, M.L.; Prat, N.; Gómez, R. Establishing physico-chemical reference conditions in Mediterranean streams according to the European Water Framework Directive. Water Res. 2012, 46, 2257–2269. [Google Scholar] [CrossRef]
  21. Gu, L.; Li, Q.L.; Hua, Z.L.; Hong, B. The improved MEI model for forecasting TP reference concentration in Lake Taihu basin. J. Lake Sci. 2013, 25, 347–351. [Google Scholar]
  22. Hua, Z.L.; Han, A.Q. Improved stressor-response model of total phosphorus in Taihu Lake based on nonparametric regression. Water Resour. Prot. 2019, 35, 20–24,46. [Google Scholar]
  23. Coles, S. An Introduction to Statistical Modeling of Extreme Values; Springer: London, UK, 2001; pp. 92–104. [Google Scholar]
  24. Katz, R.W.; Parlange, M.B.; Naveau, P. Statistics of extremes in hydrology. Adv. Water Resour. 2002, 25, 1287–1304. [Google Scholar] [CrossRef]
  25. Xiong, L.; Aldahan, A.; He, P.; Lu, X.; Ji, Y.; Yi, P.; Li, K.; Chen, X.G. Impact of water diversion practices on spatiotemporal changes in hydrologic and hydrochemical landscapes of surface and groundwater. Catena 2025, 249, 108661. [Google Scholar] [CrossRef]
  26. Yin, Y.X.; Chen, Y.; Yu, S.T.; Xu, W.C.; Wang, W.; Xu, Y.P. Maximum water level of Hongze Lake and its relationship with natural changes and human activities from 1736 to 2005. Quat. Int. 2013, 304, 85–94. [Google Scholar] [CrossRef]
  27. Lei, S.H.; Wu, D.; Li, Y.M.; Wang, Q.; Huang, C.C.; Liu, G.; Zheng, Z.B.; Du, C.G.; Mu, M.; Xu, J.; et al. Remote sensing monitoring of the suspended particle size in Hongze Lake based on GF-1 data. Int. J. Remote Sens. 2019, 40, 3179–3203. [Google Scholar] [CrossRef]
  28. Xu, H.Y.; Cheng, H.M.; Shao, Z.C.; Jiang, X.C.; Li, Z.W.; Yang, F.K.; Cheng, J.L. Optimizing agricultural water-land resource allocation in water-economic-environment cycles considering uncertainties of spatiotemporal water footprints. J. Clean Prod. 2025, 501, 145348. [Google Scholar] [CrossRef]
  29. Cheng, H.M.; Wang, A.A.; Zhang, J.; Nong, X.Z.; Jiang, X.C.; Wu, H.N.; Chen, Z.X.; Wang, M.L.; Cheng, J.L. Divergent responses of optimal land and water allocation to different hydrological regimes in the agricultural water-food-carbon nexus system. J. Hydrol. 2025, 653, 132730. [Google Scholar] [CrossRef]
  30. Wu, Y.; Dai, R.; Xu, Y.F.; Han, J.G.; Li, P.P. Statistical Assessment of Water Quality Issues in Hongze Lake, China, Related to the Operation of a Water Diversion Project. Sustainability 2018, 10, 1885. [Google Scholar] [CrossRef]
  31. Liu, B.J.; Cai, S.Y.; Wang, H.; Cui, C.Y.; Cao, X.Y. Hydrodynamics and water quality of the Hongze Lake in response to human activities. Environ. Sci. Pollut. Res. Int. 2021, 28, 46215–46232. [Google Scholar] [CrossRef]
  32. Chen, T.Y.; Liu, C.Q.; Shi, X.L.; Li, Y.; Fan, Z.W.; Jia, B.Y.; Liao, Y.P. Ten-year Trend Analysis of Eutrophication Status and the Related Causes in Lake Hongze. Environ. Sci. 2022, 43, 3523–3531. [Google Scholar]
  33. GB 3838-2002; Environmental Quality Standards for Surface Water. Ministry of Ecology and Environment of the People’s Republic of China: Beijing, China, 2002.
  34. Cheng, P.; Li, X.Y. Establishing reference nutrient conditions using improved statistical methods in a river network with typical monsoon climatic pattern. Ecol. Indic. 2018, 89, 260–268. [Google Scholar] [CrossRef]
  35. Qin, M.Q.; Fan, P.P.; Li, Y.Y.; Wang, H.T.; Wang, W.P.; Liu, H.; Messyasz, B.; Goldyn, R.; Li, B.L. Assessing the Ecosystem Health of Large Drinking-Water Reservoirs Based on the Phytoplankton Index of Biotic Integrity (P-IBI): A Case Study of Danjiangkou Reservoir. Sustainability 2023, 15, 5282. [Google Scholar] [CrossRef]
  36. Zheng, B.H.; Xu, Q.J.; Zhou, B.H.; Zhang, L.J. Building nutrient and its response indications reference state for criteria enaction: On the case of Lake Taihu, a typical shallow lake in eastern China. J. Lake Sci. 2009, 21, 21–26. [Google Scholar]
  37. Shi, D.J. Practical Extremum Statistics Methods; Science and Technology; Tianjin Science and Technology Press: Tianjin, China, 2006; pp. 152–169. [Google Scholar]
  38. Li, Y.; Zhang, Z.; Cheng, J.H.; Zou, L.H.; Zhang, Q.J.; Zhang, M.; Gong, Z.J.; Xie, S.Y.; Cai, Y.J. Water quality change and driving forces of Lake Hongze from 2012 to 2018. J. Lake Sci. 2021, 33, 715–726. [Google Scholar]
  39. Zhang, M.; Chu, E.G.; Xu, M.; Guo, J.; Zhang, Y. Temporal and spatial variation analysis on nutritive salt of Hongze Lake. Environ. Eng. Res. 2015, 20, 19–24. [Google Scholar] [CrossRef]
  40. Gao, K.W.; Zhu, Y.R.; Sun, F.H.; Chen, Y.Q.; Liao, H.Q.; Ma, H.H.; Hu, X.Y. A study on the collaborative control of water quality of nitrogen and phosphorus between typical lakes and their inflow rivers in China. J. Lake Sci. 2021, 33, 1400–1414. [Google Scholar]
  41. Jiang, Z.; Liu, C.; Wang, S.Y.; Li, C.W.; Zou, J.X.; Li, B.D. Impact of the second phase of the eastern route of South-to-North water diversion project on distribution of nitrogen and phosphorus in Hongze Lake. Water Sci. Technol. 2022, 85, 2398–2411. [Google Scholar] [CrossRef]
  42. Huo, S.L.; Xi, B.D.; Su, J.; He, Z.S.; Zan, F.Y.; Yu, H. Defining physico-chemical variables, chlorophyll-a and Secchi depth reference conditions in northeast eco-region lakes, China. Environ. Earth Sci. 2014, 71, 995–1005. [Google Scholar] [CrossRef]
  43. Zhang, Y.L.; Huo, S.L.; Xi, B.D.; Ma, C.Z.; He, Z.S. Establishing Nutrient Criteria in Nine Typical Lakes in China: A Conceptual Model. Clean-Soil Air Water 2016, 44, 1335–1344. [Google Scholar] [CrossRef]
  44. Xu, Y.F.; Ma, C.Z.; Huo, S.L.; Zhang, D.Y.; Xu, Z.P.; Qian, G.R.; Xi, B.D. Establishing Reference Conditions for Lake Water Quality: A Novel Extrapolation Approach. Water Resour. Manag. 2014, 28, 2161–2178. [Google Scholar] [CrossRef]
  45. Sondergaard, M.; Jensen, J.P.; Jeppesen, E. Role of sediment and internal loading of phosphorus in shallow lakes. Hydrobiologia 2003, 506, 135–145. [Google Scholar] [CrossRef]
  46. Moser, K.A.; Baron, J.S.; Brahney, J.; Oleksy, I.A.; Saros, J.E.; Hundey, E.J.; Sadro, S.A.; Kopácek, J.; Sommaruga, R.; Kainz, M.J.; et al. Mountain lakes: Eyes on global environmental change. Global Planet. Change 2019, 178, 77–95. [Google Scholar] [CrossRef]
  47. Cunha, D.G.F.; Ogura, A.P.; Calijuri, M.D.C. Nutrient reference concentrations and trophic state boundaries in subtropical reservoirs. Water Sci. Technol. 2012, 65, 1461–1467. [Google Scholar] [CrossRef] [PubMed]
  48. Huo, S.L.; Ma, C.Z.; Xi, B.D.; Su, J.; He, Z.S.; Li, X. Establishing water quality reference conditions for nutrients, chlorophyll a and Secchi depth for 7 typical lakes in arid and semiarid ecoregion, China. Environ. Earth Sci. 2015, 73, 4739–4748. [Google Scholar] [CrossRef]
  49. Chen, J.B.; Lu, J. Establishment of reference conditions for nutrients in an intensive agricultural watershed, Eastern China. Environ. Sci. Pollut. Res. Int. 2014, 21, 2496–2505. [Google Scholar] [CrossRef]
  50. Dodds, W.K.; Carney, E.; Angelo, R.T. Determining ecoregional reference conditions for nutrients, Secchi depth and chlorophyll a in Kansas lakes and reservoirs. Lake Reserv. Manag. 2006, 22, 151–159. [Google Scholar] [CrossRef]
  51. Haggard, B.E.; Scott, J.T.; Longing, S.D. Sestonic Chlorophyll-a Shows Hierarchical Structure and Thresholds with Nutrients across the Red River Basin, USA. J. Environ. Qual. 2013, 42, 437–445. [Google Scholar] [CrossRef]
  52. Makarewicz, J.C.; Lewis, T.W.; Rea, E.; Winslow, M.J.; Pettenski, D. Using SWAT to determine reference nutrient conditions for small and large streams. J. Great Lakes Res. 2015, 41, 123–135. [Google Scholar] [CrossRef]
Figure 1. The geographical location of Hongze Lake and the sampling sites from 2003 to 2023. XRS: Xuhong River sampling site, CHS: Cheng Hexiang sampling site, ERS: Er River sampling site, JBS: Jiang Ba sampling site.
Sustainability 17 04465 g001
Figure 2. The main steps of proposed generalized extreme value (GEV) method.
Sustainability 17 04465 g002
Figure 3. The spatiotemporal distribution pattern of TN and TP in four sampling site: (a,e) ERS; (b,f) JBS; (c,g) XRS; (d,h) CHS. ERS: Er River sampling site, JBS: Jiang Ba sampling site, XRS: Xuhong River sampling site, CHS: Cheng Hexiang sampling site.
Sustainability 17 04465 g003
Figure 4. The diagnostic plots of generalized extreme value distribution fit to the opposite number of TN (ac) and TP (df).
Sustainability 17 04465 g004
Table 1. The parameter estimation of the generalized extreme value (GEV) method.
VariableμStandard
Error of μ
σStandard
Error of σ
ξStandard
Error of ξ
TN−0.9760.0510.3450.038−0.4730.087
TP−0.0470.0020.0150.002−0.2700.103
Note: μ, σ, and ξ are the location parameter, scale parameter, and shape parameter, respectively.
Table 2. The estimation of reference conditions and the 95% confidence interval limits using the GEV method.
Variable25th PercentileUpper Limit of 95%
Confidence Interval
Lower Limit of 95%
Confidence Interval
TN (mg/L)0.6510.7360.565
TP (mg/L)0.0310.0350.026
Disclaimer/Publisher’s Note: The statements, opinions and data contained in all publications are solely those of the individual author(s) and contributor(s) and not of MDPI and/or the editor(s). MDPI and/or the editor(s) disclaim responsibility for any injury to people or property resulting from any ideas, methods, instructions or products referred to in the content.

