
Assessment of Lake Water Quality in Central Serbia—Using Serbian and Canadian Water Quality Indices on the Example of the Garaši Reservoir


Abstract
1. Introduction
2. Materials and Methods
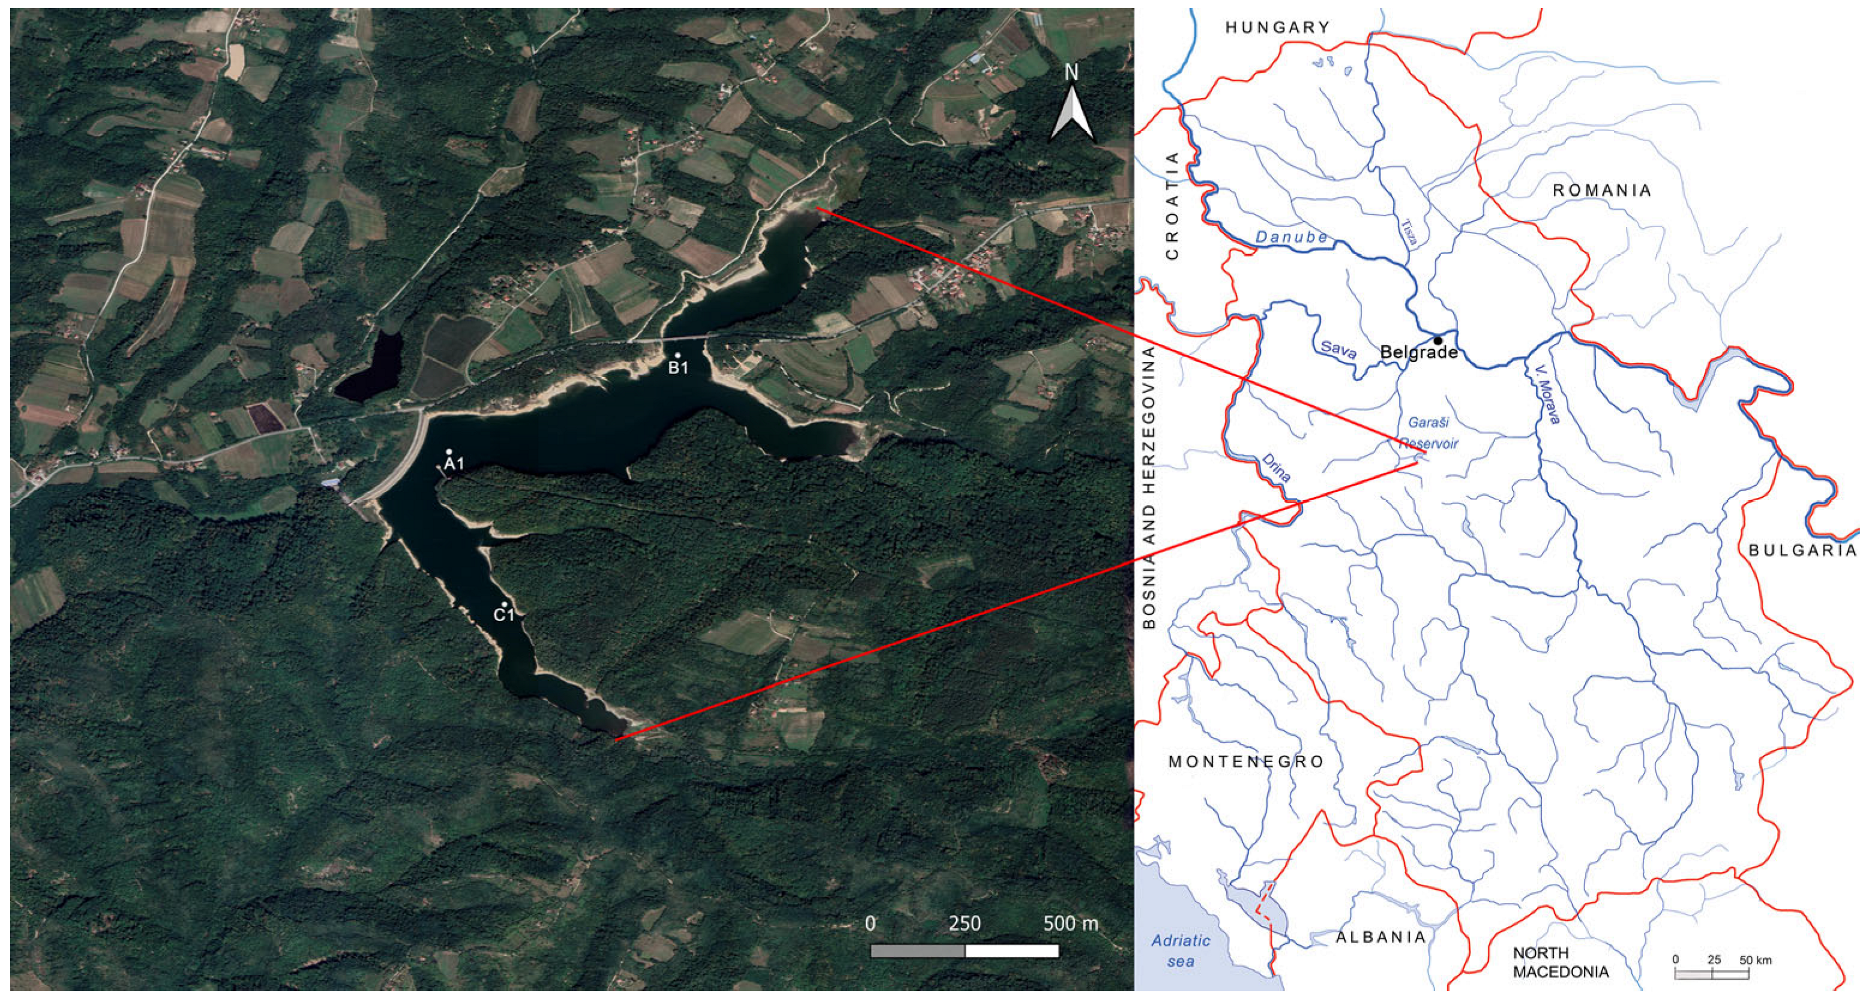
2.1. Study Area and Sampling
2.2. Water Quality Indices (WQI) Analysis
2.2.1. Serbian Water Quality Index (SWQI)
2.2.2. Canadian Water Quality Index (CWQI)
- F1 (Scope) is a ratio between the number of failed variables (variables which do not meet the objective) and the total number of variables;
- F2 (Frequency) is a ratio between failed tests (measurements which do not meet the objective) and the total number of tests;
- F3 (Amplitude) is an asymptotic function which scales the normalized sum of excursion (nse) from the objective; nse is a ratio between excursions (variables which are greater or lower than the objective) of individual tests and the total number of tests [54].
3. Results
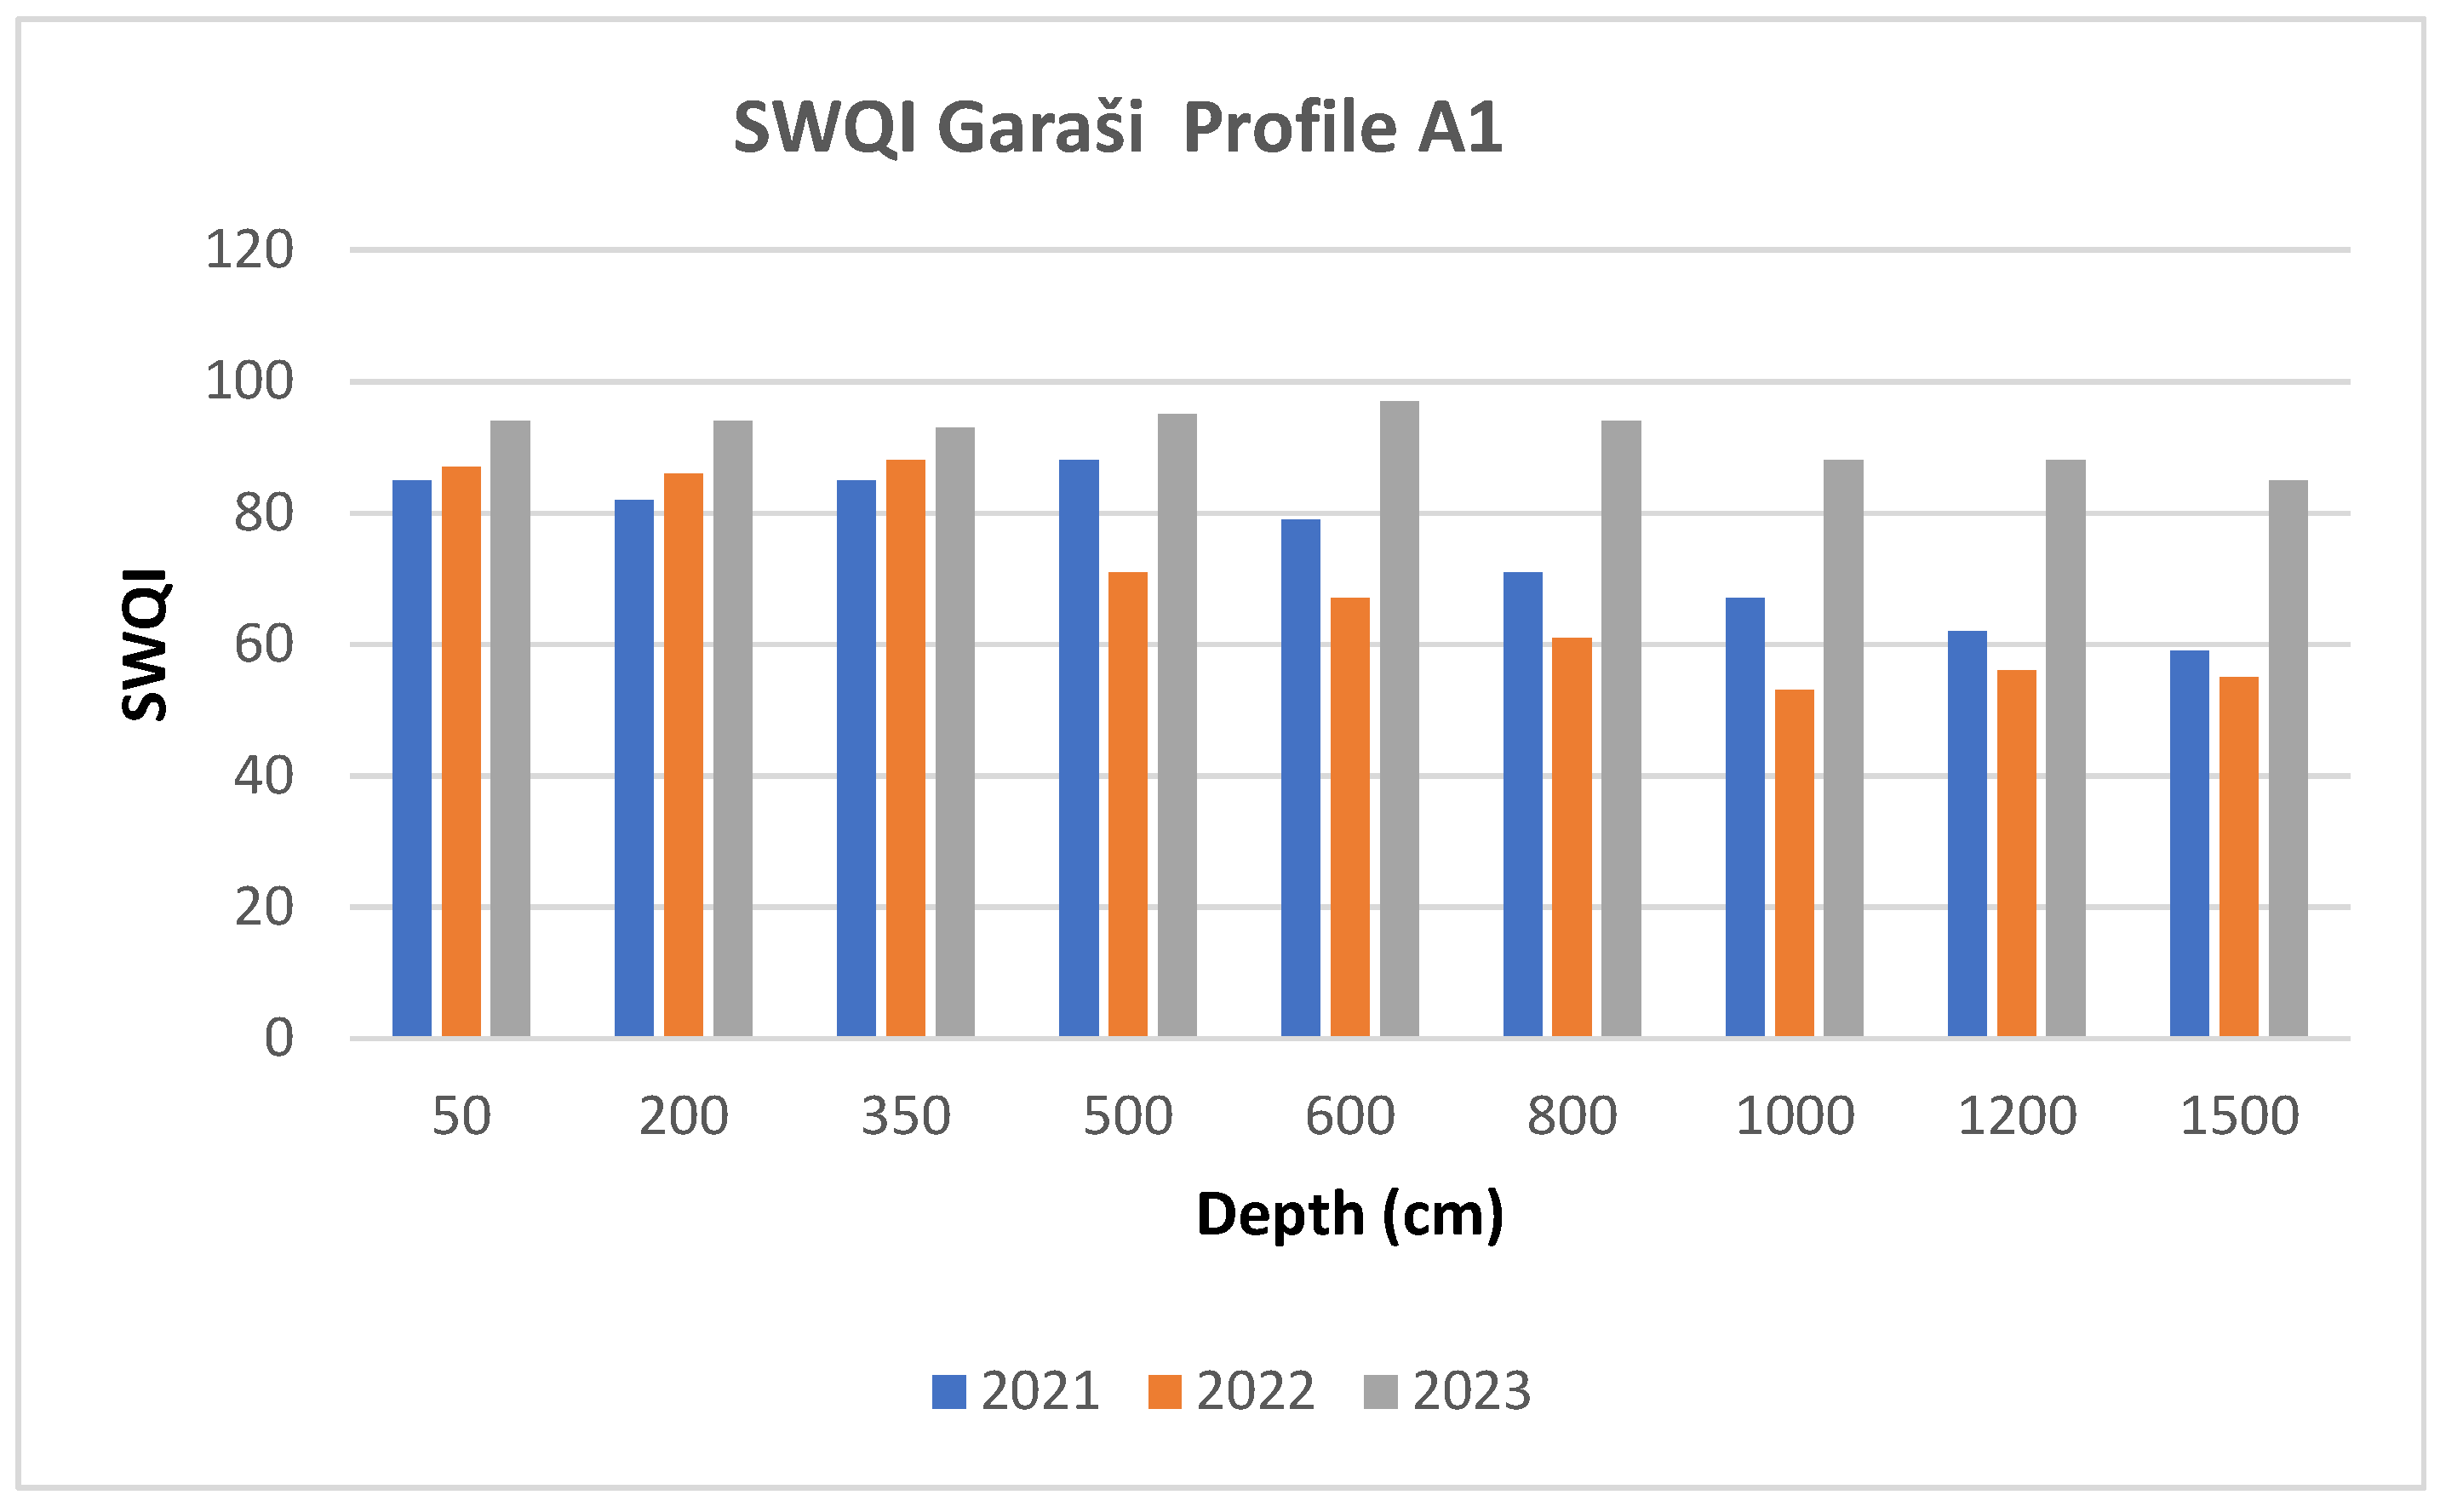
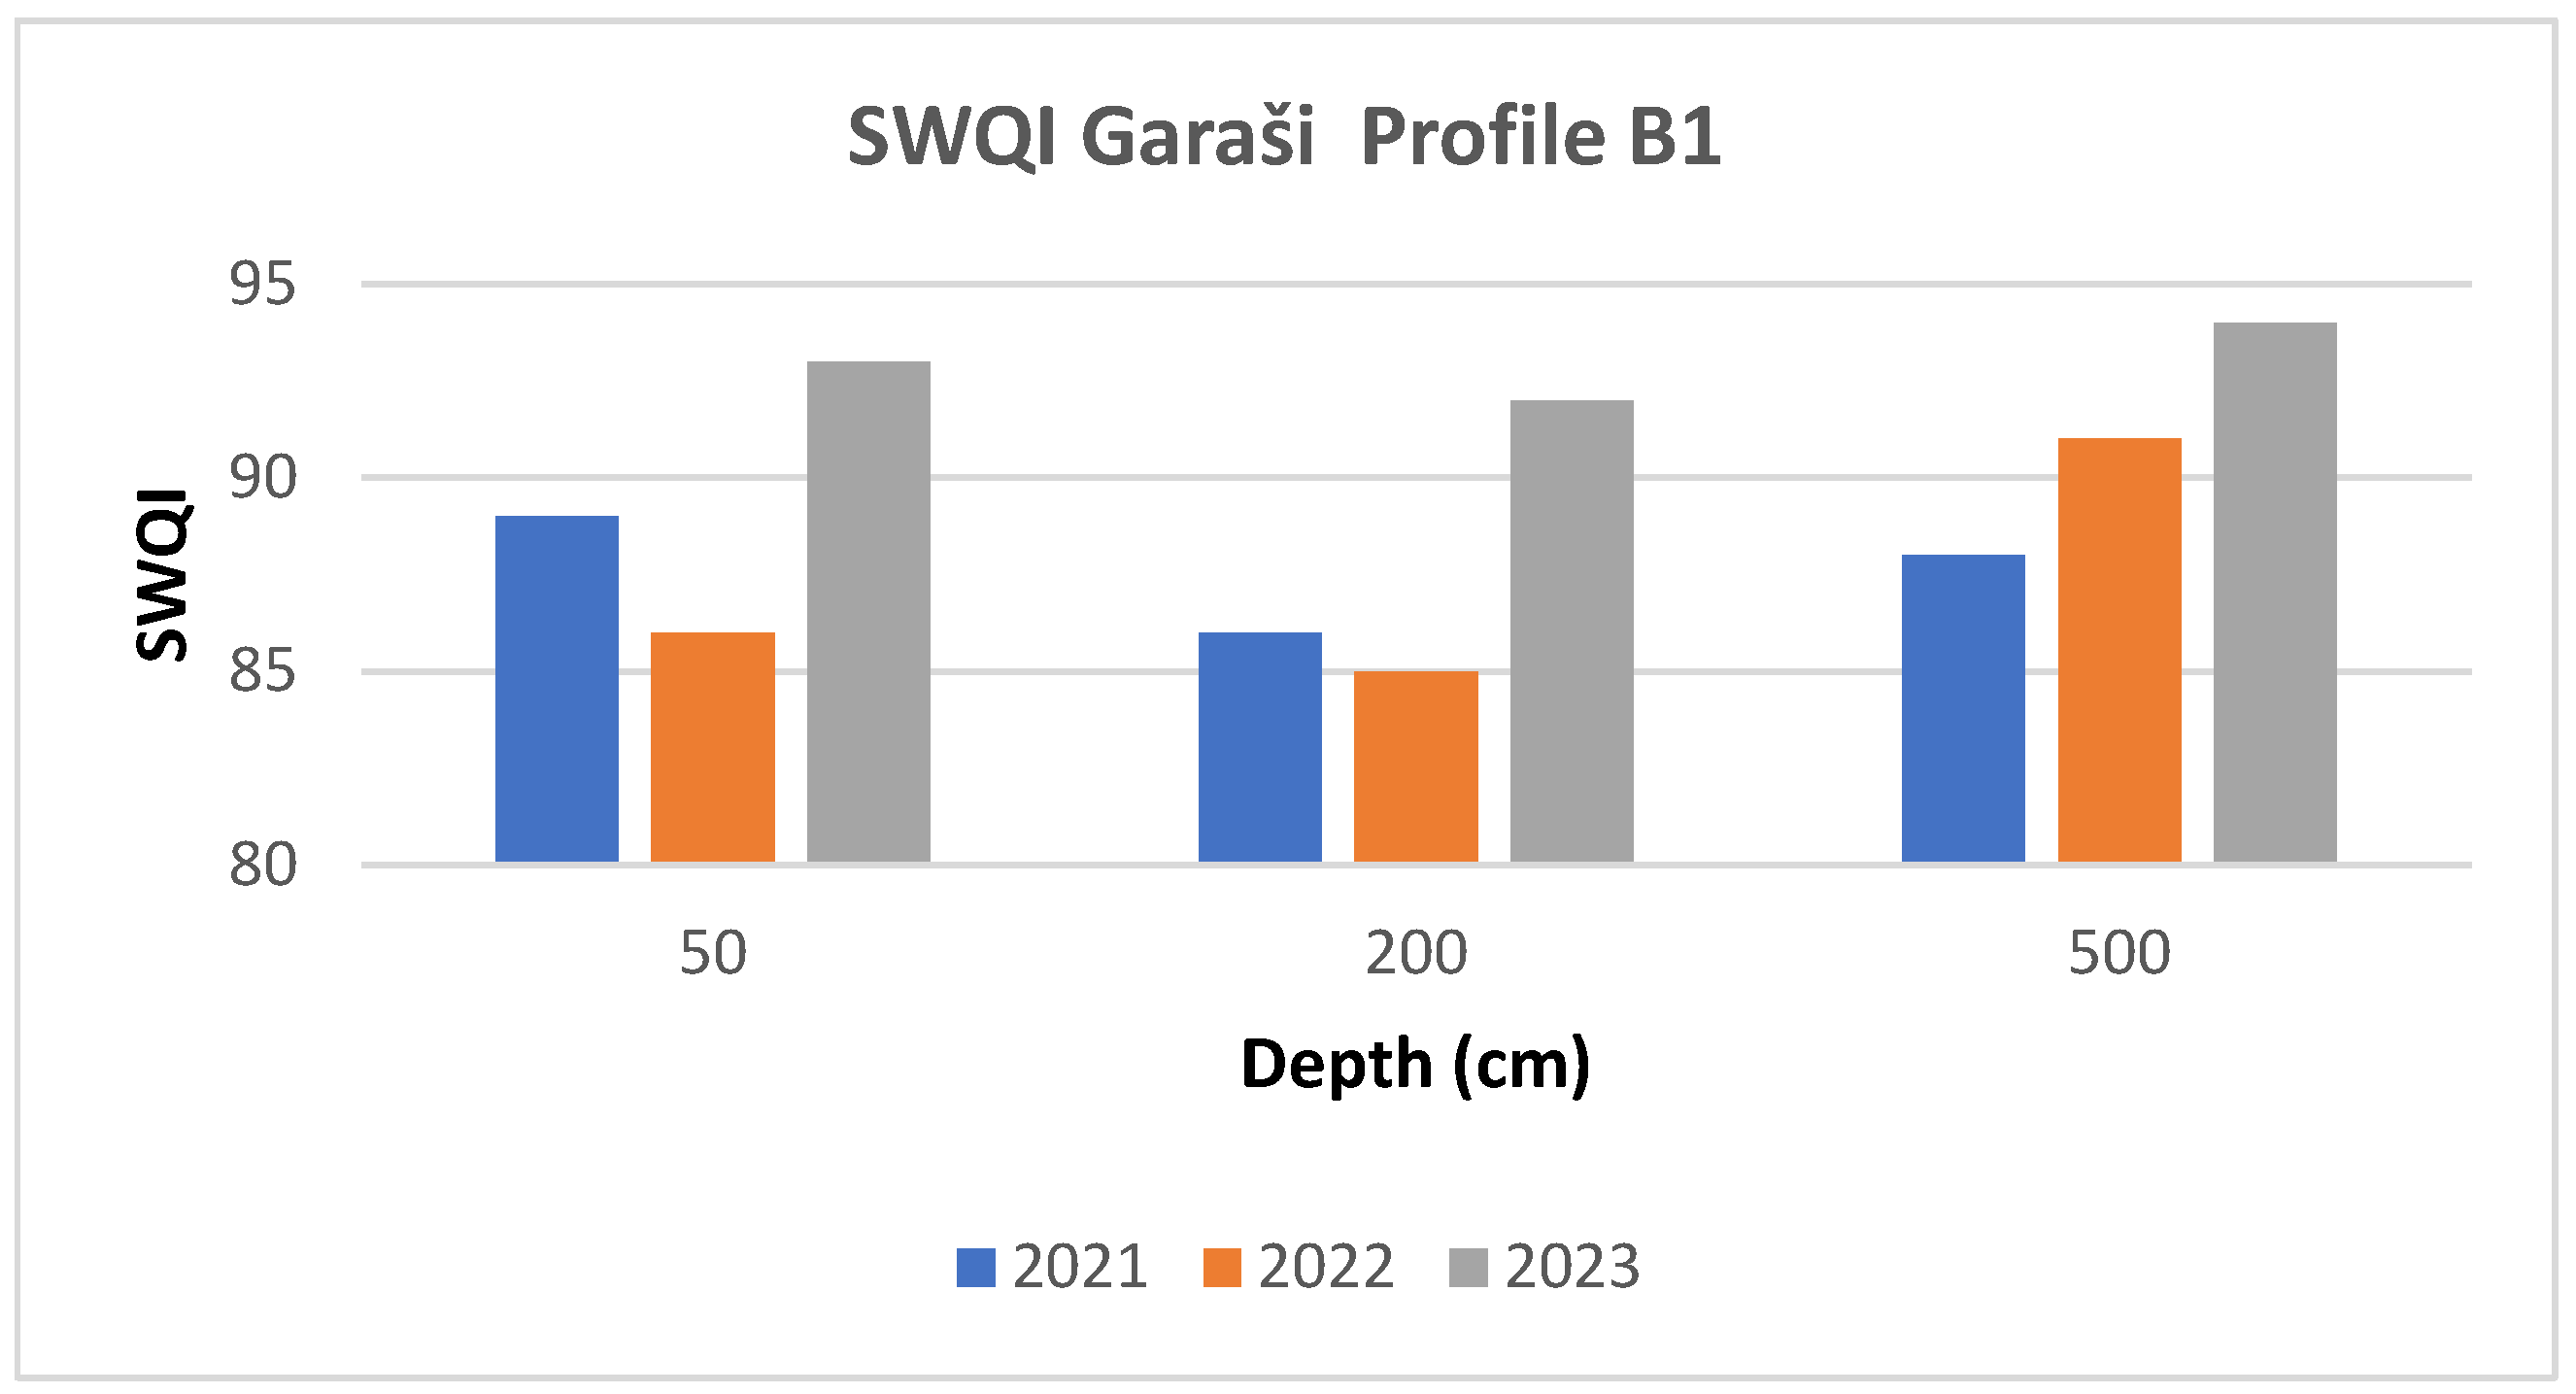
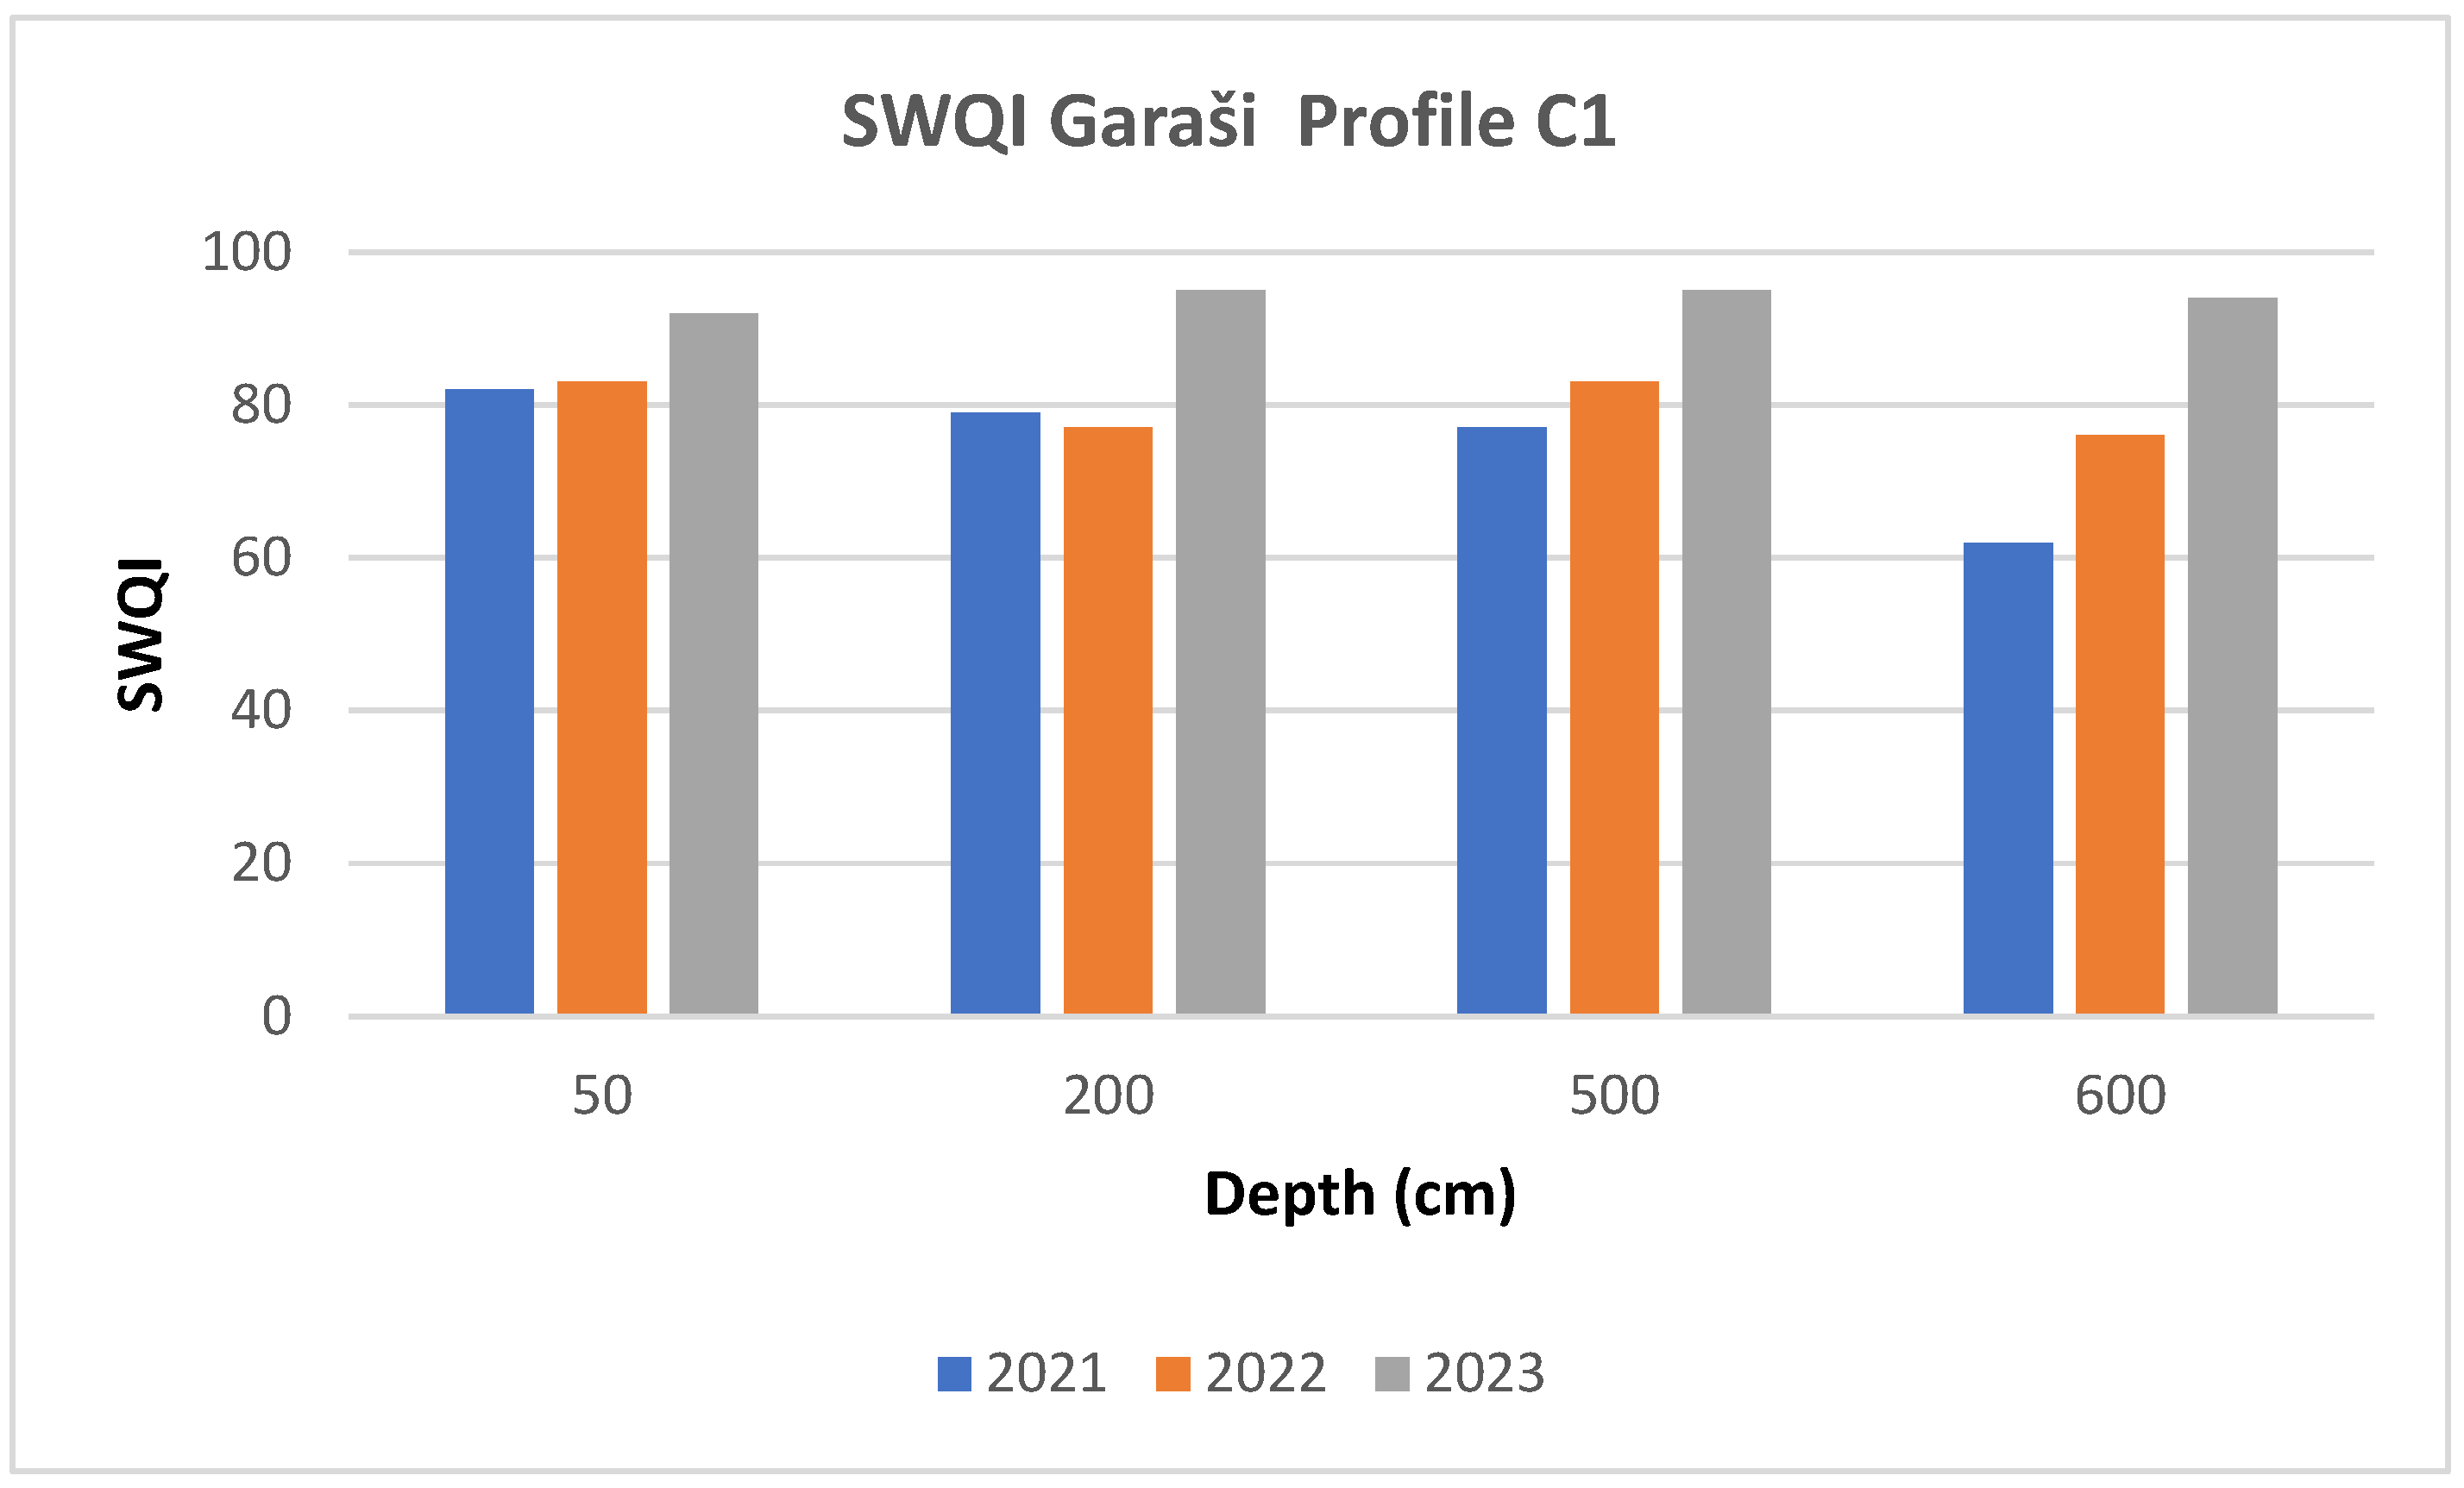
3.1. Serbian Water Quality Index (SWQI)
3.2. Canadian Water Quality Index (CWQI)
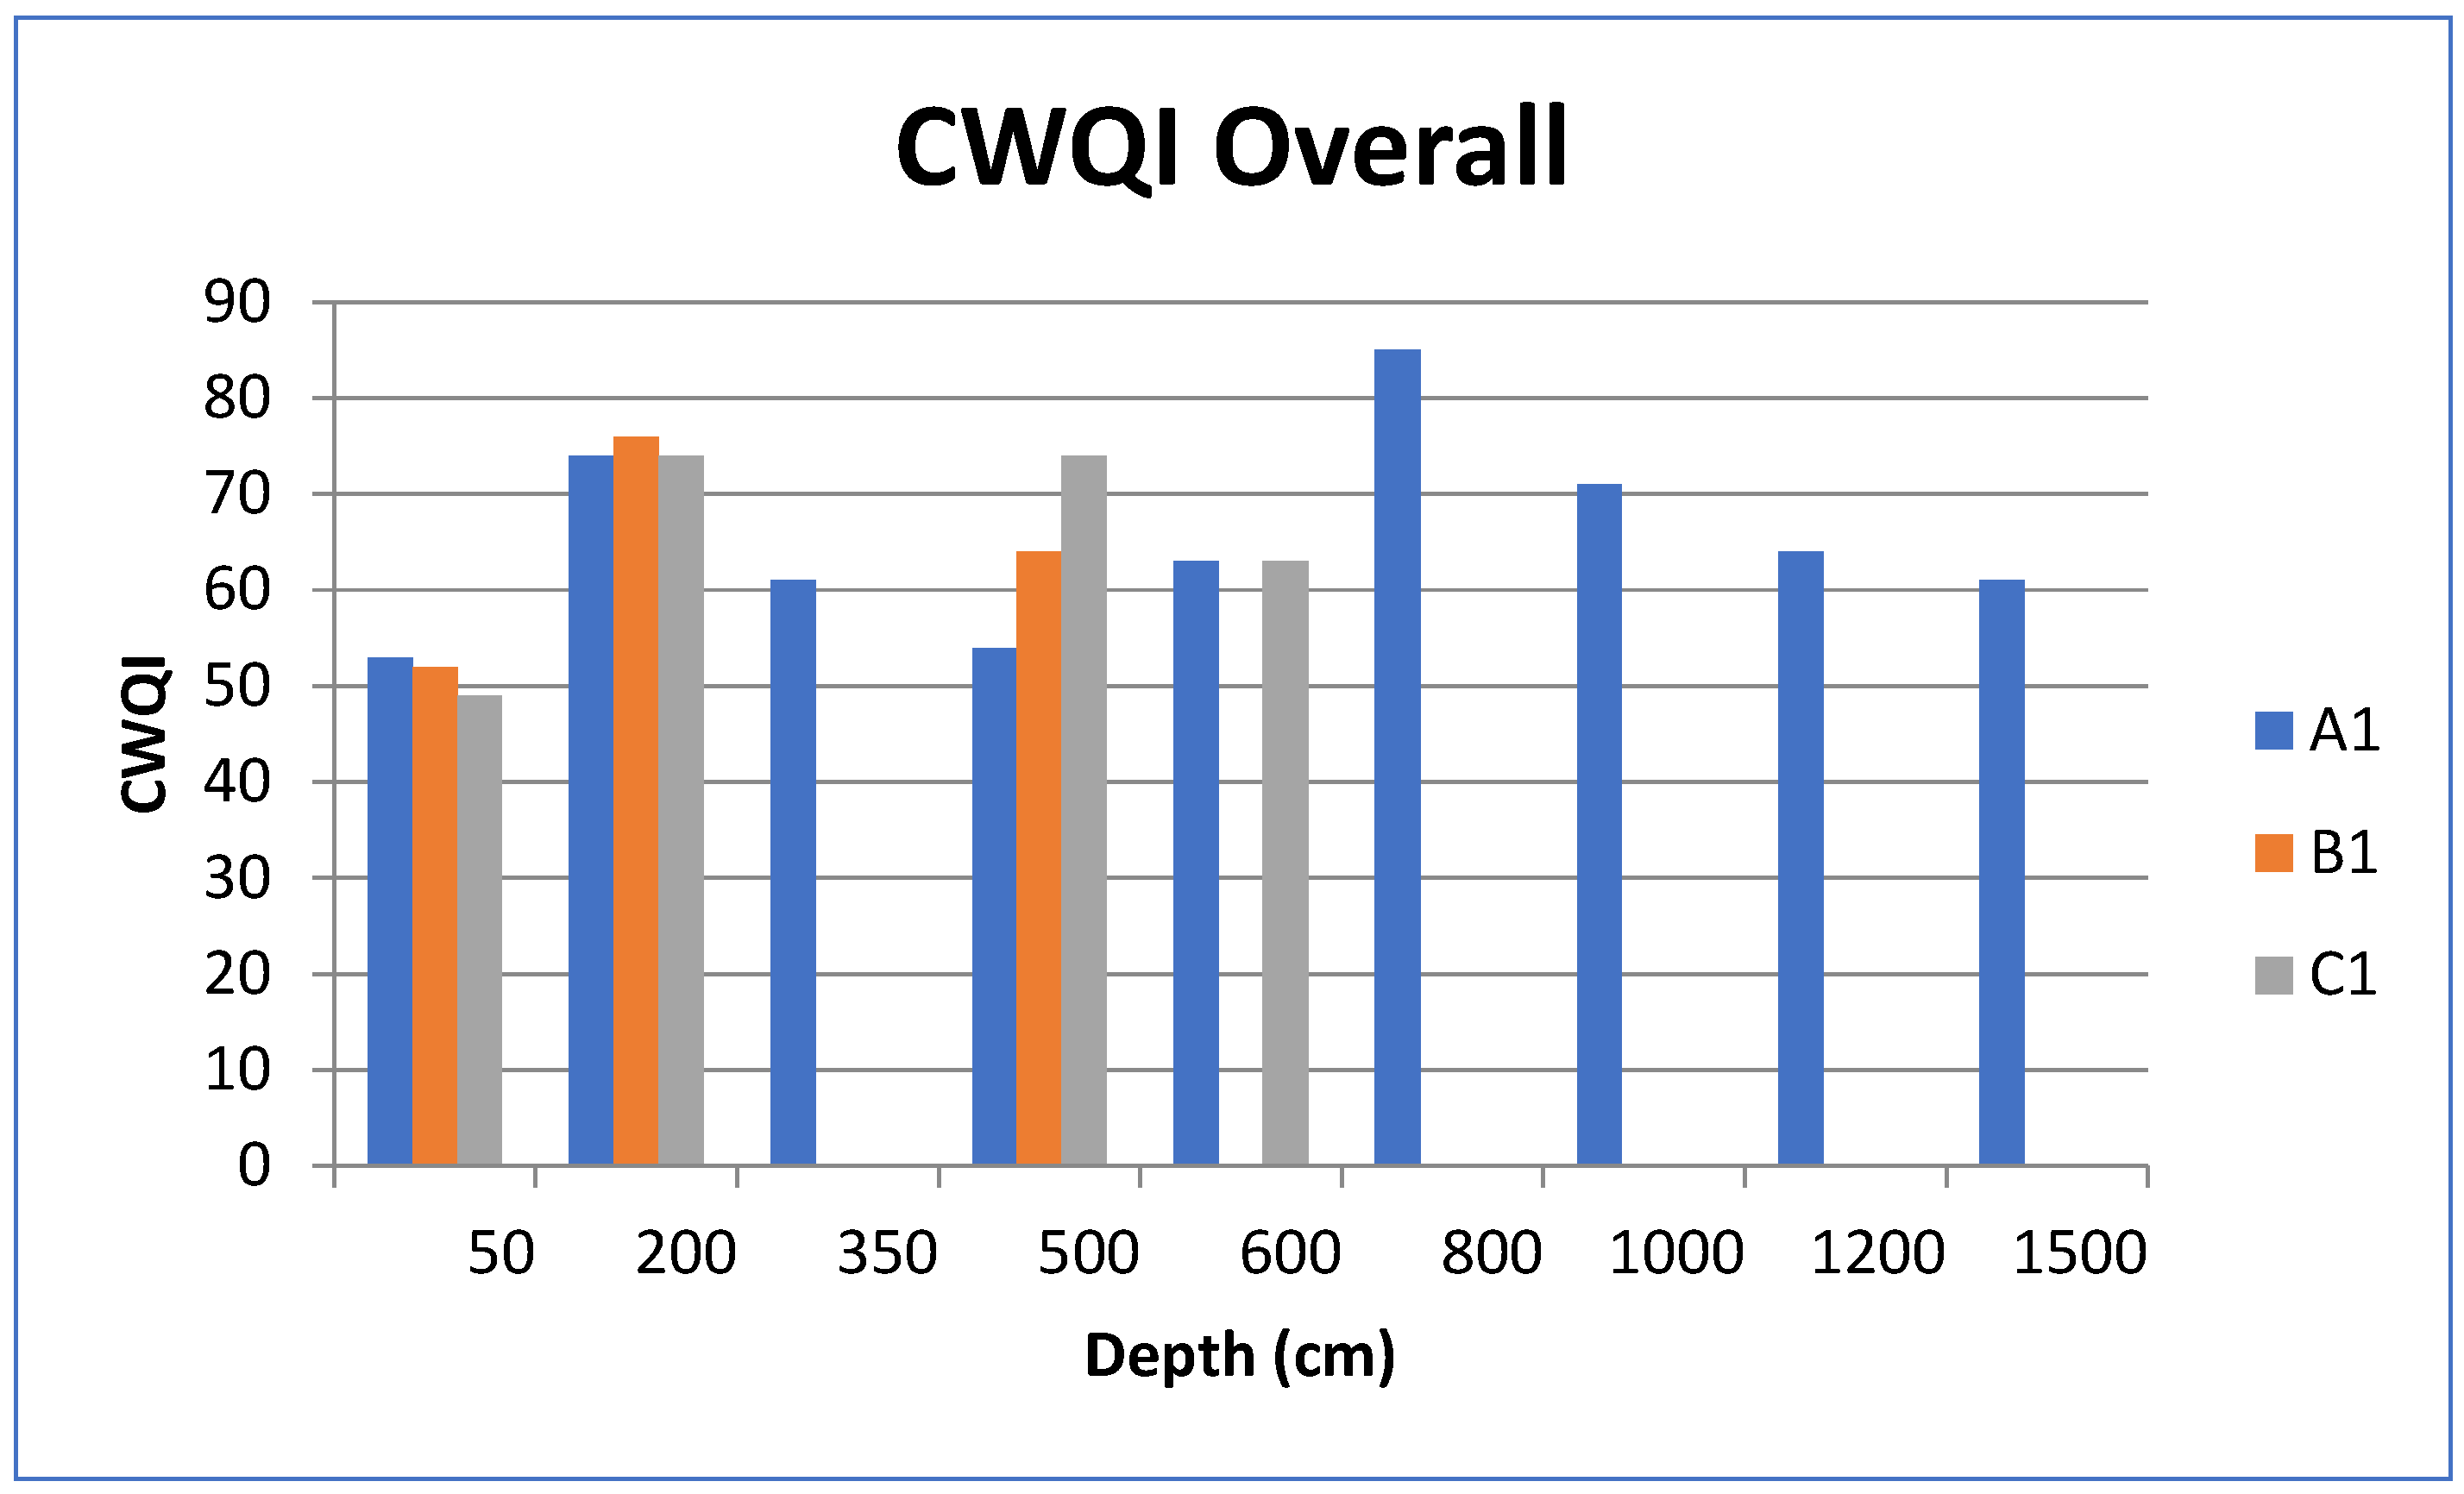
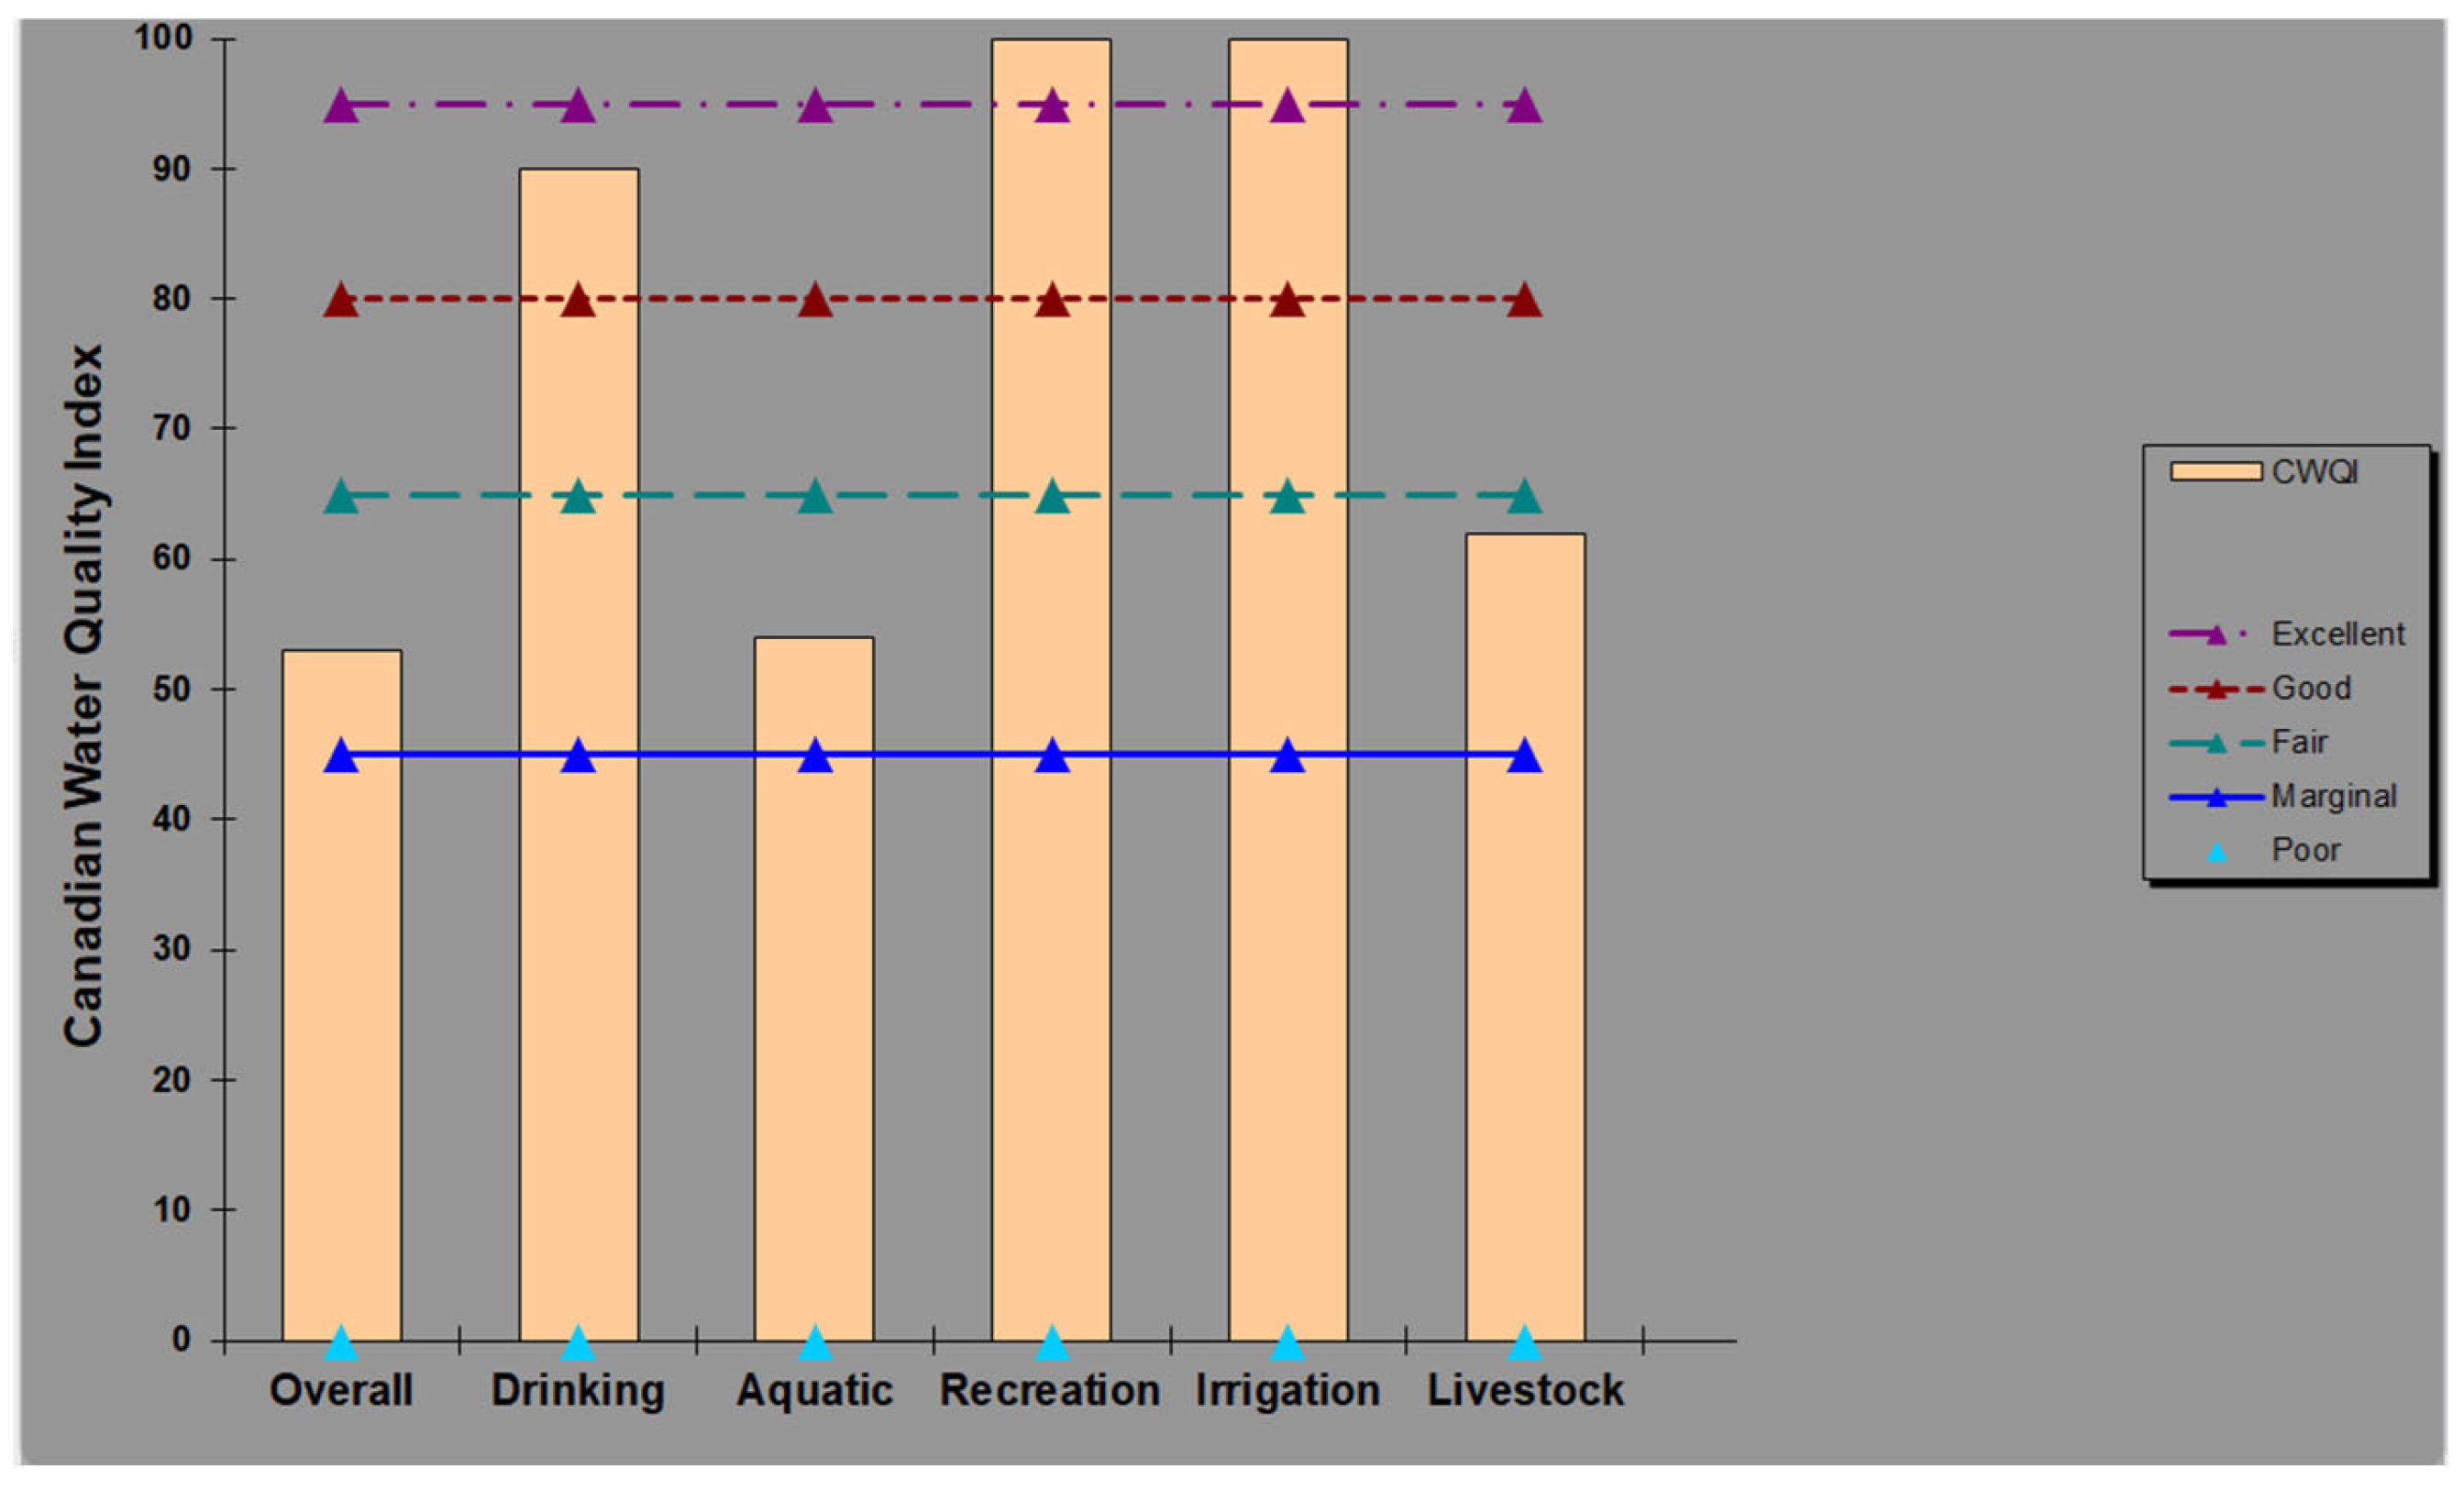
3.2.1. Overall Water Quality
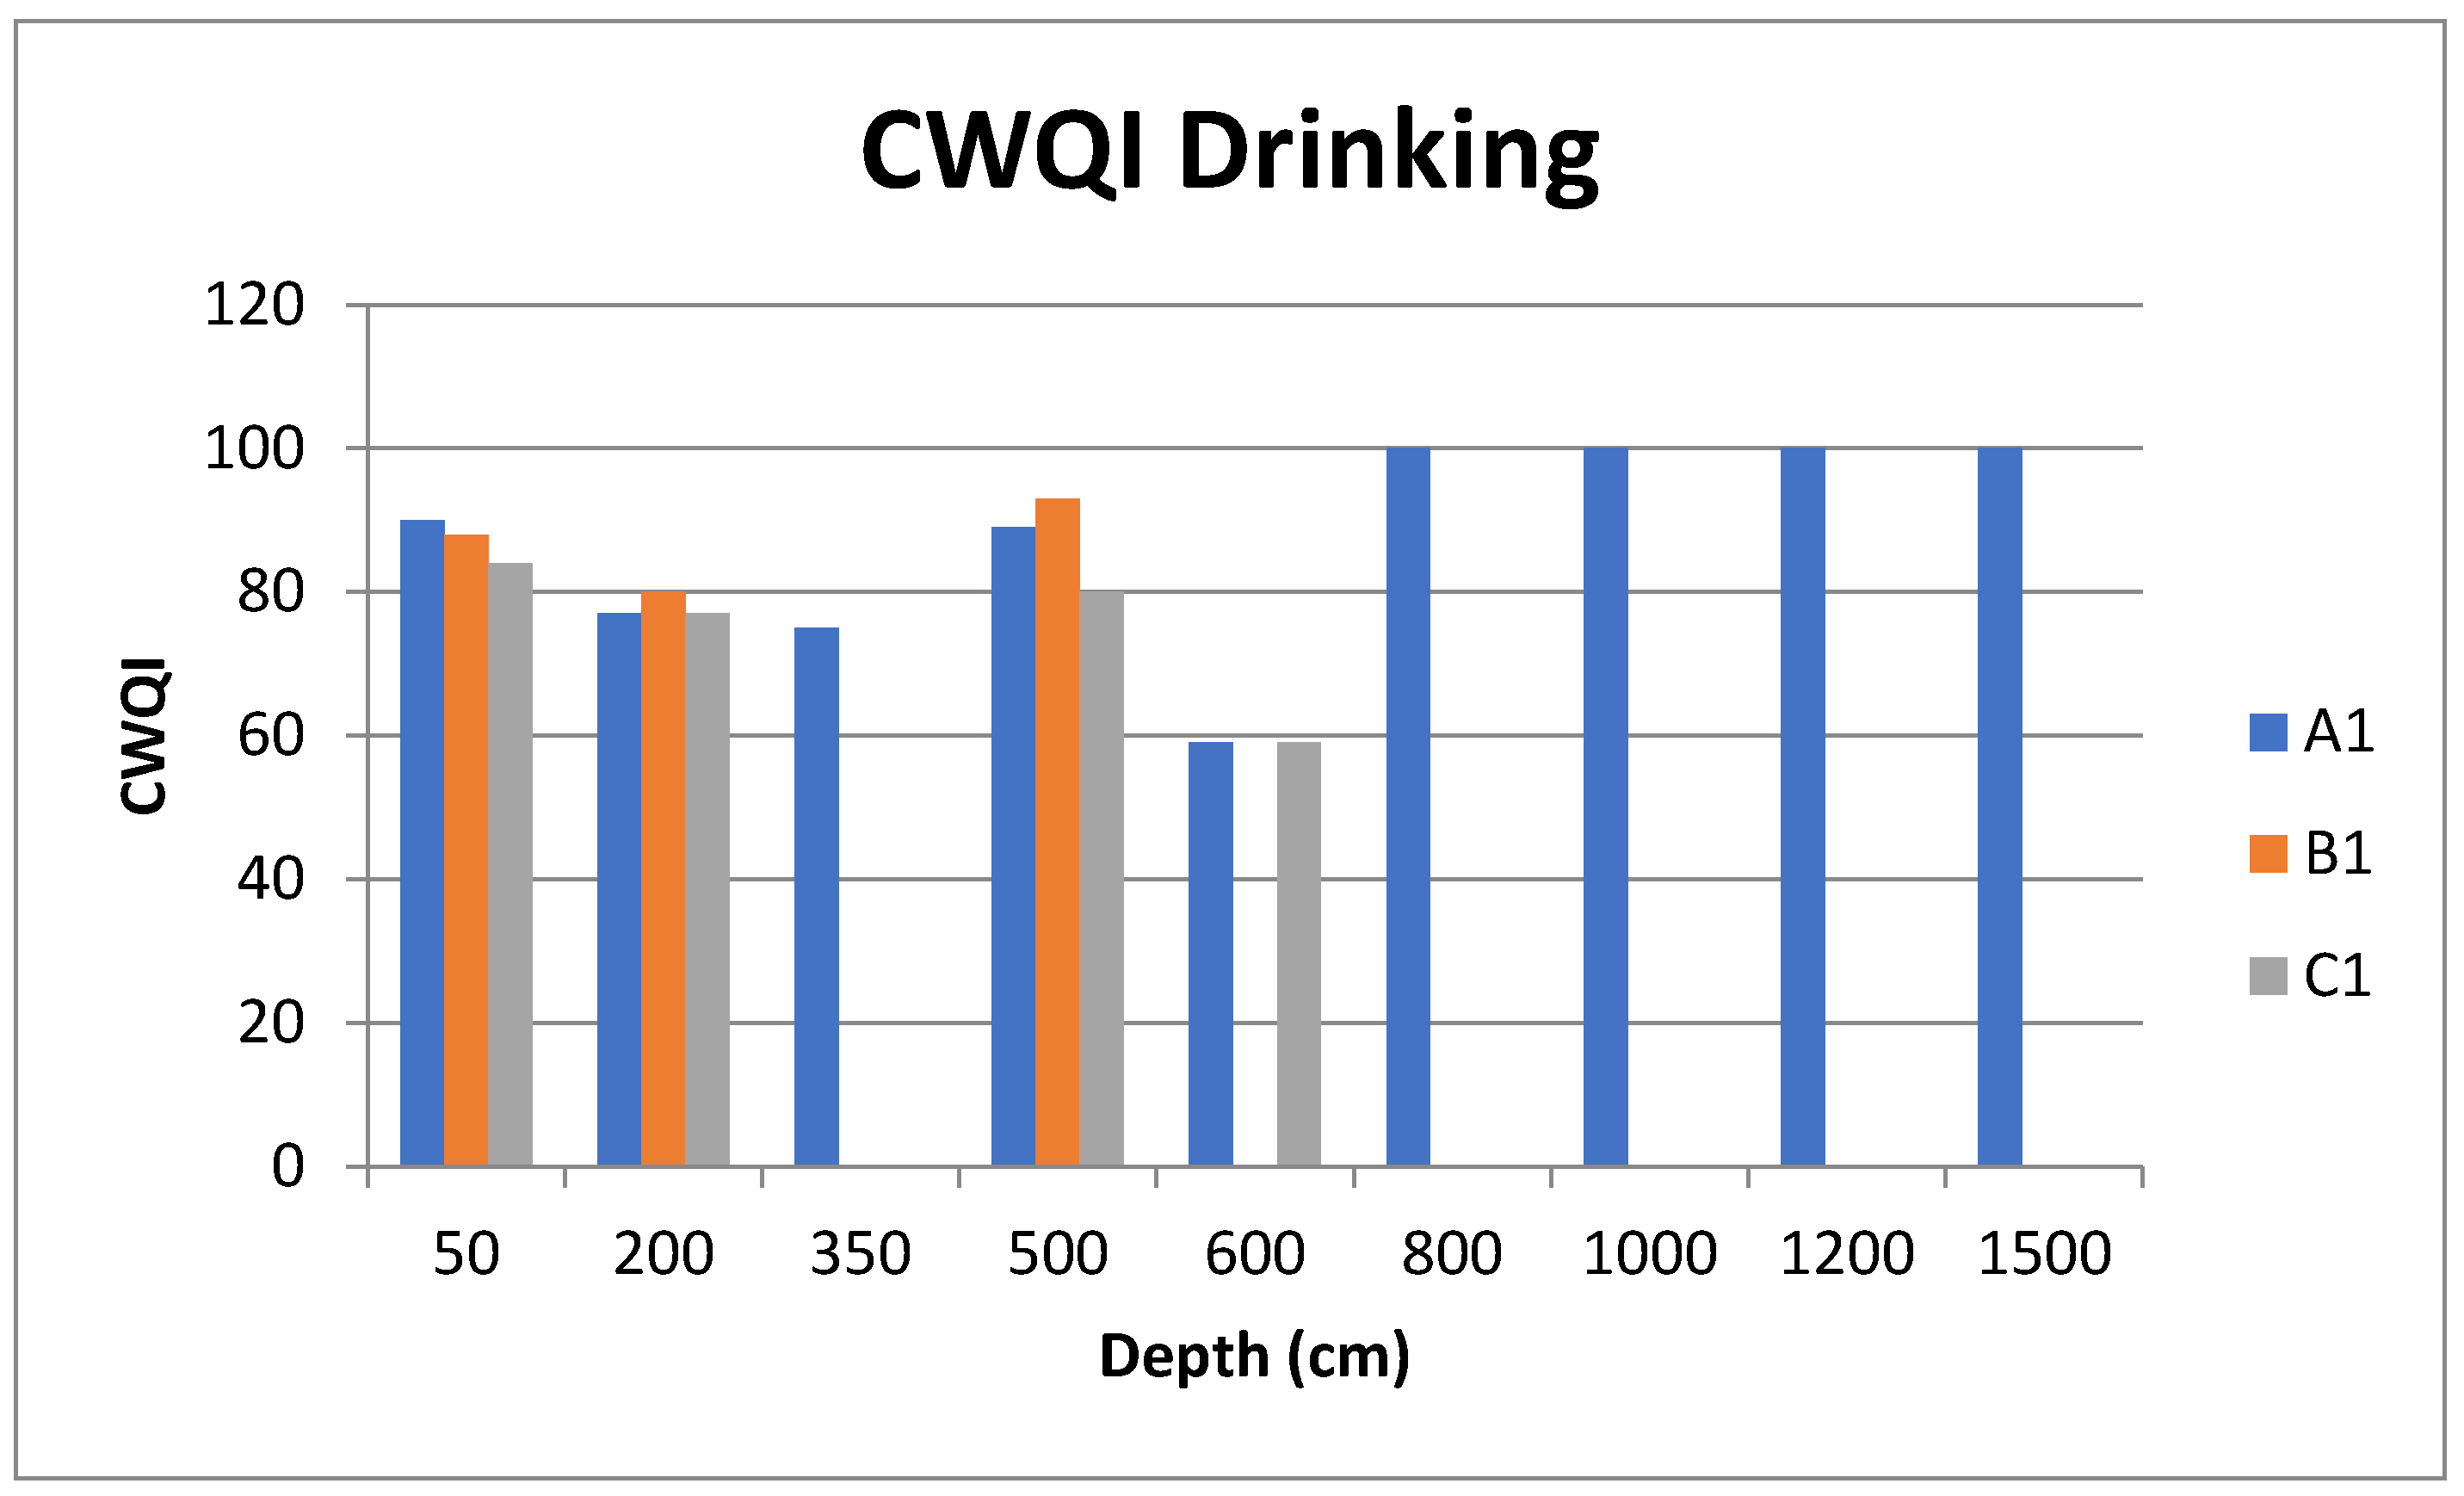
3.2.2. Drinking Water Quality
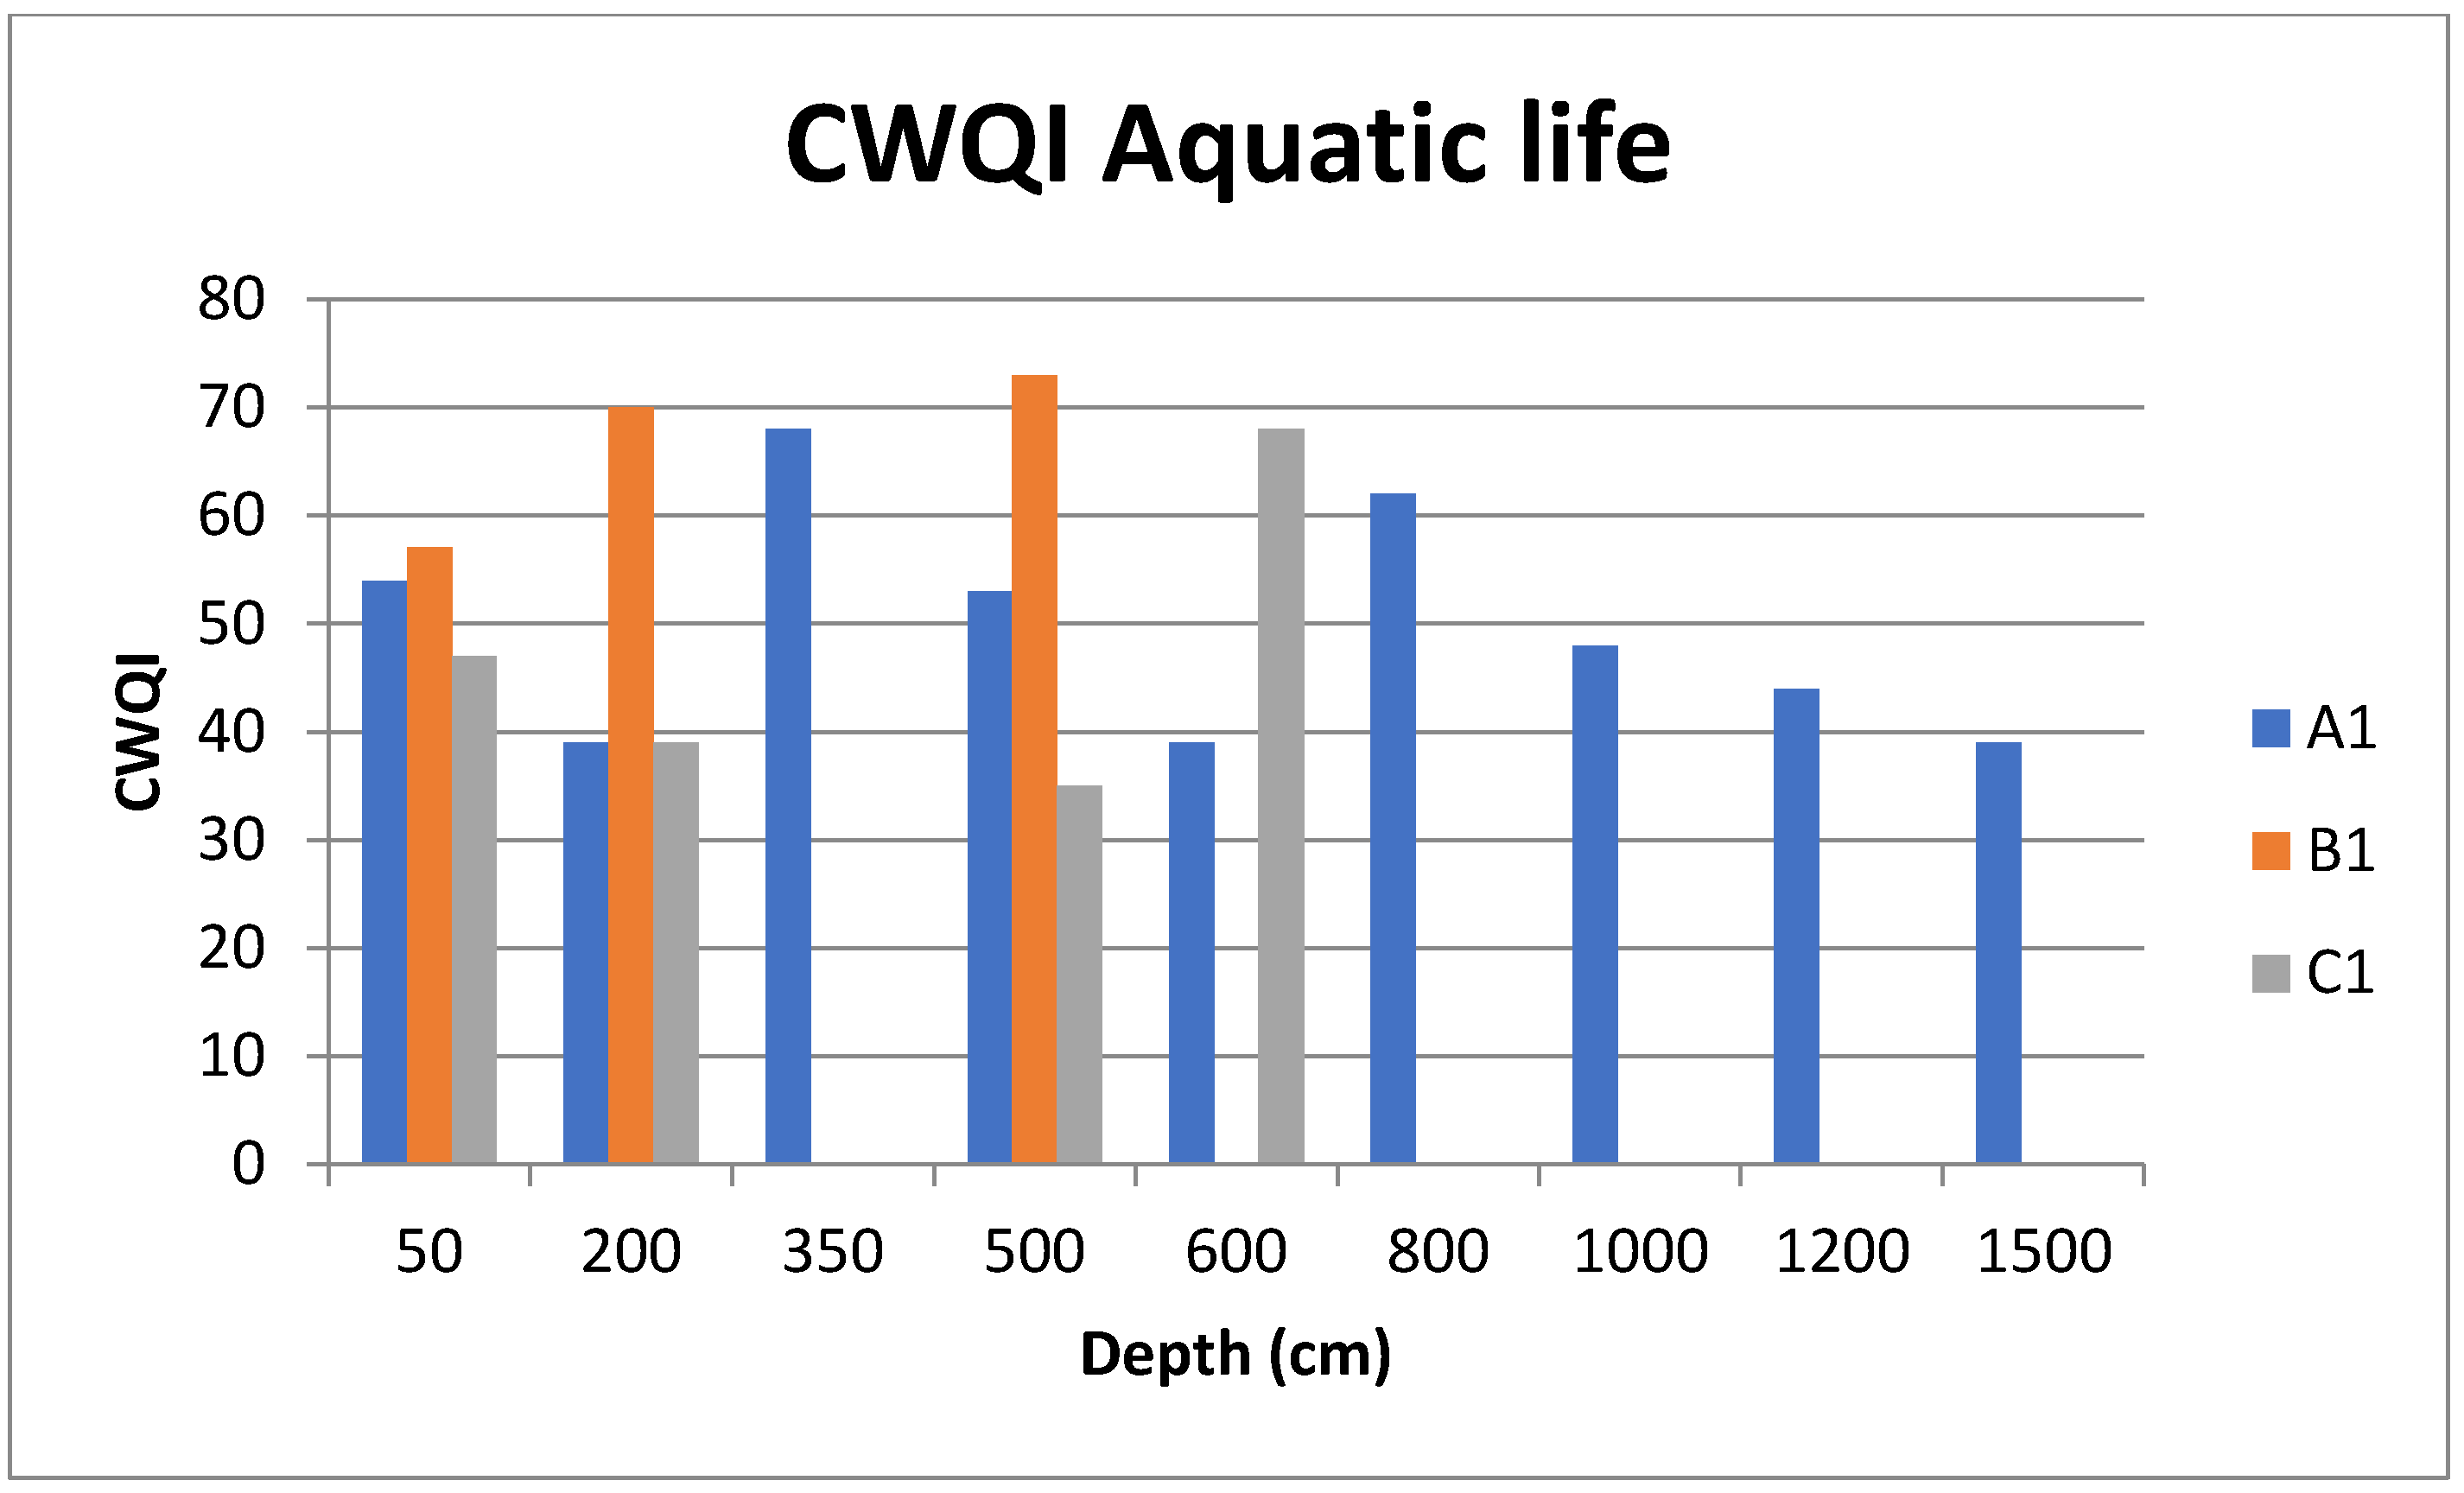
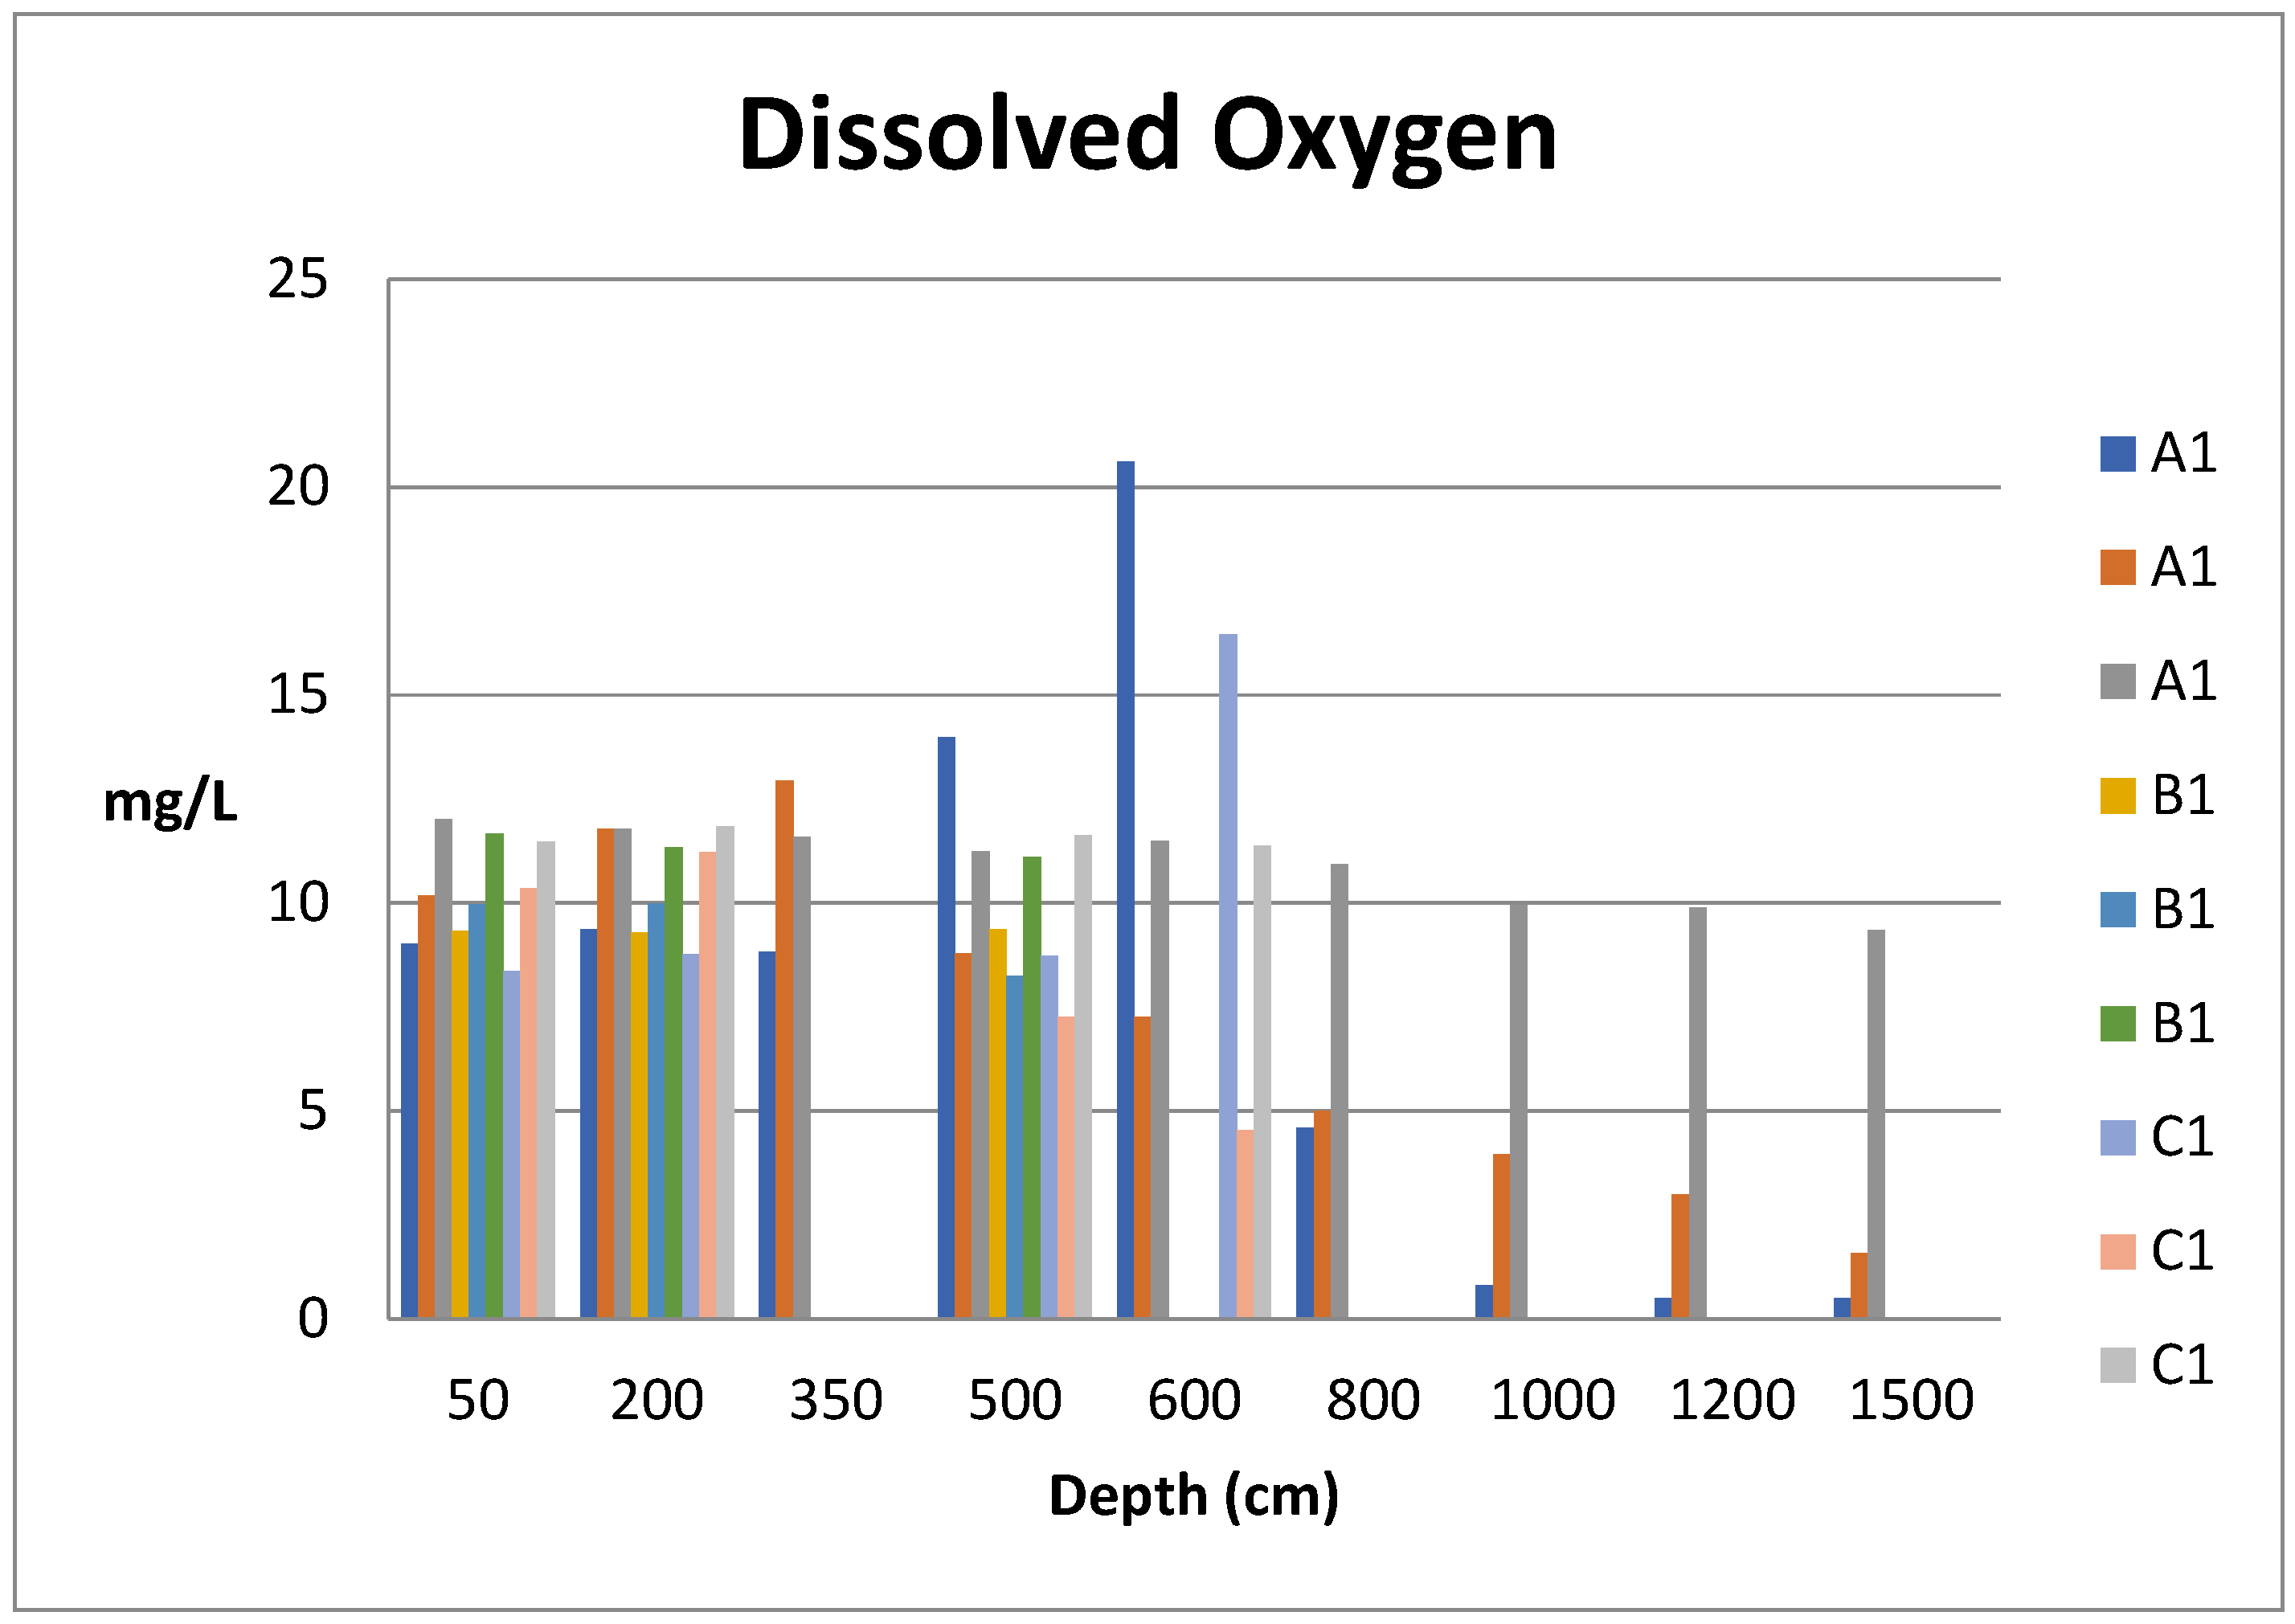
3.2.3. Water Quality for Aquatic Life
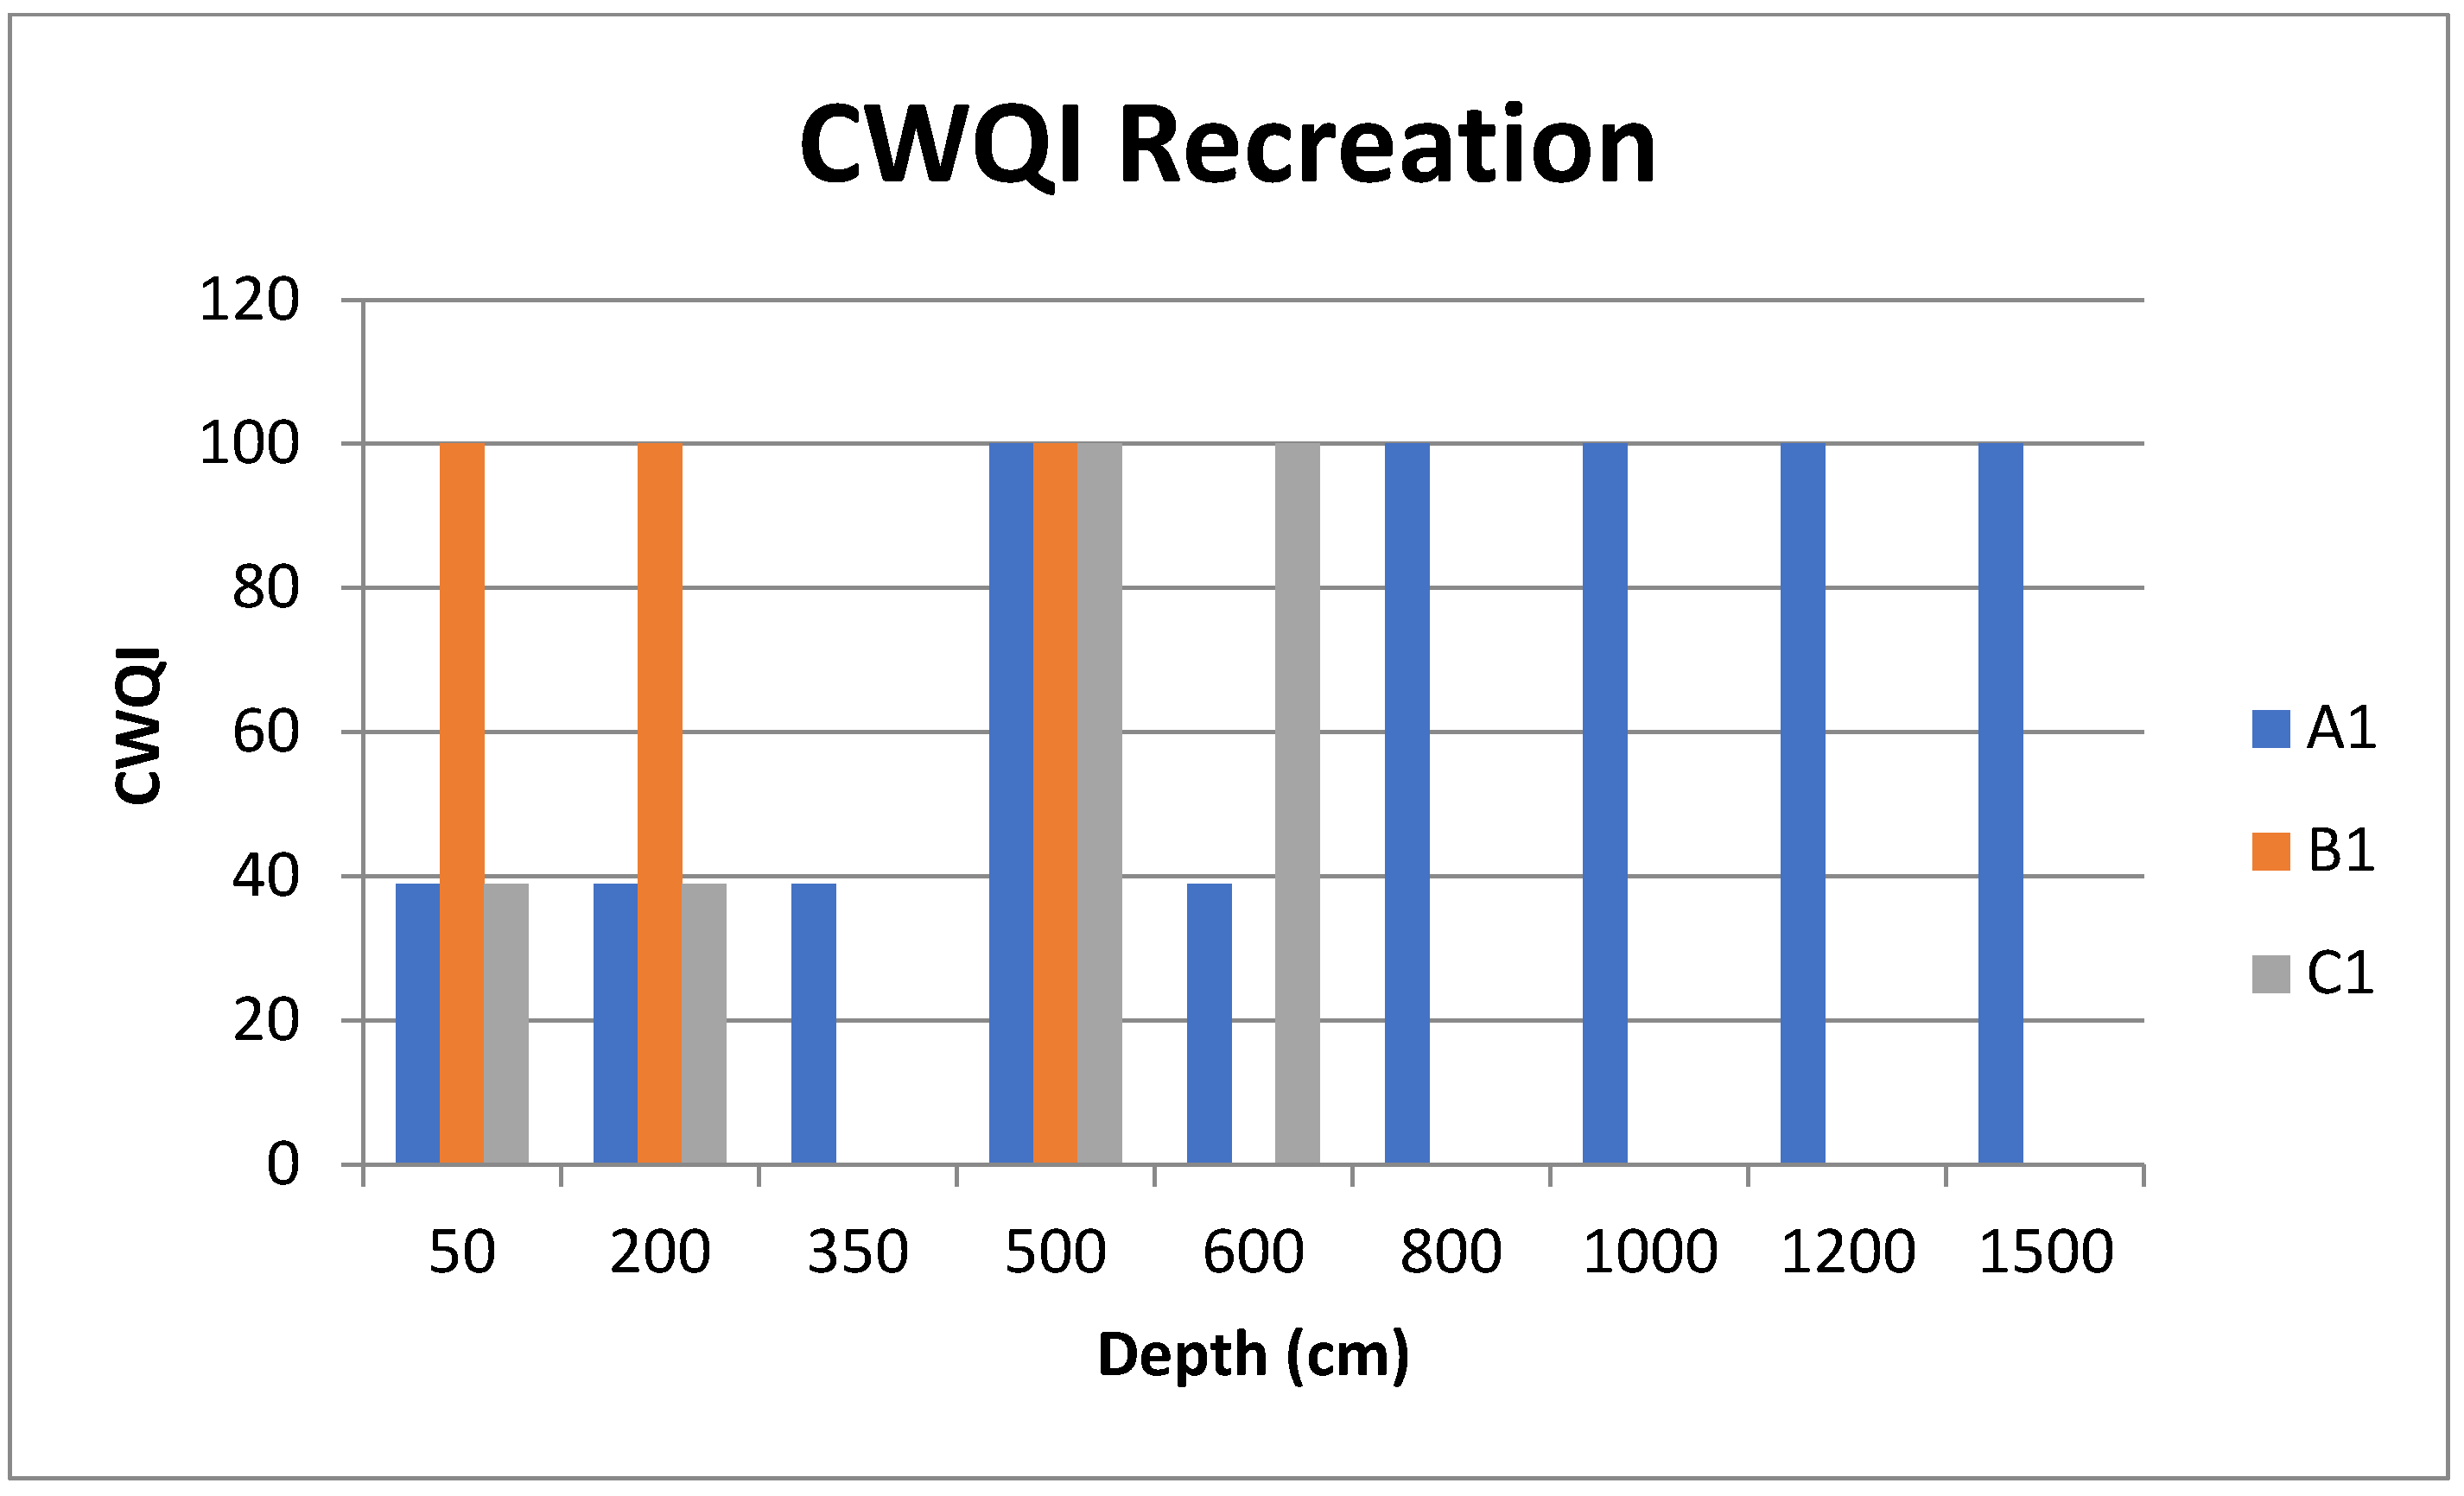
3.2.4. Water Quality for Recreation
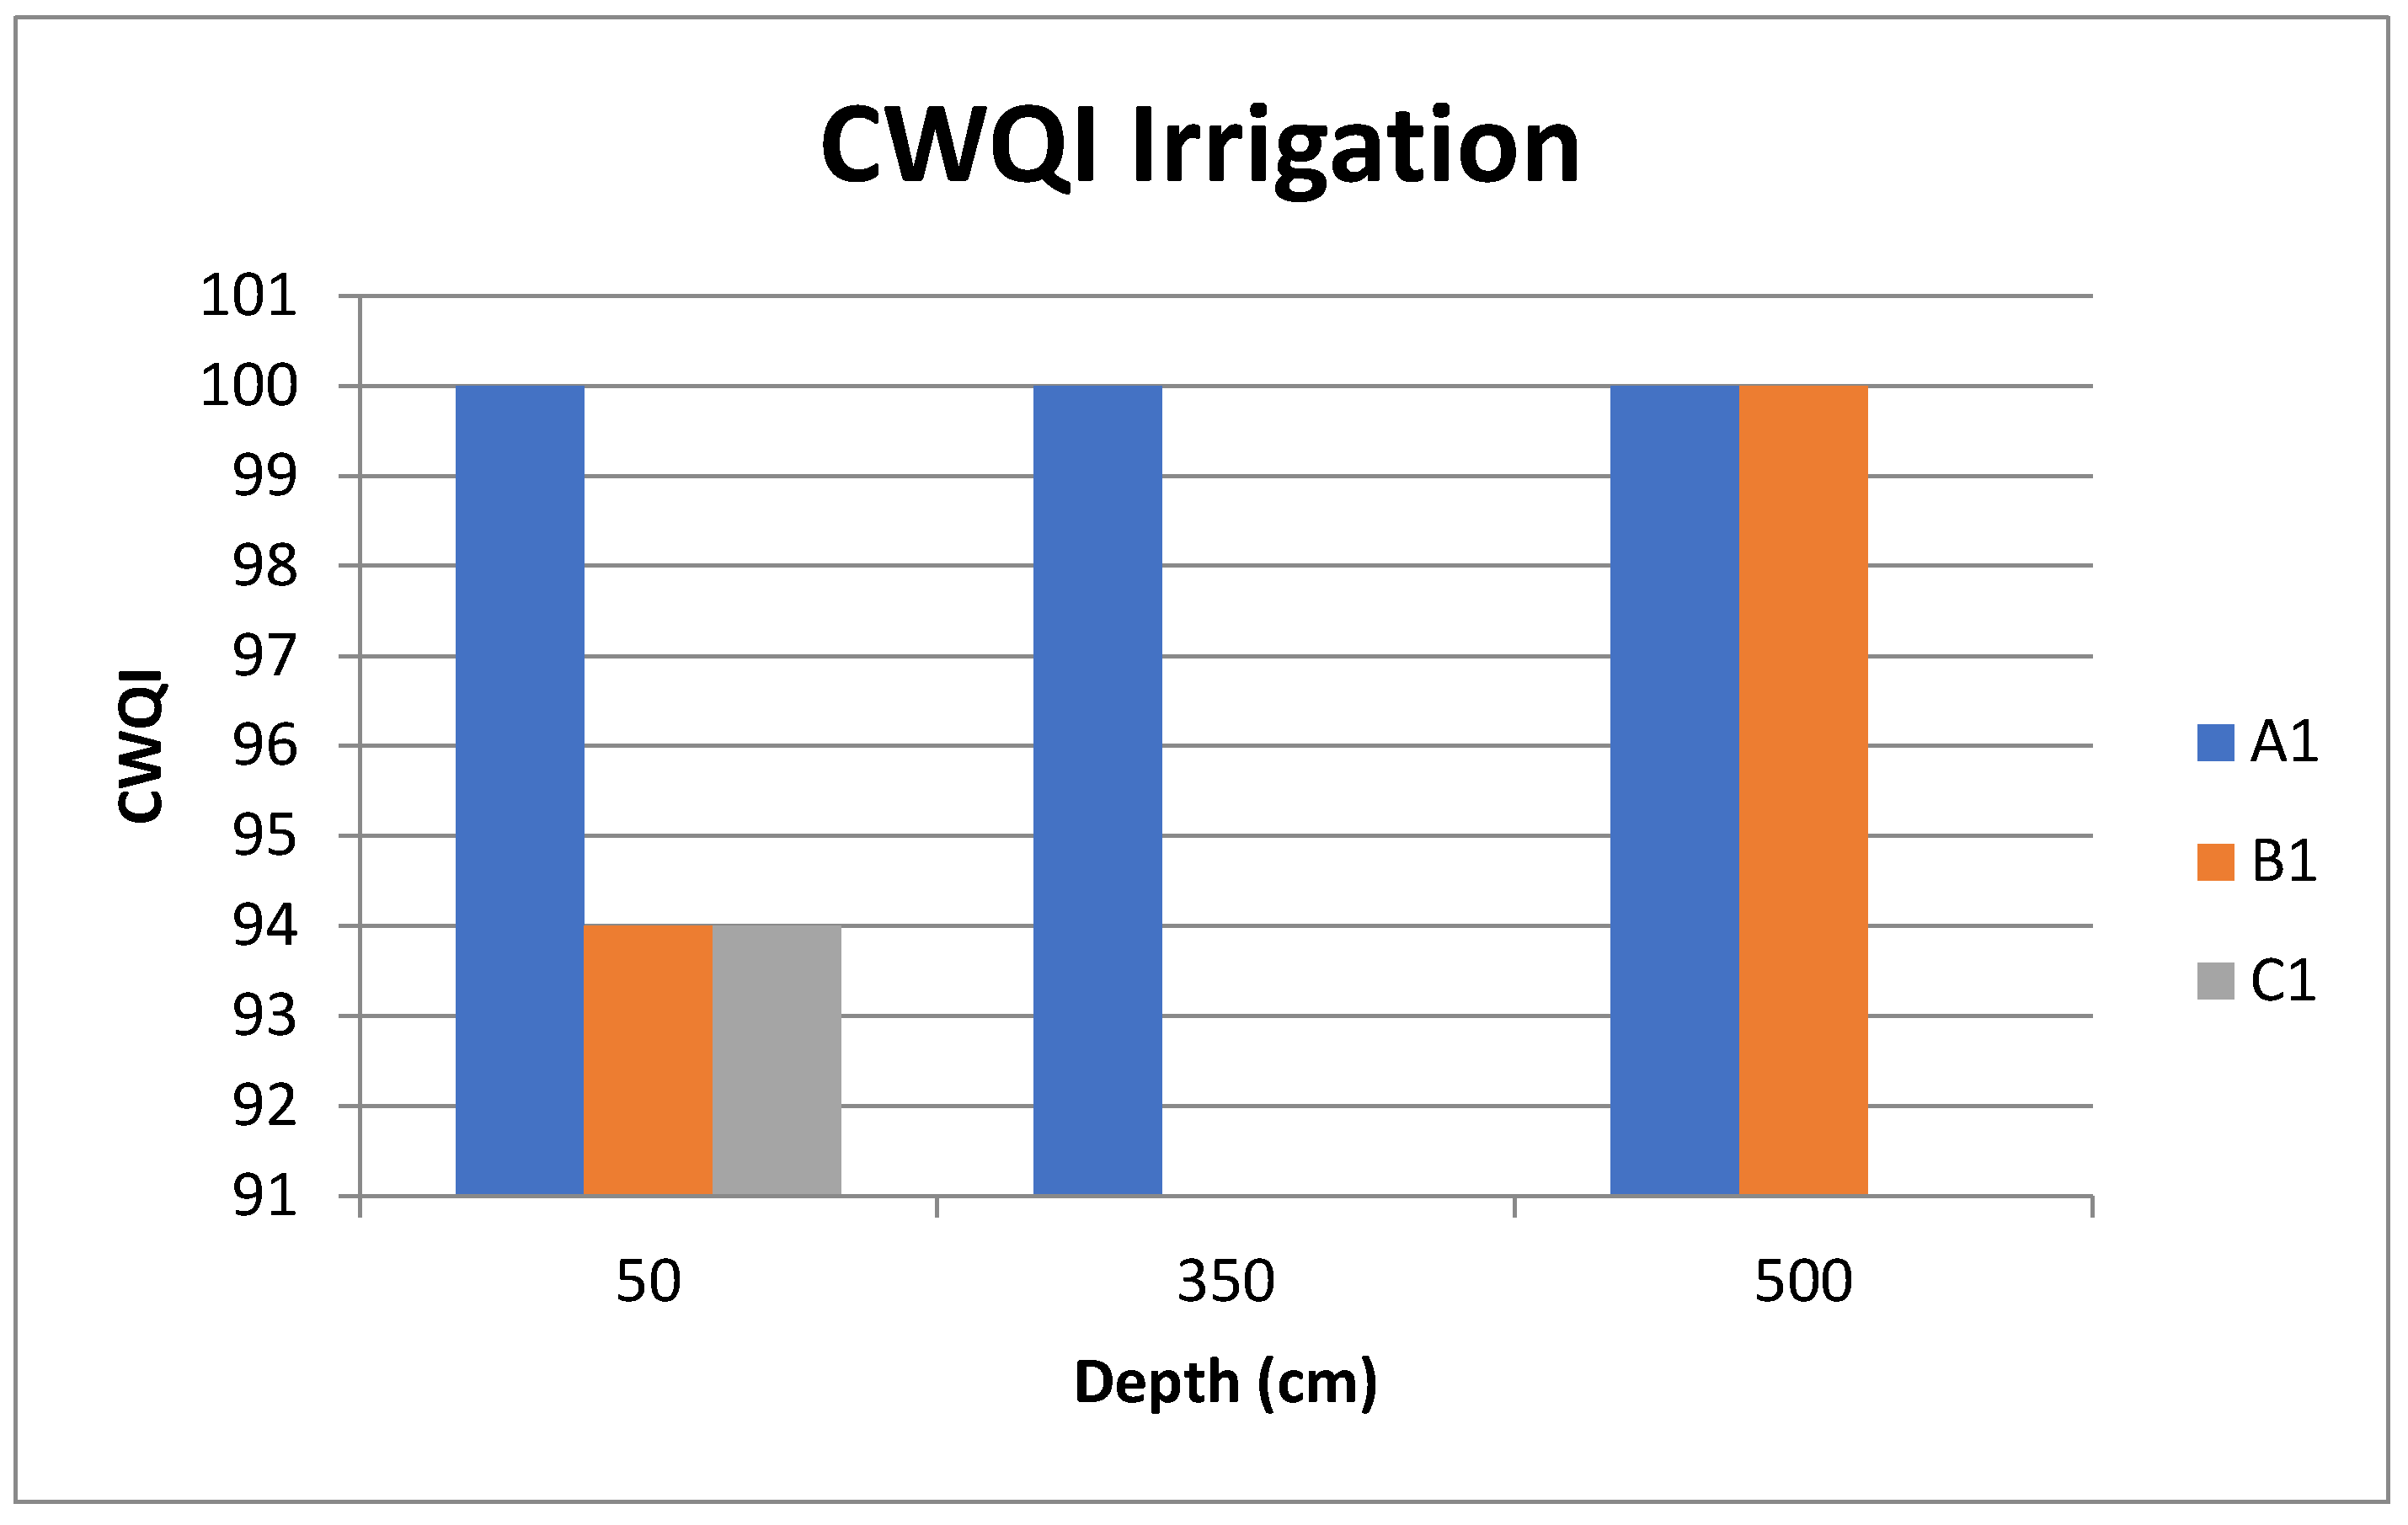
3.2.5. Water Quality for Irrigation
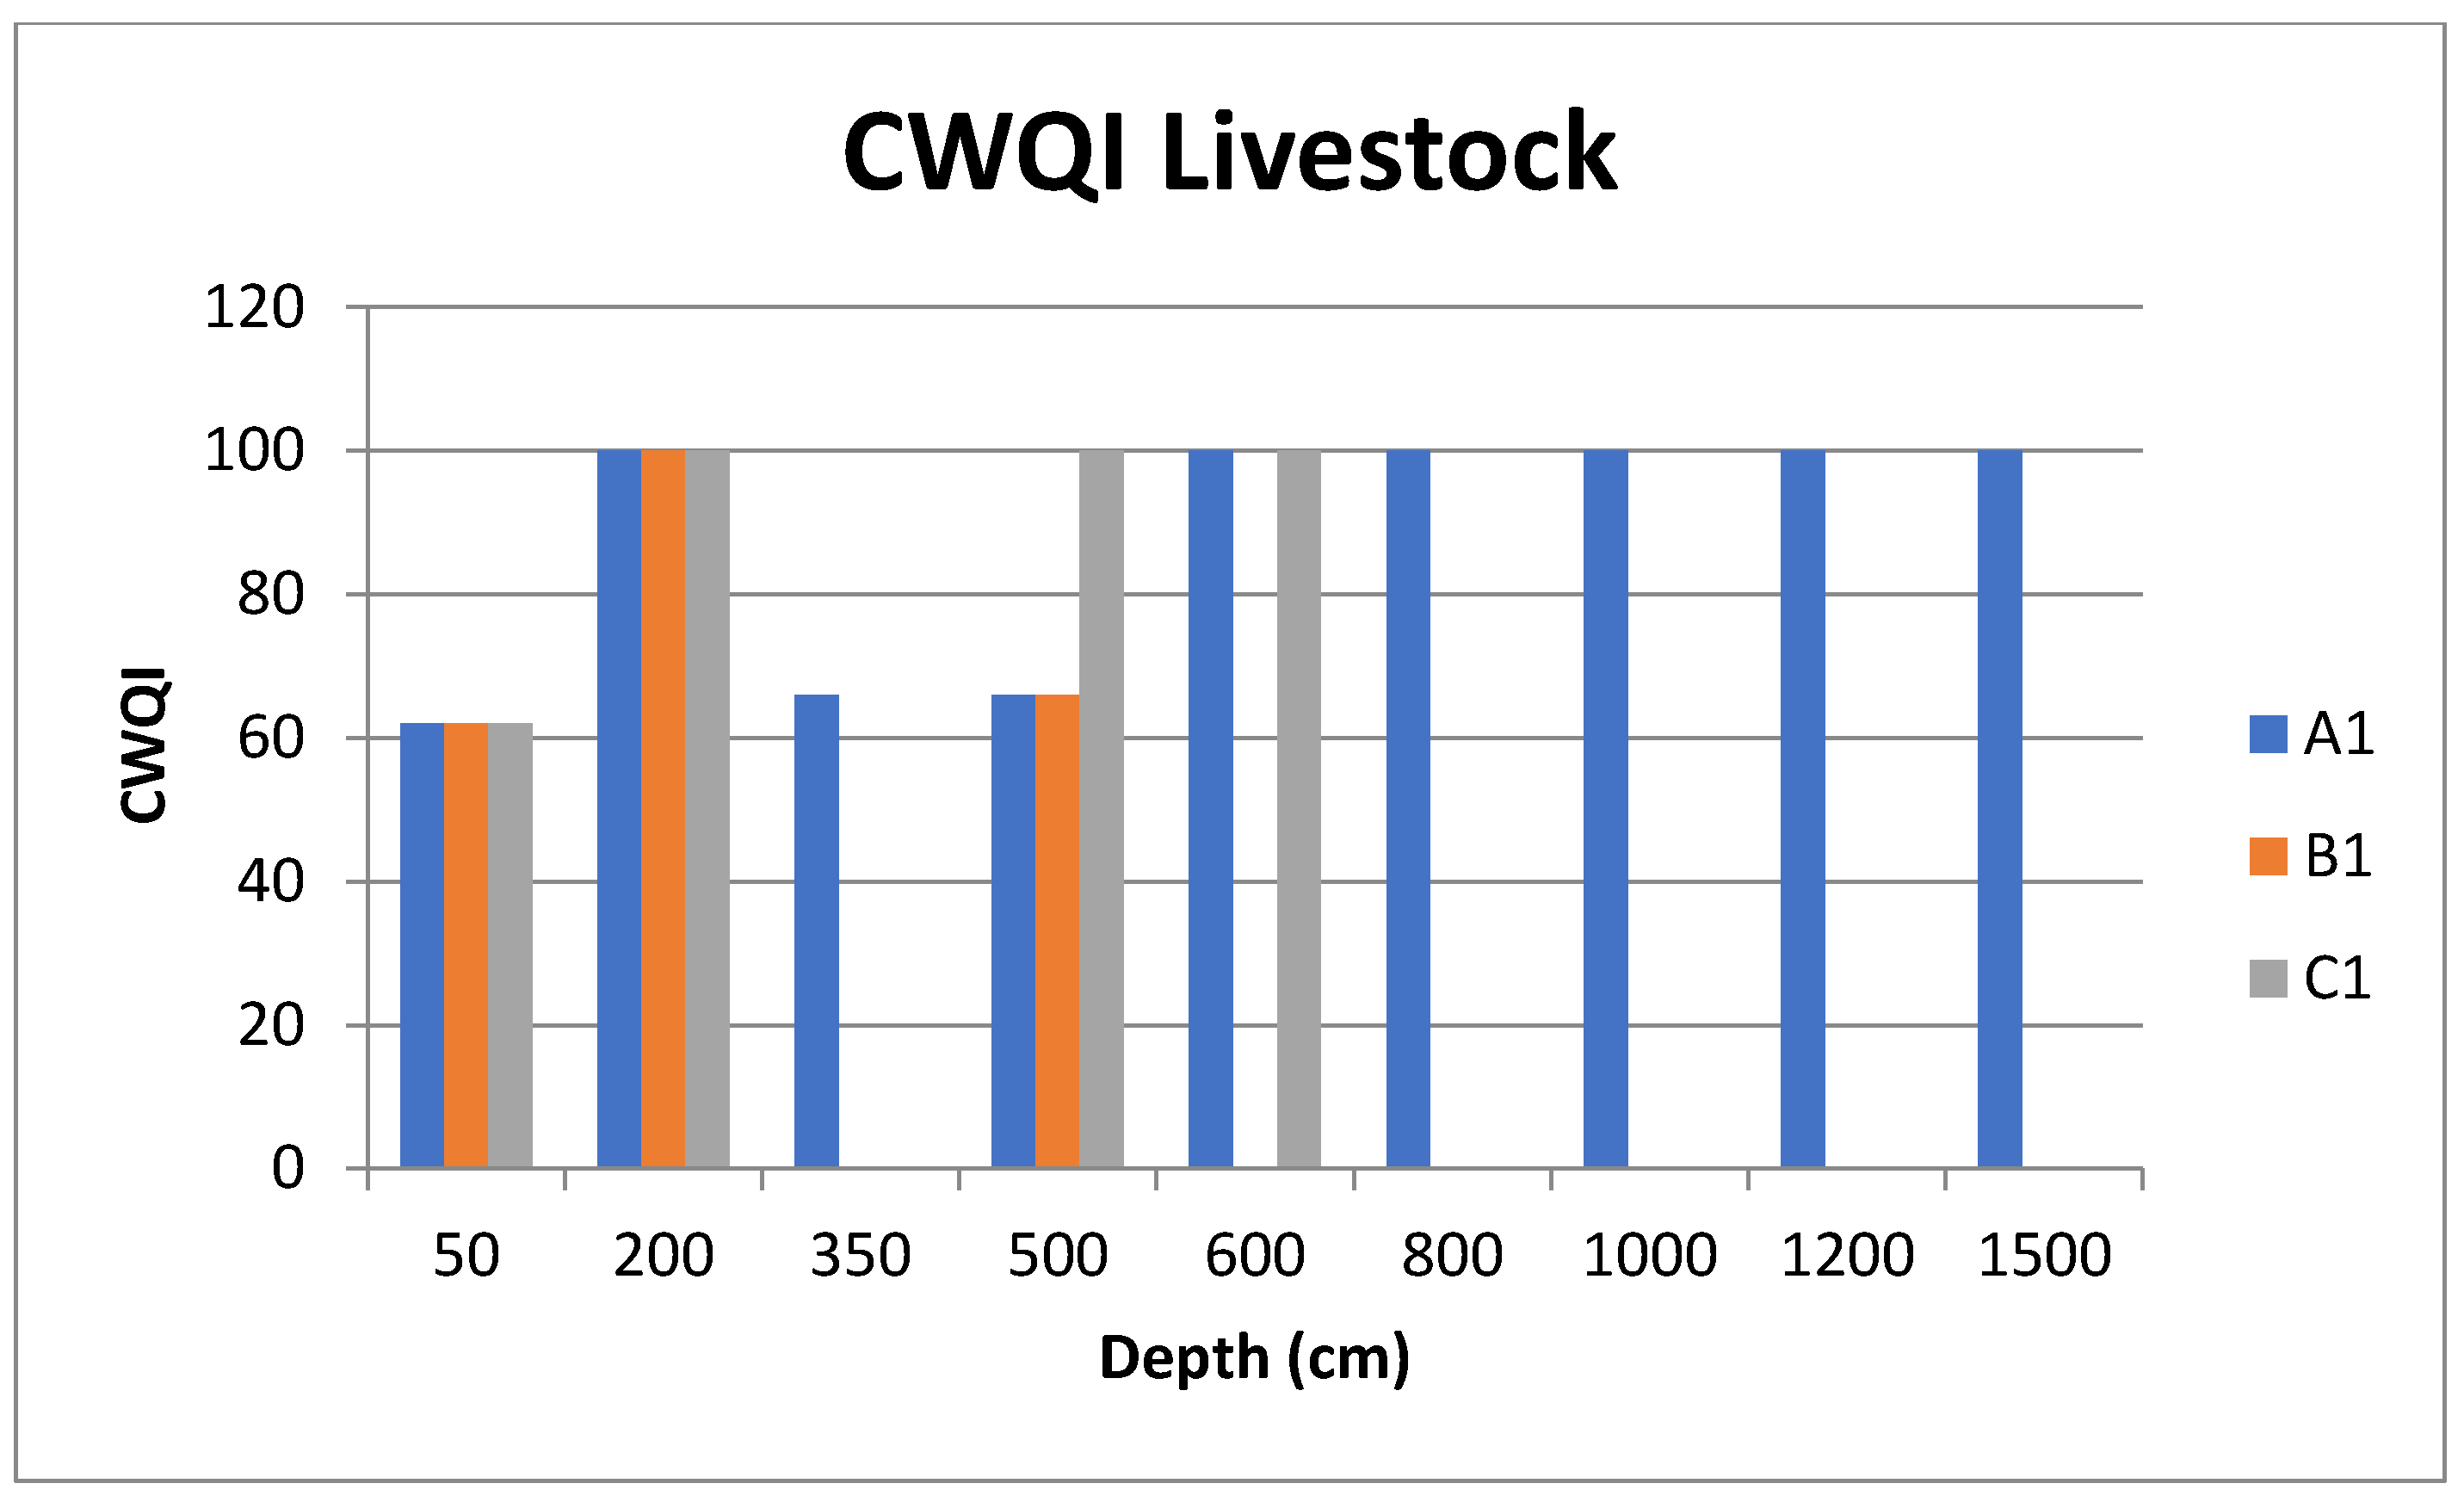
3.2.6. Water Quality for Livestock
3.2.7. CWQI of Velika Bukulja River
4. Discussion
Comparative Analysis of SWQI and CWQI in the Garaši Reservoir
5. Conclusions
Author Contributions
Funding
Institutional Review Board Statement
Informed Consent Statement
Data Availability Statement
Acknowledgments
Conflicts of Interest
References
- World Bank Group. Global Water Security and Sanitation Partnership (GWSP) Annual Report 2023. Available online: http://documents1.worldbank.org/curated/en/099819311142348453/pdf/IDU1448a1d08120cf146961b82218e93df24c73e.pdf (accessed on 31 March 2025).
- UNESCO. The United Nations World Water Development Report 2024—Water for Prosperity and Peace. Available online: https://unesdoc.unesco.org/ark:/48223/pf0000388948 (accessed on 31 March 2025).
- Petrović, A. Challenge of torrential flood risk management. J. Geogr. Inst. Jovan Cvijic SASA 2015, 65, 131–143. [Google Scholar] [CrossRef]
- Milanović Pešić, A.; Jojić Glavonjić, T.; Denda, S.; Jakovljević, D. Sustainable Tourism Development and Ramsar Sites in Serbia: Exploring Residents’ Attitudes and Water Quality Assessment in the Vlasina Protected Area. Sustainability 2023, 15, 15391. [Google Scholar] [CrossRef]
- Wei, W.; Gao, Y.; Huang, J.; Gao, J. Exploring the effect of basin land degradation on lake and reservoir water quality in China. J. Clean. Prod. 2020, 268, 122249. [Google Scholar] [CrossRef]
- Kobler, U.G.; Wüest, A.; Schmid, M. Effects of lake–reservoir pumped-storage operations on temperature and water quality. Sustainability 2018, 10, 1968. [Google Scholar] [CrossRef]
- Gu, Q.; Zhang, Y.; Ma, L.; Li, J.; Wang, K.; Zheng, K.; Zhang, X.; Sheng, L. Assessment of reservoir water quality using multivariate statistical techniques: A case study of Qiandao Lake, China. Sustainability 2016, 8, 243. [Google Scholar] [CrossRef]
- Al-Taani, A.A.; El-Radaideh, N.M.; Al Khateeb, W.M.; Bsoul, A.A. Reservoir water quality: A case from Jordan. Environ. Monit. Assess. 2018, 190, 604. [Google Scholar] [CrossRef]
- Vasistha, P.; Ganguly, R. Water quality assessment of natural lakes and its importance: An overview. Mater. Today Proc. 2020, 32, 544–552. [Google Scholar] [CrossRef]
- Amirkani, M.; Haddad, O.B.; Ashofteh, P.S.; Loáiciga, H.A. Determination of the optimal level of water releases from a reservoir to control water quality. J. Hazard. Toxic Radioact. Waste 2016, 20, 04015017. [Google Scholar] [CrossRef]
- Atique, U.; An, K.G. Reservoir Water Quality Assessment Based on Chemical Parameters and the Chlorophyll Dynamics in Relation to Nutrient Regime. Pol. J. Environ. Stud. 2019, 28, 1043–1061. [Google Scholar] [CrossRef]
- Woldeab, B.; Beyene, A.; Ambelu, A.; Duffam, I.; Mereta, S.T. Seasonal and spatial variation of reservoir water quality in the southwest of Ethiopia. Environ. Monit. Assess. 2018, 190, 163. [Google Scholar] [CrossRef]
- Dukiya, J.J.; Ojoye, S.; Morenikeji, G. Poverty induced artisanal mining impact on municipal water utilities; the case of Kpapi river in Minna, Nigeria. Nat. Haz. Res. 2024, 4, 265–273. [Google Scholar] [CrossRef]
- Marcuello, C. Present and future opportunities in the use of atomic force microscopy to address the physico-chemical properties of aquatic ecosystems at the nanoscale level. Int. Aquat. Res. 2022, 14, 233–240. [Google Scholar] [CrossRef]
- Gökçe, D. The importance and effectiveness of aquatic biomonitoring. In New Paradigms in Environmental Biomonitoring Using Plants; Tiwari, S., Agrawal, S., Eds.; Elsevier: Amsterdam, The Netherlands; Oxford, UK; Cambridge, MA, USA, 2022; pp. 45–72. [Google Scholar] [CrossRef]
- Bhateria, R.; Jain, D. Water quality assessment of lake water: A review. Sustain. Water Resour. Manag. 2016, 2, 161–173. [Google Scholar] [CrossRef]
- Abd Aziz, N.A.; Toriman, M.E.; Gasim, M.B.; Muftah, S.; Barggig, A.; Kamarudin, M.K.A. Water Quality Deterioration in Artificial Lake: Their Impact and Sources. Int. J. Adv. Sci. Eng. Inf. Technol. 2017, 7, 49–56. [Google Scholar] [CrossRef]
- Abualhaija, M.M.; Abu Hilal, A.H.; Shammout, M.W.; Mohammad, A.H. Assessment of reservoir water quality using water quality indices: A case study from Jordan. Int. J. Eng. Res. Technol. 2020, 13, 397–406. [Google Scholar] [CrossRef]
- Lee, Y.; Kim, J.K.; Jung, S.; Eum, J.; Kim, C.; Kim, B. Development of a water quality index model for lakes and reservoirs. Paddy Water Environ. 2014, 12, 19–28. [Google Scholar] [CrossRef]
- Naveedullah, N.; Hashmi, M.Z.; Yu, C.; Shen, C.; Muhammad, N.; Shen, H.; Chen, Y. Water quality characterization of the Siling Reservoir (Zhejiang, China) using water quality index. CLEAN Soil Air Water 2016, 44, 553–562. [Google Scholar] [CrossRef]
- Hou, W.; Sun, S.; Wang, M.; Li, X.; Zhang, N.; Xin, X.; Sun, L.; Li, W.; Jia, R. Assessing water quality of five typical reservoirs in lower reaches of Yellow River, China: Using a water quality index method. Ecol. Indic. 2016, 61, 309–316. [Google Scholar] [CrossRef]
- Wu, Z.; Zhang, D.; Cai, Y.; Wang, X.; Zhang, L.; Chen, Y. Water quality assessment based on the water quality index method in Lake Poyang: The largest freshwater lake in China. Sci. Rep. 2017, 7, 17999. [Google Scholar] [CrossRef]
- De La Mora-Orozco, C.; Flores-Lopez, H.; Rubio-Arias, H.; Chavez-Duran, A.; Ochoa-Rivero, J. Developing a water quality index (WQI) for an irrigation dam. Int. J. Environ. Res. Pub. Health 2017, 14, 439. [Google Scholar] [CrossRef]
- Rubio-Arias, H.; Contreras-Caraveo, M.; Quintana, R.M.; Saucedo-Teran, R.A.; Pinales-Munguia, A. An overall water quality index (WQI) for a man-made aquatic reservoir in Mexico. Int. J. Environ. Res. Pub. Health 2012, 9, 1687–1698. [Google Scholar] [CrossRef] [PubMed]
- Das Kangabam, R.; Bhoominathan, S.D.; Kanagaraj, S.; Govindaraju, M. Development of a water quality index (WQI) for the Loktak Lake in India. Appl. Water Sci. 2017, 7, 2907–2918. [Google Scholar] [CrossRef]
- Sudarshan, P.; Mahesh, M.K.; Ramachandra, T.V. Assessment of seasonal variation in water quality and water quality index (WQI) of Hebbal Lake, Bangalore, India. Environ. Ecol. 2019, 37, 309–317. [Google Scholar]
- Qureshimatva, U.M.; Maurya, R.R.; Gamit, S.B.; Patel, R.D.; Solanki, H.A. Determination of physico-chemical parameters and Water quality index (Wqi) of Chandlodia Lake, Ahmedabad, Gujarat, India. J. Environ. Anal. Toxicol. 2015, 5, 1000288. [Google Scholar] [CrossRef]
- Cymes, I.; Glińska-Lewczuk, K. The use of Water Quality Indices (WQI and SAR) for multipurpose assessment of water in dam reservoirs. J. Elem. 2016, 21, 1211–1224. [Google Scholar] [CrossRef]
- Kadeem, Z.J.; Al-Obaidy, A.H.M.J.; Hassan, F.M. Monitoring of Water Quality of Artificial Lake by Using WQI for Protection of Aquatic Life. Indian J. Ecol. 2022, 49, 308–311. [Google Scholar]
- He, M.; Qian, Q.; Liu, X.; Zhang, J.; Curry, J. Recent Progress on Surface Water Quality Models Utilizing Machine Learning Techniques. Water 2024, 16, 3616. [Google Scholar] [CrossRef]
- Milanović Pešić, A.; Brankov, J.; Milijašević Joksimović, D. Water quality assessment and populations’ perceptions in the National park Djerdap (Serbia): Key factors affecting the environment. Environ. Dev. Sustain. 2020, 22, 2365–2383. [Google Scholar] [CrossRef]
- Stanković, S. Jezera Srbije—Limnološka Monografija; Serbian Geographical Society: Belgrade, Serbia, 2000; p. 223. [Google Scholar]
- Sunjog, K.; Kolarević, S.; Kračun-Kolarević, M.; Višnjić-Jeftić, Ž.; Skorić, S.; Gačić, Z.; Lenhardt, M.; Vasić, N.; Vuković-Gačić, B. Assessment of status of three water bodies in Serbia based on tissue metal and metalloid concentration (ICP-OES) and genotoxicity (comet assay). Environ. Pollut. 2016, 213, 600–607. [Google Scholar] [CrossRef]
- Milošković, A.; Simić, V. Bioaccumulation of potentially toxic elements in fish species of Serbia: A review. Environ. Sci. Pollut. Res. 2023, 30, 32255–32277. [Google Scholar] [CrossRef]
- Marković, G.; Kostić, A.Ž.; Pantelić, N.Đ.; Maletić, R.; Štrbački, J.; Cakić, J.; Kaluđerović, L.; Dojčinović, B.P.; Giuffrè, A.M.; Popović-Djordjević, J.B. Spatial distribution of major and trace elements in artificial lakes in Serbia: Health risk indices and suitability of water for drinking and irrigation purposes. Environ. Monit. Assess. 2023, 195, 1237. [Google Scholar] [CrossRef] [PubMed]
- Petrović, A.M. Бујичне Пoплаве У Србији [Torrential Floods in Serbia]; Special Issues, Book 73; Serbian Geographical Society: Belgrade, Serbia, 2021; p. 155. [Google Scholar]
- Serbian Environmental Protection Agency. Rezultati Ispitivanja Kvaliteta Površinskih I Podzemnih Voda. 2022. Available online: https://sepa.gov.rs/publikacije/ (accessed on 31 December 2024).
- Google. Google Maps Satellite Imagery. Available online: https://www.google.com/maps (accessed on 19 March 2025).
- Fashagba, T.S.; Bessedik, M.; ElSayed, N.B.; Abdelbaki, C.; Kumar, N. Evaluating the Water Quality of the Keddara Dam (Algeria) Using Water Quality Indices. Water 2024, 16, 1291. [Google Scholar] [CrossRef]
- Veljković, N.D. Sustainable development indicators: Case study for South Morava river basin. Hem. Ind. 2013, 67, 357–364. [Google Scholar] [CrossRef]
- Scottish Development Department. Development of a Water Quality Index. In Applied Research & Development Report Number ARD3; Scottish Development Department: Edinburgh, UK, 1976. [Google Scholar]
- Veljković, N.D.; Jovičić, M.M. Decoupling environmental impacts from industrial growth: Case study for South Morava river basin. Hem. Ind. 2015, 69, 493–502. [Google Scholar] [CrossRef]
- Leščešen, I.; Dolinaj, D.; Pantelić, M.; Savić, S.; Milošević, D. Statistical Analysis of Water quality parameters in seven major Serbian rivers during 2004–2013 period. Water Resour. 2018, 45, 418–426. [Google Scholar] [CrossRef]
- Takić, L.M.; Mladenović-Ranisavljević, I.I.; Nikolić, V.D.; Nikolić, L.B.; Vuković, M.V.; Živković, N.V. Assessment of Danube Water Quality in Serbia. Adv. Technol. 2013, 1, 58–66. [Google Scholar]
- Mladenović-Ranisavljević, I.I.; Žerajić, S.A. Comparison of different models of water quality index in the assessment of surface water quality. Int. J. Environ. Sci. Technol. 2018, 15, 665–674. [Google Scholar] [CrossRef]
- Milijašević Joksimović, D.; Gavrilović, B.; Obradović Lović, S. Application of the water quality index in the Timok River basin (Serbia). J. Geogr. Inst. Jovan Cvijić SASA 2018, 68, 333–344. [Google Scholar] [CrossRef]
- Leščešen, I.; Pantelić, M.; Dolinaj, D.; Lukić, T. Assessment of water quality of the Tisa river (Vojvodina, North Serbia) for ten year period using Serbian Water Quality Index (SWQI). Geogr. Pannon. 2014, 18, 102–107. [Google Scholar] [CrossRef]
- Elezović, N.; Ilić Komatina, D.; Dervišević, I.; Ketin, S.; Dasić, P. Analysis of SWQI index of the river Ibar (Serbia). Fressenius Environ. Bull. 2018, 27, 2505–2509. [Google Scholar]
- Jelača, N.; Živković, M.; Novaković, B. Water quality of the Gradac River Using Serbian Water Quality Index (SWQI). In Proceedings of the 51st Annual Conference of the Serbian Water Pollution Control Society Water 2022, Vrnjačka Banja, Serbia, 26–28 October 2022. [Google Scholar]
- Stričević, L.S.; Pavlović, M.; Filipović, I.M.; Radivojević, A.; Martić-Bursać, N.; Gocić, M. Statistical analysis of water quality parameters in the basin of the Nisava River (Serbia) in the period 2009–2018. Geografie 2021, 126, 55–73. [Google Scholar] [CrossRef]
- Pantelić, M.; Dolinaj, D.; Savić, S.; Leščešen, I.; Stojanović, V. Water quality and population standpoints as factors influencing the utilization for agricultural purposes of the Great Bačka Canal, Serbia. J. Environ. Sci. Manag. 2016, 19, 8–14. [Google Scholar] [CrossRef]
- Doderović, M.; Mijanović, I.; Burić, D.; Milenković, M.L. Assessment of the water quality in the Morača river basin (Montenegro) using Water Quality Index. Bull. Serbian Geogr. Soc. 2020, 100, 67–81. [Google Scholar] [CrossRef]
- Burić, D.; Mijanović, I.; Doderović, M.; Mihajlović, J.; Trbić, G. Assessment of the environmental quality of Lake Skadar and its urban surroundings in Montenegro. Eur. J. Geogr. 2023, 14, 76–87. [Google Scholar] [CrossRef]
- Canadian Council of Ministers of the Environment (CCME). Canadian Water Quality Index 1.0 Calculator. Available online: https://www.gov.nl.ca/mpa/cwqi/ (accessed on 30 November 2024).
- Lumb, A.; Halliwell, D.; Sharma, T. Application of CCME Water Quality Index to Monitor Water Quality: A Case Study of the Mackenzie River Basin, Canada. Environ. Monit. Assess. 2006, 113, 411–429. [Google Scholar] [CrossRef]
- Radaideh, J.A. Evaluation of Zarqa River Water quality on suitability for irrigation using the Canadian Council of Ministers of Environment Water Quality Index (CCME WQI) approach. Int. J. Innov. Creat. Change 2022, 16, 354–373. [Google Scholar]
- Al-Assaf, A.Y.R.; Alsaffawi, A.Y.; Katib, M.A. Application of the Canadian Index (CCME WQI) to Assess Water Quality for Aquatic Life: A Case Study of Water Quality for the Khoser and Tigris Rivers in the North of Nineveh Governorate. Egypt. J. Aquat. Biol. Fish. 2024, 28, 1085–1097. [Google Scholar] [CrossRef]
- Haldar, D.; Halder, S.; Das, P.; Halder, G. Assessment of water quality of Damodar River in South Bengal region of India by Canadian Council of Ministers of Environment (CCME) Water Quality Index: A case study. Desalin. Water Treat. 2016, 57, 3489–3502. [Google Scholar] [CrossRef]
- Maansi Jindal, R.; Wats, M. Evaluation of surface water quality using water quality indices (WQIs) in Lake Sukhna, Chandigarh, India. Appl. Water Sci. 2022, 12, 2. [Google Scholar] [CrossRef]
- Mahagamage, M.G.Y.L.; Manage, P.M. Water quality index (CCME-WQI) based assessment study of water quality in Kelani river basin, Sri Lanka. In Proceedings of the (ENRIC2014) the 1st Environment and Natural Resources International Conference, Bangkok, Thailand, 6–7 November 2014. [Google Scholar]
- Fayad, H.A.; Baydoun, S.; Soliman, M.R. Preliminary water quality assessment using Canadian Water Quality Index of Ras El-Ain Ponds, South Lebanon. BAU J.-Sci. Technol. 2023, 5, 5. [Google Scholar] [CrossRef]
- Menberu, Z.; Mogesse, B.; Reddythota, D. Evaluation of water quality and eutrophication status of Hawassa Lake based on different water quality indices. Appl. Water Sci. 2021, 11, 61. [Google Scholar] [CrossRef]
- Jakovljević, D. Assessment of water quality during the floods in May, 2014, Serbia. J. Geogr. Inst. Jovan Cvijić SASA 2020, 70, 215–226. [Google Scholar] [CrossRef]
- Jakovljević, D.; Lozanov-Crvenković, Z. Water quality changes after Kraljevo earthquake in 2010. Nat. Hazards 2015, 79, 2033–2053. [Google Scholar] [CrossRef]
- Leoni, B.; Patelli, M.; Soler, V.; Nava, V. Ammonium Transformation in 14 Lakes along a Trophic Gradient. Water 2018, 10, 265. [Google Scholar] [CrossRef]
- Chislock, M.F.; Doster, E.; Zitomer, R.A.; Wilson, A.E. Eutrophication: Causes, Consequences, and Controls in Aquatic Ecosystems. Nat. Educ. Knowl. 2013, 4, 10. [Google Scholar]
- Madjar, R.M.; Vasile Scăețeanu, G.; Sandu, M.A. Nutrient Water Pollution from Unsustainable Patterns of Agricultural Systems, Effects and Measures of Integrated Farming. Water 2024, 16, 3146. [Google Scholar] [CrossRef]
- Karadžić, V.; Subakov-Simić, G.; Krizmanić, J.; Natić, D. Phytoplankton and eutrophication development in the water supply reservoirs Garaši and Bukulja (Serbia). Desalination 2010, 255, 91–96. [Google Scholar] [CrossRef]
- Čađo, S.; Novaković, B.; Đurković, A.; Denić, L.; Glišić, T.D.; Stojanović, Z.; Veljković, N.; Domanović, M.; Žarić, D. Ecological potential of accumulations for water supply in Serbia. Voda I Sanit. Tehnika 2020, 50, 19–40. [Google Scholar]
- Akhmetova, D. Anthropogenic impact on soil and vegetation in Turkistan Region: Chemical composition and heavy metal contamination. J. Geogr. Inst. Jovan Cvijić SASA 2025, 75, 1–15. [Google Scholar] [CrossRef]
- Nikolić, D.; Skorić, S.B.; Đikanović, V.; Mićković, B.B.; Hegediš, A.; Lenhardt, M.; Krpo-Ćetković, J. Toxic elements in water and sediment from six reservoirs in Serbia. Water Res. Manag. 2020, 10, 13–18. [Google Scholar]


| T (°C) | pH | EC (µS/cm) | OS (%) | BOD (mg/L) | NH4+ (mg/L) | TN (mg/L) | SS (mg/L) | PO43− (mg/L) | TC Coli/100 mg | |||
|---|---|---|---|---|---|---|---|---|---|---|---|---|
| 93–109 | 18 | |||||||||||
| 88–92 | 110–119 | 17 | ||||||||||
| 85–87 | 120–129 | 16 | ||||||||||
| 81–84 | 130–134 | 0–0.9 | 15 | |||||||||
| 78–80 | 135–139 | 1–1.9 | 14 | |||||||||
| 75–77 | 140–144 | 2–2.4 | 13 | |||||||||
| 72–74 | 145–154 | 2.5–2.9 | 0–0.09 | 0–249 | 12 | |||||||
| 69–71 | 155–164 | 3–3.4 | 0.1–0.14 | 250–999 | 11 | |||||||
| 66–68 | 165–179 | 3.5–3.9 | 0.15–0.19 | 1000–3999 | 10 | |||||||
| 6.5–7.9 | 63–65 | 180+ | 4–4.4 | 0.2–0.24 | 4000–7.999 | 9 | ||||||
| 6–6.4 | 8–8.4 | 59–62 | 4.5–4.9 | 0.25–0.29 | 0–0.49 | 0–0.029 | 8000–14,999 | 8 | ||||
| 5.8–5.9 | 8.5–8.7 | 55–58 | 5–5.4 | 0.3–0.39 | 0.5–1.49 | 0–9 | 0.03–0.059 | 15,000–24,999 | 7 | |||
| 5.6–5.7 | 8.8–8.9 | 0–188 | 50–54 | 5.5–6.1 | 0.4–0.49 | 1.5–2.49 | 10–14 | 0.06–0.099 | 25,000–44,999 | 6 | ||
| 0–17.4 | 5.4–5.5 | 9–9.1 | 189–239 | 45–49 | 6.2–6.9 | 0.5–0.59 | 2.5–3.49 | 15–19 | 0.1–0.129 | 45,000–79,999 | 5 | |
| 17.5–19.4 | 5.2–5.3 | 9.2–9.4 | 240–289 | 40–44 | 7–7.9 | 0.6–0.99 | 3.5–4.49 | 20–29 | 0.13–0.179 | 80,000–139,999 | 4 | |
| 19.5–21.4 | 5–5.1 | 9.5–9.9 | 290–379 | 35–39 | 8–8.9 | 1–1.99 | 4.5–5.49 | 30–44 | 0.18–0.219 | 140,000–249,999 | 3 | |
| 21.5–22.9 | 4.5–4.9 | 10–10.4 | 380–539 | 25–34 | 9–9.9 | 2–3.99 | 5.5–6.99 | 45–64 | 0.22–0.279 | 250,000–429,999 | 2 | |
| 23–24.9 | 3.5–4.4 | 10.5–11.4 | 540–839 | 10–24 | 10–14.9 | 4–9.99 | 7–9.99 | 65–119 | 0.28–0.369 | 430,000–749,999 | 1 | |
| 25+ | 0–3.4 | 11.5–14 | 840+ | 0–9 | 15+ | 10+ | 10+ | 120+ | 0.37 | 750,000+ | 0 | |
| Overall | Drinking | Aquatic | Recreation | Irrigation | Livestock | ||||||
|---|---|---|---|---|---|---|---|---|---|---|---|
| Variables | Units | Lower | Upper | Lower | Upper | Lower | Upper | Lower | Upper | Upper | Upper |
| Turbidity | NTU | 1 | 1 | ||||||||
| DO | mg/L | 9.5 | 9.5 | ||||||||
| pH | 6.5 | 8.5 | 6.5 | 8.5 | 6.5 | 9 | 5 | 9 | |||
| Ca | mg/L | 1000 | 1000 | ||||||||
| SO42− | mg/L | 500 | 500 | 1000 | |||||||
| Cl− | mg/L | 110 | 250 | 110 | |||||||
| NO3−NO2− | mg/L | 100 | 100 | ||||||||
| Al | mg/L | 0.005 | 0.005 | 5 | 5 | ||||||
| As | mg/L | 0.005 | 0.025 | 0.005 | 0.1 | 0.025 | |||||
| Cd | mg/L | 0.005 | 0.005 | 0.0051 | 0.08 | ||||||
| Cr | mg/L | 0.001 | 0.05 | 0.001 | 0.0049 | 0.05 | |||||
| Cu | mg/L | 0.002 | 1 | 0.002 | 0.2 | 0.5 | |||||
| Fe | mg/L | 0.3 | 0.3 | 0.3 | 5 | ||||||
| Hg | µ/L | 0.003 | 1 | 0.1 | 0.003 | ||||||
| Mn | mg/L | 0.05 | 0.05 | 0.2 | |||||||
| Ni | mg/L | 0.025 | 0.025 | 0.2 | 1 | ||||||
| Pb | mg/L | 0.001 | 0.01 | 0.001 | 0.02 | 0.05 | |||||
| Zn | mg/L | 0.03 | 5 | 0.03 | 1 | 50 | |||||
| Profile | Depth (cm) | 2021 May | 2022 July | 2023 March | Average | Standard Deviation |
|---|---|---|---|---|---|---|
| A1 | 50 | 23.2 | 24.8 | 8.8 | 18.93 | 7.195 |
| A1 | 200 | 20.8 | 24.6 | 8.8 | 18.07 | 6.73 |
| A1 | 350 | 16.6 | 24 | 7.9 | 16.17 | 6.58 |
| A1 | 500 | 10.6 | 20.9 | 7.4 | 12.97 | 5.76 |
| A1 | 600 | 6.2 | 16 | 7 | 9.73 | 4.44 |
| A1 | 800 | 6.8 | 10 | 6.2 | 7.67 | 1.67 |
| A1 | 1000 | 6.5 | 7.8 | 6 | 6.77 | 0.76 |
| A1 | 1200 | 6.3 | 6.5 | 5.7 | 6.17 | 0.34 |
| A1 | 1500 | 5.3 | 6 | 5.6 | 5.63 | 0.29 |
| B1 | 50 | 21.5 | 25.3 | 9.9 | 18.9 | 6.55 |
| B1 | 200 | 21.5 | 25 | 9 | 18.5 | 6.87 |
| B1 | 500 | 12 | 19.4 | 7.7 | 13.03 | 4.83 |
| C1 | 50 | 23.4 | 25.5 | 8.9 | 19.27 | 7.38 |
| C1 | 200 | 21.3 | 25 | 8.8 | 18.37 | 6.93 |
| C1 | 500 | 10.5 | 21.3 | 8.1 | 13.3 | 5.74 |
| C1 | 600 | 10.5 | 16.4 | 6.7 | 11.2 | 3.99 |
| Profile | Depth (cm) | 2021 May | 2022 July | 2023 March | Average | Standard Deviation |
|---|---|---|---|---|---|---|
| A1 | 50 | 9.1 | 8.48 | 8.38 | 8.65 | 0.32 |
| A1 | 200 | 9.23 | 8.65 | 8.42 | 8.77 | 0.34 |
| A1 | 350 | 9.27 | 8.67 | 8.3 | 8.75 | 0.4 |
| A1 | 500 | 7.95 | 9 | 7.92 | 8.29 | 0.5 |
| A1 | 600 | 7.71 | 9.5 | 7.89 | 8.37 | 0.8 |
| A1 | 800 | 7.43 | 7.39 | 7.8 | 7.54 | 0.18 |
| A1 | 1000 | 7.37 | 7.17 | 7.64 | 7.39 | 0.19 |
| A1 | 1200 | 7.36 | 7.26 | 7.64 | 7.42 | 0.16 |
| A1 | 1500 | 7.35 | 7.06 | 7.62 | 7.34 | 0.23 |
| B1 | 50 | 8.79 | 8.38 | 8.52 | 8.56 | 0.17 |
| B1 | 200 | 8.82 | 8.38 | 8.46 | 8.55 | 0.19 |
| B1 | 500 | 7.7 | 8.5 | 8.2 | 8.13 | 0.33 |
| C1 | 50 | 9.03 | 8.61 | 8.45 | 8.7 | 0.24 |
| C1 | 200 | 9.12 | 8.64 | 8.16 | 8.64 | 0.4 |
| C1 | 500 | 7.62 | 5.8 | 8.05 | 7.16 | 0.975 |
| C1 | 600 | 7.39 | 8.69 | 7.95 | 8.01 | 0.53 |
| Profile | Depth (cm) | 2021 May | 2022 July | 2023 March | Average | Standard Deviation |
|---|---|---|---|---|---|---|
| A1 | 50 | 204 | 223 | 235 | 220.67 | 12.76 |
| A1 | 200 | 201 | 227 | 235 | 221 | 14.51 |
| A1 | 350 | 200 | 227 | 236 | 221 | 15.3 |
| A1 | 500 | 213 | 218 | 239 | 223.33 | 11.26 |
| A1 | 600 | 215 | 197 | 238 | 216.67 | 16.78 |
| A1 | 800 | 215 | 200 | 237 | 217.33 | 15.195 |
| A1 | 1000 | 214 | 199 | 237 | 216.67 | 15.63 |
| A1 | 1200 | 216 | 197 | 240 | 217.67 | 17.59 |
| A1 | 1500 | 220 | 211 | 242 | 224.33 | 13.02 |
| B1 | 50 | 213 | 237 | 229 | 226.33 | 9.98 |
| B1 | 200 | 213 | 237 | 229 | 226.33 | 9.98 |
| B1 | 500 | 214 | 240 | 236 | 230 | 11.43 |
| C1 | 50 | 202 | 241 | 233 | 225.33 | 16.82 |
| C1 | 200 | 201 | 240 | 238 | 226.33 | 17.93 |
| C1 | 500 | 217 | 231 | 237 | 228.33 | 8.38 |
| C1 | 600 | 219 | 221 | 236 | 225.33 | 7.59 |
| Profile | Depth (cm) | 2021 May | 2022 July | 2023 March | Average | Standard Deviation |
|---|---|---|---|---|---|---|
| A1 | 50 | 120 | 110 | 103 | 111 | 8.54 |
| A1 | 200 | 133 | 114 | 101 | 116 | 16.09 |
| A1 | 350 | 134 | 106 | 101 | 113.67 | 17.79 |
| A1 | 500 | 79 | 158 | 94 | 110.33 | 41.96 |
| A1 | 600 | 59 | 210 | 95 | 121.33 | 78.87 |
| A1 | 800 | 41 | 41 | 88 | 56.67 | 27.135 |
| A1 | 1000 | 32 | 6 | 80 | 39.33 | 37.54 |
| A1 | 1200 | 24 | 2 | 79 | 35 | 39.66 |
| A1 | 1500 | 13 | 2 | 75 | 30 | 39.36 |
| B1 | 50 | 114 | 115 | 109 | 112.67 | 3.21 |
| B1 | 200 | 114 | 114 | 105 | 111 | 5.2 |
| B1 | 500 | 77 | 103 | 98 | 92.67 | 13.8 |
| C1 | 50 | 123 | 103 | 105 | 110.33 | 11.015 |
| C1 | 200 | 128 | 107 | 103 | 112.67 | 13.43 |
| C1 | 500 | 65 | 99 | 101 | 88.33 | 20.23 |
| C1 | 600 | 39 | 168 | 98 | 101.67 | 64.58 |
| Profile | Depth (cm) | 2021 May | 2022 July | 2023 March | Average | Standard deviation |
|---|---|---|---|---|---|---|
| A1 | 50 | 0.02 | 0.13 | 0.04 | 0.06 | 0.06 |
| A1 | 200 | 0.02 | 0.13 | 0.06 | 0.07 | 0.06 |
| A1 | 350 | 0.08 | 0.12 | 0.07 | 0.09 | 0.03 |
| A1 | 500 | 0.1 | 0.2 | 0.05 | 0.12 | 0.08 |
| A1 | 600 | 0.12 | 0.35 | 0.04 | 0.17 | 0.16 |
| A1 | 800 | 0.15 | 0.7 | 0.1 | 0.32 | 0.33 |
| A1 | 1000 | 0.2 | 1 | 0.16 | 0.45 | 0.47 |
| A1 | 1200 | 0.34 | 0.95 | 0.14 | 0.48 | 0.42 |
| A1 | 1500 | 0.53 | 1.15 | 0.18 | 0.62 | 0.49 |
| B1 | 50 | 0.02 | 0.05 | 0.08 | 0.05 | 0.03 |
| B1 | 200 | 0.08 | 0.03 | 0.09 | 0.07 | 0.03 |
| B1 | 500 | 0.1 | 0.03 | 0.07 | 0.07 | 0.035 |
| C1 | 50 | 0.2 | 0.2 | 0.08 | 0.16 | 0.07 |
| C1 | 200 | 0.23 | 0.28 | 0.06 | 0.19 | 0.115 |
| C1 | 500 | 0.22 | 0.35 | 0.08 | 0.22 | 0.135 |
| C1 | 600 | 0.42 | 0.2 | 0.1 | 0.24 | 0.16 |
| Profile | Depth (cm) | 2021 May | 2022 July | 2023 March | Average | Standard Deviation |
|---|---|---|---|---|---|---|
| A1 | 50 | 0.038 | 0.029 | 0.01 | 0.026 | 0.014 |
| A1 | 200 | 0.045 | 0.03 | 0.011 | 0.029 | 0.017 |
| A1 | 350 | 0.05 | 0.016 | 0.01 | 0.025 | 0.022 |
| A1 | 500 | 0.038 | 0.035 | 0.01 | 0.028 | 0.015 |
| A1 | 600 | 0.042 | 0.019 | 0.01 | 0.024 | 0.0165 |
| A1 | 800 | 0.045 | 0.051 | 0.01 | 0.035 | 0.022 |
| A1 | 1000 | 0.048 | 0.054 | 0.01 | 0.037 | 0.024 |
| A1 | 1200 | 0.051 | 0.034 | 0.012 | 0.032 | 0.02 |
| A1 | 1500 | 0.051 | 0.02 | 0.016 | 0.029 | 0.019 |
| B1 | 50 | 0.045 | 0.054 | 0.016 | 0.038 | 0.02 |
| B1 | 200 | 0.045 | 0.036 | 0.022 | 0.034 | 0.012 |
| B1 | 500 | 0.029 | 0.042 | 0.01 | 0.027 | 0.016 |
| C1 | 50 | 0.038 | 0.054 | 0.01 | 0.034 | 0.022 |
| C1 | 200 | 0.04 | 0.035 | 0.013 | 0.029 | 0.014 |
| C1 | 500 | 0.048 | 0.032 | 0.013 | 0.031 | 0.0175 |
| C1 | 600 | 0.064 | 0.038 | 0.016 | 0.039 | 0.024 |
| Profile | Depth (cm) | 2021 May | 2022 July | 2023 March | Average | Standard Deviation |
|---|---|---|---|---|---|---|
| A1 | 50 | 0.49 | 0.44 | 0.9 | 0.61 | 0.25 |
| A1 | 200 | 0.47 | 0.45 | 1 | 0.64 | 0.32 |
| A1 | 350 | 0.49 | 0.45 | 0.9 | 0.61 | 0.25 |
| A1 | 500 | 0.97 | 0.6 | 1 | 0.86 | 0.22 |
| A1 | 600 | 1.01 | 0.8 | 1 | 0.94 | 0.12 |
| A1 | 800 | 0.95 | 2.2 | 1.1 | 1.42 | 0.68 |
| A1 | 1000 | 0.95 | 2.4 | 1.1 | 1.48 | 0.8 |
| A1 | 1200 | 1.04 | 2.1 | 1 | 1.38 | 0.62 |
| A1 | 1500 | 1.17 | 2.1 | 1 | 1.42 | 0.59 |
| B1 | 50 | 0.45 | 0.6 | 1.4 | 0.81 | 0.51 |
| B1 | 200 | 0.44 | 0.5 | 1.6 | 0.85 | 0.65 |
| B1 | 500 | 0.97 | 0.4 | 1.4 | 0.92 | 0.5 |
| C1 | 50 | 0.42 | 0.6 | 1 | 0.67 | 0.3 |
| C1 | 200 | 0.42 | 0.7 | 1 | 0.71 | 0.29 |
| C1 | 500 | 0.94 | 0.7 | 0.9 | 0.85 | 0.13 |
| C1 | 600 | 1.19 | 0.5 | 1 | 0.9 | 0.36 |
| Profile | Depth (cm) | SWQI 2021 | SWQI 2022 | SWQI 2023 |
|---|---|---|---|---|
| A1 | 50 | 85 | 87 | 94 |
| A1 | 200 | 82 | 86 | 94 |
| A1 | 350 | 85 | 88 | 93 |
| A1 | 500 | 88 | 71 | 95 |
| A1 | 600 | 79 | 67 | 97 |
| A1 | 800 | 71 | 61 | 94 |
| A1 | 1000 | 67 | 53 | 88 |
| A1 | 1200 | 62 | 56 | 88 |
| A1 | 1500 | 59 | 55 | 85 |
| B1 | 50 | 89 | 86 | 93 |
| B1 | 200 | 86 | 85 | 92 |
| B1 | 500 | 88 | 91 | 94 |
| C1 | 50 | 82 | 83 | 92 |
| C1 | 200 | 79 | 77 | 95 |
| C1 | 500 | 77 | 83 | 95 |
| C1 | 600 | 62 | 76 | 94 |
| Profile | Depth (cm) | CWQI 2021 | CWQI 2022 | CWQI 2023 |
|---|---|---|---|---|
| A1 | 50 | 50 | 57 | 60 |
| A1 | 200 | 84 | 67 | 100 |
| A1 | 350 | 84 | 67 | 59 |
| A1 | 500 | 55 | 84 | 100 |
| A1 | 600 | 83 | 67 | 100 |
| A1 | 800 | 81 | 81 | 100 |
| A1 | 1000 | 79 | 57 | 100 |
| A1 | 1200 | 76 | 52 | 100 |
| A1 | 1500 | 67 | 52 | 84 |
| B1 | 50 | 49 | 57 | 58 |
| B1 | 200 | 84 | 84 | 100 |
| B1 | 500 | 84 | 84 | 60 |
| C1 | 50 | 47 | 50 | 56 |
| C1 | 200 | 84 | 67 | 100 |
| C1 | 500 | 83 | 67 | 100 |
| C1 | 600 | 81 | 66 | 100 |
| Profile | Depth (cm) | 2021 May | 2022 July | 2023 March | Average | Standard Deviation |
|---|---|---|---|---|---|---|
| A1 | 50 | 10.18 | 9.02 | 12.02 | 10.41 | 1.235 |
| A1 | 200 | 11.79 | 9.37 | 11.78 | 10.98 | 1.14 |
| A1 | 350 | 12.94 | 8.83 | 11.6 | 11.12 | 1.71 |
| A1 | 500 | 8.8 | 13.98 | 11.5 | 11.34 | 2.11 |
| A1 | 600 | 7.27 | 20.6 | 11.5 | 13.12 | 5.56 |
| A1 | 800 | 5 | 4.6 | 10.93 | 6.84 | 2.89 |
| A1 | 1000 | 3.95 | 0.81 | 9.95 | 4.9 | 3.79 |
| A1 | 1200 | 3 | 0.5 | 9.9 | 4.47 | 3.975 |
| A1 | 1500 | 1.59 | 0.5 | 9.34 | 3.81 | 3.935 |
| B1 | 50 | 9.96 | 9.32 | 11.69 | 10.32 | 0.99 |
| B1 | 200 | 9.98 | 9.3 | 11.33 | 10.2 | 0.84 |
| B1 | 500 | 8.24 | 9.36 | 11.11 | 9.57 | 1.18 |
| C1 | 50 | 10.36 | 8.36 | 11.48 | 10.07 | 1.29 |
| C1 | 200 | 11.22 | 8.76 | 11.83 | 10.6 | 1.33 |
| C1 | 500 | 7.26 | 8.72 | 11.63 | 9.2 | 1.82 |
| C1 | 600 | 4.54 | 16.44 | 11.37 | 10.78 | 4.88 |
| Profile | Depth (cm) | 2021 May | 2022 July | 2023 March | Average | Standard Deviation |
|---|---|---|---|---|---|---|
| A1 | 50 | 0.19 | 0.22 | 0.33 | 0.25 | 0.06 |
| A1 | 200 | 0.23 | 0.23 | 0.33 | 0.26 | 0.05 |
| A1 | 350 | 0.33 | 0.24 | 0.47 | 0.35 | 0.09 |
| A1 | 500 | 0.24 | 0.24 | 0.39 | 0.29 | 0.07 |
| A1 | 600 | 0.21 | 1.13 | 0.33 | 0.56 | 0.41 |
| A1 | 800 | 0.15 | 0.49 | 0.29 | 0.31 | 0.14 |
| A1 | 1000 | 0.13 | 0.41 | 0.23 | 0.26 | 0.12 |
| A1 | 1200 | 0.2 | 0.45 | 0.23 | 0.29 | 0.11 |
| A1 | 1500 | 0.2 | 0.39 | 0.2 | 0.26 | 0.09 |
| B1 | 50 | 0.25 | 0.21 | 0.27 | 0.24 | 0.03 |
| B1 | 200 | 0.26 | 0.22 | 0.41 | 0.3 | 0.08 |
| B1 | 500 | 0.41 | 0.31 | 0.32 | 0.35 | 0.045 |
| C1 | 50 | 0.23 | 0.2 | 0.41 | 0.28 | 0.09 |
| C1 | 200 | 0.3 | 0.24 | 0.39 | 0.31 | 0.06 |
| C1 | 500 | 0.29 | 0.31 | 0.42 | 0.34 | 0.06 |
| C1 | 600 | 0.24 | 1.89 | 0.4 | 0.84 | 0.74 |
| Profile | Depth (cm) | 2021 May | 2022 July | 2023 March | Average | Standard Deviation |
|---|---|---|---|---|---|---|
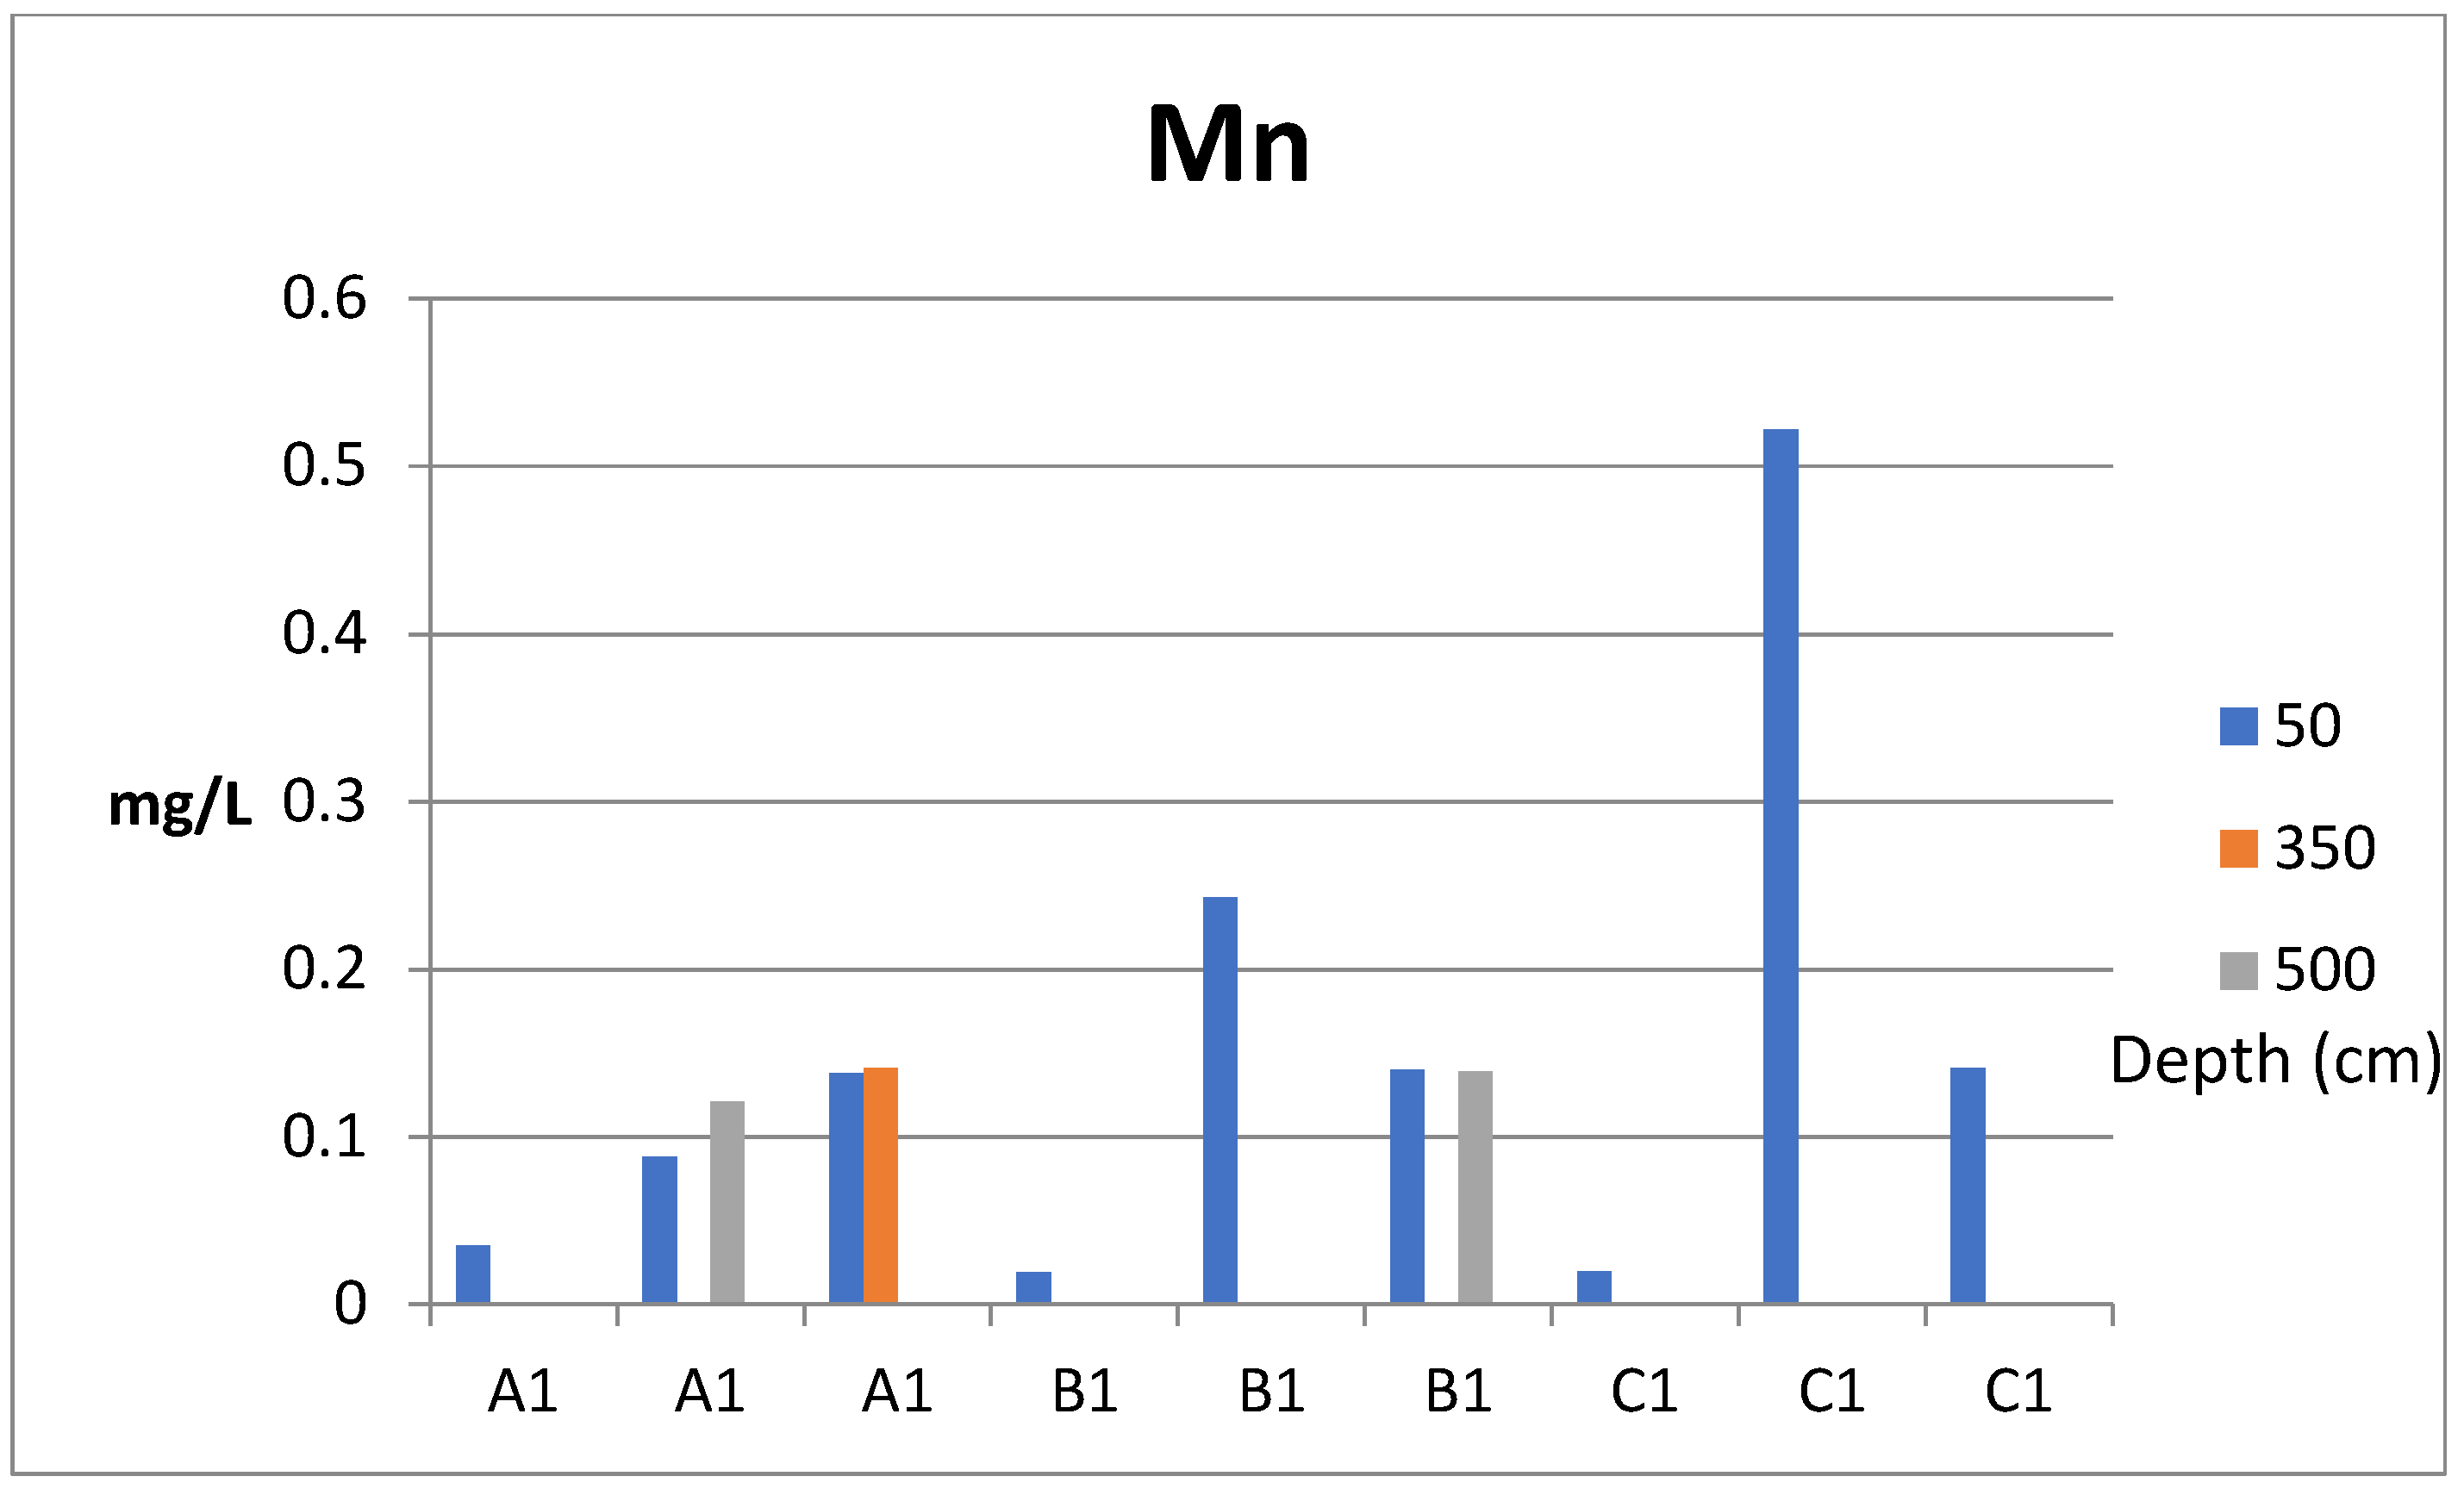
| A1 | 50 | 0.088 | 0.035 | 0.138 | 0.087 | 0.042 |
| A1 | 350 | 0.141 | 0.141 | 0 | ||
| A1 | 500 | 0.121 | 0.121 | 0 | ||
| B1 | 50 | 0.243 | 0.019 | 0.14 | 0.034 | 0.0915 |
| B1 | 500 | 0.139 | 0 | |||
| C1 | 50 | 0.522 | 0.02 | 0.141 | 0.228 | 0.214 |
| Profile | Depth (cm) | 2021 May | 2022 July | 2023 March | Average | Standard Deviation |
|---|---|---|---|---|---|---|
| A1 | 50 | 0.223 | 0.082 | 0.017 | 0.107 | 0.086 |
| A1 | 350 | 0.029 | 0.029 | 0 | ||
| A1 | 500 | 0.27 | 0.27 | 0 | ||
| B1 | 50 | 0.169 | 0.072 | 0.02 | 0.087 | 0.062 |
| B1 | 500 | 0.028 | 0.028 | 0 | ||
| C1 | 50 | 0.218 | 0.182 | 0.061 | 0.154 | 0.067 |
| Profile | Depth (cm) | 2021 May | 2022 July | 2023 March | Average | Standard Deviation |
|---|---|---|---|---|---|---|
| A1 | 50 | 0.0029 | 0.0027 | 0.0071 | 0.0042 | 0.002 |
| A1 | 350 | 0.067 | 0.067 | 0 | ||
| A1 | 500 | 0.02 | 0.02 | 0 | ||
| B1 | 50 | 0.0022 | 0.0044 | 0.0036 | 0.0034 | 0.0009 |
| B1 | 500 | 0.0037 | 0.0037 | 0 | ||
| C1 | 50 | 0.0032 | 0.0026 | 0.0113 | 0.0057 | 0.004 |
Disclaimer/Publisher’s Note: The statements, opinions and data contained in all publications are solely those of the individual author(s) and contributor(s) and not of MDPI and/or the editor(s). MDPI and/or the editor(s) disclaim responsibility for any injury to people or property resulting from any ideas, methods, instructions or products referred to in the content. |
© 2025 by the authors. Licensee MDPI, Basel, Switzerland. This article is an open access article distributed under the terms and conditions of the Creative Commons Attribution (CC BY) license (https://creativecommons.org/licenses/by/4.0/).
Share and Cite
Jakovljević, D.; Milijašević Joksimović, D.; Petrović, A.M. Assessment of Lake Water Quality in Central Serbia—Using Serbian and Canadian Water Quality Indices on the Example of the Garaši Reservoir. Sustainability 2025, 17, 4074. https://doi.org/10.3390/su17094074
Jakovljević D, Milijašević Joksimović D, Petrović AM. Assessment of Lake Water Quality in Central Serbia—Using Serbian and Canadian Water Quality Indices on the Example of the Garaši Reservoir. Sustainability. 2025; 17(9):4074. https://doi.org/10.3390/su17094074
Chicago/Turabian StyleJakovljević, Dejana, Dragana Milijašević Joksimović, and Ana M. Petrović. 2025. "Assessment of Lake Water Quality in Central Serbia—Using Serbian and Canadian Water Quality Indices on the Example of the Garaši Reservoir" Sustainability 17, no. 9: 4074. https://doi.org/10.3390/su17094074
APA StyleJakovljević, D., Milijašević Joksimović, D., & Petrović, A. M. (2025). Assessment of Lake Water Quality in Central Serbia—Using Serbian and Canadian Water Quality Indices on the Example of the Garaši Reservoir. Sustainability, 17(9), 4074. https://doi.org/10.3390/su17094074