Article

Coupled Coordination and Influencing Factors of Tourism Urbanization and Resident Well-Being in the Central Plains Urban Agglomeration, China

1
College of Political Science and Public Administration, Henan Normal University, Xinxiang 453007, China
2
School of Tourism, Henan Normal University, Xinxiang 453007, China
3
School of International Education, Henan Normal University, Xinxiang 453007, China
*
Author to whom correspondence should be addressed.
Sustainability 2025, 17(10), 4351; https://doi.org/10.3390/su17104351
Submission received: 3 April 2025 / Revised: 8 May 2025 / Accepted: 9 May 2025 / Published: 11 May 2025
(This article belongs to the Section Sustainable Urban and Rural Development)

Abstract

:
Tourism urbanization has become an important pathway for promoting regional economic growth, optimizing urban spatial structures and enhancing residents’ quality of life, especially in the context of sustainable development. Balancing the relationship between tourism urbanization and residents’ well-being in China’s Central Plains Urban Agglomeration is a key objective for the promotion of sustainable regional development in the context of rapid tourism development. However, few studies have quantitatively explored the spatiotemporal coupling dynamics between tourism urbanization and residents’ well-being at the urban agglomeration scale, leaving a significant gap in understanding their integrated evolution. Therefore, in this study, we constructed an evaluation index system for tourism urbanization and residents’ well-being. Next, we explored the coupling relationship between tourism urbanization and residents’ well-being and its influencing factors in the Central Plains Urban Agglomeration from 2005 to 2022 via the coupling coordination degree and random forest approaches. The study’s three major findings are as follows: (1) First, in terms of development level, the tourism urbanization of the Central Plains Urban Agglomeration from 2005 to 2019 generally showed a steady upwards trend, and the well-being of residents as a whole showed a steady development trend; however, there were significant regional differences in the level of development. The spatial differentiation between tourism urbanization and residents’ well-being was characterized by “high in the west and low in the east” and “high in the middle and low in the surroundings”, and the degree of spatial differentiation tended to gradually narrow over time. (2) In terms of the level of coupling coordination, the overall coordination between tourism urbanization and residents’ well-being in the Central Plains Urban Agglomeration increased annually and reached the stages of running-in and high coordination. (3) The key factors affecting the coupled coordination of tourism urbanization and residents’ well-being in the Central Plains Urban Agglomeration differed significantly over time. The importance of the number of tourists, policy support, and fiscal balance ratio increased significantly over time, whereas the importance of the vegetation index and the distance to the nearest provincial capital city decreased. These findings have valuable implications for urban planning, governance optimization, and the formulation of sustainable development strategies, highlighting the need to strengthen resilience and promote synergistic growth between tourism development and residents’ well-being.

1. Introduction

An urban agglomeration is a group of cities in a region that realizes common development through collaboration and resource sharing. With the advancement of urbanization, the construction of urban agglomerations has entered China’s national development plan, and urban agglomerations have become a common subject of study [1]. Tourism urbanization refers to the promotion of regional urbanization through infrastructure improvement and the promotion of economic growth through tourism development [2]. In recent years, China’s tourism industry has experienced rapid urbanization [3], especially within urban agglomerations, which are rich in tourism resources [4]. Tourism, as an important driver of urban agglomeration development, has become the main driving force for improving the form of urbanization [5]. The development of tourism urbanization in an urban agglomeration can optimize the allocation of resources in the agglomeration, drive the development of the regional economy, and improve the well-being of local residents [6,7]. The Central Plains Urban Agglomeration is one of seven major urban agglomerations in China, with rich tourism resources and notable regional variations in terms of residents’ well-being. Exploring the coupled and coordinated relationship between tourism urbanization and residents’ well-being in the Central Plains Urban Agglomeration and its influencing factors on a regional scale is highly practical for promoting tourism development, residents’ well-being and sustainable development in the urban agglomeration.
Tourism urbanization was first proposed by the Australian scholar Mullins, who highlighted tourism urbanization as a new model of urban development guided by urban tourism development [2]. Tourism has multiple impacts on urban development, particularly on economic growth and the employment rate [8], it promotes the construction of infrastructure, such as transportation and accommodations [9], and it maintains the urban ecological environment. Thus, tourism urbanization is an inevitable result of urban development. Research on tourism urbanization has focused on its conceptual connotations [10], development characteristics [11], and driving mechanisms [12]. Relevant studies have adopted indicator systems [13], a city cultural tourism competitiveness assessment system [14], and a response coefficient [4,15] to characterize the level of tourism urbanization. Among them, the response coefficient of tourism urbanization is widely used because of its simple structure, clear meaning and regional comparability [16,17]. As study regions, related studies focus mainly on countries [2,10], administrative units [18] or microlevel scenic spots [9], whereas few studies have focused on urban agglomeration tourism urbanization [8].
Residents’ well-being reflects the quality of life and happiness of residents, and its connotation has transitioned from a single economic indicator to a multidimensional indicator covering economic development, social security, the ecological environment, and leisure and recreation [19]. Scholars often measure a population’s well-being according to the Human Development Index [20], the MA well-being framework [21] and the United Nations Sustainable Development Goals [22]. Many scholars have designed systems of well-being indicators on the basis of the object of study, and some have explored the positive contributions of income and income disparities [18], social support and social capital [9,23], and water use and food security [3] to the well-being of the population. Scholars have also measured multidimensional indicators of well-being (standard of living, health, education, safety, culture, etc.) [19,24]. Although the dimensions of residents’ well-being are not conclusively defined, the effectiveness of considering numerous dimensions, such as the economic, health, social, safety, and environmental dimensions, has been recognized by many scholars [25,26]. In addition, residents’ well-being has been explored from the perspectives of measurement methods [20], influencing factors [3,23], and spatial and temporal evolution [27,28]. The research scales adopted include the levels of the country, province, city and watershed [23,26,27], whereas studies on urban agglomerations are uncommon.
The relationship between tourism urbanization and residents’ well-being has gradually received scholarly attention, with studies focusing on how tourism urbanization affects residents’ well-being [29], the relationship between tourism urbanization and common wealth [30,31], and the impact of tourism urbanization on the living environment in underdeveloped areas [4]. Tourism urbanization can have positive and negative effects on residents’ well-being. On the one hand, tourism urbanization is conducive to expanding the scale of the urban population, optimizing the industrial structure, promoting employment, and increasing residents’ income [32]. On the other hand, tourism urbanization satisfies the pursuit of diversified and improved quality of life for local residents through improvements in infrastructure, which in turn enhances their well-being [33]. However, excessive tourism development can lead to increased ecological pressure, exceed the urban spatial carrying capacity, and threaten environmental well-being and sustainable development [34,35]. In summary, the impacts of tourism urbanization on well-being are multidimensional and complex, and the coordinated relationship between the two shows different patterns of development at different times and in different spaces. Many case studies explore the impact of tourism urbanization on residents’ well-being from a qualitative perspective, whereas few studies focus on the quantitative relationship between the two and the influencing factors from a quantitative perspective.
The Central Plains Urban Agglomeration, recognized as the core area of Chinese civilization, is characterized by its invaluable historical sites and abundant cultural heritage. Furthermore, it possesses exceptional tourism resources that increase its significance [36]. However, significant differences exist in the internal economic gradient and resource distribution. The process of tourism urbanization exhibits a notably unbalanced spatial distribution pattern [37,38], leading to various contradictions, such as an imbalance between the protection and development of cultural heritage, discontinuity of regional economic levels, and urban–rural differentiation in residents’ well-being. Existing studies on the relationship between tourism urbanization and residents’ well-being predominantly focus on a single-dimensional analysis of these two aspects. This approach lacks a systematic deconstruction of the spatiotemporal heterogeneity and multifactor interaction mechanisms that characterize their coupling relationships, thereby limiting the precise design of regional collaborative policies. To this end, this study aims to (1) develop a multidimensional indicator system for tourism urbanization and residents’ well-being while quantifying its spatiotemporal differentiation patterns; (2) uncover the spatial correlation characteristics and dynamic evolution laws of the degree of coupling coordination between these two aspects through the application of a coupling coordination model; and (3) utilize the random forest model to identify core driving factors across different stages and key conditions necessary for overcoming nonequilibrium challenges. The core contribution of this paper lies in the following: At the theoretical level, it fills the gap in the research on the relationship between tourism urbanization and residents’ well-being and systematically analyses the dynamic coupling mechanism between tourism urbanization and residents’ well-being from the perspective of quantitative analysis. At the practical level, the cross-stage core driving factors that affect the coupling and coordination of the two have been identified, and a coordinated development path has been proposed, providing an operational practical solution for the Central Plains Urban Agglomeration to overcome the unbalanced situation and align with the strategies of rural revitalization and new urbanization.

2. Study Area and Data Sources
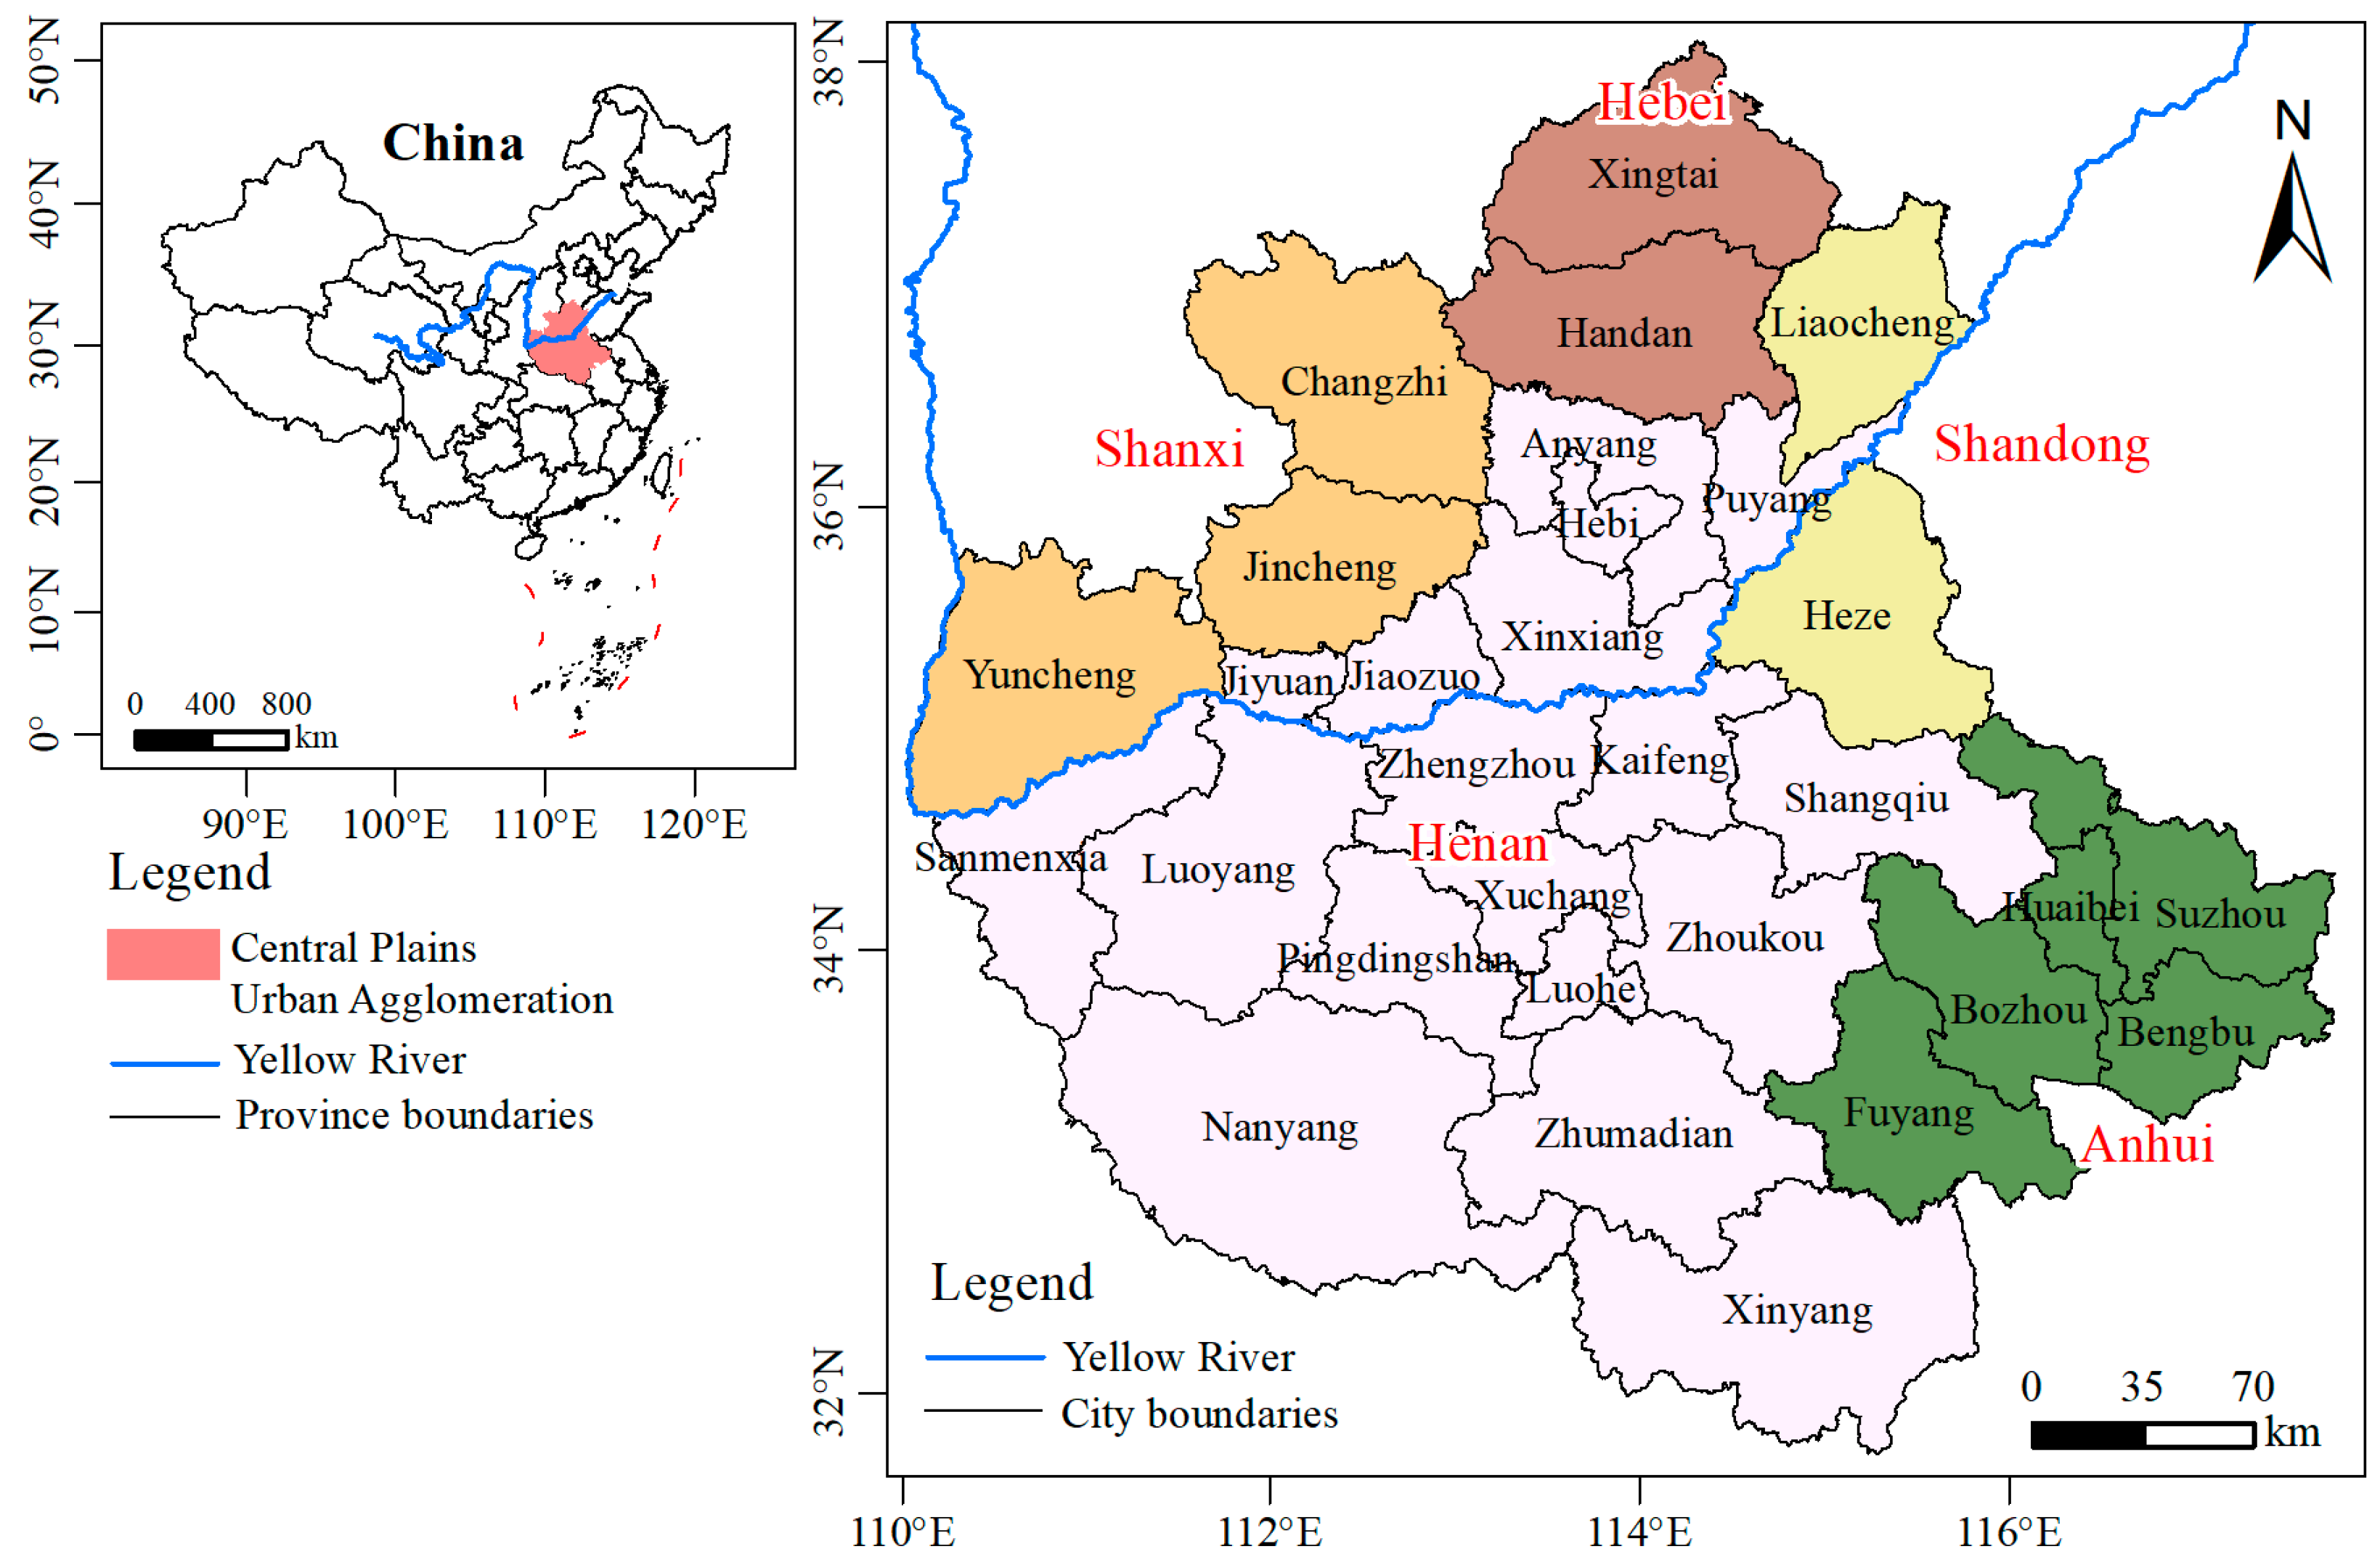
2.1. Study Area

The Central Plains Urban Agglomeration is located in the Central Plains of China in the middle and lower reaches of the Yellow River Basin and covers all of Henan Province and parts of five provinces, including Shanxi Province (Figure 1). The Central Plains Urban Agglomeration consists of 30 cities with a total area of 286,127.7 km2. The terrain is predominantly flat, the climate is a temperate monsoon climate with four distinct seasons, and the transportation network is well developed. Thus, the city clusters enjoy relatively favourable natural conditions. As of 2022, the total resident population of the Central Plains Urban Agglomeration was close to 158 million, with an urbanization rate of 55.18%. The local tourism resources are very rich, with a total of five world cultural heritage sites (e.g., Longmen Grottoes, Anyang Yinxu) and 17 5A scenic spots. In recent years, with the improvement of transportation facilities and media promotion, the Central Plains Urban Agglomeration has vigorously developed its tourism industry, which relies on rich tourism resources. In 2022, the tourism revenue of the Central Plains Urban Agglomeration reached 592.03 billion yuan, while the gross domestic product (GDP) was approximately 9.34 trillion yuan in the same period. Tourism has become one of the key industries of the local economy. Driven by tourism, productivity factors such as population and capital continue to cluster in tourist destinations, promoting regional economic transformation, social change and cultural restructuring, and accelerating the rapid urbanization of tourist destinations. However, as one of China’s seven national city clusters, the Central Plains city cluster, owing to its geographic location and ecological constraints, is still characterized by the uneven development of residents’ living standards and low levels of sustainable development, resulting in a level of well-being that is much lower than that of other city clusters. As an important engine for promoting the development of social and economic systems, the study of the impact of the development of tourism and urbanization on the well-being of residents is highly important for the sustainable development of the Central Plains Urban Agglomeration. Therefore, this study explores the relationship between tourism urbanization and residents’ well-being in the Central Plains city cluster, which is standard and representative.

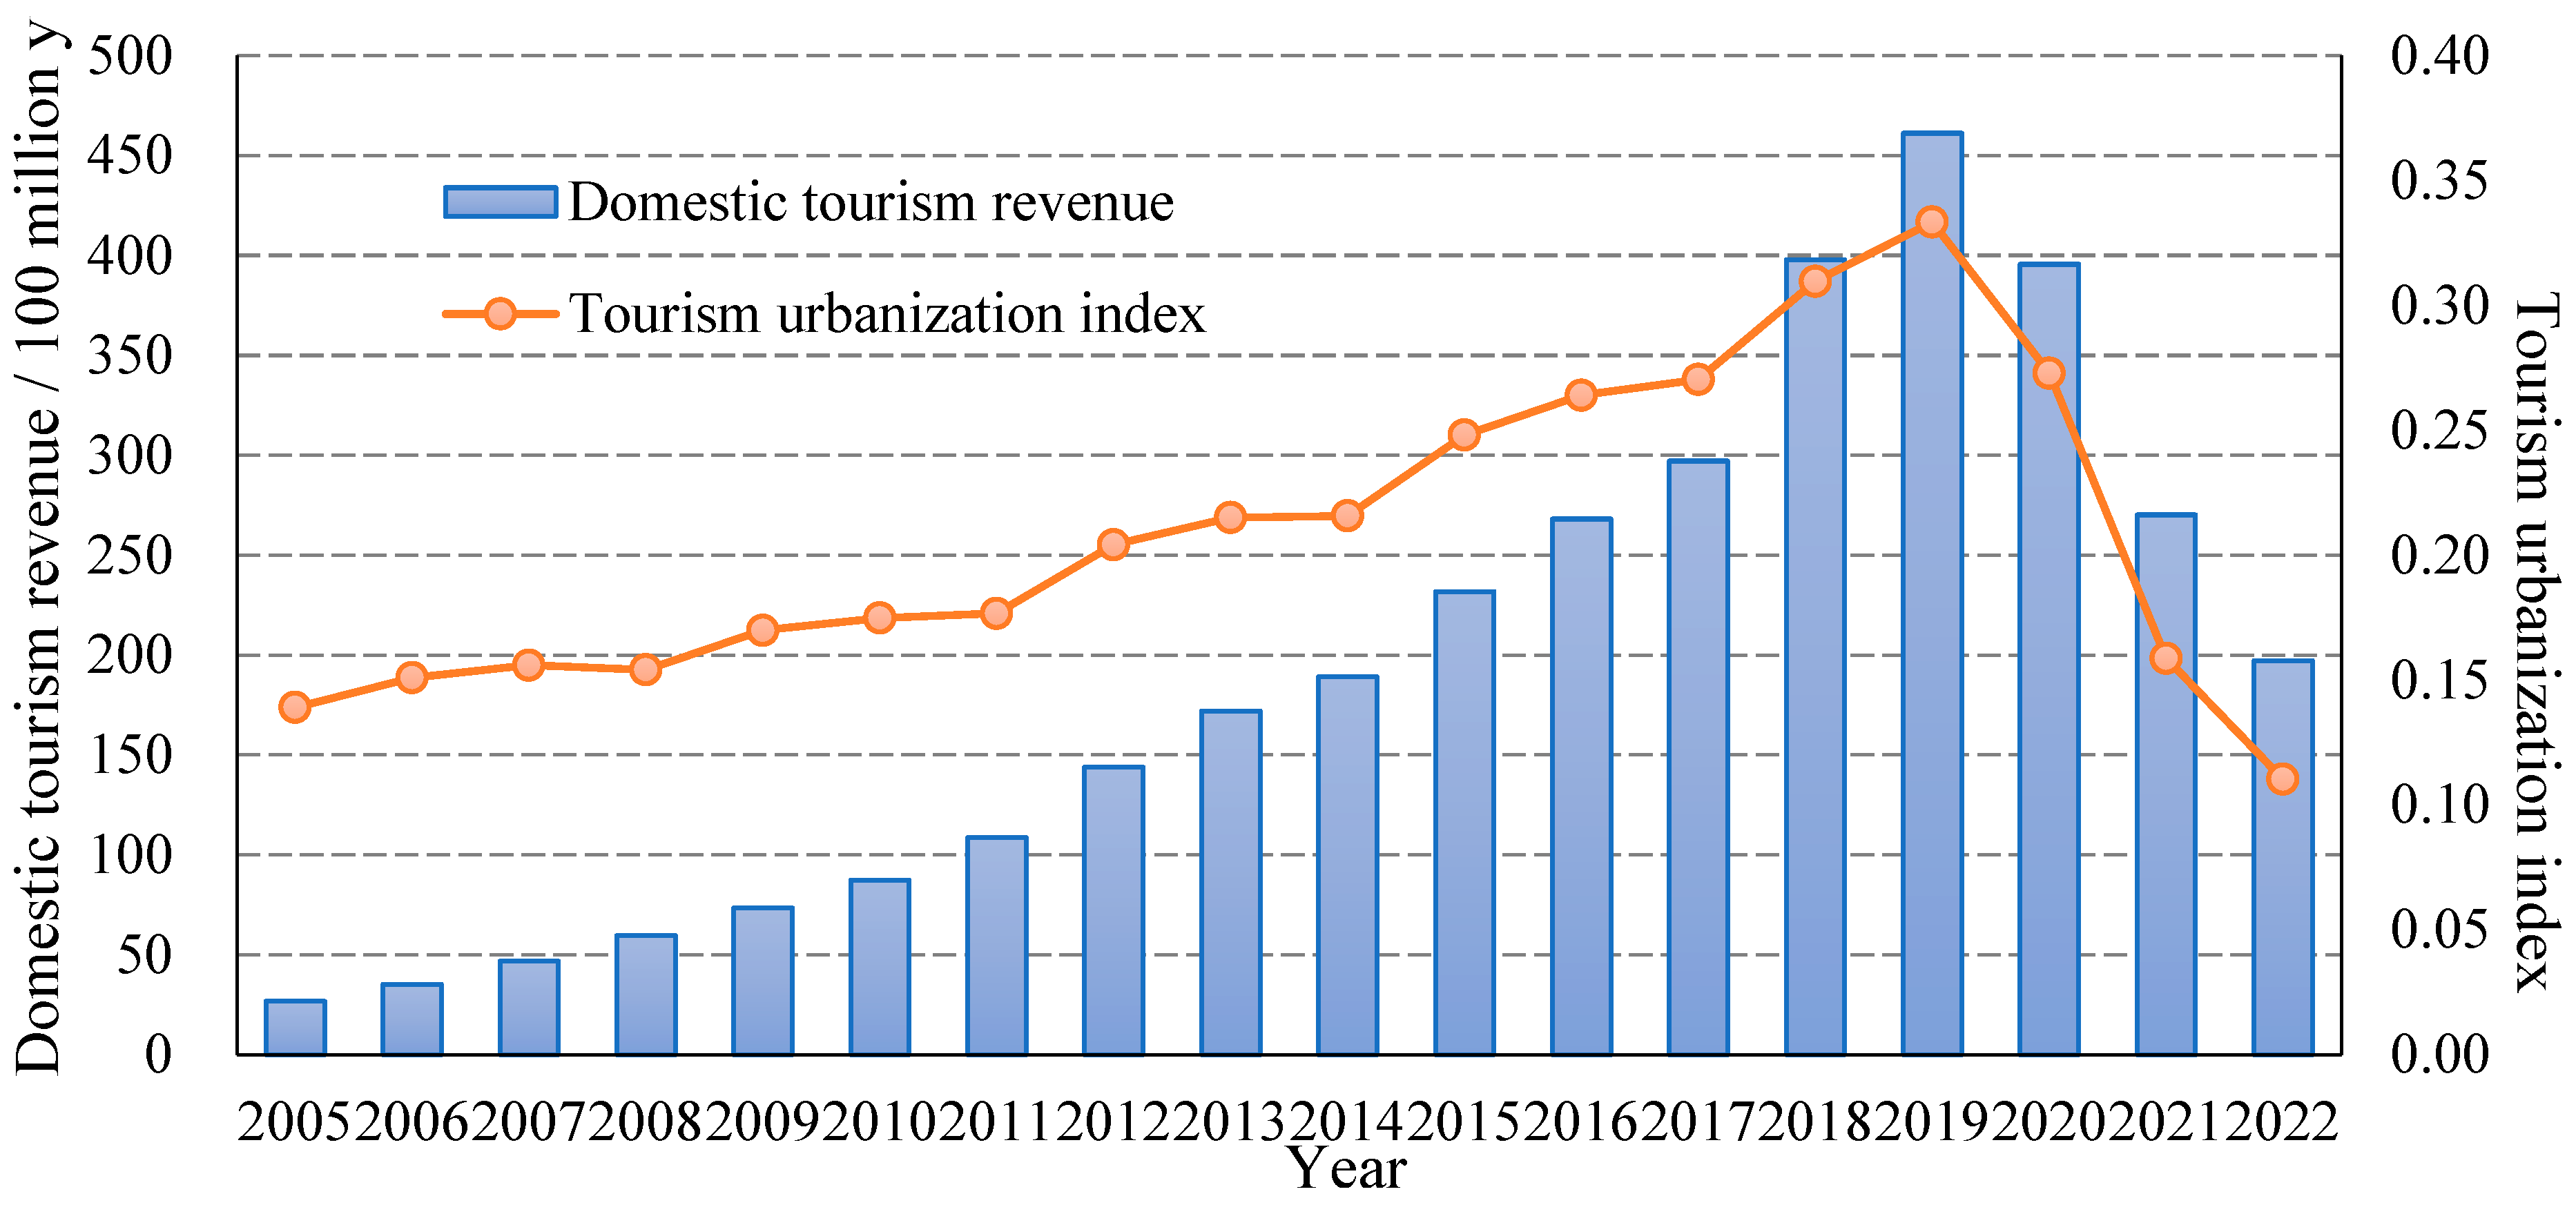
2.2. Sources of Data

The basic unit of this paper involves five provinces and 30 cities in China. Considering that the Central Plains Urban Agglomeration was established as the core of Henan’s “central city-driven strategy” in 2003 and included in provincial planning and that many data points were missing before 2005, the year 2005 was chosen as the starting point of the study. At the same time, to maximize access to all the indicators, the study period is selected as 2005–2022. The data used in this study are mainly from the National Bureau of Statistics of China, the China City Annual Database, and the statistical yearbooks and Statistical Communiqués of the People’s Republic of China on the National Economic and Social Development of each province; specifically, they include the 2006–2023 China Urban Statistical Yearbook, the China Population and Employment Statistical Yearbook, statistical yearbooks, national economic and social development statistical bulletins, and official websites of the Tourism Bureau of Henan, Shanxi, Hebei, Shandong, and Anhui Provinces and the municipalities they contain [39,40,41,42,43,44,45]. Missing data were interpolated, and all the data were standardized to remove the scale to achieve comparability.

3. Research Methods

3.1. Tourism Urbanization Response Coefficient

The tourism urbanization response coefficient is an indicator used to quantify the adaptation and feedback processes of tourism in different regions during the urbanization process. The coefficient reflects how tourism continues to improve with urban development during the urbanization process [4,10,46]. Based on previous research and considering data availability, we construct the tourism urbanization response coefficient via sample data from 2005 to 2022 for the Central Plains Urban Agglomeration. The formula is as follows:
R = ( f / F ) ( m / M )
where R is the tourism urbanization response coefficient; f is domestic tourism revenue; F is regional GDP; f/F is defined as tourism industrialization; m is the permanent urban population; M is the total permanent regional population; and m/M is urbanization. A large value of R means that the development of the tourism industry has surpassed the process of urbanization, indicating a relatively high level of tourism urbanization. In this context, the tourism industry has not only promoted the rapid growth of the regional economy but also significantly contributed to the optimization of the regional industrial structure.

3.2. Construction of the Resident Well-Being Index System

The concept of residents’ well-being involves multiple dimensions, including economic, health, social, safety, and environmental aspects [19,25]. Economic well-being represents the level of economic development in a region. Indicators, such as GDP per capita, are used to represent the quality of the economy, and the urban–rural income ratio is used to represent differences in economic development [32]. Health well-being includes indicators such as medical facility equipment and medical expenditures, which are necessary conditions for residents to live a healthy life [47]. Basic education and cultural facility indicators reflect the convenience of residents’ access to education, which belongs to the social dimension of residents’ well-being [48]. Social interaction, cultural identity, government policy planning, and public infrastructure construction (such as hospitals, schools, and transportation) are also factors that affect happiness and a sense of belonging [23,26]. Safety and well-being are sources of residents’ sense of internal security and include basic guarantees, such as food production, the water supply coverage rate, and road development [49]. The main factors affecting residents’ well-being include the environment, society, culture, policies and infrastructure. Among these factors, air and water quality, urban green space coverage, and climate change significantly affect residents’ health and life satisfaction [24]. Given the affinity of humans for nature, residents have a preference for the environment, and environmental well-being represents the environmental dimension of well-being [50], among which the area of park green space and the domestic waste treatment rate directly affect the appearance of a city [51]. Environmental factors, such as pollution reduction or increased greenery, can significantly improve residents’ quality of life and sense of well-being [23,50]. In summary, we select 15 indicators from the five dimensions of economy, health, society, safety, and the environment to construct a resident well-being evaluation index system (Table 1).
In this work, the weights of the indicators of residents’ well-being are determined via the entropy weight method and the analytic hierarchy process. Entropy weighting can objectively determine the weight of each indicator [52], although it relies heavily on objective information about the indicators; thus, it needs to be used in combination with the analytic hierarchy process. The combination of the two can prevent errors caused by data errors. To ensure the scientific nature of the weight distribution, the weights obtained via entropy weighting and the analytic hierarchy process are averaged to obtain the final weights.

3.3. Coupling Coordination Degree

The coupling coordination degree refers to the strength of the benign coupling between systems and reflects the coordinated development between systems [7]. The coupling coordination degree model is used to analyse the interactive process between the tourism urbanization response coefficient and residents’ well-being in the Central Plains Urban Agglomeration. The formula is as follows:
C = U 1 U 2 ( α 1 U 1 + α 2 U 2 ) 2
T = α 1 U 1 + α 2 U 2
D = C × T
where C is the coupling degree, which takes on values in the interval [0, 1]. The greater the value of C, the smaller the degree of discreteness between the subsystems and the higher the degree of coupling; U1 and U2 are the normalized value of subsystem; and α1 and α2 are the weight of the subsystem. We consider the tourism urbanization response system to be as important as the resident well-being system, so α1 and α2 are assigned an equal value of 0.5. T is the comprehensive evaluation of the correlation between the two systems, and D is the coupling coordination degree. The degree of coupling coordination is divided into five levels [53,54] (Table 2).

3.4. Random Forest

In this work, we explore the key factors affecting the coupling coordination degree of tourism urbanization and residents’ well-being and its changing trends via the random forest (RF) model. The random forest algorithm is a machine learning algorithm that is commonly used for data classification, regression and prediction. When performing regression or classification on factors, the RF can evaluate the role of each independent variable in operation, so it is often used to evaluate the impact of multiple independent variables on the dependent variable [55]. In this paper, taking the degree of coupling coordination between tourism urbanization and residents’ well-being as the dependent variable and the influencing factors as the independent variables, a random forest model is constructed to explore the key factors influencing the degree of coupling coordination between tourism urbanization and residents’ well-being and their changing trends. The %IncMSE index was used to evaluate and rank the importance of the factors influencing the degree of coupling coordination. The higher the %IncMSE index is, the greater the importance of this influencing factor.
The random forest regression model used in this paper is constructed by adopting the ranger package in the R language (RStudio 4.3.1) to study the relative changing trend of the importance of influencing factors in different years. In terms of data division, the datasets of each year were randomly divided into a training set (70%) and a test set (30%) at a ratio of 7:3. To ensure parameter consistency and avoid the interference of parameter differences on the importance ranking, this paper runs the models of each year based on the optimal parameters of 2022 as the standard, thereby obtaining more reliable results. Model performance optimization is carried out through the following steps. (1) Core parameter optimization: Grid search and the 10-fold cross-validation method are adopted to optimize the core parameters mtry, num.trees, and min.node.size. The final mtry value of 6 is optimally determined from 1 to p (p = total number of variables) through grid search, and the optimal min.node.size value of 10 is screened from the candidates of 1, 5, and 10 to balance the risk of overfitting. Finally, the number of decision trees was determined to be 200 based on the out-of-bag error (OOB) curve, and the error tended to stabilize at this time. (2) Model result verification: The out-of-pocket error (OOB) of the model is 0.0065, which is converted to RMSE = 0.081. Under the dimension of the dependent variable (0–1), the prediction error is approximately 8%, indicating that the results are robust. (3) Resulting standardization processing: The permutation importance obtained through the Ranger package is converted into the %IncMSE indicator through the formula. The formula is as follows:
% I n c M S E = M S E p e r m u t e d M S E o r i g i n a l M E S o r i g i n a l × 100 %
The degree of coupling coordination between tourism urbanization and residential well-being is influenced by various factors, such as natural ecology and socioeconomic conditions. We construct an index system based on four dimensions: nature, society, industry, and institutions (Table 3). In the natural dimension, the ecological environment is the natural foundation of tourism urbanization, the core constraint for the sustainable development of residents’ well-being, and a key limiting factor in the coordinated development of tourism urbanization and residents’ well-being. Two indicators are selected for representation: elevation and the normalized difference vegetation index (NDVI) [56]. In the social dimension, social factors influence the synergy between tourism urbanization and residents’ well-being through mechanisms such as population agglomeration and transportation accessibility. Therefore, indicators such as population density, distance to the nearest provincial capital city, and per capita road area are selected to characterize this dimension [57]. In the industrial dimension, the scale of the tourism industry is a direct driving force for urbanization and improved well-being among residents. We select visitor count to represent the scale of the tourism industry [58]. At the institutional level, government policy guidance and financial support play important roles in coordinating tourism development and improving people’s livelihoods; this is represented by the fiscal revenue and expenditure ratio and policy support measures.
Although the random forest model is less sensitive to multicollinearity than the linear model is, to ensure the robustness of the variable importance estimation, this paper evaluates the data quality through double validation. (1) Correlation coefficient matrix analysis: We calculate the Pearson correlation coefficients of all predictor variables. The results revealed that the maximum correlation coefficient |r| was 0.67, which was lower than the collinearity threshold of 0.7 in ecological studies, and there was no significant correlation between the variables. (2) Variance inflation factor test: We calculate the variance inflation factor (VIF) value of each variable. The results revealed that, except for the variance inflation factor (VIF) value of the DEM, which was 5.28, which was slightly higher than the conservative threshold of 5, the VIF values of the other factors were all less than 5. In summary, considering that the random forest alleviates the collinearity effect through feature random selection and that the variance inflation factor (VIF) of the DEM only slightly exceeds the standard, this study retains this variable. The above analyses were all accomplished through R language (RStudio 4.3.1), and the detailed results are shown in the attached table.

4. Results Analysis

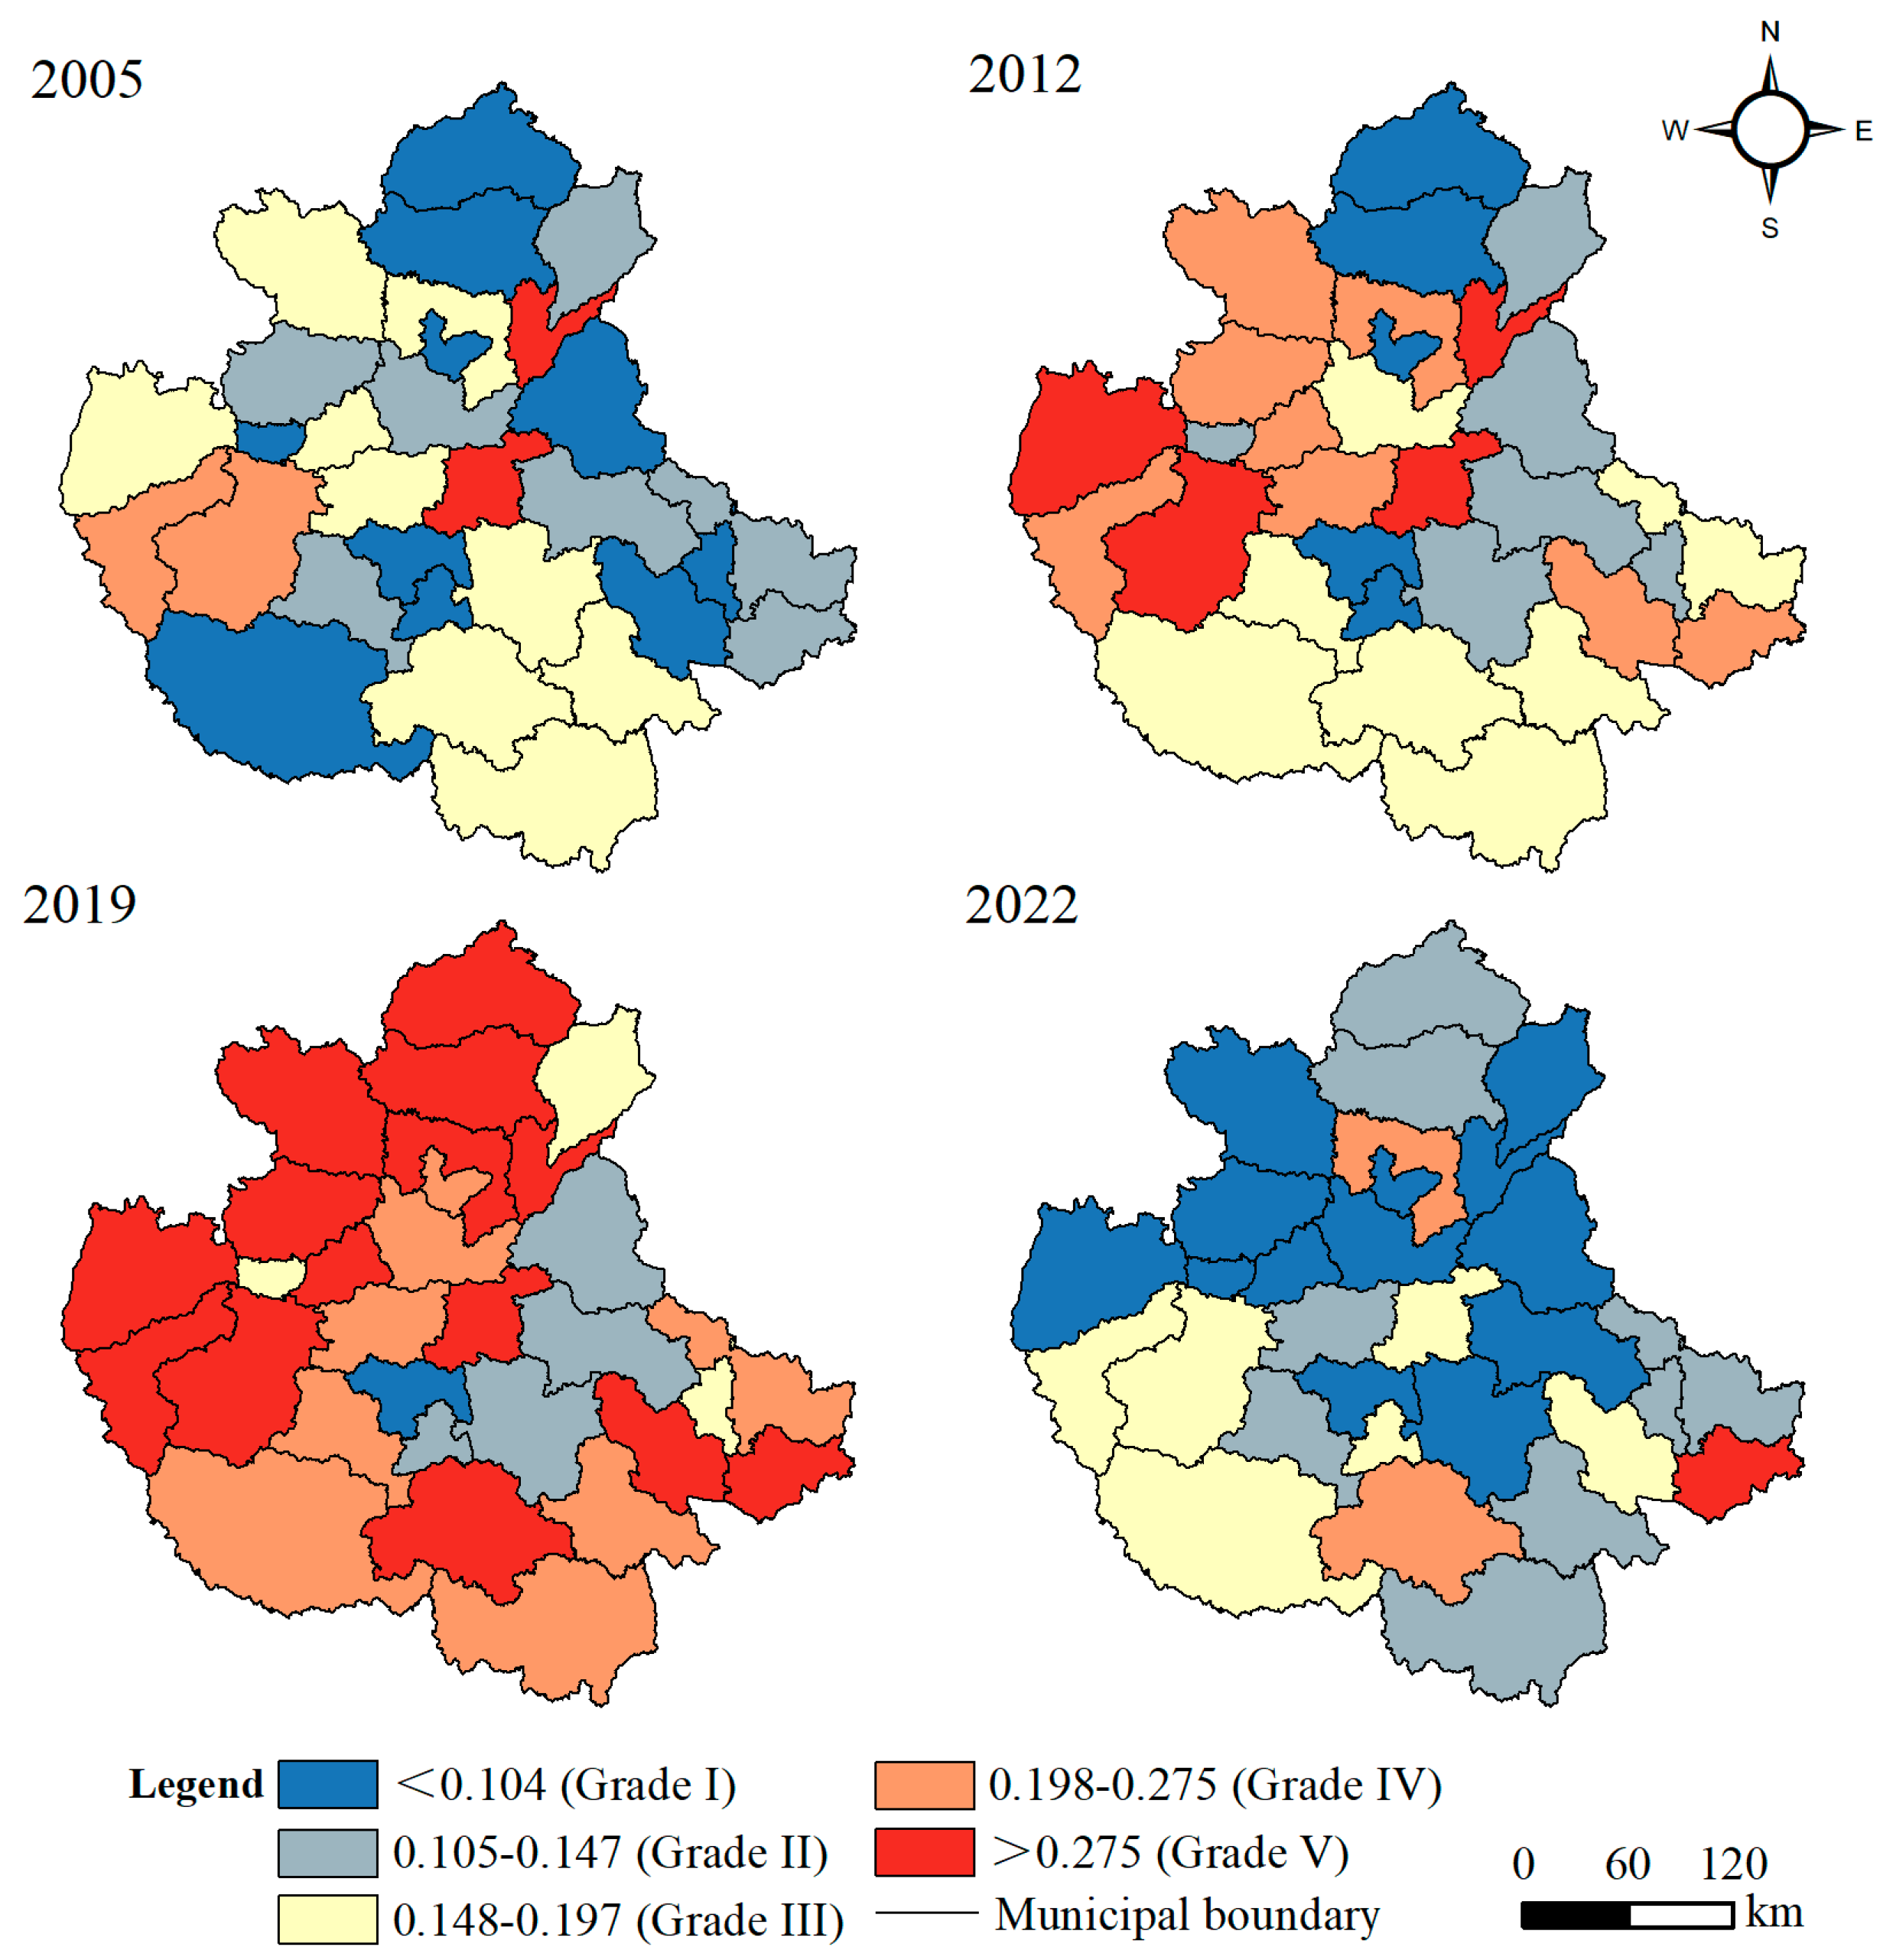
4.1. Spatiotemporal Evolution of Tourism Urbanization and Residents’ Well-Being

The calculations reveal that the time series distribution of the tourism urbanization index of the Central Plains Urban Agglomeration from 2005 to 2022 presents significant segmentation characteristics (Figure 2). From 2005 to 2019, there was an overall stable upwards trend and a steady rise in average domestic tourism revenue, which increased from 2.686 billion yuan to 46.133 billion yuan; this reflects the strong development of the tourism industry in the Central Plains Urban Agglomeration. The average value of the tourism urbanization index rose steadily from 0.139 in 2005 to 0.333 in 2019, an increase of 139.5%. This indicates a positive development trend and shows that the rapid development of tourism in the Central Plains Urban Agglomeration significantly promoted the development of urbanization in the region. From 2019 to 2022, the development of tourism urbanization declined significantly. The development of the tourism industry during this period was affected by objective factors, such as the COVID-19 pneumonia pandemic, given the sensitivity of the tourism industry to these external factors.
The natural breakpoint method was used in ArcGIS 10.6 software for classifying the level of tourism urbanization. The spatial pattern of the tourism urbanization index is constantly changing (Figure 3). In 2005, only Kaifeng city and Puyang city had the highest level of tourism urbanization, while most cities still presented medium to low levels. By 2012, the high-value areas of the tourism urbanization index had further expanded to the central and western regions, with Luoyang city and Yuncheng city reaching level V of tourism urbanization. The tourism urbanization level of the cities of Zhengzhou and Changzhi improved significantly, which indicates that the tourism industry in the Central Plains Urban Agglomeration achieved rapid development with the support of enhanced infrastructure and services and the availability of high-quality tourism resources. The tourism urbanization level of some cities, such as Liaocheng and Shangqiu, remained relatively low. In 2019, the research area was dominated by cities with levels IV and V, and the number of low-value areas decreased significantly. Among them, the tourism urbanization indices of Handan city and Zhengzhou city grew rapidly. Handan city is the cultural centre of Hebei Province and has abundant resource endowments. In recent years, innovative tourism measures have been implemented to achieve long-term development. Zhengzhou city, as one of eight ancient capitals, has exploited policy support and transportation advantages to enhance its tourism status. From 2020 to 2022, owing to the impact of the COVID-19 epidemic, the development of the tourism industry in most areas was hindered, and the urbanization process slowed accordingly.
The temporal changes in the well-being of residents in the Central Plains Urban Agglomeration are depicted in Figure 4. Overall, there is an increasing trend in residents’ well-being, although it is accompanied by minor fluctuations, culminating in a sharp decline at the end of the study period. However, the overall well-being level remains relatively low, which indicates that enhancing residents’ well-being continues to be a formidable task. The five dimensions of well-being analysed in this study all improved. Notably, economic well-being increased from 0.065 to 0.130, making the most significant contribution to overall well-being. Social well-being, which serves as the foundational guarantee for residents’ well-being, exhibited the smallest contribution rate. Nevertheless, there was a general improvement in residents’ quality of life. At the end of 2019, the outbreak of the COVID-19 pandemic led to a slowdown in the advancement of residents’ well-being. Nevertheless, there was still an observable improvement, which was closely linked to government efforts in safeguarding livelihoods and implementing epidemic prevention measures. Between 2020 and 2022, several dimensions of residents’ well-being, especially health well-being and social well-being, showed a downwards trend. Owing to the strong impact of the pandemic, health well-being and social well-being decreased from 0.126 and 0.119, respectively, in 2019 to 0.089 and 0.094, respectively, in 2022. These findings indicate that the pandemic had the greatest impact on health and social well-being.
The natural breakpoint method was used in ArcGIS 10.6 software to classify the levels of residents’ well-being. The spatiotemporal pattern of residents’ well-being has changed significantly (Figure 5). In 2019, the well-being of residents in all cities improved significantly compared with that in 2005. However, there were significant differences in residents’ well-being within the Central Plains Urban Agglomeration. In 2005, the eastern part of the study area was dominated by residents’ well-being levels I and II. Zhengzhou was the only city with a well-being score of V, which is related to its role as the central city of the Central Plains Urban Agglomeration. In 2012, the well-being of residents in the peripheral cities around Zhengzhou, including those in the central and western regions of the study area, improved significantly. By 2019, the overall trend of residents’ well-being development was positive, with well-being levels IV and V dominating the central and northern regions. However, the well-being of residents in Changzhi, Jincheng, Yuncheng and Fuyang remained relatively low. Owing to the impact of the COVID-19 pandemic, in 2022, residents’ well-being declined in almost all cities. However, Zhengzhou and Luoyang still maintain a high level of residents’ well-being (Level V); this reflects Zhengzhou’s stability in terms of residents’ well-being in the face of major public safety incidents, owing to its status as the provincial capital. Similarly, Luoyang, as the second-largest city in Henan Province, has high levels of both residents’ well-being and resilience.

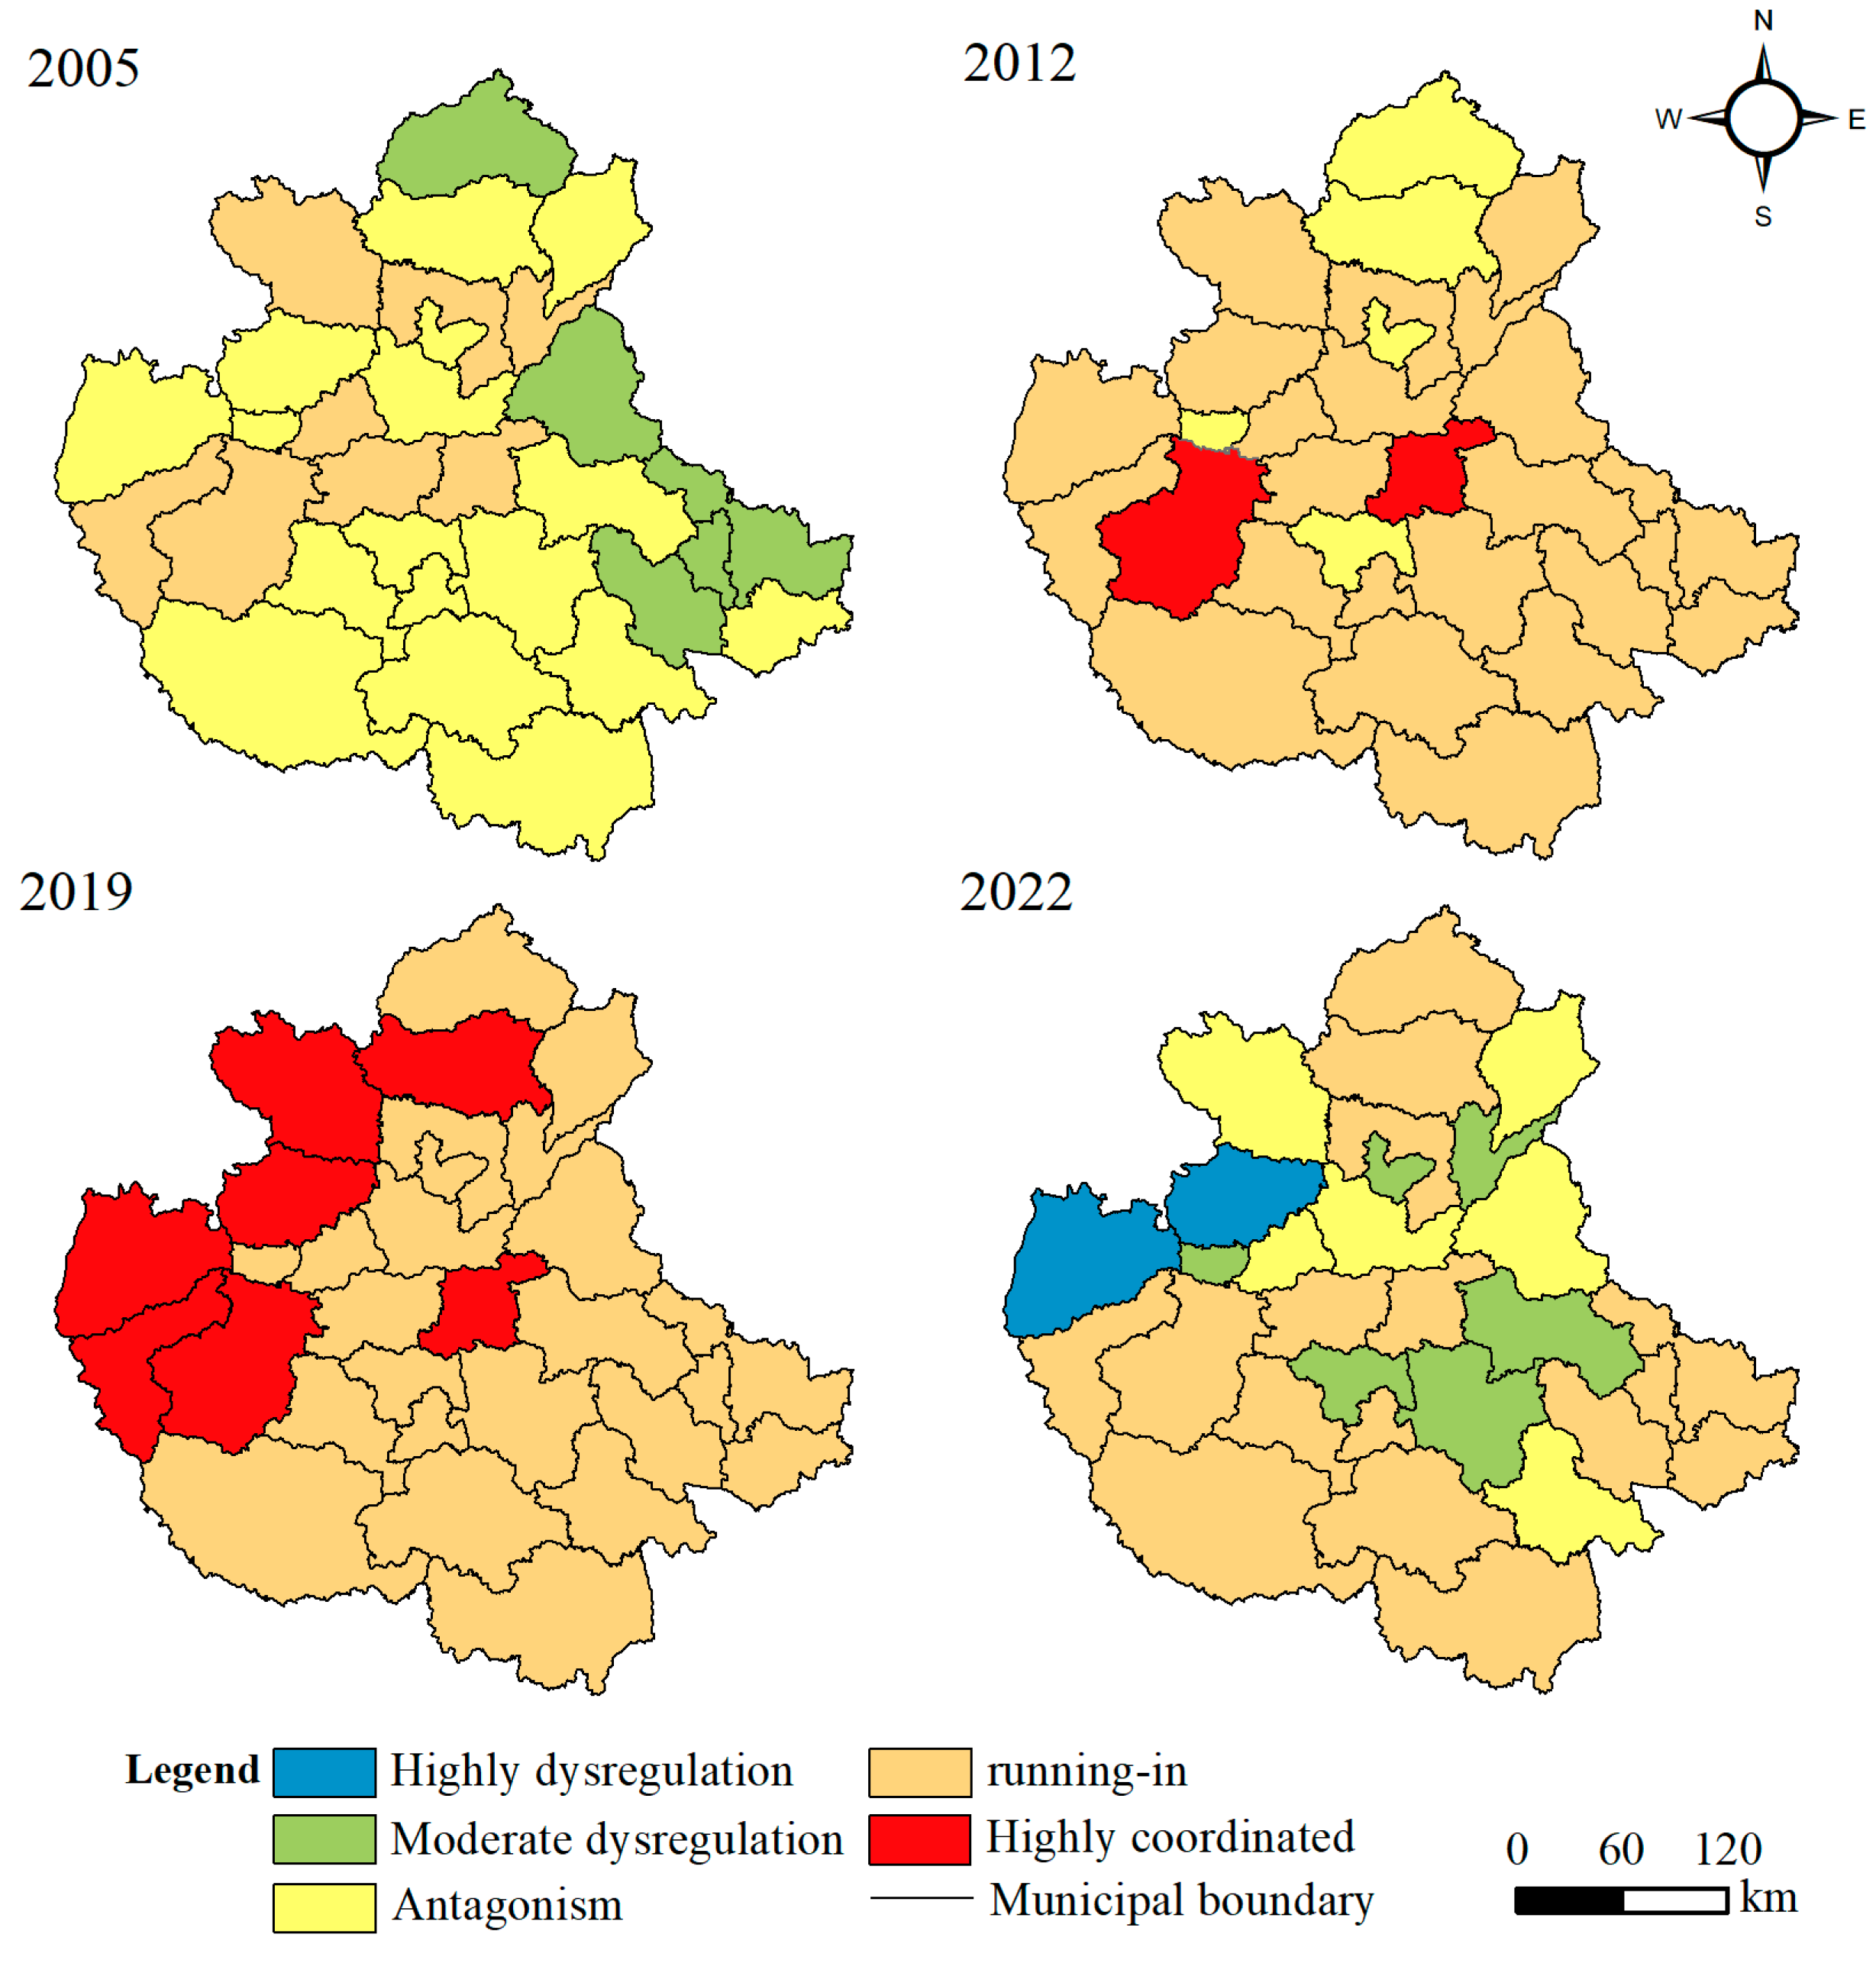
4.2. Spatiotemporal Evolution of the Coupling Coordination Degree of the Central Plains Urban Agglomeration

The degree of coupling coordination between tourism urbanization and residents’ well-being shows an overall trend of first steadily increasing and then decreasing. The higher the degree of coupling coordination is, the more balanced the development of tourism urbanization and residents’ well-being. From 2005 to 2019, the degree of coupling coordination increased from 0.482 to 0.672; however, from 2019 to 2022, owing to the COVID-19 pandemic, the degree of coupling coordination decreased to 0.504, and further optimization of resource allocation was needed to withstand external shocks and restore coordination. A spatial distribution map of the degree of coupling between urbanization and residential well-being is subsequently presented (Figure 6). Overall, there is significant geographical variation in the degree of coupling coordination. In 2005, except for eight cities, including Changzhi, Anyang, Zhengzhou, and Kaifeng, which were in the running-in stage, the remaining cities were in an unbalanced state, which was related to the focus on economic development at the time. In 2012, the coupling coordination level increased, and most cities were in the antagonism and running-in stages. Kaifeng city and Luoyang city had relatively high coupling coordination degrees exceeding 0.7 and were in the high coordination stage; this can be attributed to their deep cultural heritage, abundant resource endowments, great potential for cultural tourism development and the fact that tourism has become a growth pole of regional economic development. Therefore, the development of tourism-oriented urbanization and residents’ well-being were highly coordinated. In 2019, the coupling coordination degree of all cities exceeded 0.5, and no cities experienced unbalanced development. Overall, from 2005 to 2019, the coupling coordination degree of each city showed an increasing trend, with reduced heterogeneity among cities and significant convergence characteristics. From 2020 to 2022, owing to the impact of the COVID-19 pandemic, the degree of coupling coordination decreased, and the western region even changed from presenting high coordination to being highly dysregulated; this reflects the low resilience of urban development in the face of the pandemic.

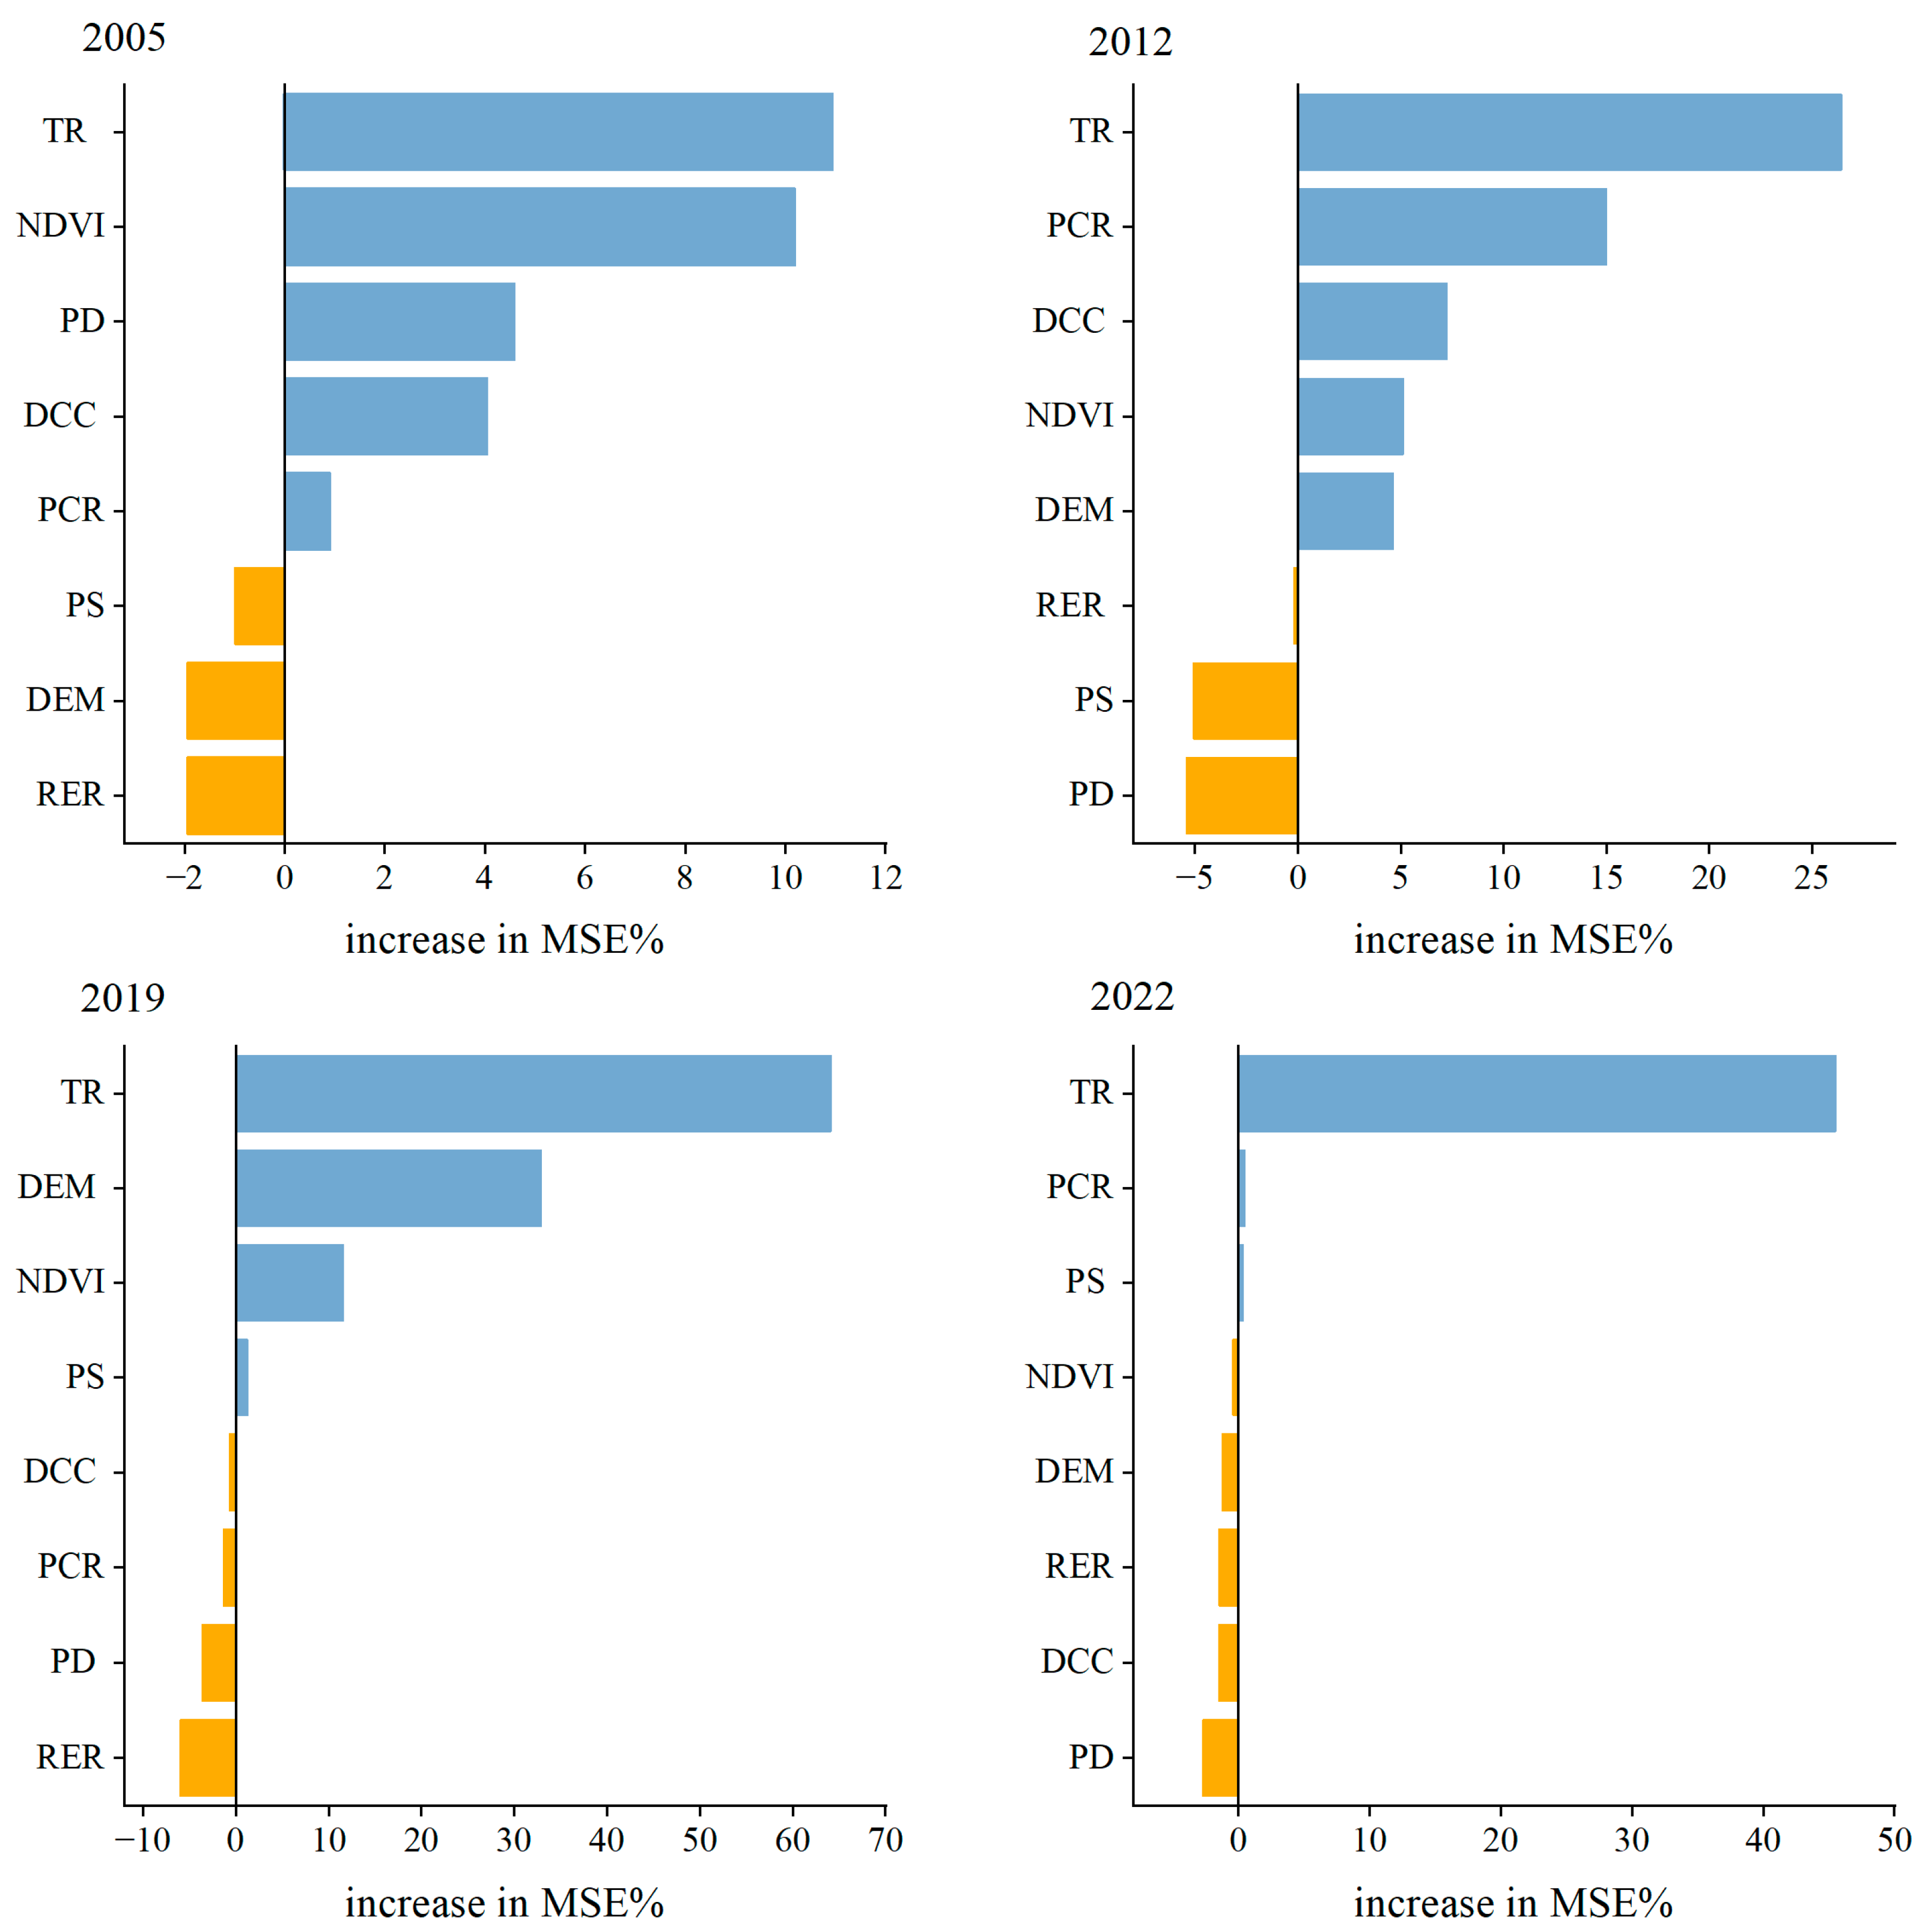
4.3. Analysis of Influencing Factors

The relative contributions of the factors influencing the degree of coupling coordination between tourism urbanization and residents’ well-being were obtained separately via the Ranger package (Figure 7). The key factors affecting the degree of coupling coordination exhibit significant temporal variations. Among them, the number of tourists has always been the core driving factor. The expansion of the tourism industry not only accelerates tourism urbanization but also enhances residents’ well-being by creating job opportunities and increasing household income, thereby promoting coupled and coordinated development. The importance of policy support also increased significantly, which indicates that policy interventions play an increasingly vital role in the coordinated development of tourism urbanization and residents’ well-being. This shift is closely linked to adjustments in national and local policies, such as the implementation of rural revitalization and tourism-driven poverty alleviation initiatives, which provide strong support for tourism development and the enhancement of well-being. The importance of per capita road area rose from fifth place in 2005 to second place in 2022, indicating that improvements in transportation conditions can promote the coordinated development of the two. The significance of the NDVI remains stable, reflecting the tourism industry’s continuous reliance on natural resources. The importance of DEMs first increases and then decreases, and the constraint of terrain on the development of tourism gradually weakens. The importance of the fiscal revenue and expenditure ratio has increased. Greater financial support can provide more financial guarantees for the development of the tourism industry and the improvement of public services. Moreover, the importance of population density has significantly declined, dropping from third place in 2005 to last place in 2022. Additionally, the significance of proximity to the nearest provincial capital declined annually; this indicates that, with improved transportation infrastructure and regional integration, the geographical constraints on tourism urbanization and residents’ well-being are gradually diminishing.

5. Discussion

5.1. Spatial and Temporal Patterns of Tourism Urbanization and Residents’ Well-Being

Many studies have focused on either tourism urbanization or residents’ well-being, although few have explored the spatiotemporal patterns of the two [10,28,38]. The results revealed that the level of tourism urbanization in the Central Plains Urban Agglomeration steadily increased from 2005 to 2019. During this period, the average value of domestic tourism income continued to rise steadily, indicating that the rapid development of tourism significantly boosted the development process of urbanization within the region, a conclusion for which evidence can be found in Gao et al.’s study on the coordinated development relationship between tourism and urbanization [16,17]. In terms of spatial patterns, tourism urbanization in the early period was only at a high level in some regions, and then, the high-value area gradually expanded to the central and western parts of the region, which is similar to the characteristics of the diffusion of the core region of tourism urbanization in the study by Weng et al. [59]. Residents’ well-being as a whole also increased during the period of the study, although there were small fluctuations during the period, with the contribution of economic well-being to residents’ well-being being the greatest. This is in line with the findings of some scholars, such as Al-Ajlani et al., whose study noted that economic factors dominate the improvement of residents’ quality of life [19]. With respect to the evolution of spatial patterns, the well-being of residents in the study area improved overall, yet diverged significantly from 2005 to 2019, which is highly consistent with the findings of Wang et al., who noted that the level of residents’ well-being in the eastern region has increased significantly in recent years and varied widely within the region [60]. Notably, the relationship between tourism urbanization in the Central Plains city cluster and the trend of temporal changes in the level of residents’ well-being in the Central Plains city group from 2005 to 2019 is the same, and there is consistency in spatial distribution, with spatial differentiation characteristics of “high in the west and low in the east” and “high in the centre and low around”, which is consistent with the findings of this paper. This finding is consistent with the conclusion of this paper that there is a coupled and coordinated relationship between tourism urbanization and residents’ well-being. Both tourism urbanization and residents’ well-being levels decreased from 2019 to 2022 as a result of the epidemic, which is consistent with the conclusion that external shocks negatively affect regional development in some studies [61], reflecting the widespread impact of major public events on regional development. The difference is that the overall level of tourism urbanization and residential well-being decreases in the later period; however, some regions still maintain high levels of well-being, suggesting that residential well-being is somewhat resilient and supported by economic and social well-being.

5.2. Coupled Coordination and Its Influences

The degree of coupling and coordination between tourism urbanization and residents’ well-being in the Central Plains Urban Agglomeration is jointly affected by multiple factors, and its dynamic changes are the result of the interaction of these factors. From 2005 to 2019, the overall degree of coupling coordination showed a stable upwards trend, and the spatial differences gradually narrowed. Cities such as Kaifeng and Luoyang have long been in a stage of coordinated development. These cities are the major ancient capitals of China, with abundant cultural and tourism resources left behind and a high degree of integration between culture and tourism. In cities with a well-developed cultural tourism industry, there is often a significant positive spatial correlation between tourism urbanization and residents’ well-being, and many studies have confirmed this result. Moreover, our research revealed that the degree of coupling coordination between tourism urbanization and residents’ well-being is dynamically influenced by multiple factors (Figure 7). Among them, the number of tourists received has always occupied a dominant position. The expansion of its scale directly drives the urbanization process and the improvement of residents’ well-being and is the core driving force throughout the development cycle. On the one hand, the expansion of the tourism scale promotes the extension of industrial chains, such as catering and accommodation, accelerating the spatial expansion of urbanization and industrial agglomeration. On the other hand, tourism creates nonagricultural jobs and increases residents’ income, thereby narrowing the well-being gap between urban and rural areas [3,7]. In addition, the growth in the number of tourists will also stimulate local governments to increase investment in public services, such as transportation and environmental protection, forming an influence chain of increased tourism demand—government policy response—improving residents’ well-being, which greatly promotes the coupled and coordinated development of tourism urbanization and residents’ well-being. In addition to the number of tourists received, other influencing factors show significant phase changes. In the early stage of tourism urbanization, the tourism industry was still in its infancy and relied heavily on local resource endowments and basic conditions, such as the vegetation index and population density (Figure 7). The normalized difference vegetation index reflects the quality of the regional ecological environment, and a high or low value not only affects the health aspect of residents’ well-being but also serves as a natural tourism resource and affects the core competitiveness of tourism resources. Population density and distance from the provincial capital city are basic conditions for the development of tourism and have a strong impact on the scale of tourism in the early stage of tourism development [25]. Areas with high population density tend to present good infrastructure and large local markets. Overall, however, the role of tourism development in promoting urbanization and improving residents’ well-being is limited at this time. With the continuous development of the tourism industry, the distance from provincial capital cities and per capita road area have become the key drivers for promoting coordinated upgrading. The improvement in transportation accessibility accelerates the flow of tourists and the integration of resources, which can shorten the temporal and spatial distance between urban and rural areas and increase the radiation of the tourism economy. Moreover, residents who are close to provincial capital cities can share the high-quality public services of provincial capital cities, thereby increasing their well-being levels. However, according to the conclusions of relevant scholars [38,62]. However, when tourism urbanization enters the mature stage, tourism development gradually stagnates, and its role in urban development and the enhancement of residents’ well-being shows a weak trend. At this point, the marginal benefits of market forces diminish, whereas the regulatory role of policy and the supportive effect of finance increase significantly and become key factors in breaking through the development bottleneck [7,34]. Moreover, the constraints of geographical location gradually weaken with regional integration.
Research has also revealed that during the COVID-19 pandemic (2020–2022), the degree of coupling and coordination between tourism urbanization and residents’ well-being in most cities significantly declined. Some cities, such as Yuncheng and Jincheng, are facing a crisis where the coordination level is regressing from “highly coordinated” to “highly disbalanced”; this highlights major systemic deficiencies in their linkage mechanism in the face of major public safety crises and indicates clear shortcomings in risk prevention capabilities [61]. These phenomena are reflected not only in the significant slowdown in tourism growth and the substantial reduction in tourism revenue but also in the high sensitivity and vulnerability of the tourism economy to fluctuations in the overall regional economy. For example, during the pandemic, due to the reduction in tourism activities and the sharp decline in the number of tourists, upstream and downstream enterprises in the tourism industry chain faced operational difficulties. The income of core industries, such as accommodations, catering, transportation and scenic spots, decreased significantly, which directly suppressed regional economic vitality and employment levels and, in turn, had a negative effect on residents’ well-being. This finding is consistent with that of [61]. Therefore, there is an urgent need to stabilize business operations and safeguard jobs through policy guidance and financial support to alleviate the pressure on residents’ livelihood, improve the resilience of the tourism industry and enhance risk prevention capabilities within the linkage mechanism between tourism urbanization and residents’ well-being.

5.3. Suggestions for Countermeasures

There are significant spatial differences in the level of tourism urbanization across the Central Plains Urban Agglomeration. On the one hand, the goals of future development should include the optimization of the spatial layout and strengthened regional collaboration. With advantaged areas, such as Zhengzhou, Handan, and Luoyang, at the core, the differentiated tourism resource endowments of the Central Plains Urban Agglomeration should be integrated to give full play to the radiating and driving role of the advantageous areas and promote regional collaboration. On the other hand, as the tourism industry enters a mature stage, growth gradually slows and tourism urbanization begins to stagnate, governments should focus on promoting business model innovation and transformation and development to stimulate tourism vitality. The Central Plains Urban Agglomeration has a good ecological foundation and deep cultural heritage. Local governments should seize strategic opportunities for China’s ecological civilization construction and traditional Chinese cultural empowerment to promote the integrated development of ecotourism and cultural tourism.
The overall well-being of residents in the Central Plains Urban Agglomeration is not high. Among them, economic well-being contributes the most to residents’ well-being, social well-being plays a protective role, and health well-being is highly volatile and susceptible to external influences. On the one hand, the leading role of economic well-being should be strengthened, and the employment and income security of residents should be improved. Compared with other developed regions, the Central Plains Urban Agglomeration is relatively late in development and has a relatively imperfect system, with large cities and small towns developing in an uncoordinated manner. Although the overall level of new urbanization, rural revitalization, and urban–rural integration is developing in a positive direction, it is still in the primary stage, resulting in a large income gap. To narrow the income gap between urban and rural areas, it is possible to develop specialty agriculture. For example, we can promote the “tourism + agriculture” industry linkage and enrich rural residents’ income-generating channels through the development of rural lodging, garden picking and other business projects. On the other hand, the employment security system should be improved to alleviate the unemployment and income decline caused by industrial transformation. Social and health well-being should be consolidated, the allocation of public service resources in tourist hotspots should be optimized, and the conflict over resources between residents and tourists should be alleviated through the dynamic deployment of human and material resources.
The coordinated development of tourism urbanization and residents’ well-being is an important driving force for promoting urban construction and improving residents’ well-being. However, research shows that the contribution of the tourism industry to residents’ well-being is gradually weakening, and there is an urgent need to innovate the development model and improve the linkage mechanism between the two. The most important factors are policy guidance and financial support. On the one hand, the government should establish a cross-regional cooperation mechanism through institutional innovation to enhance institutional guarantees for the coordinated development of tourism urbanization and residents’ well-being and enhance adaptability and resilience in the face of major public safety incidents. Special funds should be set up to support small and medium-sized tourism enterprises in withstanding the operational risks caused by market fluctuations [63]. On the other hand, tourism enterprises should actively assume social responsibility and work closely with local governments to form synergies. Enterprises in the tourism industry should innovate sustainable development strategies to achieve the balanced development of economic, social, and ecological benefits [64]. Tourism enterprises can cooperate with local communities to promote community-based tourism development and encourage residents to participate in tourism services and cultural experience projects, thereby increasing local residents’ sources of income and improving their well-being. Moreover, tourism enterprises should increase investment in and manage environmental protection facilities, actively reduce the adverse impact of tourism activities on the natural ecological environment, and protect the quality of the living environment and residents’ well-being to achieve high-quality coordinated development of tourism urbanization and residents’ well-being.

6. Conclusions

In recent years, tourism urbanization and residents’ well-being have been frontier topics in tourism geography research. As a special type of urbanization, tourism urbanization has gradually become a new economic growth point for the development of city clusters. To explore the evolution characteristics, spatial patterns and factors influencing the coupling coordination between tourism urbanization and residents’ well-being in the Central Plains city cluster, this paper calculates the coupling coordination degree of tourism urbanization and residents’ well-being based on the coupling coordination model and explains the factors influencing the coupling coordination degree via random forest. The results revealed that tourism urbanization and residents’ well-being in the Central Plains city cluster exhibited a stable upwards trend from 2005 to 2019, and the spatial distribution presented spatial differentiation characteristics of high values in the west and low values in the east and high values in the middle and low values in the surrounding areas with spatial differences, although there was a significant decrease in spatial heterogeneity. The degree of coupling coordination increased annually from 2005 to 2019; however, its driving factors clearly differed, and the importance of the number of tourists, the degree of policy support, and the fiscal revenue and expenditure ratio increased significantly during the study period and became the main driving factor, whereas the importance of the vegetation index and the distance from the nearest provincial capital city diminished. The degree of coupling coordination decreased significantly after 2020 due to the epidemic shock, indicating the vulnerability of the coupled system to external risk.
The results of this paper have direct policy implications for the development of the Central Plains urban agglomeration. First, the adjustment of the strategic objectives of socioeconomic development and the formulation of urban tourism policies have strongly promoted the level of tourism urbanization, which in turn enhances the well-being of the region’s residents. Therefore, there is an urgent need to further optimize local tourism development strategies and policy measures. In addition, tourism urbanization within the Central Plains city cluster shows significant spatial heterogeneity; thus, it is necessary to pay attention to regional synergistic development and optimize the spatial layout to reduce the development differences between regions. Second, the study reveals that the well-being level of residents in the Central Plains Urban Agglomeration is not high, and the pace of promoting rural revitalization and integrating urban and rural development should be accelerated to gradually improve the employment security system for residents. Moreover, the degree of coupling coordination is affected by multiple factors, including the number of tourists received, policy support, and the proportion of fiscal revenue. The main driving factors are different at different stages, and this stage-by-stage difference provides the basis for dynamic adjustment in policy formulation, which ultimately promotes the coupling and coordinated development of tourism urbanization and residents’ well-being.
The research of this article has made some contributions to the study of tourism urbanization and residents’ well-being; on the one hand, it provides a quantitative study on the spatiotemporal coupling between tourism urbanization in urban agglomerations and residents’ well-being, filling the significant gap in existing research. On the other hand, the key factors influencing the coupling relationship were identified through the random forest model, providing new insights for sustainable regional development. Although this study has yielded several meaningful findings, there are still some issues that need to be further explored. First, the index measurement of tourism urbanization is still not able to characterize its development process from multiple dimensions, and how to accurately measure tourism urbanization will become an important topic for future research. In the future, we can select a comprehensive index of tourism urbanization according to the availability of data and conduct a comparative study to validate the universality of this paper’s results. Second, this study focuses on the coordination effect and obstacle factors of tourism urbanization and people’s well-being, and the underlying mechanism, as well as the evolution trend and interaction effect, needs to be further explored. The methodology can adopt the PAVR model, the spatial trend surface, the Markov chain model, etc., to provide a more scientific basis for the formulation of the development policy of the Central Plains city cluster. Finally, this paper takes only the 30 cities in the Central Plains city cluster as the overall research object to explore the factors influencing tourism urbanization on residents’ well-being and does not consider the spatial variability among the cities within the cluster so that different types of cities can be comparatively analysed in future research.

Author Contributions

Conceptualization, D.L. and F.L.; formal analysis, F.L.; funding acquisition, F.F.; methodology, F.L., L.G. and Y.J.; project administration, F.F.; supervision, F.F.; validation, F.L. and Y.J.; visualization, L.G.; writing—original draft, D.L.; writing—review and editing, F.L. and F.F. All authors have read and agreed to the published version of the manuscript.

Funding

This work was supported by “the Natural Science Foundation of Henan Province” (Grant No. 242300421655), “the Philosophy and Social Science Planning Foundation of Henan Province” (Grant No. 2024CJJ023), “the Higher Education Teaching Reform Research and Practice Key Project of Henan Province” (Grant No. 2024SJGLX1082).

Institutional Review Board Statement

Not applicable.

Informed Consent Statement

Not applicable.

Data Availability Statement

The data presented in this study are available on request from the corresponding author.

Conflicts of Interest

The authors declare no conflicts of interest.

References

  1. Niu, F.; Yang, X.; Wang, F. Urban Agglomeration Formation and Its Spatiotemporal Expansion Process in China: From the Perspective of Industrial Evolution. Chin. Geogr. Sci. 2020, 30, 532–543. [Google Scholar] [CrossRef]
  2. Mullins, P. Tourism Urbanization. Int. J. Urban. Reg. Res. 1991, 15, 326–342. [Google Scholar] [CrossRef]
  3. Zhang, X. Impact of rural tourism on residents’ well-being in traditional ancient villages: A case of North Guangxi. Herit. Sci. 2021, 9, 138. [Google Scholar] [CrossRef]
  4. Liu, Y.J.; Tang, J.X.; Ma, X.F. Spatial and Temporal Evolution and Model of Tourism Urbanization in Concentrated Continuous Poor Areas: Taking Wuling Mountainous Area in Hunan as an Example. Econ. Geogr. 2019, 39, 214–222+230. [Google Scholar]
  5. Lu, D.D.; Chen, M.X. Several viewpoints on the background of compiling the “National New Urbanization Planning (2014–2020)”. Acta Geogr. Sin. 2015, 70, 179–185. [Google Scholar]
  6. Tan, J.; Wang, K.; Gan, C.; Ma, X. The Impacts of Tourism Development on Urban–Rural Integration: An Empirical Study Undertaken in the Yangtze River Delta Region. Land 2023, 12, 1365. [Google Scholar] [CrossRef]
  7. Wang, M.H.; Su, M.M.; Gan, C.; Yu, Z.H. Tourism development and resident wellbeing in urban agglomeration: A coupling coordination analysis of the Yangtze River Delta Urban Agglomeration. J. Clean. Prod. 2023, 421, 138361. [Google Scholar] [CrossRef]
  8. Cong, Y.; Zhai, Y.; Dong, Y.; Zhao, Z.; Yang, G.; Shen, H. The Influence of Tourism’s Spatiotemporal Heterogeneity on the Urban–Rural Relationship: A Case Study of the Beijing–Tianjin–Hebei Urban Agglomeration, China. Sustainability 2024, 16, 7468. [Google Scholar] [CrossRef]
  9. Hua, H.; Wondirad, A. Tourism Network in Urban Agglomerated Destinations: Implications for Sustainable Tourism Destination Development through a Critical Literature Revie. Sustainability 2021, 13, 285. [Google Scholar] [CrossRef]
  10. Gohar, A. Tourism and Urbanization, An Interconnected Evolution. Sustain. Environ. 2021, 6, 96–135. [Google Scholar] [CrossRef]
  11. Yang, Z.; Zhang, S.; Liu, J.; Sun, H. Network of Tourism-Industrial Complex in Cities: Typologies and Implications through a Critical Literature Review. Int. J. Environ. Res. Public Health 2022, 19, 4934. [Google Scholar] [CrossRef]
  12. Shen, W.; Chen, Y.; Cao, W.; Yu, R.; Cheng, J.L. Coupling and interaction mechanism between green urbanization and tourism competitiveness: An empirical study in the Yellow River Basin of China. Sci. Rep. 2024, 14, 13167. [Google Scholar] [CrossRef]
  13. Chamizo-Nieto, F.J.; Nebot-Gómez de Salazar, N.; Rosa-Jiménez, C.; Reyes-Corredera, S. Indicators for measuring tourism intensification in urban areas through their associative network: Case studies from the Spanish Mediterranean coast. Eur. J. Tour. Res. 2022, 32, 3202. [Google Scholar] [CrossRef]
  14. Lu, Y.; He, M.-e.; Liu, C. Tourism Competitiveness Evaluation Model of Urban Historical and Cultural Districts Based on Multi-Source Data and the AHP Method: A Case Study in Suzhou Ancient City. Sustainability 2023, 15, 16652. [Google Scholar] [CrossRef]
  15. Ma, X.F.; Chen, J. Spatio-temporal evolution characteristics and mechanism of regional tourism urbanization and residents’ happiness level adaptability. Acta Geogr. Sin. 2024, 79, 1007–1026. [Google Scholar]
  16. Gao, N.; Ma, Y.F.; Li, T.S.; Bai, K. Study on the coordinative development between tourism industry and urbanization based on coupling model: A case study of Xi’an. Tour. Trib. 2013, 28, 62–68. [Google Scholar]
  17. Gao, W.Q.; Li, Y.Z. Research on coupling coordination degree between tourism industry and urbanization of Changshan Islands. Resour. Dev. Mark. 2016, 32, 96–98. [Google Scholar]
  18. Shen, W.; Huang, Z.; Yin, S.; Hsu, W.L. Temporal and Spatial Coupling Characteristics of Tourism and Urbanization with Mechanism of High-Quality Development in the Yangtze River Delta Urban Agglomeration, China. Appl. Sci. 2022, 12, 3403. [Google Scholar] [CrossRef]
  19. Al-Ajlani, H.; Van Ootegem, L.; Verhofstadt, E. What is Important for Well-Being? Soc. Indic. Res. 2019, 143, 955–972. [Google Scholar] [CrossRef]
  20. Gundimeda, H.; Atkinson, G. Measuring Global Human Progress: Are We on the Right Track? Annu. Rev. Environ. Resour. 2024, 49, 599–622. [Google Scholar] [CrossRef]
  21. Wang, Y.; Sun, J.; Liu, C.; Liu, L. Exploring the nexus between perceived ecosystem services and well-being of rural residents in a mountainous area, China. Appl. Geogr. 2024, 164, 103215. [Google Scholar] [CrossRef]
  22. Han, C.J.; Wang, G.G.; Yang, Y.P. An assessment of sustainable wellbeing and coordination of mountain areas: A case study of Qinba Mountain Area in China. Ecol. Indic. 2023, 154, 110674. [Google Scholar] [CrossRef]
  23. Larson, L.R.; Jennings, V.; Cloutier, S.A. Public Parks and Wellbeing in Urban Areas of the United States. PLoS ONE 2016, 11, e0153211. [Google Scholar] [CrossRef]
  24. Yee, S.H.; Elizabeth, P.; Buck, K.D. Downscaling a human well-being index for environmental management and environmental justice applications in Puerto Rico. Appl. Geogr. 2020, 123, 102231. [Google Scholar] [CrossRef] [PubMed]
  25. McKinnon, M.C.; Cheng, S.H.; Dupre, S.; Edmond, J.; Garside, R.; Glew, L.; Holland, M.B.; Levine, E.; Masuda, Y.J.; Miller, D.C.; et al. What are the effects of nature conservation on human well-being? A systematic map of empirical evidence from developing countries. Environ. Evid. 2016, 5, 8. [Google Scholar] [CrossRef]
  26. Mwongoso, A.J.; Sirima, A.; Mgonja, J.T. Impacts of Tourism Development on Residents’ Quality of Life: Efficacy of Community Capitals in Gateway Communities, Northern Tanzania. Appl. Res. Qual. Life 2023, 18, 2511–2539. [Google Scholar] [CrossRef]
  27. Li, J.; Gong, Y.; Jiang, C. Spatio-temporal differentiation and policy optimization of ecological well-being in the Yellow River Delta high-efficiency eco-economic zone. J. Clean. Prod. 2022, 339, 130717. [Google Scholar] [CrossRef]
  28. Ren, J.; Li, Y.; Zhang, J.; Zhao, L.; Guo, J.; Du, M.; Hao, C.; Hu, R. Analysis of coordinated development of “society-ecology-policy” and spatio-temporal variation of people’s livelihoods and well-being in the Yellow River basin, China. Ecol. Indic. 2023, 148, 110137. [Google Scholar] [CrossRef]
  29. Bornioli, A.; Vermeulen, S.J.; van Haaren, J.; Valente, R.; Mingardo, G. The Impacts of Tourism Stays on Residents’ Self-Reported Health: A Pan-European Analysis on the Role of Age and Urbanization Level. Sustainability 2022, 14, 1157. [Google Scholar] [CrossRef]
  30. Zeng, Z.; Wang, X. Effects of Domestic Tourism on Urban-Rural Income Inequality: Evidence from China. Sustainability 2021, 13, 9009. [Google Scholar] [CrossRef]
  31. Gan, C.; Voda, M.; Wang, K. Balancing efficiency and fairness: The role of tourism development in economic growth and urban–rural income gap. Sustain. Dev. 2024, 32, 5259–5273. [Google Scholar] [CrossRef]
  32. Zhou, C.; Tian, L.; Shan, Y. How Tourism Industry Development Affects Residents’ Well-Being: An Empirical Study Based on CGSS and Provincial-Level Matched Data. Sustainability 2022, 14, 12367. [Google Scholar] [CrossRef]
  33. Tang, L.N.; Yang, M.W.; Liu, Y.; Zhou, P.N. Classification, Evolution Trend, and Research Prospect of Rural Multifunction in Metropolitan Suburbs. Trop. Geogr. 2024, 44, 68–78. [Google Scholar]
  34. Zmyślony, P.; Kowalczyk, A.J.; Dembińska, M. Deconstructing the Overtourism-Related Social Conflicts. Sustainability 2020, 12, 1695. [Google Scholar] [CrossRef]
  35. Ma, M.; Tang, J. Nonlinear impact and spatial effect of tourism urbanization on human settlement environment: Evidence from the Yellow River Basin, China. J. Clean. Prod. 2023, 428, 139432. [Google Scholar] [CrossRef]
  36. Li, Z.Y.; Yang, M.Y.; Zhou, X.L.; Li, Z.G.; Li, H.D.; Zhai, F.F.; Zhang, Y.; Zhang, Y.X. Research on the spatial correlation and formation mechanism between traditional villages and rural tourism. Sci. Rep. 2023, 13, 8210. [Google Scholar] [CrossRef]
  37. Fu, H.; Wang, Y.; Mao, L.; Zhang, J.; Wu, Z. The spatial pattern and governance of Zhongyuan Urban-Rural System in its development trajectory. J. Geogr. Sci. 2022, 32, 1261–1280. [Google Scholar] [CrossRef]
  38. Yang, Z.; Cao, Y.; Du, J. The Impact of New Urbanization Construction on Sustainable Economic Growth of Resource-Based Cities. Environ. Sci. Pollut. R 2023, 30, 96860–96874. [Google Scholar] [CrossRef]
  39. National Bureau of Statistics of China. China Statistical Yearbook (2006–2023); China Statistics Press: Beijing, China.
  40. China Urban Statistical Yearbook. China Urban Statistical Yearbook (2006–2023); China Statistics Press: Beijing, China.
  41. Henan Provincial Bureau of Statistics. Henan Statistical Yearbook (2006–2023); China Statistics Press: Beijing, China.
  42. Shanxi Provincial Bureau of Statistics. Shanxi Statistical Yearbook (2006–2023); China Statistics Press: Beijing, China.
  43. Hebei Provincial Bureau of Statistics. Hebei Statistical Yearbook (2006–2023); China Statistics Press: Beijing, China.
  44. Shandong Provincial Bureau of Statistics. Shandong Statistical Yearbook (2006–2023); China Statistics Press: Beijing, China.
  45. Anhui Provincial Bureau of Statistics. Anhui Statistical Yearbook (2006–2023); China Statistics Press: Beijing, China.
  46. Luo, J.M.; Qiu, H.; Lam, C.F. Urbanization impacts on regional tourism development: A case study in China. Curr. Issues. Tour. 2015, 19, 282–295. [Google Scholar] [CrossRef]
  47. Alderwick, H.; Hutchings, A.; Briggs, A.; Mays, N. The impacts of collaboration between local health care and non-health care organizations and factors shaping how they work: A systematic review of reviews. BMC Public Health 2021, 21, 753. [Google Scholar] [CrossRef]
  48. Song, W.; Kim, B. Culture and Art Education to Promote Cultural Welfare in Civil Society. Soc. Sci. 2019, 8, 322. [Google Scholar] [CrossRef]
  49. Zhao, G.; Zheng, X.; Yuan, Z.; Zhang, L. Spatial and Temporal Characteristics of Road Networks and Urban Expansion. Land 2017, 6, 30. [Google Scholar] [CrossRef]
  50. Salgado, M.; Madureira, J.; Mendes, A.S.; Torres, A.; Teixeira, J.P.; Oliveira, M.D. Environmental determinants of population health in urban settings. A systematic review. BMC Public Health 2020, 20, 853. [Google Scholar] [CrossRef]
  51. Kesari, K.K.; Soni, R.; Jamal, Q.M.S.; Tripathi, P.; Lal, J.A.; Jha, N.K.; Siddiqui, M.H.; Kumar, P.; Tripathi, V.; Ruokolainen, J. Wastewater Treatment and Reuse: A Review of its Applications and Health Implications. Water Air Soil. Poll. 2021, 232, 208. [Google Scholar] [CrossRef]
  52. Yuan, D.; Jang, G. Coupling Coordination Relationship between Tourism Industry and Ecological Civilization: A Case Study of Guangdong Province in China. Sustainability 2023, 15, 92. [Google Scholar] [CrossRef]
  53. Li, J.; Tang, H.; Kuang, F. Spatial-temporal coupling analysis of ecosystem service and well-being of farmers and herdsmen: A case study of Qilian Mountain National Park. Acta Ecol. Sin. 2024, 44, 6527–6539. [Google Scholar]
  54. Qiu, J.; Liu, Y.; Chen, J. Spatial structure and driving pathways of the coupling between ecosystem services and human well-beings: A case study of Guangzhou. J. Nat. Res. 2023, 38, 760–778. [Google Scholar]
  55. Breiman, L. Random forests. Mach. Learn. 2001, 45, 5–32. [Google Scholar] [CrossRef]
  56. Sikorska, D.; Łaszkiewicz, E.; Krauze, K.; Sikorski, P. The role of informal green spaces in reducing inequalities in urban green space availability to children and seniors. Environ. Sci. Policy 2020, 108, 144–154. [Google Scholar] [CrossRef]
  57. Ma, X.F.; Hu, S.L. Coordinated development and evolution of natural resource-driven tourism urbanization and residents’ happiness: Take Zhangjiajie as an example. J. Nat. Resour. 2023, 38, 442–459. [Google Scholar] [CrossRef]
  58. Wang, J.C.; Qu, M.; Xu, T.P.; Choi, S. The dynamic nexus between economic growth, renewable energy use, urbanization, industrialization, tourism, green supply chain management, and CO2. Heliyon 2024, 10, e38061. [Google Scholar] [CrossRef] [PubMed]
  59. Weng, G.M.; Tang, Y.B.; Song, N.; Li, J.P. Research on Tourism Urbanization and Influencing Factors of Beijing-Tianjin-Hebei Urban Agglomeration. Geogr. Geo-Inf. Sci. 2022, 38, 121–128. [Google Scholar]
  60. Wang, S.Y.; Luo, Y.T.; Han, Y.J.; Li, J. Evolution of Regional Disparities in Human Well-being in China and Its Influencing Factors: An Analysis Based on the Human Development Index (HDI). Prog. Geogr. 2018, 37, 1150–1158. [Google Scholar]
  61. Gössling, S.; Scott, D.; Hall, C.M. Pandemics, tourism and global change: A rapid assessment of COVID-19. J. Sustain. Tour. 2020, 29, 1–20. [Google Scholar] [CrossRef]
  62. Ma, X.F.; Chen, J. Research on the influence mechanism of tourism urbanization on residents’ happiness level. J. Nat. Sci. Hunan Norm. Univ. 2023, 46, 52–61. [Google Scholar]
  63. Yeh, S.-S. Tourism recovery strategy against COVID-19 pandemic. Tour. Econ. 2020, 26, 188–194. [Google Scholar] [CrossRef]
  64. Xie, X.; Sun, H.; Gao, J.; Chen, F.; Zhou, C. Spatiotemporal Differentiation of Coupling and Coordination Relationship of Tourism–Urbanization–Ecological Environment System in China’s Major Tourist Cities. Sustainability 2021, 13, 5867. [Google Scholar] [CrossRef]
Figure 1. General map of the study area.
Sustainability 17 04351 g001
Figure 2. Time series variation in the level of tourism-oriented urbanization in the Central Plains Urban Agglomeration.
Sustainability 17 04351 g002
Figure 3. Spatial variation in the tourism urbanization level in the Central Plains Urban Agglomeration.
Sustainability 17 04351 g003
Figure 4. Time series variation in the well-being levels of residents in the Central Plains Urban Agglomeration.
Sustainability 17 04351 g004
Figure 5. Spatial variation in residents’ well-being levels in the Central Plains Urban Agglomeration.
Sustainability 17 04351 g005
Figure 6. Spatial variation in the coupling coordination degree between tourism urbanization and residents’ well-being in the Central Plains Urban Agglomeration.
Sustainability 17 04351 g006
Figure 7. Factors influencing the degree of coupling coordination between tourism urbanization and residents’ well-being in the Central Plains Urban Agglomeration (NDVI: normalized difference vegetation index; PD: population density; DCC: distance from the capital city; PS: policy support; PCR: per capita road area; RER: revenue and expenditure ratio; DEM: digital elevation model; TR: number of tourists received).
Sustainability 17 04351 g007
Table 1. Construction of an indicator system for measuring residents’ well-being in the Central Plains Urban Agglomeration.
DimensionsIndicatorsUnitsWeight
Entropy Weight MethodAHPWeighted Average
Economic Well-beingGDP per capita10,000 yuan0.0800.1070.093
GDP density10,000 yuan/km20.1460.0910.119
Ratio of per capita disposable income between urban and rural residentsnondimensionalization0.0820.0900.086
Health Well-beingNumber of medical beds per 10,000 peopleunits0.0620.0780.070
Number of health technical personnel per 10,000 peopleunits0.0600.0740.067
Proportion of public health expenditure to public budget expenditure%0.0530.0710.062
Social Well-beingNumber of primary and secondary schools per 10,000 peopleunits0.0680.0690.068
Public library collection size 10,000 units0.0760.0650.070
Number of public libraries per 10,000 peopleunits0.0910.0640.078
Safety Well-beingGrain yield per unit areat/km20.0590.0570.058
Water supply coverage rate%0.0620.0620.062
Highway network densitykm/km20.0580.0520.055
Environmental Well-beingPer capita park green spacem20.0310.0420.036
Domestic sewage treatment rate%0.0500.0380.044
Domestic waste treatment rate%0.0220.0410.031
Table 2. Standard for classifying the degree of coupling coordination.
NumberIntervalLevel
1[0, 0.20]High dysregulation
2(0.20, 0.40]Moderate dysregulation
3(0.40, 0.50]Antagonism
4(0.50, 0.70]Running-in
5(0.70, 1]Highly coordinated
Table 3. Influencing factor indicators.
DimensionIndicatorMeasurement
NaturalElevationDigital elevation model (DEM)
Vegetation indexNormalized difference vegetation index (NDVI)
SocietyPopulation densityArea of the region/Total resident population of the region
Distance to the nearest provincial capital cityStraight-line distance from the centre of the study area to the nearest provincial capital city centre
Per capita road area in the cityTotal urban road area/Total resident population
IndustryVisitor countTotal number of tourists received annually, including domestic and inbound tourists
RegimeFiscal revenue and expenditure ratioGeneral public budget expenditure/General public budget revenue
Policy supportProportion of words related to “tourism” and “well-being” in the national economic and social development plan text
Disclaimer/Publisher’s Note: The statements, opinions and data contained in all publications are solely those of the individual author(s) and contributor(s) and not of MDPI and/or the editor(s). MDPI and/or the editor(s) disclaim responsibility for any injury to people or property resulting from any ideas, methods, instructions or products referred to in the content.

