Article

Rainfall-Induced Geological Hazard Susceptibility Assessment in the Henan Section of the Yellow River Basin: Multi-Model Approaches Supporting Disaster Mitigation and Sustainable Development

School of Resources and Earth Sciences, China University of Mining and Technology, Xuzhou 221116, China
*
Author to whom correspondence should be addressed.
Sustainability 2025, 17(10), 4348; https://doi.org/10.3390/su17104348
Submission received: 15 April 2025 / Revised: 9 May 2025 / Accepted: 9 May 2025 / Published: 11 May 2025
(This article belongs to the Special Issue Sustainability in Natural Hazards Mitigation and Landslide Research)

Abstract

:
The Henan section of the Yellow River Basin (3.62 × 10⁴ km2, 21.7% of Henan Province), a vital agro-industrial and politico-economic hub, faces frequent rainfall-induced geohazards. The 2021 “7·20” Zhengzhou disaster, causing 398 fatalities and CNY 120.06 billion loss, highlights its vulnerability to extreme weather. While machine learning (ML) aids geohazard assessment, rainfall-induced geological hazard susceptibility assessment (RGHSA) remains understudied, with single ML models lacking interpretability and precision for complex disaster data. This study presents a hybrid framework (IVM-ML) that integrates the Information Value Model (IVM) and ML. The framework uses historical disaster data and 11 factors (e.g., rainfall erosivity, relief amplitude) to calculate information values and construct a machine learning prediction model with these quantitative results. By combining IVM’s spatial analysis with ML’s predictive power, it addresses the limitations of conventional single models. ROC curve validation shows the Random Forest (RF) model in IVM-ML achieves the highest accuracy (AUC = 0.9599), outperforming standalone IVM (AUC = 0.7624). All models exhibit AUC values exceeding 0.75, demonstrating strong capability in capturing rainfall–hazard relationships and reliable predictive performance. Findings support RGHSA practices in the mid-Yellow River urban cluster, offering insights for sustainable risk management, land-use planning, and climate resilience. Bridging geoscience and data-driven methods, this study advances global sustainability goals for disaster reduction and environmental security in vulnerable riverine regions.

1. Introduction

Rainfall-induced geological hazards (RGHs), including landslides, debris flows, and collapses, are closely associated with intense precipitation, soil properties, topographic features, and anthropogenic activities. Featuring wide-ranging impacts and substantial destructive power, these hazards pose serious threats to local economic development, ecological environments, and the safety of human lives and property. They directly challenge the realization of the United Nations Sustainable Development Goals (SDGs), particularly “Sustainable Cities and Communities (SDG 11)” and “Climate Action (SDG 13)”. The Henan section of the Yellow River Basin (HNYR) is located in the middle and lower reaches of the Yellow River. The middle reach, extending from Sanmenxia to Huayuankou, is dominated by mid-low mountainous terrain and piedmont alluvial fans. Valleys and secondary tributaries discharging into the main Yellow River channel are in the vigorous erosion phase of their youthful geomorphic development, making this region a hotbed for RGH occurrences. The lower reach from Huayuankou to the Yellow River’s exit in Henan forms a suspended river over an alluvial plain. Historically, frequent channel diversions of the Yellow River in this section have created the “Yellow River Flood-Prone Zone”, which is highly vulnerable to flood inundation. These unique geo-hydrological conditions not only escalate disaster risks but also exert persistent pressures on ecosystem services and sustainable land use within the basin. To effectively prevent and mitigate the impacts of such hazards, the development of scientific hazard susceptibility models is of critical importance. These models must integrate natural geographic parameters and anthropogenic influences, while incorporating indicators for ecological resilience assessment—such as vegetation coverage and soil-water conservation capacity—and risk management strategies aligned with Sustainable Development Goals. According to the 2023 Statistical Bulletin on Natural Resources of Henan Province [1], both the frequency of geological disasters and associated direct economic losses in the province exhibited a significant upward trend from 2019 to 2023, with a particularly sharp increase observed in 2021. This surge was closely linked to multiple intense rainfall events that year, underscoring the pivotal role of heavy precipitation in triggering geological disasters in Henan and highlighting the urgency of enhancing regional disaster adaptation capacities amid climate change. Moreover, the 2024 Geological Hazard Risk Points Report of Henan Province [2] indicates that seven cities in HNYR, including Zhengzhou, are listed as municipalities and counties prone to geological disasters. This further emphasizes the necessity of conducting in-depth research on the susceptibility to RGH in HNYR.
Currently, with global climate change and the intensification of human activities, the frequency and impact of landslides and other geological disasters are continually expanding. Rainfall-induced hazards are becoming increasingly severe, posing a serious threat to human life and property [3]. Research on geological disasters both domestically and internationally is extensive, covering aspects such as the causes, monitoring, and risk assessment of these disasters. Various mathematical models and methods have been applied to assess geological hazard susceptibility, such as the Information Value Model (IVM), Deterministic Coefficient Method, Logistic Regression (LR), Analytic Hierarchy Process (AHP), Weight of Evidence (WoE), machine learning (ML) algorithms, and model coupling. IVM is an information-theory-based statistical forecasting method that is often used in conjunction with other models, such as coupling IVM with Logistic Regression models [4,5]. The accuracy (AUC value) of the susceptibility evaluation for landslide in Sichuan Province, China, using the coupling of IVM and SVM even reached 0.997 [6]. AHP, as a classical multi-criteria decision-making method, has been widely applied in geological hazard susceptibility assessments. For example, Guillen et al. [7] used AHP to assess landslide susceptibility in the Sierra-Costa region in southwestern Michoacán, Mexico. AHP is often coupled with other models to reduce the subjectivity of the method, such as fuzzy AHP [8] and the combination of AHP with the Flow-R model [9]. WoE is a statistical method that assesses hazard susceptibility by calculating the correlation between factors and the occurrence of disasters. It has been effectively applied in areas such as Cao Bang, Vietnam [9] and the Ili Valley, Xinjiang [10]. LR, as a classic statistical method, is also widely used in hazard susceptibility evaluation [9,11]. ReliefF [12] is a feature selection algorithm that evaluates feature weights by calculating distance differences between features and same-class/different-class samples. It applies to multi-class and imbalanced data and is widely used in fields like landslide susceptibility assessment. ML, due to its ability to handle large-scale, high-dimensional data and capture non-linear and complex relationships, has been widely applied in hazard susceptibility assessments. Commonly used ML algorithms include Support Vector Machines (SVMs) [13,14], Artificial Neural Networks (ANNs) [11,15,16], Gradient Boosting Decision Trees (GBDTs) [17,18], Extreme Gradient Boosting Decision Trees (XGBoosts) [19,20], and Random Forests (RFs) [21,22,23,24,25].
Existing research on the susceptibility of “geological hazard” and “rainfall-induced hazard” is mainly divided into assessments of landslide susceptibility and flood hazard susceptibility. For example, in the area of geological disasters, Fan et al. [4] used GIS raster data models, IVM, LR, and a coupling analysis of both models to evaluate geological hazard susceptibility. Their results showed that the coupled model produced more reasonable and precise results compared to the individual models of IVM or LR. However, Jin et al. [5] conducted a geological hazard susceptibility evaluation in Yuyang District, Shiyan City, Hubei Province, where they combined IVM and LR and compared the results with those using only IVM. The findings showed that the difference in evaluation accuracy between IVM and the combined IVM + Logistic Regression models was not significant, and after comprehensive comparison, IVM was selected as the final model. Researchers pointed out that in geological hazard evaluations, the choice of mathematical model does not necessarily require multiple model overlays, but should be based on the specific needs of the project to select the most suitable evaluation model. However, in the results of this study, the accuracy of the coupled model was higher. In flood hazards, studies have been conducted to evaluate flood susceptibility in the Nam Ngum River Basin of the Lao People’s Democratic Republic, generating flood susceptibility maps [16]. Another study evaluated flood susceptibility in two basins in Jordan using three ML algorithms (RF, SVM, and ANN), testing the performance of these algorithms.
The above content represents only a small portion of the research on geological hazard and flood susceptibility evaluations. In fact, research on both is extensive. Rainfall is often the direct trigger of geological disasters, but there has been limited research on the susceptibility of RGH. For instance, Huang et al. [26] developed a geological disaster development intensity index and a rainfall intensity index to build a susceptibility evaluation model for RGH, using ArcGIS to analyze the susceptibility zoning map for Fujian Province, consistent with empirical results. Wang et al. [27] designed a susceptibility evaluation model for RGH based on geological environment indices and rainfall indices, resulting in evaluation data and four warning levels. Zhou et al. [28] used the erosion cycle theory and super-entropy model to evaluate RGH susceptibility zoning in Henan Province, with results highly consistent with the spatial distribution of geological disasters. Sérgio C. Oliveira et al. [29] discussed the uncertainty of rainfall-triggered event-type landslides, providing a new perspective for regional landslide susceptibility assessments. Although some studies have been conducted on RGH susceptibility, these studies are limited by regional scope (mainly focused on local areas, with insufficient widespread coverage) or the applicability of models (scientific rigor, accuracy, and adaptability to complex environments).
RGHs are particularly prominent in HNYR, where geological conditions are complex, rainfall is frequent, and geological disasters occur frequently. Although there is extensive research on geological and flood disasters, and various mathematical models and methods have been applied to their susceptibility evaluations, research on the susceptibility of “RGHs” remains scarce, and existing studies still have limitations. These studies are mostly concentrated in local areas, with a lack of broad geographical coverage. The scientific rigor, accuracy, and adaptability of model construction to complex geological conditions are also insufficient. This study aims to conduct an in-depth investigation into the susceptibility of RGH in HNYR using a multi-model assessment approach. First, multi-source data from the region, including meteorological, geological, topographic, and land use factors, will be collected. Then, various models will be used to evaluate hazard susceptibility, comparing the applicability and predictive accuracy of different models. Through model fusion, this study aims to explore novel approaches for RGHSA that are oriented toward sustainable development. By doing so, it seeks to enhance the accuracy and applicability of assessments while balancing ecological conservation and sustainable development goals, thereby providing a scientific basis for establishing a scientifically sound and resilient hazard prevention and mitigation system in the region.

2. Study Area and Data Sources

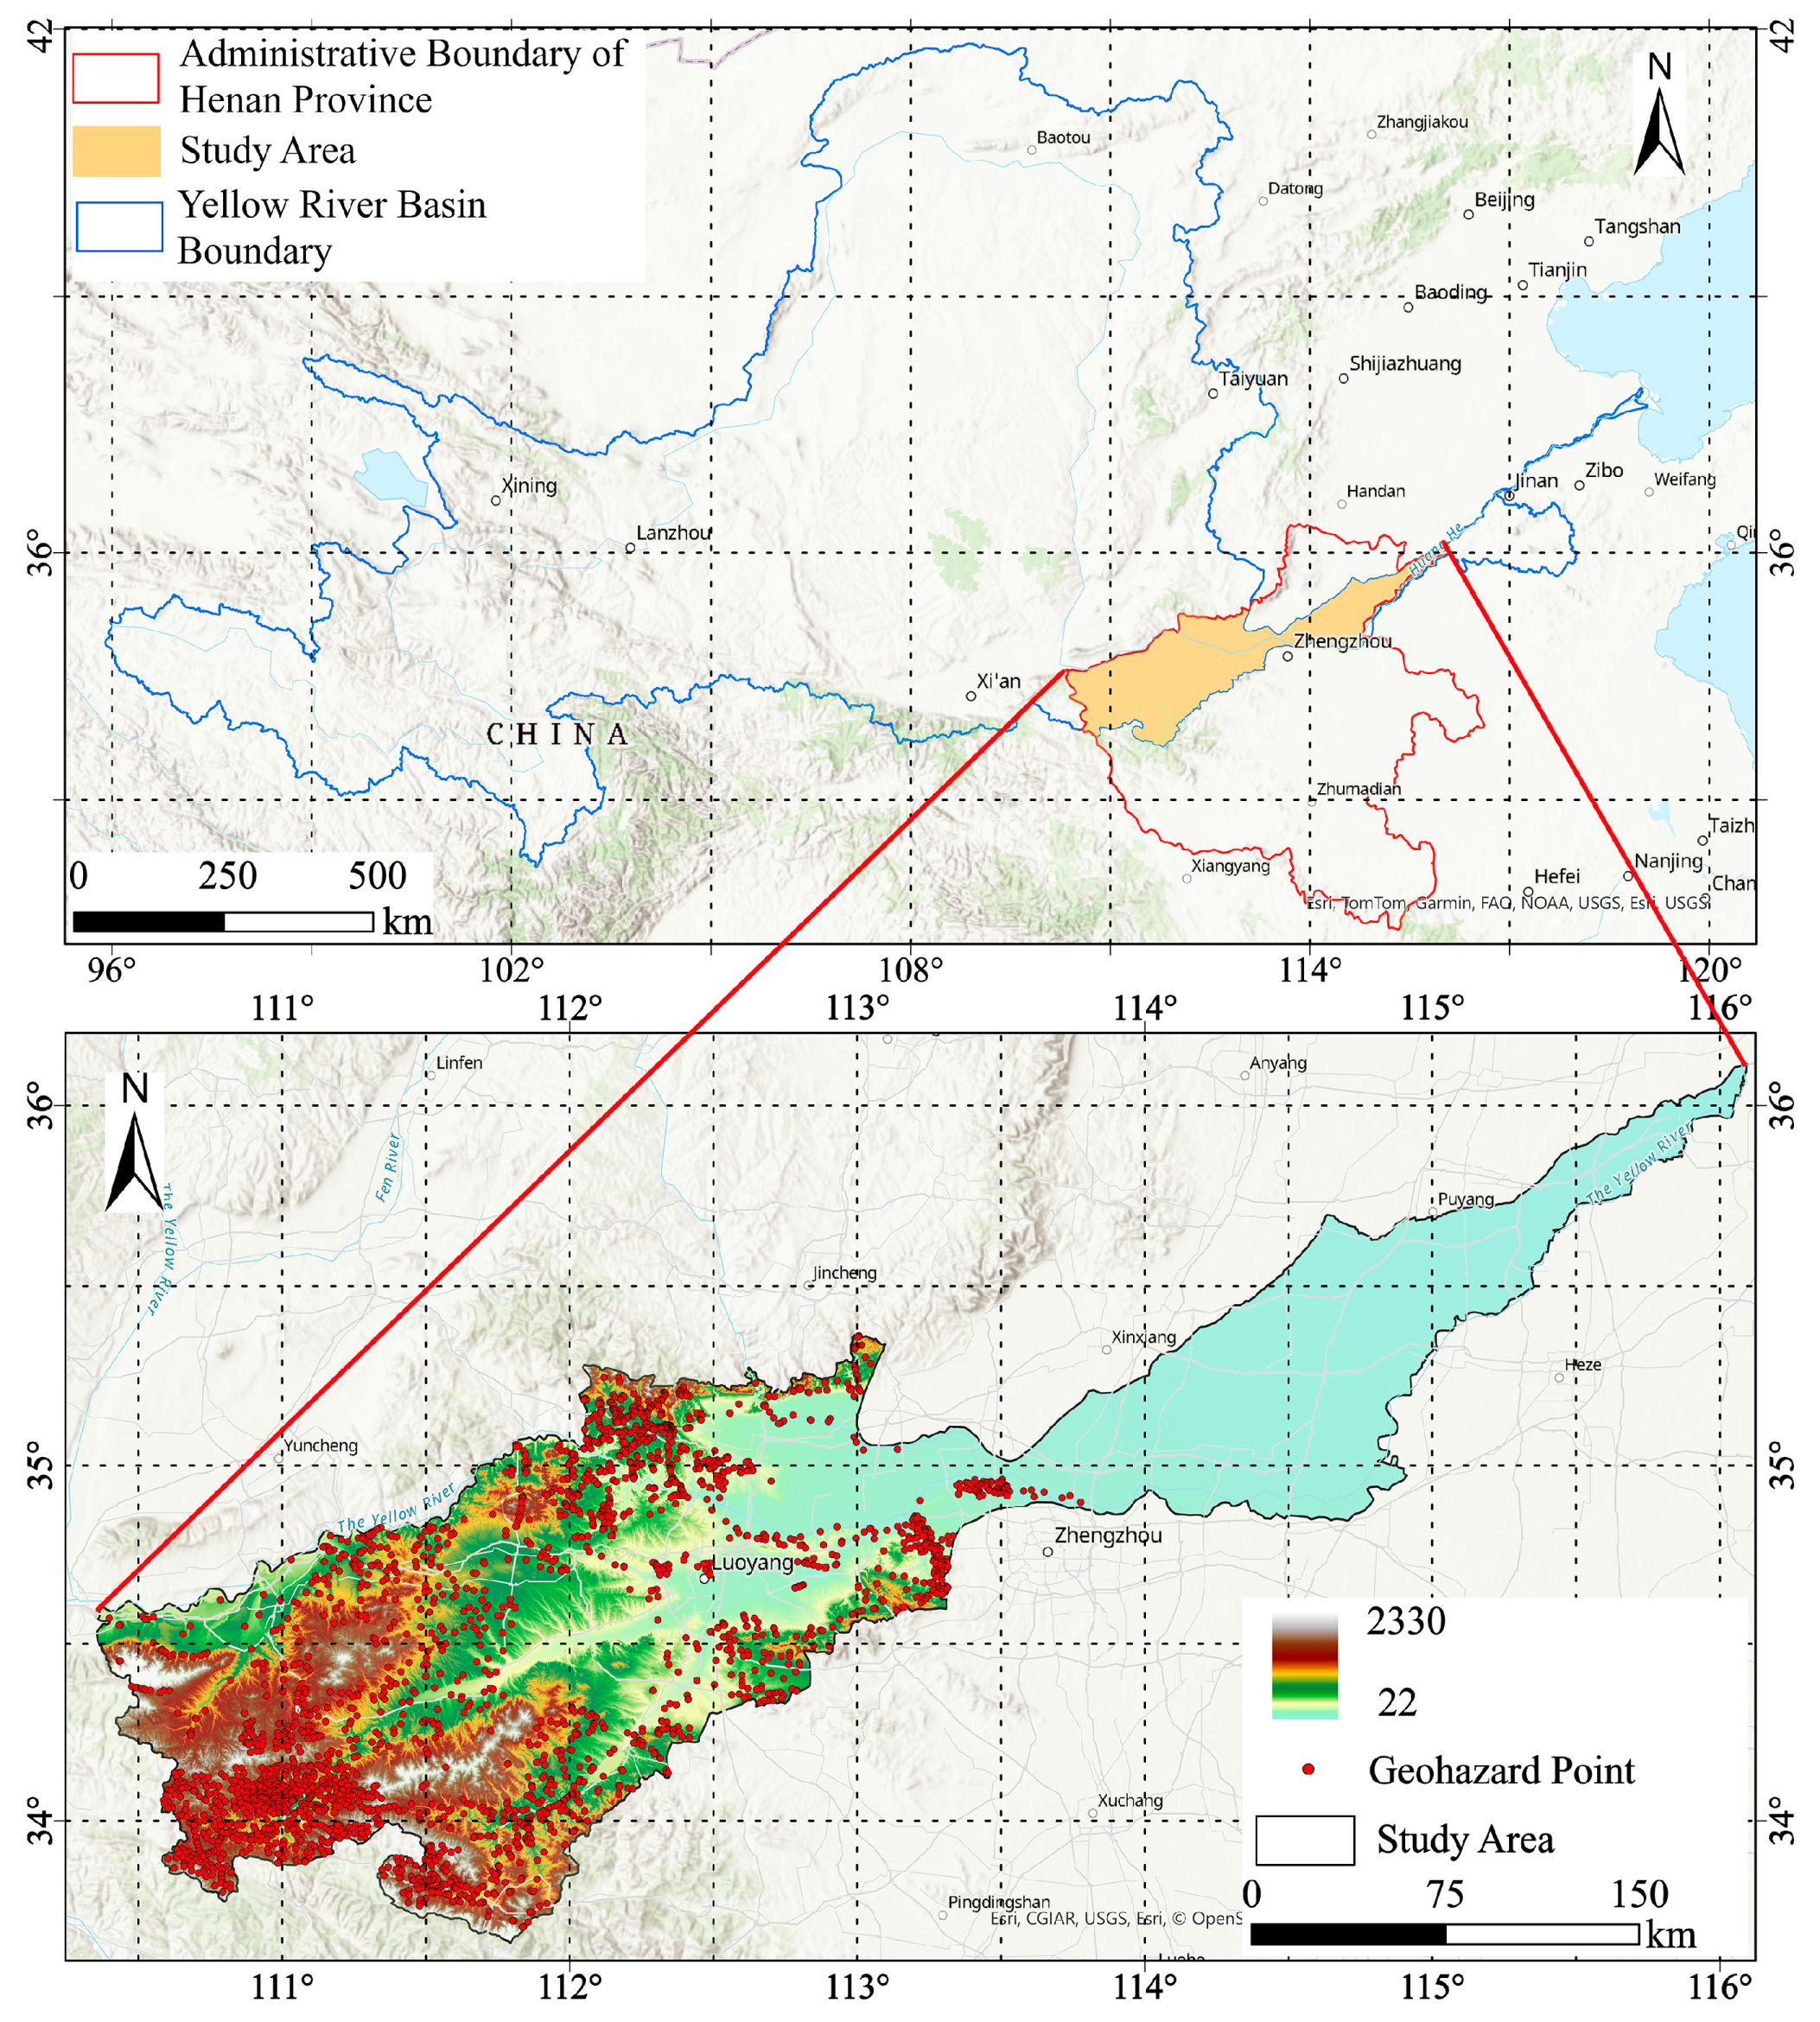
2.1. Study Area Overview

HNYR is located in central China, covering the northern and central parts of Henan Province. Its geographical coordinates range from 33°41′ to 36°6′ N latitude and 110°21′ to 116°6′ E longitude. This area spans east to west and includes nine cities: Sanmenxia, Luoyang, Jiyuan, Jiaozuo, Zhengzhou, Xinxiang, Anyang, Puyang, and Kaifeng, along with 28 counties (districts). The total area is approximately 36,200 km2 [30], accounting for about 21.7% of Henan Province’s total area and about 5.1% of the total area of the Yellow River Basin. The geographical location of the study area is shown in Figure 1. HNYR is an important part of the Yellow River Basin urban agglomeration, which has been included in China’s national key development policies, such as the “Western Development Strategy” and the “Belt and Road Initiative” [31]. The significance of the study area is therefore evident.
In terms of climate, the region is influenced by the monsoon, with an average annual temperature ranging from 12 °C to 16 °C and annual precipitation between 500 mm and 900 mm, primarily concentrated in the summer. This pattern increases rainfall-induced erosion risks, making soil prone to degradation and geological hazards—processes that undermine ecosystem resilience and sustainable land management (SDG 15, 13). Consequences include soil resource loss, fertility decline, and reservoir siltation, alongside infrastructure damage and ecological hazards. The average natural runoff of about 50 billion m3 supports agricultural irrigation and urban water supply, but also heightens hazard susceptibility, underscoring the need for integrated water-risk management in sustainable development. From a topographical perspective, the study area as a whole exhibits a west-high and east-low configuration—with the elevation of Lingbao City in the west reaching nearly 1500 m, forming a striking contrast to the minimum elevation of 34 m in the eastern plains—thereby giving rise to a complex landscape featuring coexisting mountains, hills, and plains. Diverse soil types (brown, loess, saline-alkali) amplify landslide/debris flow risks, especially post-rainfall, challenging sustainable urban planning (SDG 11). Socioeconomically, HNYR encompasses Henan’s most developed areas, with wheat/maize/cotton agriculture, growing industry, and improving transport. Its population of 38.2 million (59% urban) reflects trends requiring climate-resilient infrastructure (SDG 11) amid rapid urbanization.
However, intensifying rainfall extremes exacerbate soil erosion and geological hazard threats, undermining progress toward multiple sustainability goals. Studying RGH susceptibility is thus critical for strategies that balance disaster mitigation with ecological protection and resilient development, aligning with regional sustainable growth objectives.

2.2. Data Used

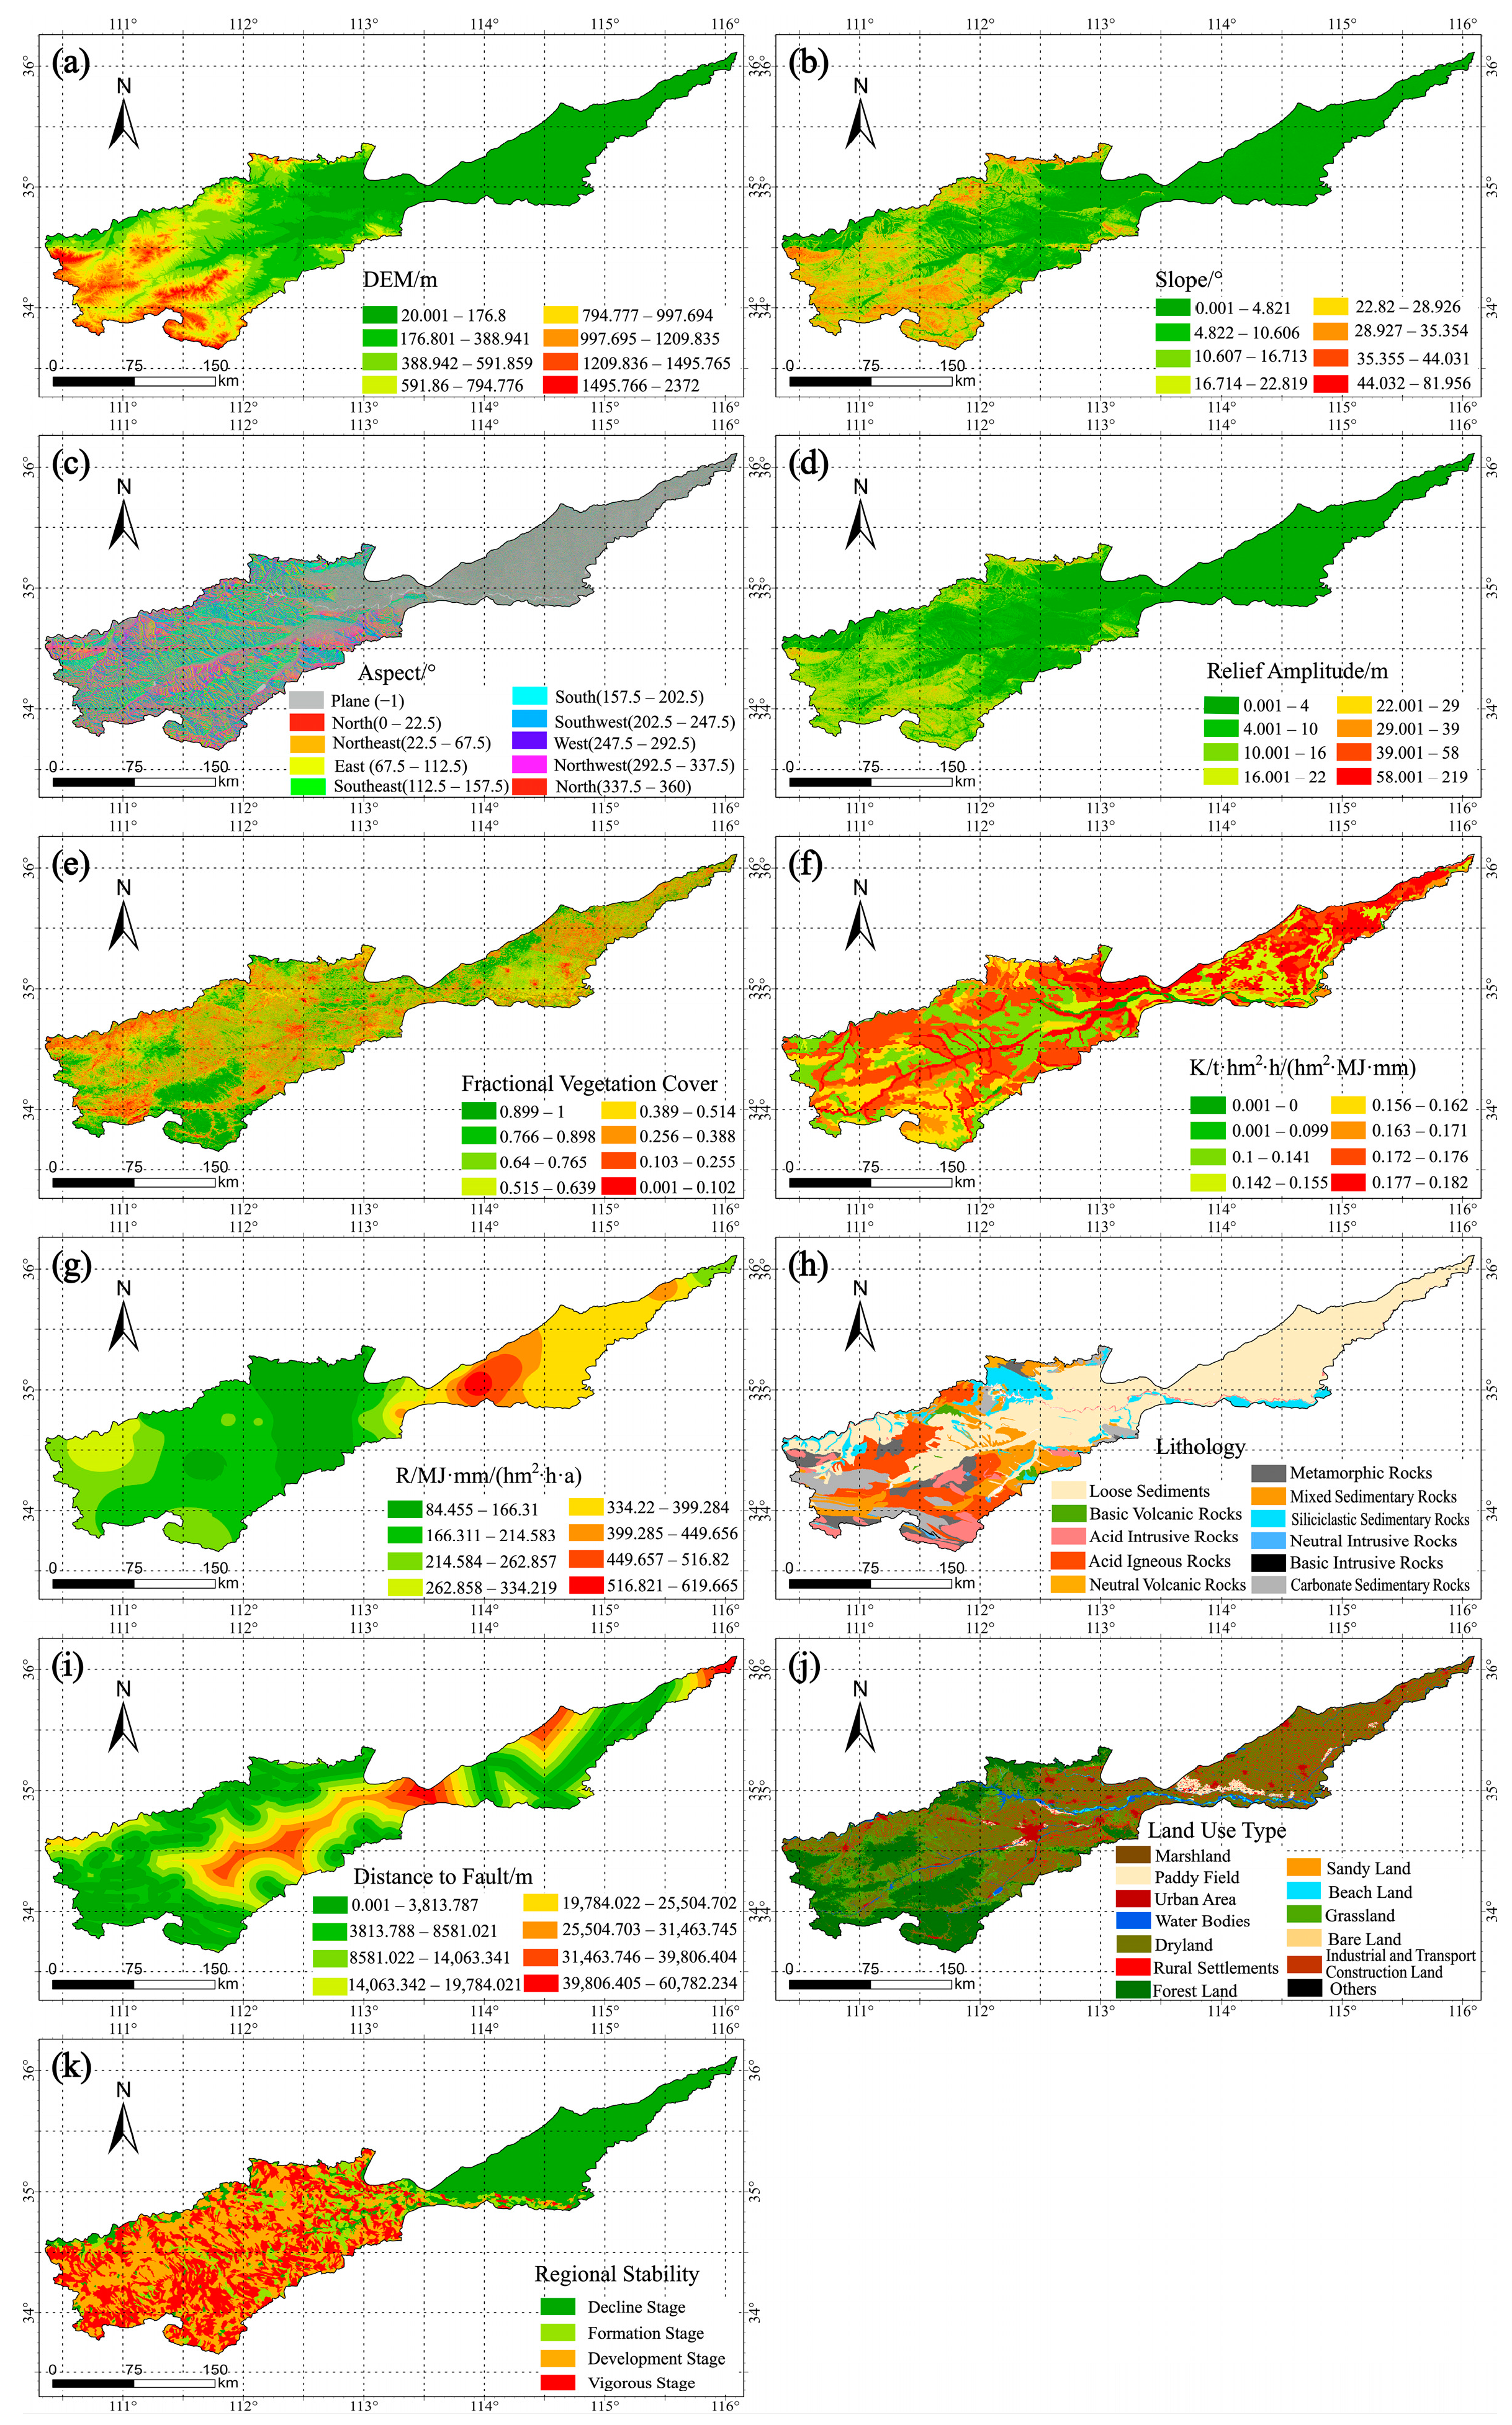
2.2.1. Selection of Evaluation Factors

In the construction of the RGHSA system, the rational selection of evaluation factors is a critical component determining the model’s prediction accuracy. This study establishes a screening framework for evaluation factors from three dimensions—“mechanism-driven relevance”, “regional adaptability”, and “data availability”—ultimately defining a core indicator system comprising five key components: topographic characteristics, soil anti-erosion capacity, watershed system stability, geological conditions, and impacts of human activities.
First, we will discuss the spatial pattern response of topographic factors: the study area’s unique “west-high and east-low” topographic gradient leads to a significant mountain-hilly aggregation pattern of disaster points. Through analysis of the RGH spatial distribution model, four topographic indices—elevation, slope, aspect, and relief amplitude—are selected to construct a multi-dimensional topographic factor evaluation system. These parameters not only reflect geomorphic morphological features but also directly correlate with surface runoff scouring energy and material transport pathways, serving as key spatial disaster-inducing factors revealing disaster genesis.
Second, there is the hydrodynamic mechanism of soil anti-erosion capacity: aimed at the temporal distribution characteristic of RGH frequently occurring during the flood season, a three-element index system comprising vegetation fractional coverage (FVC), soil erodibility (K value), and rainfall erosivity (R value) is established to quantify soil resistance to rainfall erosion. FVC represents the protective efficacy of vegetation on the ground surface, reducing erosion risks through multiple mechanisms such as slowing runoff velocity, enhancing soil infiltration, and stabilizing surface particles; the K value reflects the intrinsic anti-erosion properties of soil, with higher values indicating greater susceptibility to water erosion and corresponding higher erosion intensity; the R value quantifies the erosion potential of precipitation, directly influencing the risk of surface soil scouring and thus affecting RGH occurrence risk.
Third, there is the dynamical analysis of watershed system stability: secondary natural disasters such as collapses, landslides, and debris flows triggered by regional heavy rainfall are associated with the distribution of topography and geomorphology, while geomorphic evolution is influenced by both internal and external geological forces. The interaction between these two forces determines the stability of the watershed system. Based on the erosion cycle theory and the super-entropy model for watershed stability assessment, this study classifies regional stability into four evolutionary stages—formation stage, decline stage, development stage, and vigorous stage—and constructs an evaluation framework for watershed stability.
Fourth, we will discuss the geological conditions: among geological environmental factors, lithological characteristics determine the anti-erosion strength and structural stability of rock and soil masses, while the distance to faults reflects the impact of tectonic activities on stratum integrity. Together, these form the basic indicators for geological disaster risk assessment.
Fifth, impacts of human activities: As a core economic zone in Henan Province, the study area’s high-intensity human activities alter surface cover conditions and microtopographic characteristics through land use types, thereby influencing soil anti-erosion performance and runoff scouring intensity, forming a “human activities–surface processes–disaster risk” chain-type action mechanism.

2.2.2. Grading of Evaluation Factors

Factor classification serves as a prerequisite for calculating information quantity, and appropriate classification can enhance the accuracy of susceptibility assessment. Too few classification levels may overlook the details of factor variations, while an excessive number of levels can lead to sparse data distribution and weaken the stability of statistical results. Through comparing the AUC values of ROC curves for susceptibility results derived from evaluation factors under different classification numbers (4–20), Guo et al. [32] discovered that when the number of classification levels is 8, evaluation factors exhibit a strong correlation with disaster points, and the AUC value approaches its peak, further increasing the classification number results in minimal variation in the AUC value. Given the study area’s large spatial extent and complex environmental factors, insufficient classification levels are inadequate to reflect micro-scale differences, whereas overly fine classification is prone to the impact of data sparsity. In line with Guo et al.’s findings, this study classifies seven continuous variable factors—including DEM and slope—into 8 levels to ensure a high AUC value and eliminate the possibility of prediction accuracy degradation caused by sparse data from excessive classification. Discrete evaluation factors such as land use types and lithology are classified according to their inherent categories. The specific classification intervals are shown in Figure 2.

2.3. Data Sources

The 12.5 m resolution DEM data were sourced from the United States Geological Survey (USGS). Remote sensing data, including Landsat 8 OLI imagery, were also provided by the USGS. The rainfall data were derived from the Yuliang 365 Platform under Xiangyun Meteorology (https://www.weather.com.cn/). Soil type data came from the 1:4,000,000 China Soil Map (2000) [33], and soil texture data with attributes such as organic matter content were sourced from the HWSD Soil Database, provided by the National Glacier, Frozen Soil, and Desert Science Data Center (http://www.crensed.ac.cn/). Land use data and historical geological disaster data used in this study were from the Resource and Environmental Science Data Center of the Chinese Academy of Sciences (https://www.resdc.cn/). Basic geographic vector data were provided by the National Geographic Information Resources Directory Service System (https://www.webmap.cn/).

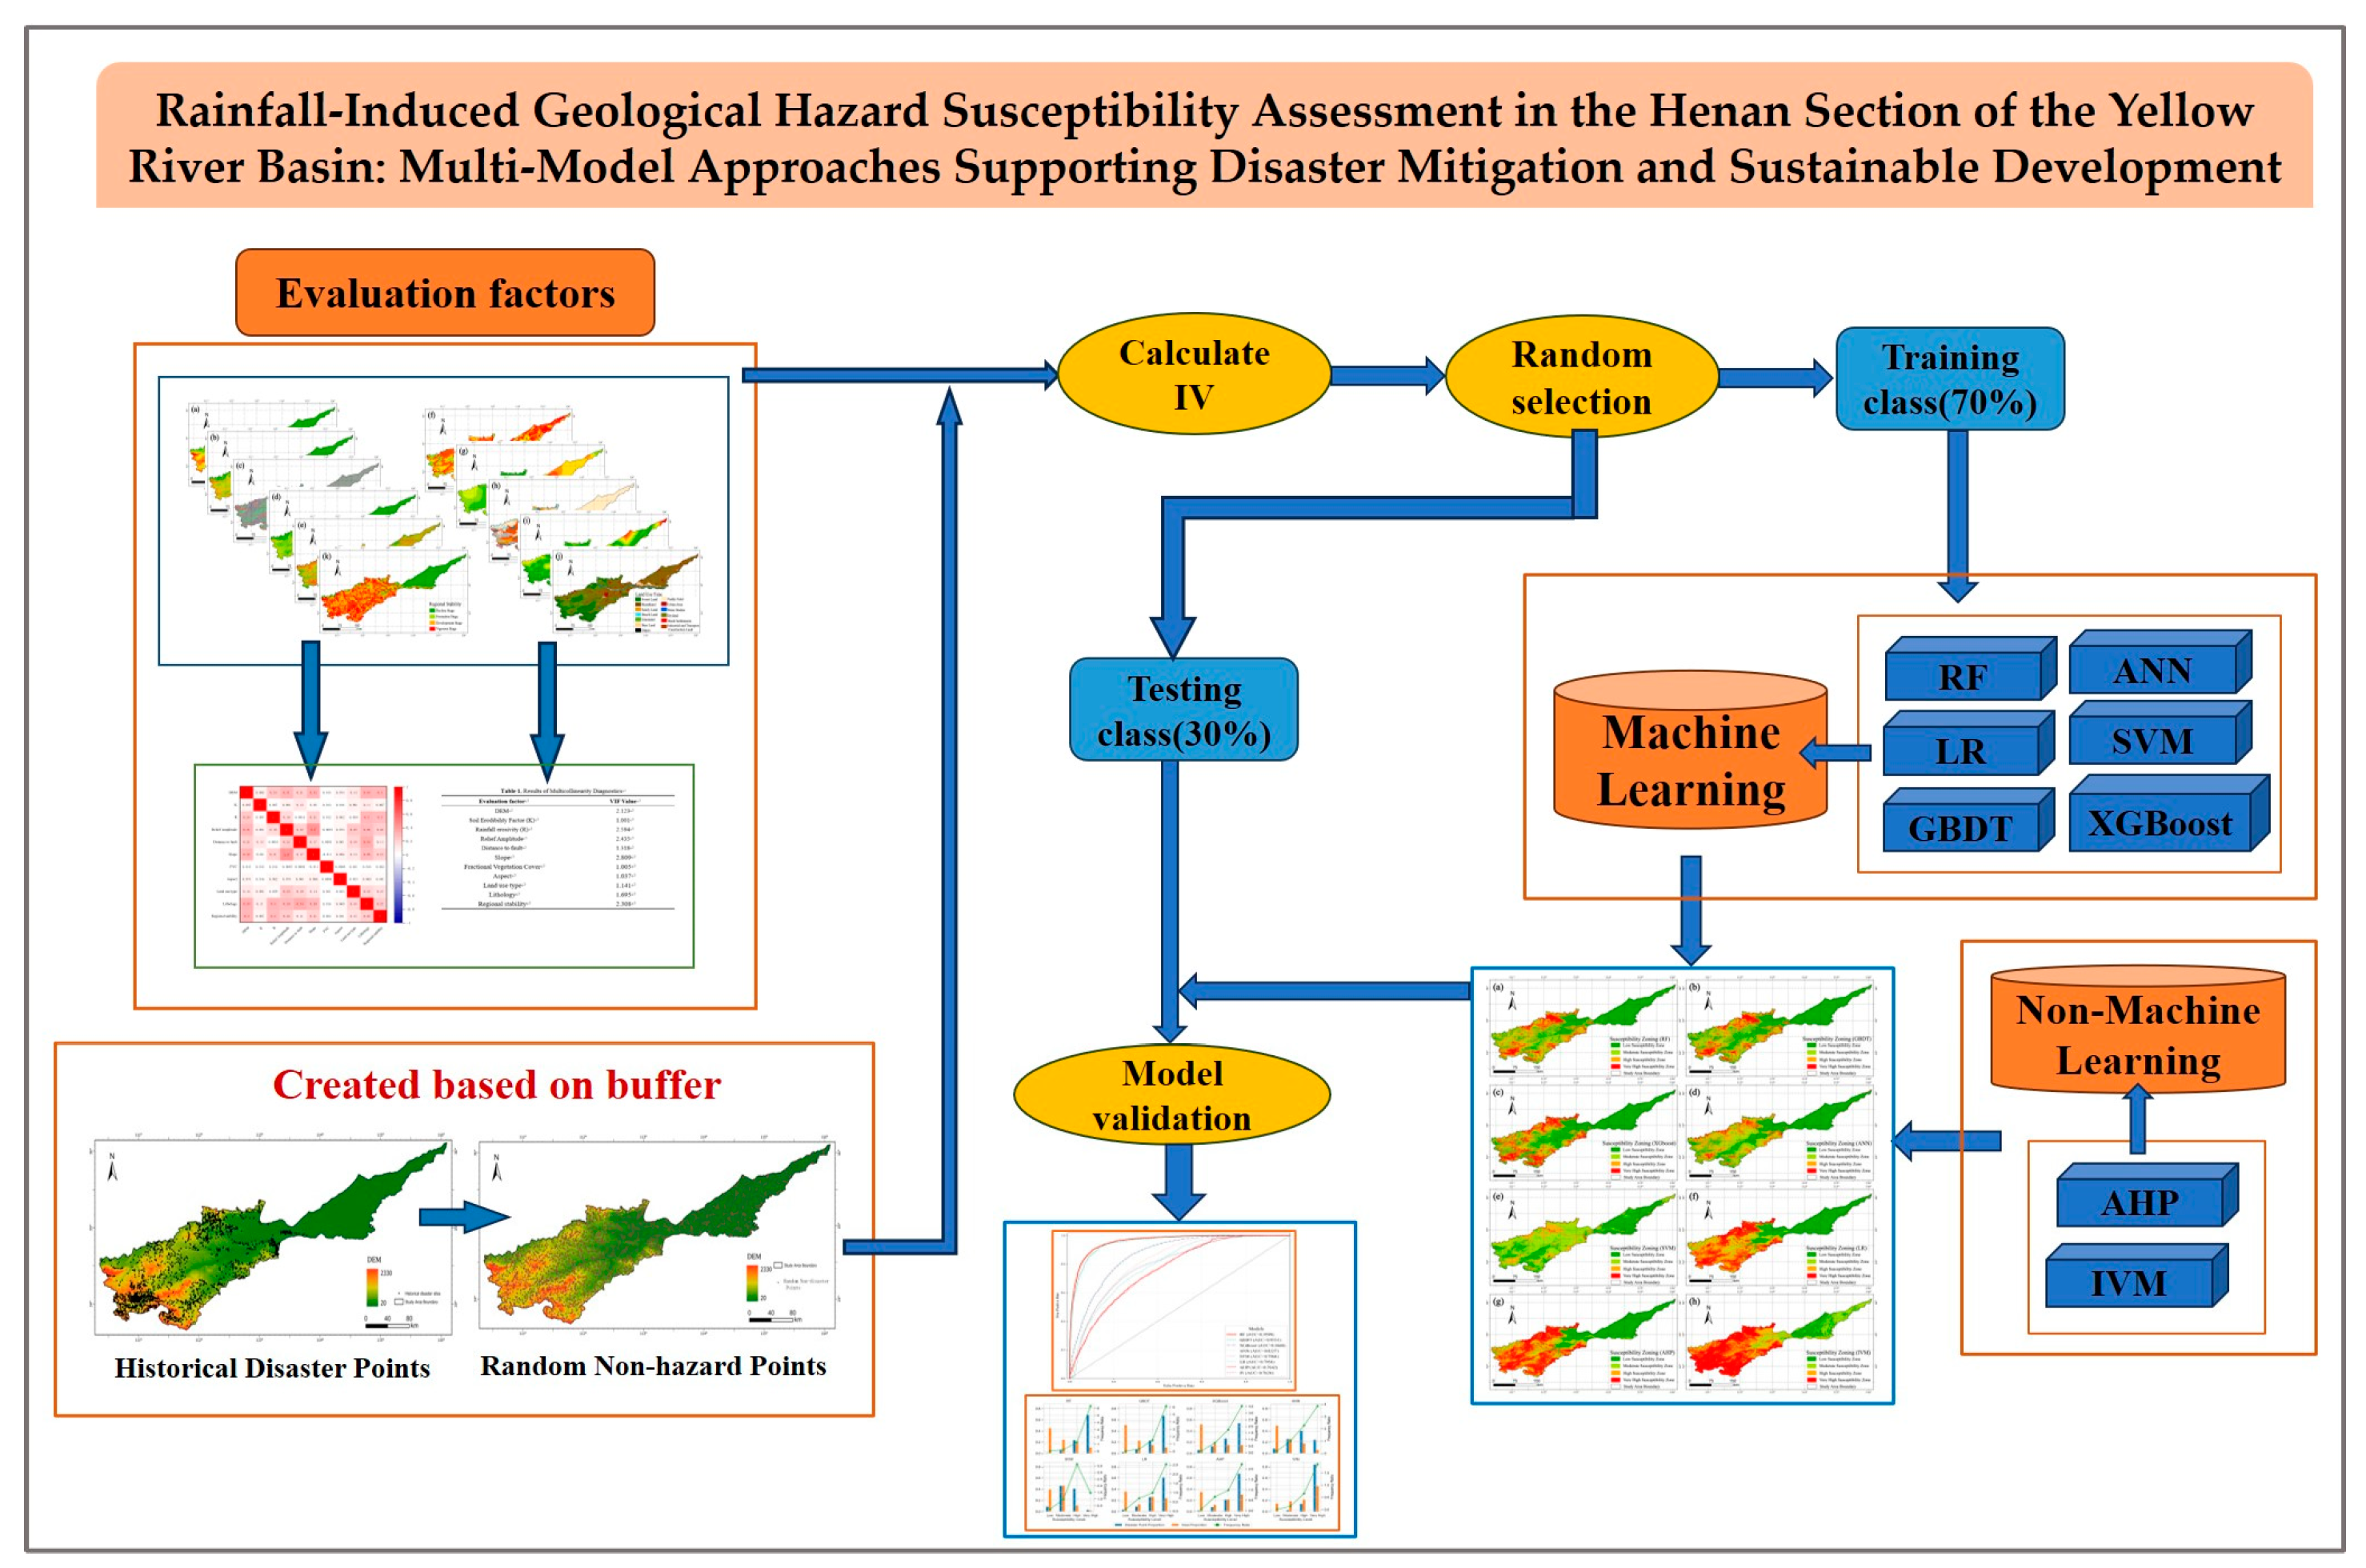
3. Theory and Methods

In the context of rapid technological development, ML has gradually been introduced into the field of natural disaster risk assessment [34,35], marking a transformative shift in geological disaster risk assessment. ML not only enhances the accuracy and efficiency of traditional assessment methods but also provides new perspectives and tools for disaster evaluation. This paper explores the application of various advanced theories and methods in the RGHSA. Based on the IVM, this study integrates ML models, including LR, GBDT, XGBoost, SVM, RF, and ANN, in evaluating the susceptibility to geological hazards. Additionally, the paper introduces the erosion cycle theory to assess watershed system stability, using it as an evaluation factor.
Figure 2. Classification map of evaluation factors. (a) DEM; (b) slope; (c) aspect; (d) relief amplitude; (e) fractional vegetation cover (fVc); (f) soil erodibility factor (K); (g) rainfall erosivity (R); (h) lithology; (i) distance to fault; (j) land use type; (k) regional stability.
Sustainability 17 04348 g002

3.1. Information Value Model (IVM)

The frequent occurrence of slope-related geological hazards is due to the interaction of multiple factors, including geology, landform, and human engineering activities. The Information Value Model can reveal the factors most likely to lead to disasters in specific geological environments. The fundamental idea is to evaluate the contribution of each evaluation factor to disaster occurrence by comparing the actual distribution of disasters with the expected distribution [36]. The specific method involves comparing the probability of geological hazard occurrence under a particular evaluation factor within a specific evaluation unit with the distribution probability of the corresponding evaluation factor in the study area to determine the disaster-prone range of these factors [37]. Based on the study area data, the formula for calculating disaster Information Value in the study area is as follows:
I = i = 0 n ln N i / N S i / S
where I represents the total Information Value of geological hazards occurring under the influence of a certain factor, Ni is the number of disaster points occurring in the study area under the i-th condition, N is the total number of disaster points in the study area, S is the total area of the study area, and Si is the area of the study area under the i-th condition.

3.2. Weighted Information Value Model

The Weighted Information Value Model is an extension of the Information Value Model, which incorporates the varying influence of different factors. By assigning weights to the Information Value of each factor, the total Information Value is calculated. The weighted Information values corresponding to each evaluation index within the raster cells are overlaid to obtain the comprehensive Information Value for each evaluation unit [38]. This method considers the combined effects of multiple evaluation factors, providing a comprehensive reflection of the disaster-causing mechanisms of geological hazards. The formula for calculating the Weighted Information Value is as follows:
I j = i = 1 n W i I Y , X i
where Ij represents the total Weighted Information Value of the evaluation system, Wi is the weight coefficient of the evaluation factor Xi, and I(Y, Xi) is the Information Value of the evaluation factor Xi for event Y.

3.3. Analytic Hierarchy Process (AHP)

The Analytic Hierarchy Model is the predecessor of the Analytic Hierarchy Process (AHP), initially proposed by Kenneth Waltz in the United States to explain and predict international political phenomena. The AHP, developed by American operations researcher T.L. Saaty in the 1970s, is a decision analysis method that combines both qualitative and quantitative approaches [39]. By performing pairwise comparisons of the importance of different factors, a judgment matrix is established. The judgment matrix typically uses a scale of 1 to 9 to reflect the relative importance of factors. Then, we calculate the weight of each factor using the eigenvector method and then conduct a consistency test of the judgment matrix to ensure the rationality of the judgments. In this study, the AHP is used to compare the relative importance of different evaluation factors and determine the weight coefficients of each factor.
Based on the 1 to 9 scale method, pairwise comparisons are made to assess the importance of each evaluation factor [40], leading to the construction of the judgment matrix for the RGH evaluation factors in the study area:
A = ( a i , j ) m × n , a i , j > 0
a i j = a j i i , j = 1 , 2 , , n
where A represents the judgment matrix, aij denotes the ratio of the importance of factor i to factor j, aji represents the ratio of the importance of factor j to factor i, and n is an infinitely large natural number.
The weights of each evaluation factor are obtained by normalizing the eigenvector of the judgment matrix:
w i = W i i = 1 n   W i
where wi represents the weight of the i-th evaluation factor, and Wi is the i-th element in the eigenvector.

3.4. Logistic Regression (LR) Model

The Logistic Regression Model is a statistical analysis method used for binary classification problems, which can predict the classification results based on certain predictor factors [41]. This method features simplicity in computation and clear physical meaning, and researchers widely apply it in the evaluation of geological hazard susceptibility. This model uses disaster-causing factors as independent variables and models the occurrence (1) or non-occurrence (0) of geological hazards as the dependent variable, predicting the probability Pi of hazard occurrence. By taking the natural logarithm of the ratio (Pi/(1-Pi)), the predictive linear function for RGH in the study area, Logit (P), is obtained, with a value range of (−∞, +∞). The formula for Logistic Regression is as follows:
L o g i t P = α + β 1 x 1 + β 2 x 2 + + β k x k
where x1, x2, …, xk are the disaster-causing factors which serve as independent variables and are related to the probability of geological hazard occurrence, and β1, β2, …, βk are the regression coefficients.

3.5. Gradient Boosting Decision Tree (GBDT) Model

In geological hazard susceptibility assessment, the GBDT model is a commonly used ML method. It constructs a strong predictive model by progressively optimizing and combining multiple weak decision trees. GBDT relies on the boosting principle, starting with a simple model to initialize the prediction results. Then, decision trees are iteratively trained to correct prediction errors. Each newly trained tree optimizes the residuals of the previous model, thereby gradually improving the model’s accuracy. GBDT is robust to outliers and can model non-linear feature interactions [42,43], making it suitable for geological hazard susceptibility assessments with multiple features.

3.6. Extreme Gradient Boosting Decision Tree (XGBoost) Model

The XGBoost model, developed by Chen et al. [44], is an ensemble learning method that optimizes the GBDT algorithm. Due to its efficiency and accuracy, XGBoost is widely used in geological hazard susceptibility assessments. XGBoost introduces a regularization term in the objective function, which effectively prevents overfitting and enhances the model’s generalization ability. It also improves computational efficiency through techniques such as pre-sorting split points and block structure parallelization, making it suitable for processing large-scale data. Additionally, the model supports automatic handling of missing data, optimizes split node selection, and has strong capabilities in capturing non-linear relationships within the data.

3.7. Support Vector Machine (SVM) Model

The SVM model is a powerful supervised learning algorithm widely used in classification and regression problems. The fundamental idea is to find an optimal hyperplane that separates data points of different classes [45], and to maximize the margin between the hyperplane and the data points, thereby achieving efficient classification. The core of SVM is that, when constructing the decision boundary, it relies only on the data points that are closest to the boundary, known as “support vectors”. SVM performs exceptionally well in solving linearly separable problems, and for non-linearly separable problems, SVM introduces a kernel function (Kernel Trick) to map the data into a higher-dimensional space, where a linear hyperplane can then be found to separate the data. In geological hazard susceptibility assessment, SVM can effectively handle high-dimensional data with complex relationships. By selecting an appropriate kernel function, SVM can capture non-linear features within the data, making it suitable for classifying and predicting various geological environmental factors. As a result, SVM is widely applied in risk assessment and prediction models for geological hazards.

3.8. Random Forest (RF) Model

The RF model is a powerful model based on the ensemble learning concept, primarily used for classification and regression tasks. It makes predictions by constructing multiple decision trees, with each tree trained on different random subsets of data and feature sets, thereby increasing the diversity and robustness of the model. This approach improves both the accuracy and stability of predictions. The output of each tree is an independent prediction, and RF aggregates the predictions of all trees by voting (for classification problems) or averaging (for regression problems) to obtain the final result. This ensemble strategy effectively reduces overfitting and improves the model’s generalization ability.
In geological hazard susceptibility assessment, the RF model is commonly used due to its strong ability to handle high-dimensional data and its low risk of overfitting. It is particularly useful for addressing the complex effects of multiple factors, such as geological and climatic conditions, on hazard occurrence. RF not only handles large-scale sample data but also evaluates the importance of each feature variable, providing valuable insights for hazard assessment. Additionally, RF has a high tolerance for outliers and missing data, making it widely applicable in practical geological hazard data analysis.

3.9. Artificial Neural Network (ANN) Model

The ANN model is a non-linear model based on simulating the connection mechanisms of neurons in the human brain, capable of handling complex multi-factor relationships. ANN links input factors (such as slope, lithology, etc.) to output results (probability of disaster occurrence) through its multi-layer structure, consisting of an input layer, hidden layers, and an output layer [46]. Data from evaluation factors are input into the network’s input layer, where the complex non-linear relationships between the factors are captured through the weights and activation functions of the hidden layers. The output layer then provides the susceptibility prediction for geological hazards. The model’s training uses the Backpropagation (BP) algorithm, iteratively optimizing weights and biases through error feedback until the loss function converges. The ANN has a strong adaptive learning capability and non-linear modeling ability, allowing it to effectively handle complex interactions between factors.

3.10. Erosion Cycle Theory

Landslides, debris flows, and collapses, as instantaneous dynamic geological phenomena, are the results of the imbalance between the geological forces within and outside the watershed system. Their susceptibility is a response to the intensity of erosion in the watershed and also reflects the stability of the watershed system. Therefore, a quantitative indicator of the watershed system’s stability can be used as an evaluation factor for assessing the susceptibility to geological disasters in the watershed [28]. In this study, regional stability is calculated based on the erosion cycle theory, using the watershed system’s super-entropy method to calculate the super-entropy of valleys or tributaries, which is then used to determine the stability of the corresponding left and right subregions of the watershed divided by the valleys or tributaries. The super-entropy quantification method proposed by Jiang [47] is used to assess the stability of small watershed valleys.
x P = N 3 N 2 4 N + 2 32 6 N
h = H l L N
In Equation (7), ∂xP represents the super-entropy used to quantify the stability of the watershed system, and N is the longitudinal profile morphological index. Equation (8) represents the river valley longitudinal profile equation, where H is the total elevation difference from the river source to the river mouth, L is the total horizontal distance from the river source to the river mouth, h is the elevation difference from a point on the longitudinal profile to the river mouth, and l is the horizontal distance from a point on the longitudinal profile to the river mouth.
Based on ∂xP and its corresponding N value, the evolution of small watershed landforms can be divided into two major stages: watersheds are unstable when ∂xP < 0 and 0 < N < 2, and stable when ∂xP > 0 and N > 2. According to Zhou Bin’s study on the susceptibility zoning of rainfall-induced geological disasters in Henan Province based on the erosion cycle theory, unstable areas are classified as the development phase of rainfall-induced dynamic geological events, while stable areas are classified as the recession phase of these events. Based on the characteristic values of the ∂xP-N curve, the development phase of rainfall-induced dynamic geological events is further subdivided into four stages:
(1)
Incubation stage: ∂xP is in the range (0, −0.0131], and N is in the range (0, 0.62];
(2)
Development stage: ∂xP is in the range (−0.0131, −0.0979], and N is in the range (0.62, 1.23];
(3)
Active stage: ∂xP is in the range (−0.0979, 0), and N is in the range (1.23, 2.0);
(4)
Recession stage: ∂xP is in the range [0, 38.85), and N is in the range [2.0, 3.71).
When ∂xP is in the range [38.85, ∞) and N is in the range [3.71, 6), the watershed system is in a stable phase and will not experience rainfall-induced dynamic geological events [28].

4. Experiments and Results

This study employed six ML models and two non-ML models for a comprehensive evaluation. Figure 3 illustrates the basic research workflow of this paper. The key procedures primarily include evaluation factor selection (encompassing correlation analysis and multicollinearity analysis), information quantity calculation, model training, data reprocessing, generation of evaluation result graphs, and accuracy validation of evaluation results.

4.1. Calculation of Information Value

Based on 2816 geological hazard sample points and the classification of the 11 evaluation factors such as DEM and slope mentioned above, we calculated the Information Value for each evaluation factor level using Formula (1). A higher Information Value indicates a greater positive influence on the occurrence of RGH. The bar chart of information quantity for different factors is shown in Figure 4.

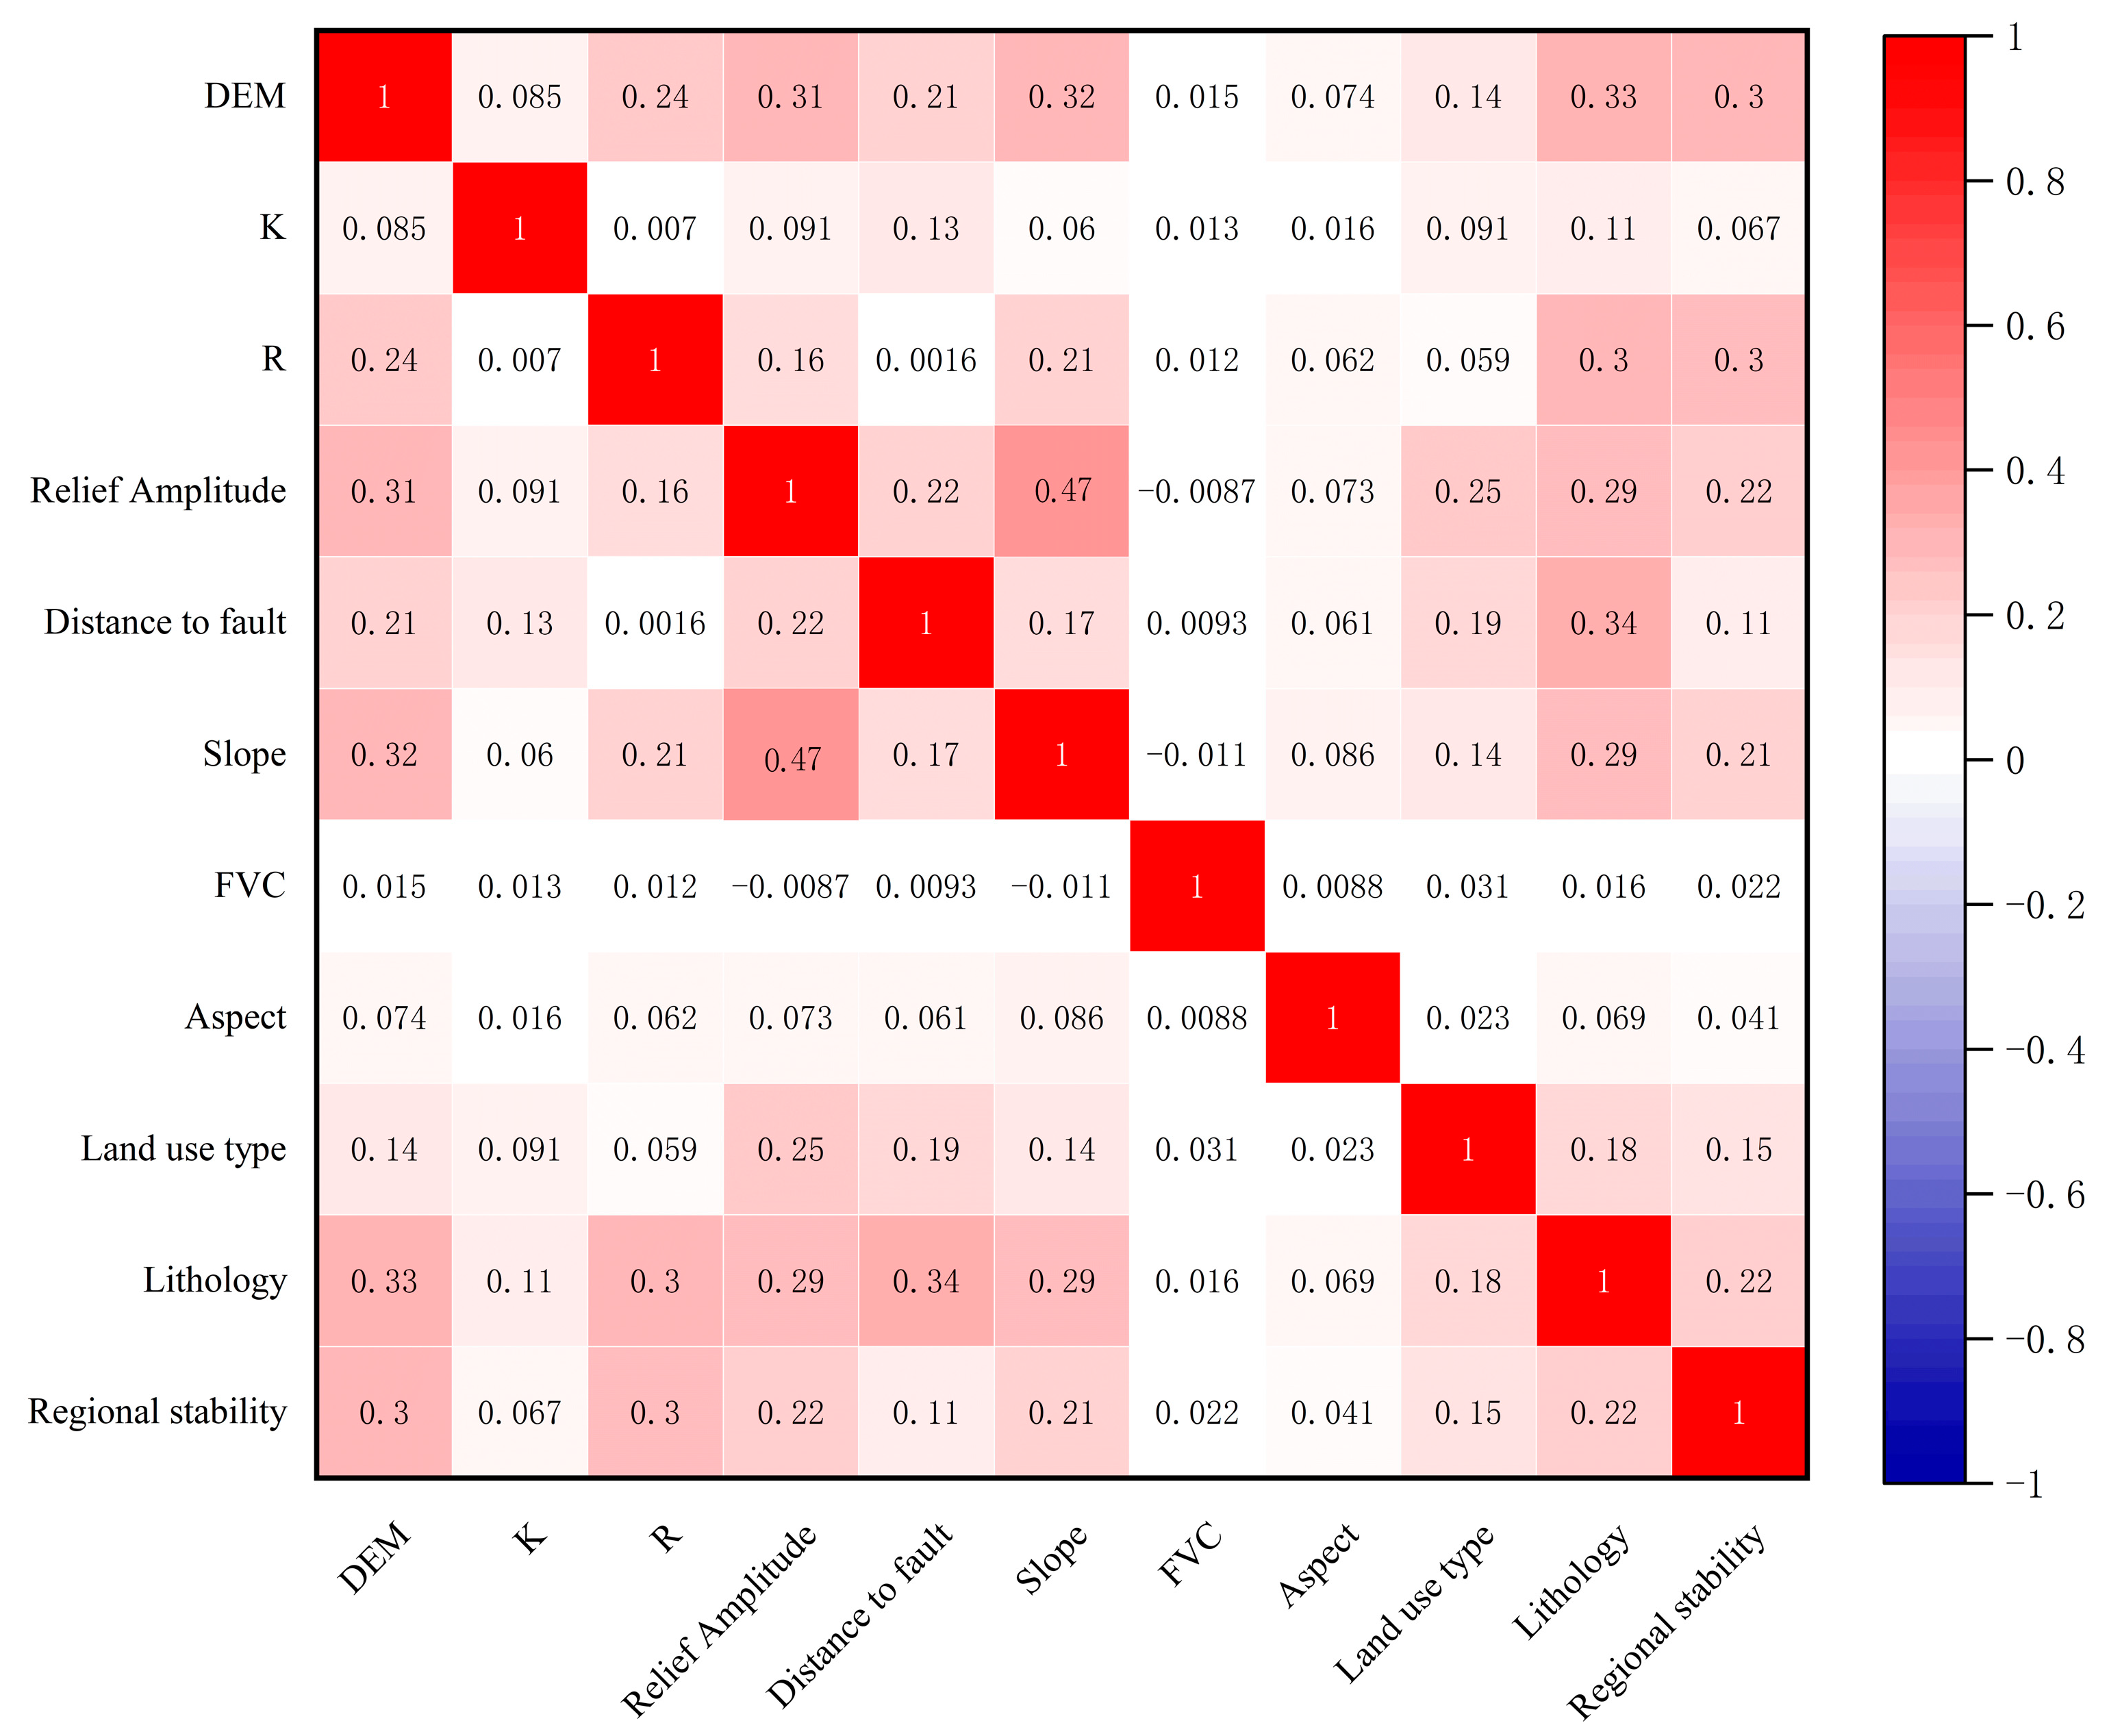
4.2. Collinearity Diagnosis of Evaluation Factors

To ensure model accuracy, the selected evaluation factors should be independent and not influence each other. This paper employs correlation analysis and multicollinearity analysis to test the selected evaluation factors. After several adjustments, 11 evaluation factors were chosen, as presented in this paper. The correlation analysis reveals that the correlation coefficients among these eleven evaluation factors, as shown in Figure 5, are all less than 0.5. The collinearity diagnosis of the 11 selected evaluation factors revealed that their VIF values were all less than 3, indicating the absence of significant high-variance inflation factors. This further suggests that there is essentially no multicollinearity among the variables, and no interaction effects exist between them. The VIF results are presented in Table 1.

4.3. The Application of the Model

4.3.1. Information Value Model

In this study, the differences in the contributions of each evaluation factor to the occurrence of RGH were neglected. The information values of the 11 evaluation factors, including DEM and slope, were directly summed. The resulting sum represents the susceptibility to RGH, with higher values indicating a greater likelihood of occurrence.

4.3.2. Weighted Information Value Model Evaluation Based on AHP

In this study, the AHP was used to determine the importance of different evaluation factors through pairwise comparison (i.e., judgment matrix, as shown in Table 2) in order to calculate the weight coefficients of the 11 evaluation factors, including DEM, slope, aspect, topographic roughness, regional stability, K value, R value, distance to fault, lithology, fractional vegetation cover, and land use type. The calculated weight coefficients were 0.1305, 0.2405, 0.0253, 0.1163, 0.0598, 0.0540, 0.0650, 0.0857, 0.1708, 0.0211, and 0.0310, respectively, with a consistency ratio (CR) of 0.028, which is less than 0.1, indicating that the consistency test was passed. In addition, to reduce subjectivity, the AUC values of the evaluation factors relative to the disaster points were referenced during the pairwise comparisons. The evaluation factors with higher AUC values were considered more important. The weight was substituted into the weighted information model to calculate the total information value, which represents the susceptibility to hazards.

4.3.3. ML Models

In this study, we used data on 11 evaluation factors for 2816 historical disaster sites and an equal number of non-disaster sites selected at random as input variables. Considering the scale of the study area and the density of disaster points, and validated through comparative experiments while referencing similar research by Zhang et al. [48] in Sichuan Province, the 1 km buffer zone balances the uniform spatial distribution of negative samples and model prediction performance, minimizing interference from potential high-risk areas around disaster points in negative sample selection. Thus, a 1 km buffer exclusion method around disaster points was adopted for negative sample selection: a 1 km buffer zone was established around each disaster point, and random sampling was conducted only outside the buffer within the study area. Whether a sample point had a geological disaster (0 or 1) was used as the target variable. We split the dataset into a training set and a testing set at a 70–30% ratio, used for model training and accuracy validation, respectively. Through this process, we constructed six ML models, respectively. After parameter tuning and other operations to ensure the stability of model accuracy, we used GIS technology to zone the susceptibility of RGH in the study area into four levels: low, medium, high, and very high. The evaluation results of the eight models are detailed in Figure 6. The figure shows that the northwestern hilly areas, southwestern mountainous regions, and hilly and low-mountain zones along the Yellow River in the central-northern part of the study area were consistently identified as high- or very-high-susceptibility zones across all eight models. These regions highly coincide with areas with dense historical disaster points, which provides preliminary validation of the reliability of the prediction results.

5. Discussion

5.1. Model Performance Analysis

The applicability and accuracy of models are critical for formulating disaster prevention strategies in the RGHSA of HNYR [49]. This study integrated the IVM with six ML models, optimizing the training dataset through IVM to significantly enhance the models’ capability to capture key disaster-driving factors.
In the model performance comparison, RF (AUC = 0.9599) and GBDT (AUC = 0.9531) exhibited significantly higher ROC-AUC values than the AHP (AUC = 0.7642) and standalone IVM (AUC = 0.7624). The ROC curve is shown in Figure 7. The RF model, by integrating multiple decision trees to reduce variance, demonstrates excellent overfitting resistance in handling high-dimensional non-linear data, accurately characterizing the interactions among complex topographic, geological, and rainfall factors [50,51]. When combined with IVM, the IVM-RF model achieved a disaster point frequency ratio of 6.307 in very high-risk zones (see Figure 8 for details), significantly higher than those of standalone IVM (1.85) and IVM-AHP (2.22), indicating a notable improvement in the recognition accuracy of extreme disaster samples and the consistency between susceptibility zoning results and actual disaster distributions. Considering the AUC values, frequency ratios, and model robustness, the IVM-RF model emerges as the optimal choice for RGH susceptibility assessment in HNYR, providing a reliable technical support for disaster risk management through its accurate identification of high-risk areas and low-bias predictions.

5.2. Key Factors Controlling RGH Occurrence in HNYR

Based on feature contribution rates and frequency ratio analyses, the occurrence of RGHs in HNYR is governed by a “topographic substrate–geological conditions–rainfall triggering–vegetation regulation” four-element coupling mechanism.
Topographic dominance (DEM contribution rate: 13.78–23.28%):
Topographic slope and elevation, as core foundational factors, exhibit a maximum contribution rate exceeding 23% in the XGBoost model. This indicates that steep slopes, characterized by concentrated gravitational potential energy and intense rainwater runoff scouring, are more prone to soil instability.
Lithological sensitivity (lithology contribution rate: 10.14–14.28%):
Disaster points predominantly distribute in areas with loose sediments, metamorphic rocks, mixed sedimentary rocks, and siliceous clastic sedimentary rocks. These lithologies, with weak weathering resistance, easily form fragmented and weak interlayers, serving as the material basis for disaster incubation.
Rainfall triggering effect (rainfall factor R contribution rate: 7.74–8.62%):
In high-density disaster zones, R primarily ranges between 179 and 231 MJ·mm/(hm2·h·a). The 8.62% contribution rate of rainfall in the GBDT model highlights that extreme rainfall directly induces disasters by increasing soil weight and reducing shear strength.
Vegetation regulation (FVC contribution rate: 5.03–10.59%):
The 10.59% contribution rate of FVC in the ANN model indicates that insufficient root-reinforcement capacity exacerbates rainwater infiltration, acting as a critical inductive factor for disaster occurrence.
Additionally, the high weight of the distance-to-fault factor (contribution rate: 9.27–10.07%) reveals the superimposed destabilizing effects of tectonic fracture zones on slope stability. These factors, quantified by feature contribution rates and corroborated by susceptibility zoning results, collectively constitute the key target factors for RGH prevention and control in HNYR.

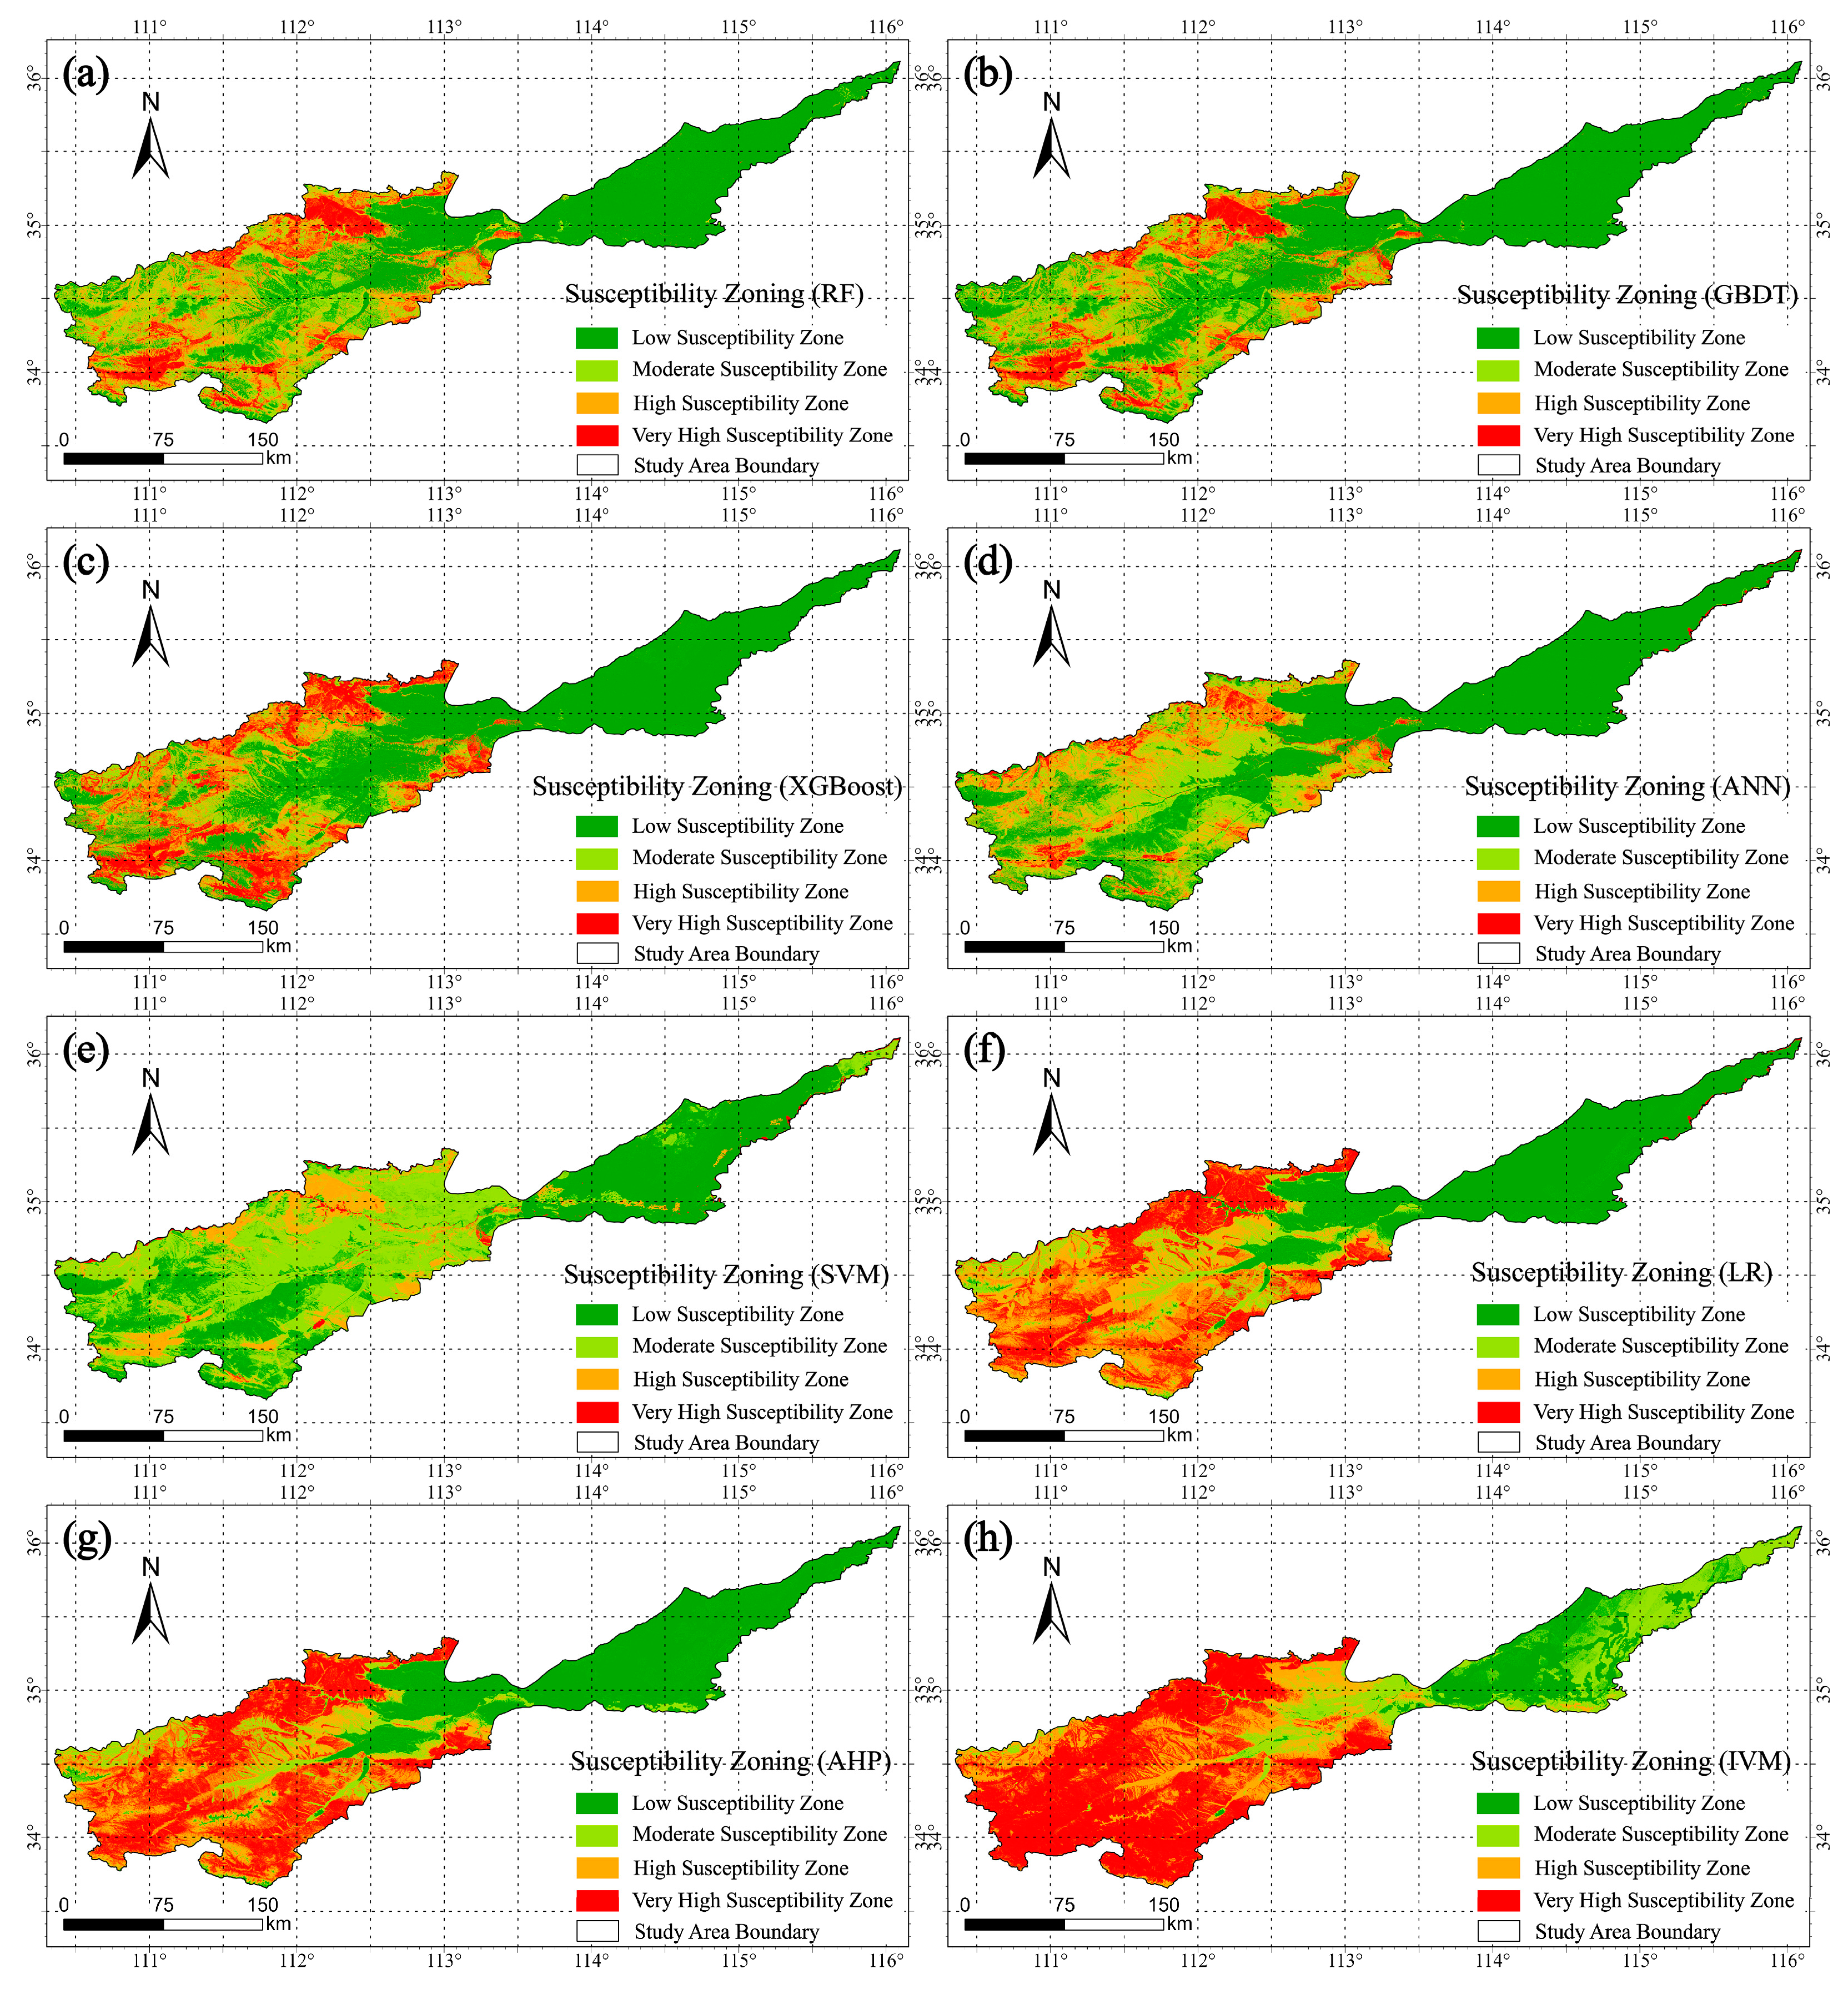
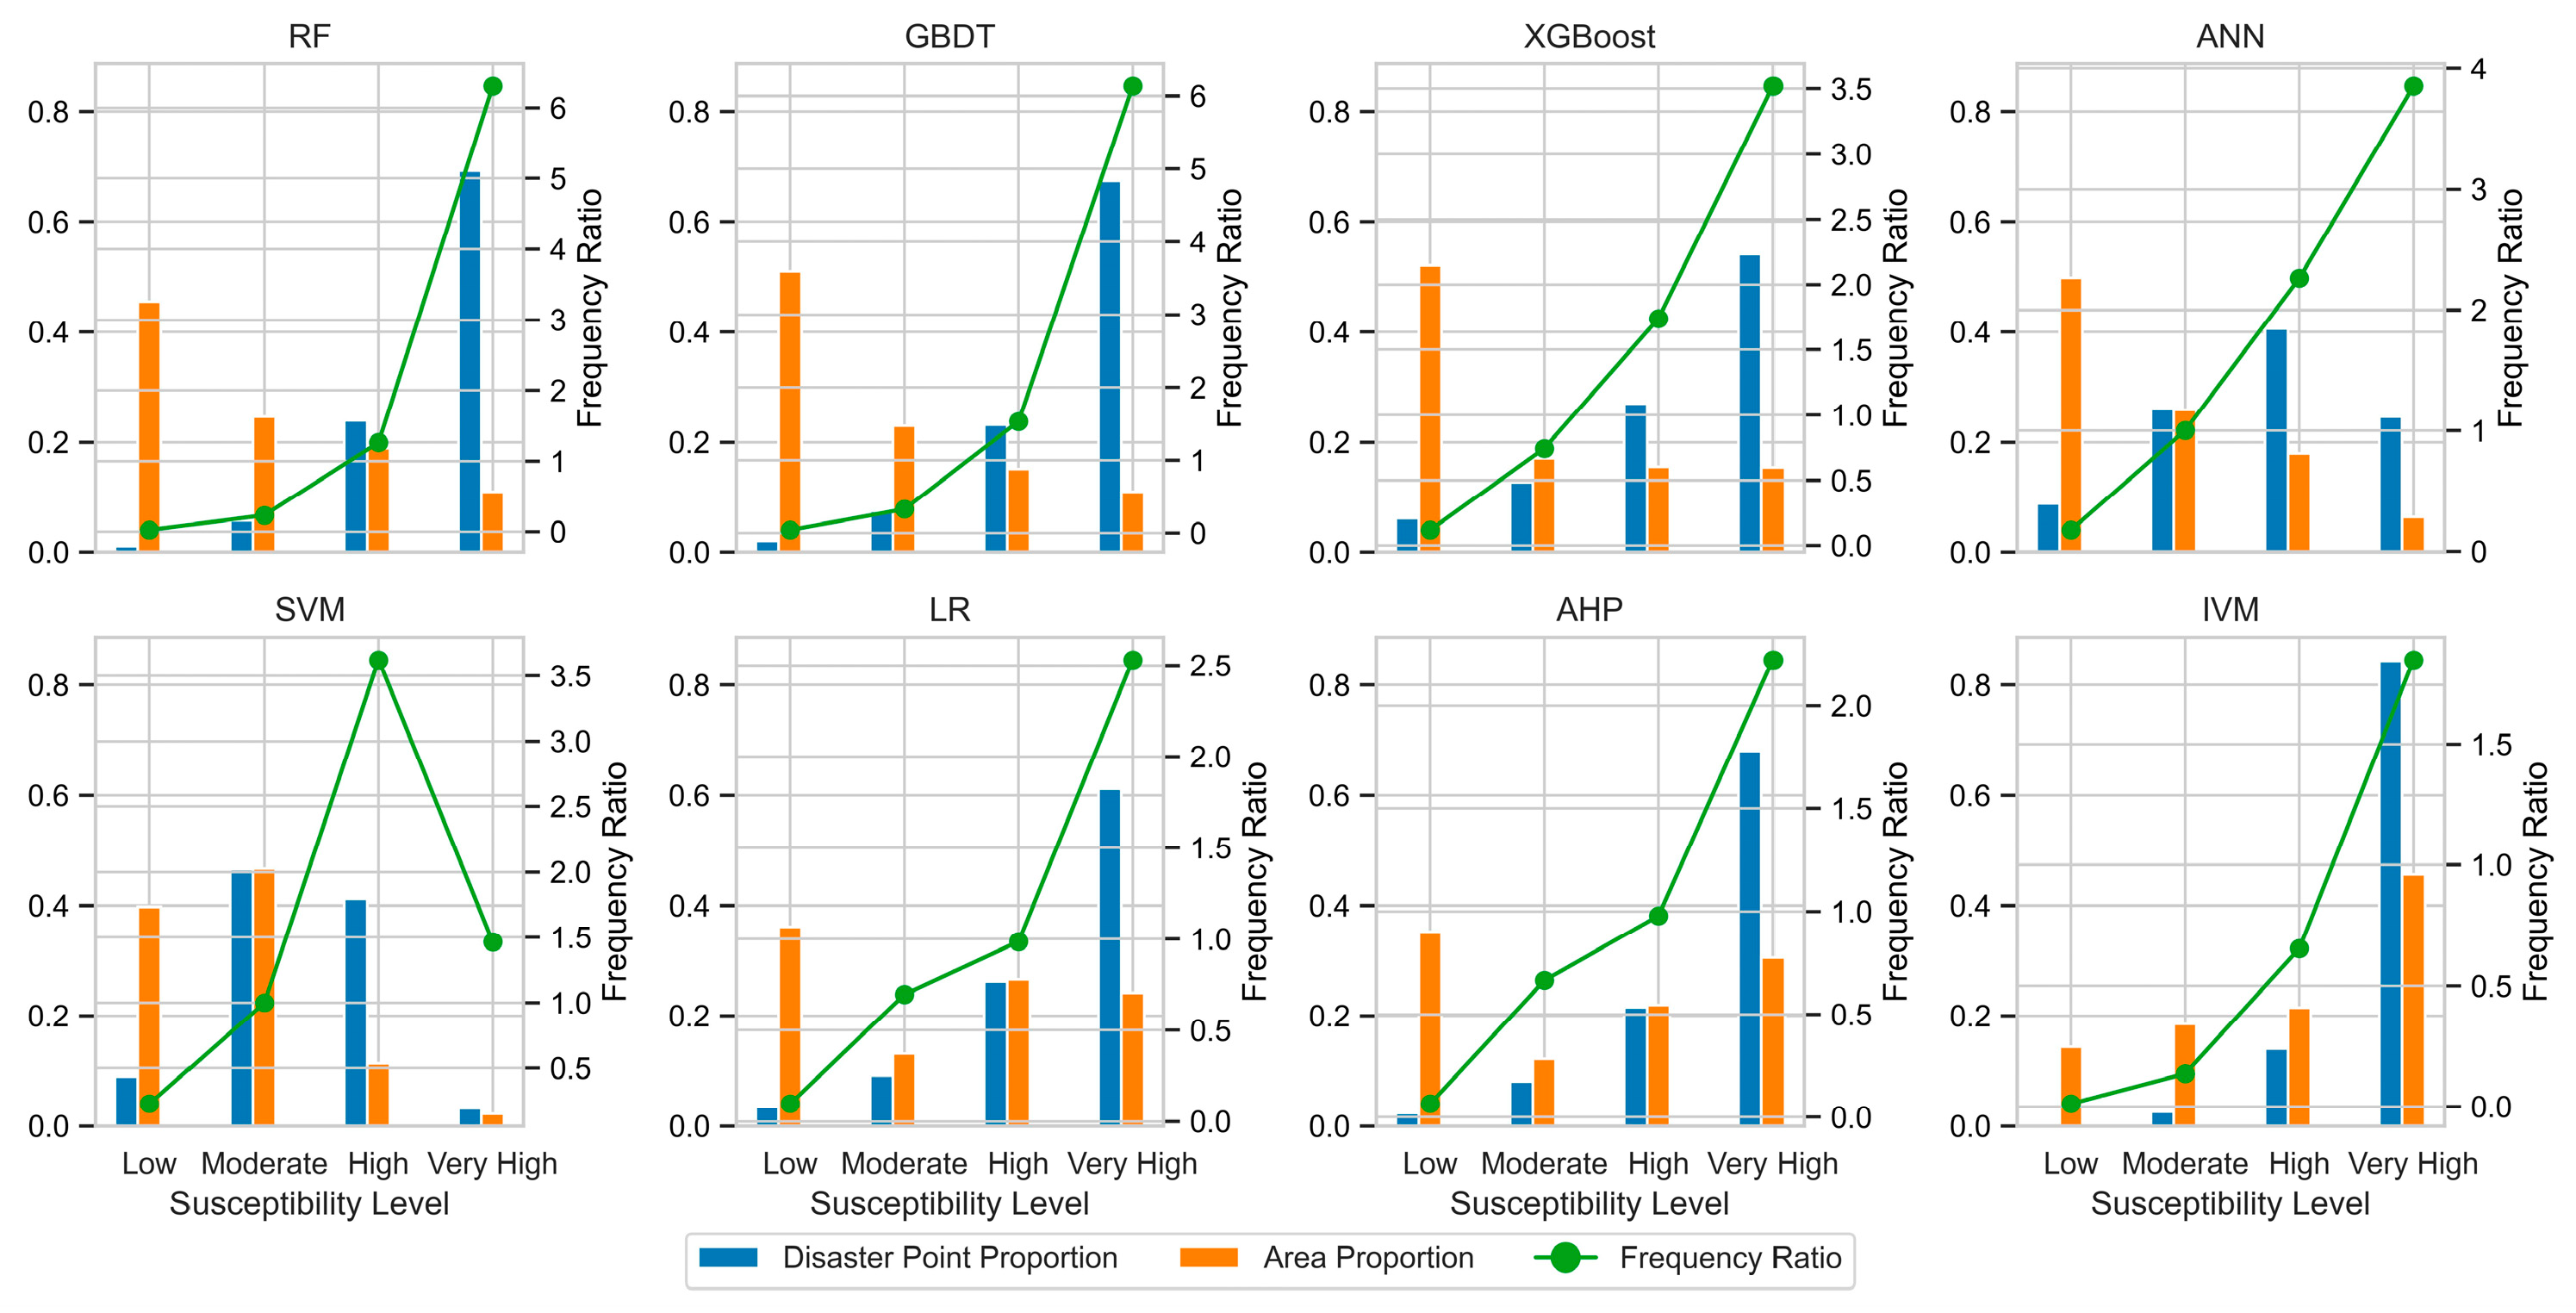
5.3. Spatial Analysis of RGH Susceptibility Mapping

Based on the susceptibility zoning results from multiple models, the spatial distribution of very high-risk zones for RGH in HNYR is highly consistent with the coupling characteristics of “lithology–topography–rainfall” and modulated by geological evolution stages. Very high-risk zones are concentrated in low mountain and hilly areas with an elevation of 287–647 m, where the lithology is dominated by loose sediments, metamorphic rocks, mixed sedimentary rocks, and siliceous clastic sedimentary rocks. These lithologies, with weak weathering resistance, form fragmented and weak interlayers, serving as the material basis for disaster incubation. Topographically, over 80% of disaster points are distributed in the slope range of 3–20°, a gradient that facilitates continuous rainwater infiltration to soften soil while avoiding gravity-dominated sudden instability in extremely steep slopes, making it a favorable zone for progressive disaster development. R value analysis shows that R values in high-density disaster zones primarily range between 179 and 231 MJ·mm/(hm2·h·a), corresponding to moderate-intensity continuous rainfall conditions, reflecting that soil saturation induced by sustained rainfall is the main disaster-causing mechanism.

5.4. Rationality of Negative Sample Selection

In RGHSA, the selection of negative samples (non-disaster points) directly influences the balance of model training and prediction accuracy [6]. This study employed a 1 km buffer exclusion method around disaster points for negative sample selection, establishing a 1 km buffer zone around each disaster point and randomly sampling only outside the buffer within the study area. This approach avoids including potential high-risk areas surrounding disaster points in negative samples [52], effectively enhancing the models’ ability to learn from real non-disaster scenarios.

5.5. Implications for Sustainable Development and Disaster Resilience

Incorporating multi-model vulnerability assessment into disaster risk reduction strategies can promote sustainable development [53]. By identifying high-risk zones with precision, the IVM-RF model supports evidence-based land-use planning, enabling policymakers to prioritize infrastructure investments in low-risk areas and implement targeted mitigation measures in vulnerable regions. For example, the delineation of very high-risk zones can guide the design of climate-resilient infrastructure, such as reinforced drainage systems and slope stabilization projects, reducing long-term economic losses and protecting ecosystems [54]. Additionally, the model’s emphasis on vegetation regulation (FVC contribution rate: 5.03–10.59%) underscores the role of ecological restoration in enhancing slope stability, aligning with sustainable land management practices. Techniques such as ecological bag slope protection can be adopted to plant native vegetation, thereby increasing slope vegetation coverage, stabilizing the slope surface, and restoring the ecosystem. By linking hazard susceptibility with spatial development plans, this study facilitates a proactive approach to balancing human activity and environmental protection, contributing to the United Nations Sustainable Development Goals (SDGs), particularly SDG 11 (Sustainable Cities and Communities) and SDG 13 (Climate Action). The multi-model framework thus serves as a bridge between scientific research and practical sustainability, ensuring that disaster risk reduction efforts are both effective and environmentally responsible.

5.6. Limitations

5.6.1. Regional Transferability Constraints

The model’s training relies heavily on site-specific geological and topographic data, leading to constraints in the weights of disaster-inducing factors and the criteria for susceptibility zoning, which are inherently tied to local conditions. As the selected disaster-inducing factors (e.g., lithology, slope gradient) are calibrated using data from the HNYR region, direct application in areas with distinct geological structures, climatic conditions, or triggering mechanisms—such as the southwestern seismic zone or the Yangtze River Basin—may compromise prediction accuracy [55].

5.6.2. Incompleteness of Disaster-Inducing Factors

Although 11 core factors (e.g., topography, lithology, rainfall) were incorporated, the study did not account for instantaneous, strong triggering factors such as seismic activity and human engineering disturbances (e.g., mining, road slope cutting). This oversight introduces biases in risk assessment for zones characterized by complex interactions among seismic forces, rainfall, and anthropogenic activities—particularly in densely engineered areas adjacent to fault zones, where disaster risks may be underestimated.

5.6.3. Data Resolution and Overfitting Risks

The 12.5 m resolution raster data employed in this study suffice for regional-scale assessments but may lose critical details of topographic relief and FVC in fine-scale scenarios (e.g., individual slopes or village-level areas), potentially compromising the quantification accuracy of disaster-inducing factors [56]. And we cannot obtain real-time rainfall data for dynamic monitoring. Additionally, the imbalanced training dataset selected via the IVM increases the risk of overfitting in ensemble learning models (e.g., RF, GBDT), which could degrade their generalization performance when applied to new datasets [57,58].

6. Conclusions

This study constructs an integrated model framework for RGHSA in the HNYR area. By combining IVM with ML, we significantly improved the accuracy of sensitivity evaluation. Key factor analysis reveals a coupling mechanism of four elements—“topographic substrate–geological conditions–rainfall triggering–vegetation regulation”—wherein terrain slopes of 3–20°, distribution of loose sedimentary rocks (lithological contribution rate of 14.28%), and moderate-intensity continuous rainfall (including extreme heavy rainfall) act as core drivers of frequent disasters. Sensitivity mapping results show that high-risk zones are concentrated in low mountain and hilly areas at altitudes of 287–647 m, providing precise spatial targets for targeted risk management. Model comparisons indicate that RF (AUC = 0.9599) performs best under complex geological and rainfall conditions, with a disaster point frequency ratio of 6.307 in extremely high-risk areas, significantly outperforming independent IVM. The IVM-RF model optimized by negative sample exclusion (1 km buffer zone centered on disaster points) further enhances the identification accuracy of high-risk zones, achieving optimal performance in both AUC value and frequency ratio, thus becoming the optimal choice for RGHSA in the HNYR area. Beyond technical innovations, this framework incorporates sustainable development principles by integrating topographic, lithological, and rainfall factors into adaptive management strategies. It enables decision-makers to prioritize nature-based solutions, such as implementing vegetation restoration in high-risk areas to enhance ecological regulation and soil stability, while combining climate-adaptive land-use planning to reduce risks while protecting ecosystem services. We suggest that local governments implement priority strategies for ecological engineering in extremely high-risk areas, completing restoration plans to increase vegetation coverage to over 60% within a specified timeframe, while temporarily prohibiting the approval of new construction land in these regions. This study promotes sustainable resource allocation—such as guiding infrastructure investment toward low-risk areas and implementing ecological engineering measures in vulnerable regions—thereby effectively facilitating the rational distribution of resources. Building on this, the research supports the development of long-term resilience and harmonious human–land interactions, providing critical references for the comprehensive prevention and control of RGHs and regional sustainable development in HNYR and other regions.

Author Contributions

Conceptualization, H.C.; methodology, Y.Z., H.C. and H.Y.; data curation, Y.Z.; writing—original draft preparation, Y.Z. and H.C.; writing—review and editing, H.C. and R.W.; validation, Y.Z.; resources, H.C. and Z.Y. All authors have read and agreed to the published version of the manuscript.

Funding

This research was supported by the Xinjiang Uygur Autonomous Region Key Research and Development Program (2022B01012-1), the Third Xinjiang Scientific Expedition Program (Grant No. 2022xjkk1006), the National Natural Science Foundation of China (52478011), the Science and Technology Innovation Project of Jiangsu Provincial Department of Natural Resources (2023018), and the Open Research Project of The Hubei Key Laboratory of Intelligent Geo-Information Processing (KLIGIP-2023-A04).

Institutional Review Board Statement

Not applicable.

Informed Consent Statement

Not applicable.

Data Availability Statement

The data presented in this study are available on request from the corresponding author. The data are not publicly available due to privacy.

Acknowledgments

I would like to sincerely thank the following individuals for their guidance and support throughout my research: First, my undergraduate advisor, Hongbo Xie, for his meticulous academic guidance and valuable suggestions on research design and methodology. I also appreciate my senior, Xinran Wang, for her patient answers to my questions and practical advice on experimental techniques. All support provided was in the form of guidance, advice, or technical assistance, and does not constitute authorship-level contributions as defined by academic standards.

Conflicts of Interest

The authors declare no conflicts of interest.

Abbreviations

The following abbreviations are used in this manuscript:
HNYRHenan section of the Yellow River Basin
SVMSupport Vector Machine
RGHARainfall-induced geological hazard susceptibility assessment
RGHRainfall-induced geological hazard
MLMachine learning
RFRandom Forest
GBDTGradient Boosting Decision Tree
IVMInformation Value Model
ANNArtificial Neural Network
LRLogistic Regression
XGBoosteXtreme Gradient Boosting
AHPAnalytic Hierarchy Process
KSoil erodibility factor
RRainfall erosivity
FVCFractional vegetation cover
CTConsistency test

References

  1. Henan Provincial Department of Natural Resources. 2023 Henan Provincial Natural Resources Statistical Bulletin. 2024. Available online: https://dnr.henan.gov.cn/2024/12-03/3094375.html (accessed on 15 April 2025).
  2. Henan Provincial Department of Natural Resources. 2024 Announcement on the Situation of Geological Hazard Risk Points in Henan Province. 2024. Available online: https://dnr.henan.gov.cn/2024/05-11/2989580.html (accessed on 15 April 2025).
  3. Sajid, T.; Maimoon, S.K.; Waseem, M.; Ahmed, S.; Khan, M.A.; Tränckner, J.; Pasha, G.A.; Hamidifar, H.; Skoulikaris, C. Integrated Risk Assessment of Floods and Landslides in Kohistan, Pakistan. Sustainability 2025, 17, 3331. [Google Scholar] [CrossRef]
  4. Fan, Z.; Gou, X.; Qin, M.; Fan, Q.; Yu, J.; Zhao, J. Geological Disaster Susceptibility Assessment Based on Coupling of Information Volume Model and Logistic Regression Model. J. Eng. Geol. 2018, 26, 340–347. [Google Scholar] [CrossRef]
  5. Jin, C.; Fei, W.; Ding, W.; Chen, X.; Du, Y. Geological Disaster Susceptibility Assessment Based on Information Volume Model and Logistic Regression Model—A Case Study of Yunyang District, Shiyan City. Resour. Environ. Eng. 2021, 35, 845–850+886. [Google Scholar] [CrossRef]
  6. Zhao, P.; Wang, Y.; Xie, Y.; Uddin, M.G.; Xu, Z.; Chang, X.; Zhang, Y. Landslide susceptibility assessment using information quantity and machine learning integrated models: A case study of Sichuan province, southwestern China. Earth Sci. Inform. 2025, 18, 190. [Google Scholar] [CrossRef]
  7. Guillen, K.A.D.; Mendoza, M.E.; Macías, J.L.; Solis-Castillo, B. Landslide susceptibility analysis based on A semiquantitative method in the sierra-costa region, michoacan, mexico. Phys. Geogr. 2022, 43, 463–486. [Google Scholar] [CrossRef]
  8. Sur, U.; Singh, P.; Meena, S.R. Landslide susceptibility assessment in a lesser Himalayan road corridor (India) applying fuzzy AHP technique and earth-observation data. Geomat. Nat. Hazards Risk 2020, 11, 2176–2209. [Google Scholar] [CrossRef]
  9. Do, H.M.; Yin, K.L.; Guo, Z.Z. A comparative study on the integrative ability of the analytical hierarchy process, weights of evidence and logistic regression methods with the Flow-R model for landslide susceptibility assessment. Geomat. Nat. Hazards Risk 2020, 11, 2449–2485. [Google Scholar] [CrossRef]
  10. Hu, Y.; Zhang, Z.; Lin, S. Landslide Susceptibility Assessment in the Ili River Valley Region, Xinjiang Based on Evidence Weight and Logistic Regression Coupling. J. Eng. Geol. 2023, 31, 1350–1363. [Google Scholar] [CrossRef]
  11. Zhang, S.; Li, C.; Peng, J.; Peng, D.; Xu, Q.; Zhang, Q.; Bate, B. GIS-based soil planar slide susceptibility mapping using logistic regression and neural networks: A typical red mudstone area in southwest China. Geomat. Nat. Hazards Risk 2021, 12, 852–879. [Google Scholar] [CrossRef]
  12. Wang, Z.; Zhao, C. Assessment of Landslide Susceptibility Based on ReliefF Feature Weight Fusion: A Case Study of Wenxian County, Longnan City. Sustainability 2025, 17, 3536. [Google Scholar] [CrossRef]
  13. Duwal, S.; Liu, D.; Pradhan, P.M. Flood susceptibility modeling of the Karnali river basin of Nepal using different machine learning approaches. Geomat. Nat. Hazards Risk 2023, 14, 2217321. [Google Scholar] [CrossRef]
  14. Li, Y.; Sheng, Y.; Chai, B.; Zhang, W.; Zhang, T.; Wang, J. Collapse susceptibility assessment using a support vector machine compared with back-propagation and radial basis function neural networks. Geomat. Nat. Hazards Risk 2020, 11, 510–534. [Google Scholar] [CrossRef]
  15. Basharat, M.u.; Khan, J.A.; Abdo, H.G.; Almohamad, H. An integrated approach based landslide susceptibility mapping: Case of Muzaffarabad region, Pakistan. Geomat. Nat. Hazards Risk 2023, 14, 2210255. [Google Scholar] [CrossRef]
  16. Mangkhaseum, S.; Bhattarai, Y.; Duwal, S.; Hanazawa, A. Flood susceptibility mapping leveraging open-source remote-sensing data and machine learning approaches in Nam Ngum River Basin (NNRB), Lao PDR. Geomat. Nat. Hazards Risk 2024, 15, 2357650. [Google Scholar] [CrossRef]
  17. He, Q.; Jiang, Z.; Wang, M.; Liu, K. Landslide and Wildfire Susceptibility Assessment in Southeast Asia Using Ensemble Machine Learning Methods. Remote Sens. 2021, 13, 1572. [Google Scholar] [CrossRef]
  18. Song, Y.; Song, Y.; Wang, C.; Wu, L.; Wu, W.; Li, Y.; Li, S.; Chen, A. Landslide susceptibility assessment through multi-model stacking and meta-learning in Poyang County, China. Geomat. Nat. Hazards Risk 2024, 15, 2354499. [Google Scholar] [CrossRef]
  19. Can, R.; Kocaman, S.; Gokceoglu, C. A Comprehensive Assessment of XGBoost Algorithm for Landslide Susceptibility Mapping in the Upper Basin of Ataturk Dam, Turkey. Appl. Sci. 2021, 11, 4993. [Google Scholar] [CrossRef]
  20. Shen, S.; Deng, L.; Tang, D.; Chen, J.; Fang, R.; Du, P.; Liang, X. Landslide Hazard Assessment Based on Ensemble Learning Model and Bayesian Probability Statistics: Inference from Shaanxi Province, China. Sustainability 2025, 17, 1973. [Google Scholar] [CrossRef]
  21. Al-Sheriadeh, M.S.; Daqdouq, M.A. Robustness of machine learning algorithms to generate flood susceptibility maps for watersheds in Jordan. Geomat. Nat. Hazards Risk 2024, 15, 2378991. [Google Scholar] [CrossRef]
  22. Jiang, J.; Wang, Q.; Luan, S.; Gao, M.; Liang, H.; Zheng, J.; Yuan, W.; Ji, X. Landslide susceptibility prediction and mapping in Taihang mountainous area based on optimized machine learning model with genetic algorithm. Earth Sci. Inform. 2024, 17, 5539–5559. [Google Scholar] [CrossRef]
  23. Lu, M.; Tay, L.T.; Mohamad-Saleh, J. Landslide susceptibility analysis using random forest model with SMOTE-ENN resampling algorithm. Geomat. Nat. Hazards Risk 2024, 15, 2314565. [Google Scholar] [CrossRef]
  24. Nsengiyumva, J.B.; Valentino, R. Predicting landslide susceptibility and risks using GIS-based machine learning simulations, case of upper Nyabarongo catchment. Geomat. Nat. Hazards Risk 2020, 11, 1250–1277. [Google Scholar] [CrossRef]
  25. Zhao, L.; Wu, X.; Niu, R.; Wang, Y.; Zhang, K. Using the rotation and random forest models of ensemble learning to predict landslide susceptibility. Geomat. Nat. Hazards Risk 2020, 11, 1542–1564. [Google Scholar] [CrossRef]
  26. Huang, Z.; Chen, X.; Liu, A. Rainfall-induced Geological Disaster Susceptibility Evaluation Model Based on ArcGIS for Fujian Province. Fujian Geol. 2010, 29, 72–76. [Google Scholar]
  27. Wang, J. Construction of a Rainfall-induced Geological Disaster Susceptibility Evaluation Model Based on ArcGIS. Water Conserv. Sci. Econ. 2020, 26, 17–22. [Google Scholar]
  28. Zhou, B.; Xie, H.; Wen, G. Rainfall-Induced Geological Hazard Susceptibility Zoning in Henan Province Based on the Erosion Cycle Theory. J. North China Univ. Water Resour. Electr. Power (Nat. Sci. Ed.) 2024, 45, 92–101. [Google Scholar] [CrossRef]
  29. Oliveira, S.C.; Zêzere, J.L.; Garcia, R.A.C.; Pereira, S.; Vaz, T.; Melo, R. Landslide susceptibility assessment using different rainfall event-based landslide inventories: Advantages and limitations. Nat. Hazards 2024, 120, 9361–9399. [Google Scholar] [CrossRef]
  30. Fan, Y. Effectiveness and Practices of Soil and Water Conservation and Ecological Construction in the Yellow River Basin, Henan Province. China Soil Water Conserv. 2016, 10, 24–26. [Google Scholar] [CrossRef]
  31. Luo, S.; Li, X.; Yang, J.; Li, X. How to Consider Human Footprints to Assess Human Disturbance: Evidence from Urban Agglomeration in the Yellow River Basin. Land 2024, 13, 2163. [Google Scholar] [CrossRef]
  32. Guo, F.; Wu, D.; Ge, M.; Dong, J.; Fang, H.; Tian, D. Impact of Continuous Variable Factor Classification and Machine Learning Models on Landslide Susceptibility Assessment Accuracy. J. Wuhan Univ. (Inf. Sci. Ed.) 2024, 1–17. [Google Scholar] [CrossRef]
  33. Network, E.S.S.D.S. 1:4,000,000 China Soil Map (2000). 2006. Available online: https://nnu.geodata.cn/index.html (accessed on 15 April 2025).
  34. Kayet, N.; Chakrabarty, A.; Pathak, K.; Sahoo, S.; Dutta, T.; Hatai, B.K. Comparative analysis of multi-criteria probabilistic FR and AHP models for forest fire risk (FFR) mapping in Melghat Tiger Reserve (MTR) forest. J. For. Res. 2020, 31, 565–579. [Google Scholar] [CrossRef]
  35. Nuthammachot, N.; Stratoulias, D. Multi-criteria decision analysis for forest fire risk assessment by coupling AHP and GIS: Method and case study. Environ. Dev. Sustain. 2021, 23, 17443–17458. [Google Scholar] [CrossRef]
  36. Fell, R.; Corominas, J.; Bonnard, C.; Cascini, L.; Leroi, E.; Savage, W.Z. Guidelines for landslide susceptibility, hazard and risk zoning for land use planning. Eng. Geol. 2008, 102, 85–98. [Google Scholar] [CrossRef]
  37. Chen, L.; Meng, G.; Zhang, W.; Wang, B. Application of the Information Content Model in the Survey and Zoning of Geological Disasters in Counties and Cities—A Case Study of Xianju County, Zhejiang Province. Hydrogeol. Eng. Geol. 2003, 5, 49–52. [Google Scholar]
  38. Hu, X.; Ming, L.; Wu, T.; Liu, B.; Pang, D.; Yin, J.; Song, B.; Ke, F. Evaluation of geological hazard vulnerability in Xining city based on InSAR and informativeness-hierarchical analysis coupled modeling. Bull. Surv. Mapp. 2023, 12, 51–56, 75. [Google Scholar]
  39. Saaty, T. The Analytic Hierarchy Process (AHP) for Decision Making. J. Oper. Res. Soc. 1980, 41, 1073. [Google Scholar]
  40. Wang, L. Geological Disaster Susceptibility Evaluation Based on GIS Technology—A Case Study of Qujiang District, Guangdong Province. Miner. Explor. 2023, 14, 2492–2501. [Google Scholar] [CrossRef]
  41. Nelder, J.A.; Wedderburn, R.W.M. Generalized Linear Models. R. Stat. Society J. Ser. A Gen. 2018, 135, 370–384. [Google Scholar] [CrossRef]
  42. Elith, J.; Leathwick, J.R.; Hastie, T. A working guide to boosted regression trees. J. Anim. Ecol. 2008, 77, 802–813. [Google Scholar] [CrossRef]
  43. Friedman, J.H. Stochastic gradient boosting. Comput. Stat. Data Anal. 2002, 38, 367–378. [Google Scholar] [CrossRef]
  44. Chen, T.; Guestrin, C. Xgboost: A scalable tree boosting system. In Proceedings of the 22nd ACM Sigkdd International Conference on Knowledge Discovery and Data Mining, San Francisco, CA, USA, 13–17 August 2016; pp. 785–794. [Google Scholar]
  45. Pradhan, B. A comparative study on the predictive ability of the decision tree, support vector machine and neuro-fuzzy models in landslide susceptibility mapping using GIS. Comput. Geosci. 2013, 51, 350–365. [Google Scholar] [CrossRef]
  46. Ali, S.A.; Parvin, F.; Pham, Q.B.; Khedher, K.M.; Dehbozorgi, M.; Rabby, Y.W.; Anh, D.T.; Nguyen, D.H. An ensemble random forest tree with SVM, ANN, NBT, and LMT for landslide susceptibility mapping in the Rangit River watershed, India. Nat. Hazards 2022, 113, 1601–1633. [Google Scholar] [CrossRef]
  47. Jiang, Z. Super Entropy of Debris Flow Watershed Systems. J. Geol. Hazards Civ. Eng. 1992, 1, 35–42. [Google Scholar]
  48. Zhang, J.; Qian, J.; Lu, Y.; Li, X.; Song, Z. Study on Landslide Susceptibility Based on Multi-Model Coupling: A Case Study of Sichuan Province, China. Sustainability 2024, 16, 6803. [Google Scholar] [CrossRef]
  49. Tao, S.; Hu, D.; Zhao, W. Susceptibility assessment of earthquake-triggered landslide in Wenchuan. In Proceedings of the Sixth International Symposium on Digital Earth: Data Processing and Applications, Beijing, China, 9–12 September 2009; SPIE: Bellingham, WA, USA, 2010; Volume 7841, pp. 465–472. [Google Scholar]
  50. Dai, X.; Zhu, Y.; Sun, K.; Zou, Q.; Zhao, S.; Li, W.; Hu, L.; Wang, S. Examining the spatially varying relationships between landslide susceptibility and conditioning factors using a geographical random forest approach: A case study in Liangshan, China. Remote Sens. 2023, 15, 1513. [Google Scholar] [CrossRef]
  51. Xiao, X.; Zou, Y.; Huang, J.; Luo, X.; Yang, L.; Li, M.; Yang, P.; Ji, X.; Li, Y. An interpretable model for landslide susceptibility assessment based on Optuna hyperparameter optimization and Random Forest. Geomat. Nat. Hazards Risk 2024, 15, 2347421. [Google Scholar] [CrossRef]
  52. Zhang, L.; Zeng, T.; Wang, L.; Li, L. Advancing seismic landslide susceptibility modeling: A comparative evaluation of deep learning models through particle swarm optimization. Earth Sci. Inform. 2024, 17, 3547–3566. [Google Scholar] [CrossRef]
  53. Zhou, H.; Mu, C.; Yang, B.; Huang, G.; Hong, J. Evaluating Landslide Hazard in Western Sichuan: Integrating Rainfall and Geospatial Factors Using a Coupled Information Value–Geographic Logistic Regression Model. Sustainability 2025, 17, 1485. [Google Scholar] [CrossRef]
  54. Lohan, N.; Kumar, S.; Singh, V.; Gupta, R.P.; Tiwari, G. Analyzing an Extreme Rainfall Event in Himachal Pradesh, India, to Contribute to Sustainable Development. Sustainability 2025, 17, 2115. [Google Scholar] [CrossRef]
  55. Ali, M.Z.; Chu, H.-J.; Chen, Y.-C.; Ullah, S. Machine learning in earthquake-and typhoon-triggered landslide susceptibility mapping and critical factor identification. Environ. Earth Sci. 2021, 80, 233. [Google Scholar] [CrossRef]
  56. Günther, A.; Van Den Eeckhaut, M.; Malet, J.-P.; Reichenbach, P.; Hervás, J. Climate-physiographically differentiated Pan-European landslide susceptibility assessment using spatial multi-criteria evaluation and transnational landslide information. Geomorphology 2014, 224, 69–85. [Google Scholar] [CrossRef]
  57. Wu, B.; Shi, Z.; Zheng, H.; Peng, M.; Meng, S. Impact of sampling for landslide susceptibility assessment using interpretable machine learning models. Bull. Eng. Geol. Environ. 2024, 83, 461. [Google Scholar] [CrossRef]
  58. Khabiri, S.; Crawford, M.M.; Koch, H.J.; Haneberg, W.C.; Zhu, Y. An assessment of negative samples and model structures in landslide susceptibility characterization based on Bayesian network models. Remote Sens. 2023, 15, 3200. [Google Scholar] [CrossRef]
Figure 1. Study area overview.
Sustainability 17 04348 g001
Figure 3. Research workflow diagram.
Sustainability 17 04348 g003
Figure 4. Bar chart of information quantity for each factor. PF, DL, PL, GL, WB, BeL, UA, RS, ITCL, SL, ML, and BrL stand for Paddy Field, Dryland, Forest Land, Grassland, Water Bodies, Beach Land, Urban Area, Rural Settlements, Industrial and Transport Construction Land, Sandy Land, Marshland, and Bare Land respectively. AInR, AIgR, BIR, BVR, CSR, NIR, NVR, MR, MSR, SSR, and LS stand for Acidic Intrusive Rock, Acidic Igneous Rock, Basic Intrusive Rock, Basic Volcanic Rock, Carbonate Sedimentary Rock, Neutral Intrusive Rock, Neutral Volcanic Rock, Metamorphic Rock, Mixed Sedimentary Rock, Siliciclastic Sedimentary Rock, and Loose Sediments respectively. FS, DecS, DevS, and VS stand for Formation Stage, Decline Stage, Development Stage, and Vigorous Stage respectively.
Sustainability 17 04348 g004
Figure 5. Heatmap of evaluation factor correlations.
Sustainability 17 04348 g005
Figure 6. Susceptibility zoning map of RGH. (a) RF model evaluation results; (b) GBDT model evaluation results; (c) XGBoost model evaluation results; (d) ANN model evaluation results; (e) SVM model evaluation results; (f) LR model evaluation results; (g) Weighted Information Value Model evaluation based on AHP results; (h) IV Model evaluation results.
Sustainability 17 04348 g006
Figure 7. ROC curves of each model.
Sustainability 17 04348 g007
Figure 8. Comprehensive characteristics of key indicators in susceptibility zoning of multiple models.
Sustainability 17 04348 g008
Table 1. Results of multicollinearity diagnostics.
Evaluation FactorVIF Value
DEM2.123
Soil erodibility factor (K)1.001
Rainfall erosivity (R)2.594
Relief amplitude2.435
Distance to fault1.318
Slope2.809
Fractional vegetation cover1.005
Aspect1.037
Land use type1.141
Lithology1.695
Regional stability2.308
Table 2. Pairwise comparison matrix.
S1S2S3S4S5S6S7S8S9S10S11
S111/25222221/265
S221734444286
S31/51/711/51/31/41/41/41/621
S41/21/35133221/254
S51/21/431/31111/21/333
S61/21/441/3111/21/31/432
S72/21/441/21211/21/332
S81/21/441/223211/232
S921/2623432165
S101/61/81/21/51/31/31/31/31/611/2
S111/51/611/41/31/21/21/21/521
CTThe maximum eigenvalue λmax = 11.4258, and the consistency ratio CR = 0.028 < 0.1, which passes the consistency test
S1, S2, …, S11 represent DEM, slope, aspect, terrain undulation, regional stability, K value, R value, distance to fault, lithology, fractional vegetation cover, and land use type, respectively. CT represents the consistency test.
Disclaimer/Publisher’s Note: The statements, opinions and data contained in all publications are solely those of the individual author(s) and contributor(s) and not of MDPI and/or the editor(s). MDPI and/or the editor(s) disclaim responsibility for any injury to people or property resulting from any ideas, methods, instructions or products referred to in the content.

