Article

Identification of Heavy Metal Sources and Health Risk Assessment in Coal Mining Area Soils Using Mercury Isotopes and Positive Matrix Factorization (PMF) Model

1
Anhui Province Engineering Research Center for Mine Ecological Remediation, Anhui University, Hefei 230601, China
2
School of Environment and Energy Engineering, Anhui Jianzhu University, Hefei 230601, China
*
Author to whom correspondence should be addressed.
Sustainability 2025, 17(10), 4334; https://doi.org/10.3390/su17104334
Submission received: 25 March 2025 / Revised: 8 May 2025 / Accepted: 8 May 2025 / Published: 10 May 2025

Abstract

:
This investigation focuses on anthropogenic impacts on metallic element distribution within coal mining ecosystems, particularly addressing soil contamination risks in the Linhuan region. Researchers conducted comprehensive sampling and analysis of surface soil contaminants, specifically quantifying mercury, copper, zinc, iron, aluminum, and lead concentrations. Through integrated application of receptor modeling (PMF) and mercury isotopic fingerprinting methodology, this study established a quantitative assessment framework for pollution source apportionment. The multi-technique approach enables precise identification of contamination pathways and proportional contributions from different anthropogenic activities in the mining environment. Coupled with a human health risk assessment model, the health risks associated with specific sources were evaluated. The results indicate that the concentrations of Hg, Cu, Zn, Fe, Al, and Pb in the soil of the study area are 9.49, 2.80, 4.01, 11.79, 6.32, and 1.03 times the soil background values, respectively, suggesting a certain degree of enrichment of these six heavy metals in the soil. The PMF source contribution results show that the soil heavy metals in the study area have three sources: natural soil formation, a mixture of coal combustion and traffic activities, and coal mining activities, with contribution rates of 31.23%, 31.59%, and 37.18%, respectively. The health risk assessment results for specific sources indicate that the non-carcinogenic risks of soil heavy metals in the local area require sufficient attention. Hg is the main cause of non-carcinogenic health risks for both groups, making it a priority element for controlling soil heavy metal health risks. Coal mining activities are the main source (52.4%) of non-carcinogenic risks, making them a priority control source for soil heavy metal health risks in the study area. These findings provide a theoretical basis for enhancing the refined management of heavy metal pollution and the prevention of health risks in soils of coal mining areas.

1. Introduction

The sustained anthropogenic pressure from coal extraction operations has introduced substantial quantities of metallic pollutants into adjacent environmental matrices, triggering irreversible ecosystem degradation [1,2]. These toxic elements exhibit latent environmental persistence characterized by biogeochemical stability and resilience to natural degradation processes, facilitating progressive bioaccumulation within pedological systems [3,4,5]. Multimodal transmission mechanisms—including respiratory absorption, dermal permeation, and involuntary ingestion—establish critical bioaccumulation pathways for soil-residing metallic species, ultimately manifesting multisystem toxicity in exposed populations [6,7,8,9]. Coal mining areas typically have complex anthropogenic activities, leading to a complex mix of sources of soil heavy metals within a certain range [10,11]. Implementing source-specific toxicological profiling and geochemical provenance tracing of pedogenic metal(loid)s constitutes a critical scientific foundation for developing targeted remediation strategies and formulating exposure mitigation protocols in mining-impacted ecosystems.
Accurate identification of sources of soil heavy metal pollution is key to controlling heavy metal contamination and formulating remediation measures. However, due to differences in factors such as the biological toxicity and effectiveness of heavy metals from various pollution sources, the source apportionment results cannot be directly used as the sole basis for selecting priority control sources. To quantify the health risks induced by specific pollution sources, coupling source apportionment with health risk assessment has become a common approach. Systematically integrating source apportionment and human exposure risk assessment helps to further understand the source-specific health risks of soil heavy metals to humans, thus facilitating the development of source-oriented pollution control measures.
Contemporary environmental forensics increasingly relies on advanced chemometric receptor modeling, with multivariate statistical techniques like positive matrix factorization (PMF) and absolute principal component scores–multiple linear regression (APCS-MLR) emerging as predominant tools for pollutant source discrimination [12,13,14]. PMF distinguishes itself through incorporation of non-negative matrix factorization algorithms that simultaneously optimize source fingerprints and contribution matrices, enabling robust resolution of complex environmental signatures [13,15]. Notably, comparative analyses reveal fundamental divergences in algorithmic architecture: While Unmix and APCS-MLR demonstrate conservative source resolution capacity, PMF’s probabilistic optimization framework typically identifies greater source dimensionality. This divergence stems from inherent differences in covariance matrix treatment and residual error minimization protocols governing source allocation processes. Accurately determining the number of pollution sources and their contributions is crucial to this study, as it helps prioritize source control and assess the health risks they induce. It is worth noting that source apportionment results from a single method inherently carry some uncertainty, and the combined application of multiple methods has become a trend in source apportionment research, offering more reliable and accurate results. Metal isotopes, with their “fingerprint” characteristics, show differences in isotope ratios among samples from various sources, making them useful for tracking and quantifying heavy metal pollution from different environmental media [16,17,18]. Among them, Hg isotopes are one of the most widely used methods and have become an effective tool for tracking Hg sources in the environment [19,20]. The seven stable natural isotopes of Hg can undergo unique mass-dependent fractionation (MDF) and mass-independent fractionation (MIF). Both MDF and MIF can be used for Hg source identification. For instance, MDF is a key indicator for industrial sources such as mining, smelting, and coal combustion, while MIF indicates long-range atmospheric transport of Hg [21]. In conclusion, isotope methods can be used to trace the sources of specific heavy metals in the environment and assist in verifying the estimates from PMF source apportionment, thereby enhancing the reliability of the results.
This investigation focuses on the Linhuan coal mining zone, a historically significant production base in Anhui Province, China, aiming to address the persistent environmental consequences of mining operations. Prolonged deposition of coal-derived waste materials has induced progressive accumulation of metallic contaminants in local soils, creating discernible exposure threats to regional populations. This study pursues three interconnected objectives: (1) systematic analysis of soil pollution characteristics for six target elements (Hg, Cu, Zn, Fe, Al, Pb); (2) integration of receptor modeling (PMF) with mercury isotope fractionation analysis to quantify pollution source contributions; (3) development of a source-oriented risk assessment model to differentiate health impacts from identified contamination pathways.
The results of this study can provide theoretical support for effectively preventing human health risks induced by soil heavy metals in coal mining areas.

2. Methods and Materials
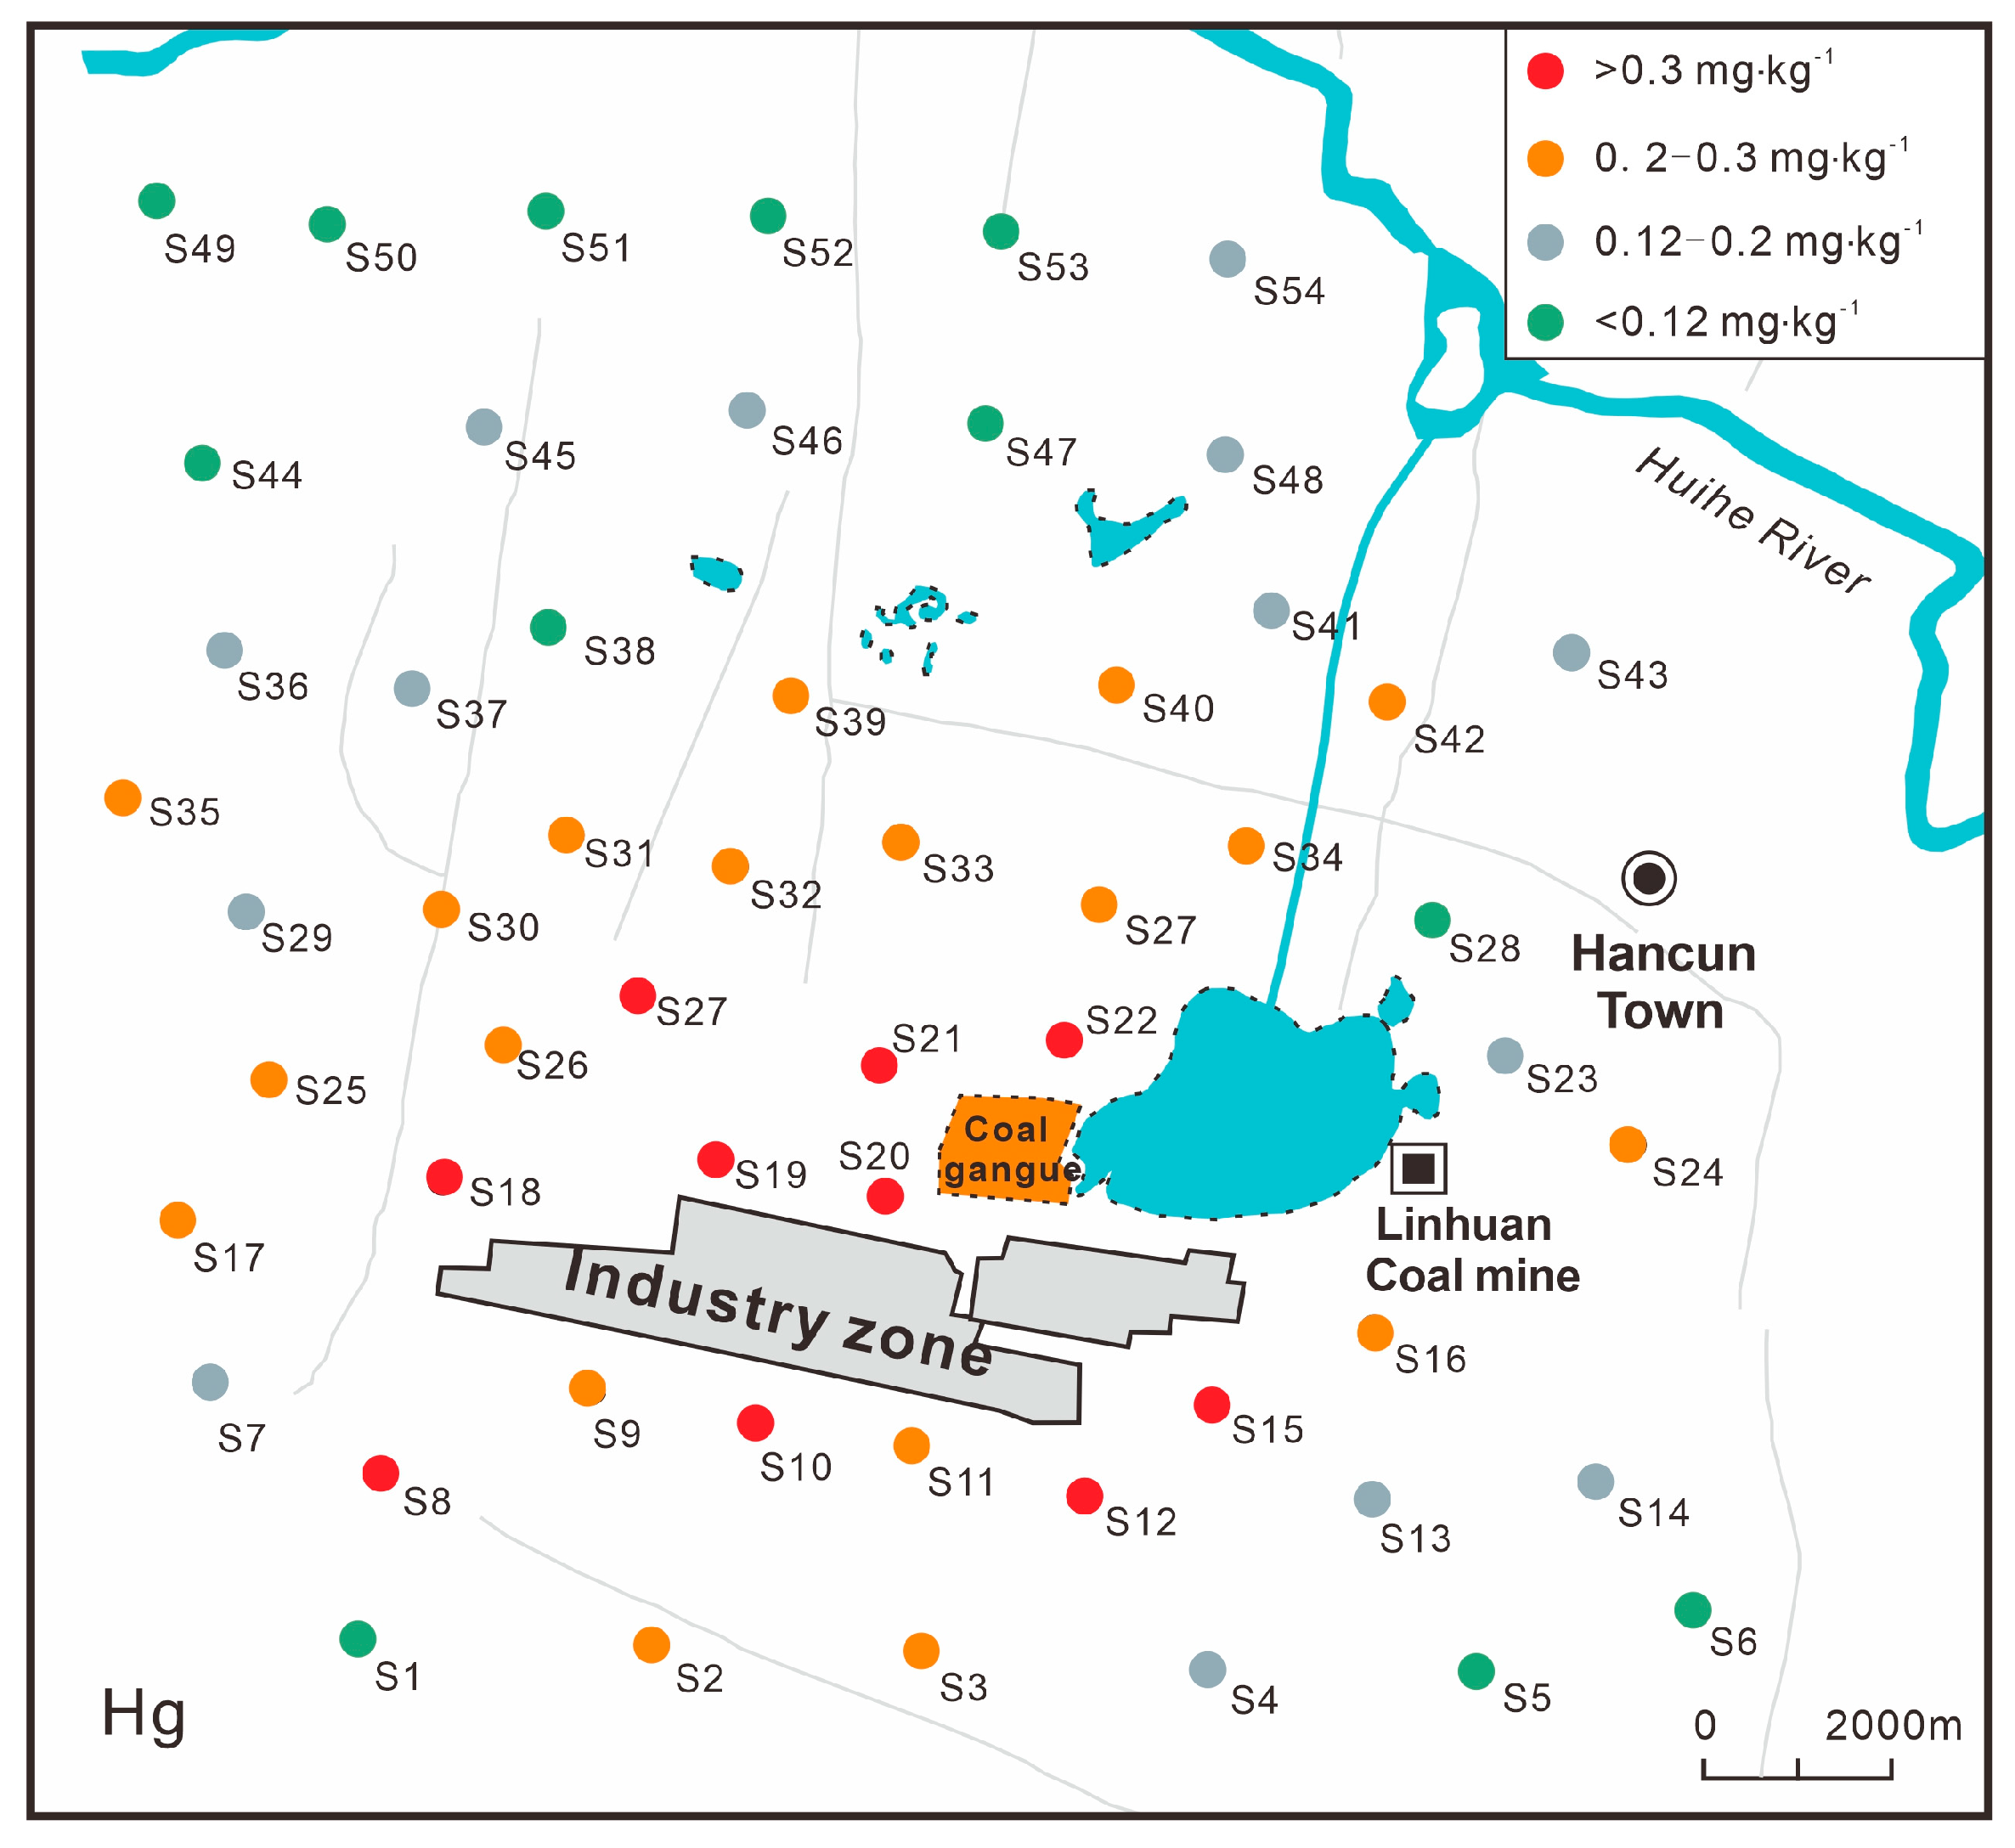
2.1. Study Area

The study area is located in Suixi County, southwest of Huaibei City, Anhui Province, China (33°36′50″~33°40′47″ N, 116°34′25″~116°44′27″ E). It is approximately 30.0 km east of Suzhou City and about 40.0 km north of Huaibei City. Linhuan Town, where the mining deposits are mainly coal, has a coal reserve of 165 million tons, primarily distributed in the southern part of the town. The area has favorable soil and water resources conditions and abundant coal resources. The climate in the mining area belongs to the temperate zone, characterized by abundant sunshine throughout the year and distinct four seasons, representing a typical monsoon climate. The mean annual temperature is 14.5 °C, with a mean annual precipitation of 830.0 mm and a mean annual evaporation of 1400.0~1890.0 mm. Precipitation is concentrated in July and August, with overall humid conditions. The dominant wind direction in summer is southeast, while in winter, it is northeast. The natural water system in the area is the Hui River, the largest surface water system flowing through the mine. The Hui River belongs to the Huaihe River system, characterized as a small seasonal river flowing from northwest to southeast, passing through the mining area. The study area is located in the Huaihe River basin and features the terrain of a plain valley [1,11,22]. The mining area is intersected by several important transportation routes, providing convenient access.

2.2. Sample Collection

According to field investigations, 54 sampling points were selected in the mining area, industrial area, and surrounding soil in the study area, aiming to cover the entire research area as comprehensively as possible and accurately reflect the soil pollution situation and characteristics. The layout of the study area and sampling points is shown in Figure 1. Grid sampling method was employed in this study to ensure the representativeness of soil samples. Approximately 100 m2 area near each sampling point was sampled using the “five-point sampling method”, where 5 sub-samples were merged into 1 sample. GPS was used to record each sampling point. After collecting soil samples, weeds, gravel, roots, and other debris were removed. The surplus samples were removed using the quartering method to maintain the sample weight at around 1 kg. Subsequently, the collected soil samples were naturally air-dried under shaded conditions, ground finely using a mortar, thoroughly homogenized, and passed through a nylon sieve for further analysis. The samples were microwave digested using the HNO3-HF-HClO4 digestion system, and the contents of elements such as Cu, Zn, Fe, Al, and Pb in the samples were determined using an inductively coupled plasma mass spectrometer (ICP-MS, Agilent 7500cx, Santa Clara, CA, USA). The detection limits for Cu, Zn, Fe, Al, and Pb were 0.04, 0.03, 0.5, 0.2, and 0.004 mg·kg−1, respectively. Mercury determination was performed using a direct mercury analyzer (DMA-80; Milestone SrL, Sorisole, Italy), and the related treatment methods and quality control measures are described in Chen et al., 2024 [23]. Quality control was carried out using standard materials (GBW07403a), parallel samples, and blank samples. The sample recovery rates ranged from 90% to 110%, and the measurement errors were within the allowable range.

2.3. Sample Analysis

For pH measurement, 10 g of soil was mixed with 25 mL of deionized water, shaken horizontally for 2 min, allowed to settle for 30 min, and measured with a pH meter (Schott, Mainz, Germany) within 1 h. Soil organic matter (SOM) refers to the complex mixture of organic compounds in soil, derived from decomposed plant and animal residues, microbial biomass, and humus, which plays a critical role in soil fertility, structure, and nutrient cycling. Soil organic carbon (SOC) was determined using a vario TOC cube elemental analyzer (Elementar, Langenselbold, Germany) after carbonate removal. SOM content was calculated by multiplying SOC by 1.724. The correlation coefficient was calculated using Pearson’s correlation coefficient. The calculation of Igeo is shown in Text S1.
The geological accumulation index (Igeo) was calculated using the following equation:
I g e o = log 2 C i / 1.5 S i
where Igeo is the geological accumulation index of heavy metal in soil; Ci is the measured content value of heavy metal, mg·kg−1; Si is the background value.

2.4. Determination of Mercury Isotopes

The sample pretreatment procedure prior to the determination of Hg isotopes is described in detail in Hu et al., 2023 [24]. A brief description is provided here. The soil sample is weighed and placed in freshly prepared aqua regia solution (HCl: HNO3 = 3:1) at 95 °C for 3 h. After digestion, the sample is placed in a 20% acid solution. Subsequently, the solution is filtered using a 0.22 μm plastic syringe filter, and the filtered solution is collected in a polypropylene bottle for Hg isotope analysis.
The mercury isotope analysis of the samples was conducted at the Institute of Surface Earth System Science, Tianjin University, using a CV-MC-ICP-MS (Nu Plasma 3D, Nu Instruments, Wrexham, UK). An online cold vapor generator (HGX-200, CETAC, Omaha, NE, USA) was utilized with SnCl2 solution to reduce captured mercury in solution to Hg0 vapor [25]. The sample–standard bracketing (SSB) method was employed during testing, with each sample undergoing at least three measurements. Thallium standard solution (NIST SRM 997) was added as an internal standard to correct for mass discrimination effects during testing [26], with specific testing conditions and procedures referenced from Sun et al., 2014 [27].
Mercury isotopes were measured using a plasma mass spectrometer (MC-ICP-MS). The mercury isotope mass-dependent fractionation (MDF) was calculated based on the NIST SRM-3133 standard, with δ representing MDF and Δ representing mass-independent fractionation (MIF), expressed in per mil (‰). The calculation formulae are as follows:
The calculation formula for MDF is as follows:
δxxxHg(‰) = 1000 × [(xxxHg/198Hg)sample/(xxxHg/198Hg)standard − 1]
where xxx represents isotopes 199, 200, 201, 202, and 204.
The calculation formula for MIF is as follows [28]:
Δ199Hg(‰) = δ199Hg − δ202Hg × 0.2520
Δ200Hg(‰) = δ200Hg − δ202Hg × 0.5024
Δ201Hg(‰) = δ201Hg − δ202Hg × 0.7520
Δ204Hg(‰) = δ204Hg − δ202Hg × 1.4930
The uncertainties assessed for the analysis using NIST SRM 3177 standard solution yielded Δ199Hg, Δ201Hg, and δ202Hg values of −0.01 ± 0.02‰ (2 SD), −0.02 ± 0.05‰ (2 SD), and −0.53 ± 0.12‰ (2 SD), respectively, consistent with a previous study [28]. The detection limit of Hg is 0.8 and the relative standard deviation (RSD) is 2.56%.

2.5. PMF Model

The USEPA PMF5.0 model was utilized for allocating soil pollutant sources [11]. The calculation process is as follows:
x i j = k = 1 p g i k f k j + e i j
where x i j is the concentration matrix of the j-th pollutant in the i-th sample; f k j is the concentration matrix of the j-th pollutant in the k-th source; g i k is the contribution rate of the k-th source to the i-th sample; e i j is the residual matrix of the j-th pollutant in the i-th sample, representing the unexplained part of the model for x i j .
Factor contributions and distributions were computed using the PMF model, with the minimization of the objective function (Q). The calculation formula for Q is as follows:
Q = i = 1 n j = 1 m x i j k = 1 p g i k f k j u i j
According to Liu et al., 2022 [19], the formula for calculating uij, the uncertainty of the j-th pollutant in the i-th sample, is as follows: u i j = 0.1 × x i j + M D L 3 .
In the equation, MDL represents the minimum detection limit of pollutant j in sample i.

2.6. Health Risk Assessment Model

Using the USEPA health risk assessment model in conjunction with the PMF model to analyze the sources of pollutants in soil and assess human health risks, Hg, Cu, Zn and Pb were calculated. In this study, the exposure pathways are categorized into three modes: oral ingestion, inhalation (particle intake), and dermal contact intake. The calculation formulas are as follows:
Soil oral exposure ratio:
O I S E R = c × O S I R × E F × C F × E D B W × A T
Soil inhalation particulate matter exposure ratio:
P I S E R = c × P M 10 × C F × D A I R × P I A F × E D × f s p o × E F O + f s p i × E F I B W × A T
Soil skin contact exposure ratio:
D C S E R = c × S A E × S S A R × E F × A B S × C F × E D × E v B W × A T
The hazard index (HI) and cancer risk (CR) of soil pollutants are calculated as follows:
H Q i = E R i j R F D i j
In the formula, E R i j is the exposure dose of the i-th pollutant in the j-th exposure pathway; R F D i j is the reference dose of the i-th pollutant in the j-th exposure pathway (mg·kg−1·d−1); H Q i is the hazard value of the i-th pollutant in all exposure pathways. The calculation formula for total HI in soil is as follows:
H I = H Q i
In the equation, HI represents the total hazard index of all pollutants in the soil.
C R i = E R i j × S F i j
where S F i j represents the carcinogenic slope factor of the i-th pollutant in the j-th exposure pathway, while E R i j denotes the cancer risk of the i-th pollutant in the j-th exposure pathway. C R i is the cancer risk of the i-th pollutant in all exposure pathways. The total cancer risk calculation in soil can be expressed as follows:
T C R = C R i
The formula represents the total cancer risk (TCR) of all pollutants present in the soil.
The specific parameters and their values are detailed in Tables S1 and S2. When HI < 1, the risk is considered low or negligible; when HI > 1, non-carcinogenic risk is considered to exist. The total carcinogenic risk index for a single heavy metal element across four exposure pathways is represented by CR, and the total carcinogenic risk index for multiple heavy metals is represented by TCR. When CR or TCR < 10−6, it indicates no significant carcinogenic risk; when CR or TCR is between 10−6 and 10−4, it indicates a possible carcinogenic risk; when CR or TCR ≥ 10−4, it indicates a significant carcinogenic risk.

3. Results

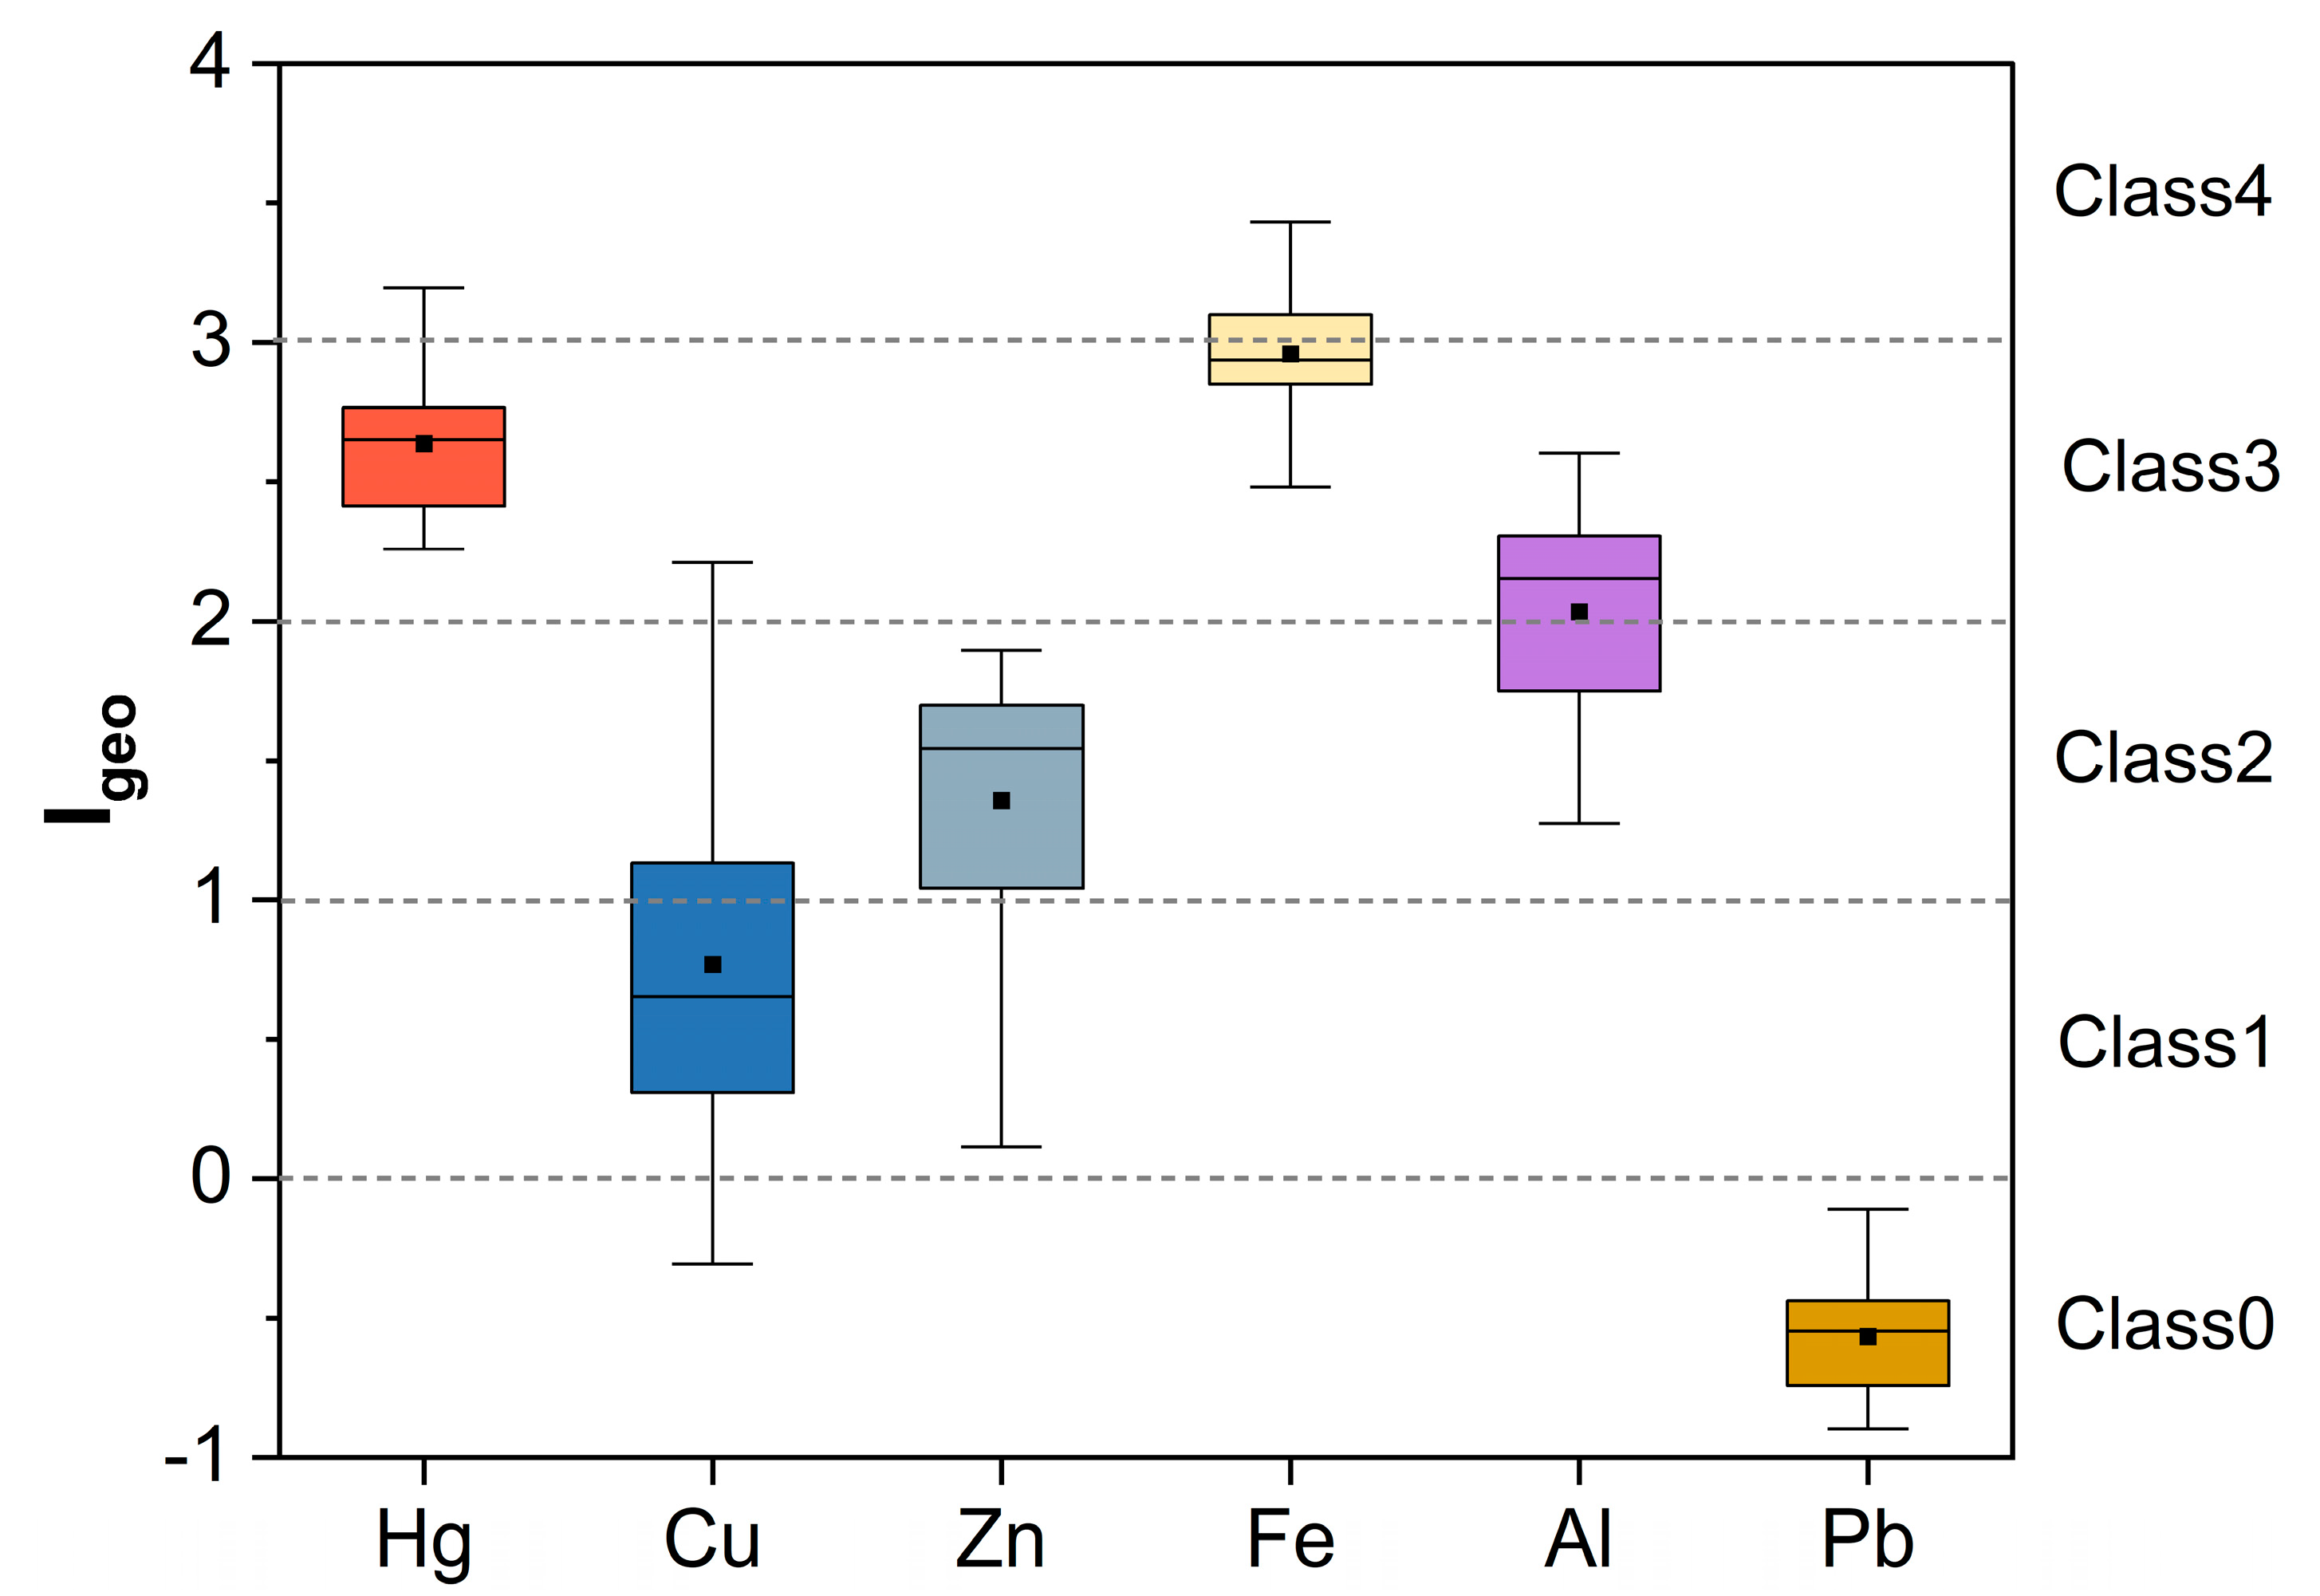
3.1. Descriptive Statistics of Heavy Metal Contents in Soil

The median contents of heavy metals Hg, Cu, Zn, Fe, Al, and Pb are 26, 45.5, 256.5, 34541.5, 43874.5, 26.7 mg·kg−1, respectively, and the average contents of heavy metals are 0.261, 54.1, 235.3, 35477.4, 41614, and 26.7 mg·kg−1, respectively. Among them, the ratios of Hg, Cu, Zn, Fe, Al, and Pb to the soil background values of Anhui Province are 9.49, 2.80, 4.01, 11.79, 6.32, and 1.03, respectively (Table 1). The spatial distribution of Hg content of soil in the study area is shown in Figure 2. There was a clear correlation between Hg values and the distance from the sampling points to the industry zone. The sampling points near the industry zone had severe contamination, while those farther away showed a significant reduction in contamination. Soils exhibit neutral–alkaline pH (6.5–8.2), matching regional mining soil patterns [29], likely influenced by coal gangue leachate alkalinity. SOM varied widely (8.9–34.5; mean: 16.60), which may be associated with agricultural activities such as cultivation on reclaimed land [30].
The Igeo results are shown in Figure 3. Based on evaluation criteria for Igeo, Hg and Fe were moderately-to-heavily contaminated or heavily contaminated in all soil samples; Al was moderately contaminated to moderately-to-heavily contaminated; Cu and Zn had relatively light contamination but had high variability; Pb had non contamination. The order of mean Igeo values in all samples was Fe (2.96) > Hg (2.64) > Al (2.03) > Zn (1.35) > Cu (0.77) > Pb (−0.56).
The coefficient of variation (CV) quantifies spatial dispersion of soil metal concentrations, with elevated CV values (>36%) indicating strong anthropogenic influences [32,33]. Based on standardized thresholds [34], variability is stratified as low (CV ≤ 15%), moderate (15–36%), and high (>36%). Analysis revealed a descending CV order as follows: Cu (45.8%) > Hg (38.2%) > Zn (28.1%) > Pb (24.5%) > Al (18.7%) > Fe (8.3%). Fe demonstrated minimal dispersion (CV = 8.3%), classified as low variability, while Al (18.7%), Pb (24.5%), and Zn (28.1%) fell within moderate ranges. Notably, Hg exhibited pronounced heterogeneity (CV = 38.2%). While Fe concentrations showed uniform spatial distribution, other elements demonstrated varying anthropogenic interference intensities, with Cu displaying the most significant spatial heterogeneity due to human activities.
The correlation analysis reveals that Zn is significantly positively correlated with Pb and Hg (p < 0.05); Fe is significantly positively correlated with Al (p < 0.05). These results in Table 2 suggest that these heavy metals may have similar or the same sources of pollution. The correlation between the remaining heavy metals is relatively weak, indicating significant differences in their sources. Coal mining activities produce coal gangue with high concentrations of heavy metal elements. Through processes such as leaching by rainwater and weathering, internal heavy metals can migrate and transform into the surrounding soil. This is considered to be a significant source of heavy metal pollution [35].

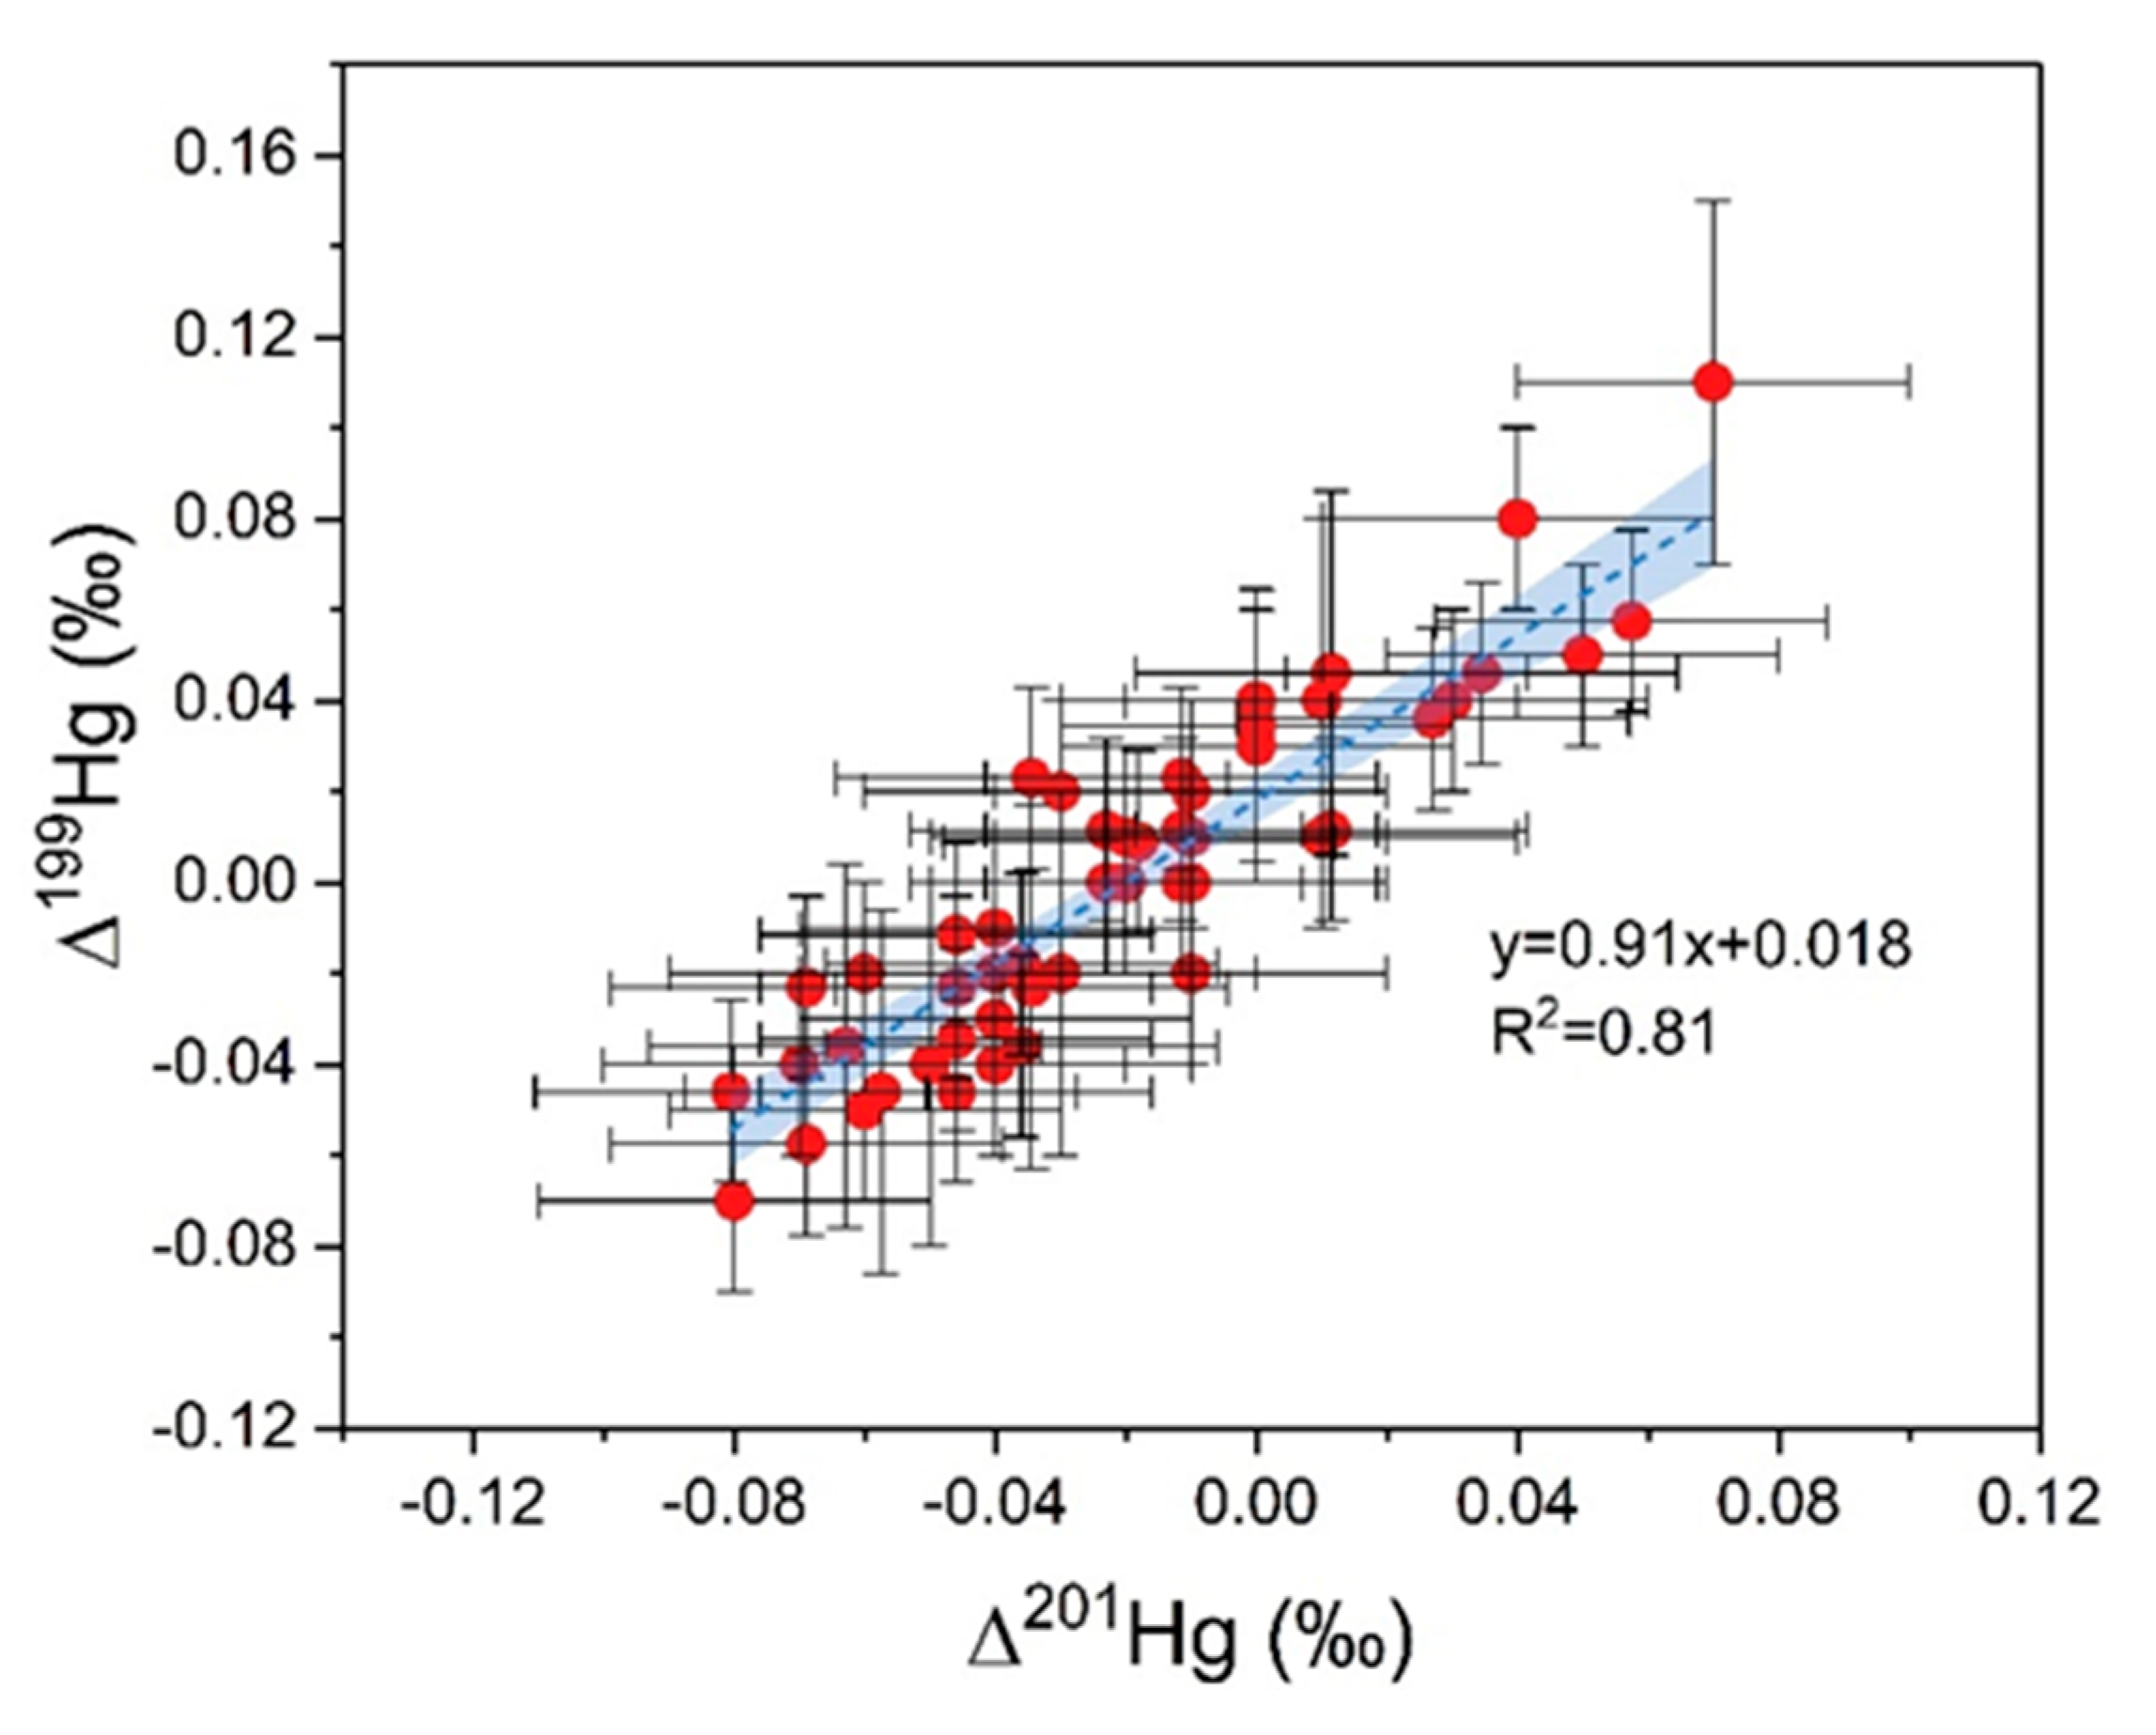
3.2. Characteristics of Hg Isotope in Soil

The range of δ202Hg in the soil of the study area is −1.27‰ to 0.04‰, with a mean of −0.41 ± 0.31‰; the range of Δ199Hg is −0.07‰ to 0.11‰, with a mean of 0.01 ± 0.03‰; the range of Δ201Hg is −0.08‰ to 0.07‰, with a mean of −0.03 ± 0.03‰. Compared with other study areas, the mercury isotope MDF in the soil in this study is relatively large.

4. Discussion

4.1. Sources and Transformation of Hg

Mercury mass-dependent fractionation (MDF) predominantly originates from environmental processes (physical/chemical/biological interactions), exhibiting dynamic isotopic modifications. Key mechanisms, including Hg volatilization, photoreduction, and microbial methylation–demethylation cycles, drive negative δ202Hg shifts in Hg0, explaining the consistent negative MDF signatures we observed (Figure 4). Intensive mining operations have induced substantial mercury accumulation through hydrological mobilization of tailings and coal gangue constituents [36,37,38,39]. Isotopic profiles (δ202Hg/Δ199Hg) demonstrate preserved source fingerprints characteristic of mining inputs. The negligible contribution from natural mercury reservoirs (<5% background levels) confirms anthropogenic dominance, with principal sources identified as (1) geogenic weathering, (2) gangue weathering products, and (3) coal combustion residues.
Mercury mass-independent fractionation (MIF) primarily arises from isotopic fractionation mechanisms during Hg volatilization, surface adsorption, and photoredox processes. Current understanding attributes MIF signatures to synergistic nuclear volume effects (NVEs) and magnetic isotope effects (MIEs) [40,41]. Photochemical Hg2+ reduction under solar irradiation generates characteristic NVE-dominated fractionation patterns, typically producing Δ199Hg/Δ201Hg regression slopes approaching 1.0. Our data demonstrate a 0.90 Δ199Hg/Δ201Hg regression slope (Figure 5), aligning with established Hg2+ photoreduction pathways. Although surface-mediated photolytic processes occur ubiquitously in soil matrices, their isotopic imprint remains secondary to bulk Hg inventory given elevated THg concentrations (12.8–45.3 mg·kg−1). This congruence with East China coal mercury isotopic profiles (negative MDF dominance, minimal MIF signals [42]) substantiates coal-derived Hg as the principal contamination vector in the studied pedological systems.
Compared to other research areas (Table 3), the δ202Hg values in this study (−1.27‰ to 0.04‰; mean: −0.41 ± 0.31‰) overlap with ranges from Anhui (−0.79‰ to 0.02‰) but exhibit a broader span than Guizhou (−0.30‰ to 0.41‰). For Δ199Hg, this study (−0.07‰ to 0.11‰; mean: 0.01 ± 0.03‰) shows a wider variability compared to most regions, though its mean aligns closely with Anhui (0.01 ± 0.03‰). Notably, the Δ201Hg values here (−0.08‰ to 0.07‰; mean: −0.03 ± 0.03‰) include both lighter and heavier signatures, suggesting diverse Hg sources or fractionation processes. Overall, the isotopic signatures highlight intermediate contamination levels, bridging characteristics of both polluted and background systems.

4.2. Identification of Heavy Metal Sources

To further clarify the sources of heavy metal pollution in the study area and their contributions, the PMF model was used to quantitatively apportion the heavy metals in the soil of the study area by source. The raw data and relevant uncertainty data were imported into PMF 5.0 software, and the signal-to-noise ratios of the six heavy metal elements analyzed were all greater than 1, classified as “Strong”. The factor numbers were set to 2–5, with the number of runs set to 20 times as recommended by the system for each factor. The PMF model was run with randomly selected initial points. After calculations, it was determined that setting the number of factors to three resulted in a ratio of QRobust to QTrue (84.0/84.0) which approached 1 and stabilized, achieving the best model fit. The residuals for the heavy metal element content were all within the range of −3 to 3. Except for Pb, whose R2 value was 0.43, the R2 values for the other heavy metals were all greater than 0.6 (with Cu and Zn being 0.99 and 0.94, respectively), indicating that the source apportionment results of the PMF model were generally good and capable of providing accurate results. The pollution source profiles and contributions analyzed by the PMF model are shown in Figure 6 and Figure 7.
Factor 1 (F1) demonstrates dominant loadings of Fe (55.15%) and Al (65.43%), with geochemical coherence evidenced by their strong correlation (r = 0.68). The low coefficient of variation (CV = 8.3%) for Fe confirms minimal anthropogenic disturbance, aligning with its classification as a lithogenic reference element [22]. Al’s stable association with Fe through aluminosilicate weathering products further substantiates their common geogenic origin. Both elements exhibit characteristic pedogenic distribution patterns—with Fe as a major crustal constituent and Al primarily bound in clay mineral lattices [41]. This dual evidence (statistical covariance + geochemical stability) confirms F1’s derivation from natural weathering processes.
Factor 2 (F2) exhibits dominant Cu loading (66.08% contribution), with its elevated mean concentration (54.1 mg·kg−1, 2.8× background) and high variability (CV = 45.8%) confirming intense anthropogenic inputs. Thermoelectric generation emerges as a primary contributor—coal combustion residuals from adjacent power facilities release Cu-enriched fly ash (3.53× background [42]), exhibiting atmospheric deposition-mediated soil enrichment. Concurrently, vehicular emissions contribute through tribological sources: copper-containing lubricants (0.5–2.3% Cu [48]) and tire abrasion particulates (120–450 mg·kg−1 Cu [18]) collectively enhance environmental Cu burdens. This dual-origin framework (energy production + transportation systems) accounts for F2’s mixed-source signature, with coal-derived particulates showing higher environmental mobility (leachability index = 0.67) than traffic-sourced Cu (index = 0.29).
Factor 3 (F3) demonstrates tri-element synergy with Hg (52.4%), Zn (72.5%), and Pb (50.8%) exhibiting moderate dispersion metrics (CV: Hg = 38.2%, Zn = 28.1%, Pb = 24.5%) and pronounced anthropogenic enrichment. Historical extractive operations have established persistent contamination vectors through particulate deposition (gangue weathering) and aeolian transport of smelting particulates [49,50]. Mercury isotopic signatures (negative δ202Hg dominance, Δ199Hg < 0.2‰) align precisely with East China coal basin profiles [40], confirming coal-derived Hg inputs. Zinc provenance is attributed to gangue weathering particulates (Zn = 650 ± 120 mg·kg−1 [51]) and atmospheric deposition of combustion byproducts. Strong inter-element covariance (Hg-Zn r = 0.82, Hg-Pb r = 0.75, Zn-Pb r = 0.68) establishes their co-migration mechanism through mining-associated pathways. This multivariate evidence confirms F3’s genesis in coal cycle processes (extraction → combustion → waste deposition).
In conclusion, the soil heavy metals in the study area originate from three sources: natural weathering, a mixed source of coal combustion and traffic activities, and mining activities, with contribution rates of 31.23%, 31.59%, and 37.18%, respectively.

4.3. Human Health Risks from Specific Sources

Probabilistic risk assessment outcomes (Table 4) reveal subthreshold toxicological impacts across exposure pathways, with cumulative HI values for multi-source exposures measuring 0.71 (adults) and 0.63 (children)—both demonstrating magnitudes below regulatory concern thresholds (HI < 1). This quantitative analysis confirms the absence of significant systemic health risks from source-resolved metal(loid) exposures in both demographic cohorts, indicating effective containment of non-carcinogenic hazards within acceptable safety parameters. For individual heavy metal elements, the HI values for adults and children under different pollution source scenarios are also below 1. However, the total HI values for both population groups are close to the risk threshold of 1. Additionally, due to the omission of certain elements in the health risk calculation such as As and Cd. Arsenic can enter the human body through diet and inhalation pathways, leading to diseases of the nervous and digestive systems, posing a significant risk to human health [52]. Therefore, the actual HI in the study area is to some extent higher than the calculated HI in this study, indicating that the non-carcinogenic health risks associated with soil heavy metals in the local area need to be given sufficient attention. It is noteworthy that Hg is the main contributing factor to non-carcinogenic health risks for both population groups, making Hg the priority control element for soil heavy metal health risks in the study area. Regarding carcinogenic risks, the TCR values for adults and children from different pollution sources are 1.36 × 10⁻⁹ and 1.22 × 10⁻⁹, respectively, both at acceptable levels. Current toxicological repositories exhibit critical toxicokinetic data deficiencies for specific metallic species, particularly regarding carcinogenic potency factor development [52]. This methodological constraint compromises risk characterization fidelity, suggesting latent carcinogenic potential might be underestimated in our exposure modeling framework. Chromium and arsenic emerged as critical risk drivers, with multipathway chronic exposure scenarios (oral/dermal/inhalation) demonstrating dual-threat profiles: (1) non-carcinogenic manifestations, including dermatological pathologies and systemic organotoxicity, and (2) carcinogenic risk indices exceeding 10−4 thresholds in sensitive subpopulations [53].
The non-carcinogenic health risks posed by soil heavy metals to local populations demand prioritized intervention. PMF-based source-specific risk apportionment reveals the following contribution hierarchy to health hazards: coal mining activities (58%) > natural weathering (32%) > mixed anthropogenic sources (10%). This dominance of coal-related sources directly correlates with mercury’s role as the primary risk driver, given its elevated toxicity (HI contribution: 47%). To mitigate risks, three key measures are proposed: (1) implement mercury-focused pollution monitoring networks; (2) enhance coal gangue recycling through advanced utilization technologies; (3) establish containment systems for gangue leachate. Notably, current USEPA risk assessment methods based on total metal concentrations likely overestimate actual hazards by 30–50% [53], as only bioavailable fractions (e.g., soluble Hg2+) induce toxic effects. Future studies should integrate bio accessibility-adjusted exposure models incorporating speciation analysis and pathway-specific absorption rates to refine risk estimations.

5. Conclusions

This investigation establishes a quantitative framework integrating mercury isotopic fingerprinting and receptor modeling (PMF) with pathway-specific risk assessment to delineate source-to-exposure relationships in coal mining-impacted pedological systems. The hybrid methodology advances conventional source apportionment paradigms by enabling concurrent quantification of contamination source contributions and their differential health impact potentials. Three principal emission vectors were resolved: geogenic weathering (31.2%), anthropogenic combustion–transport complexes (31.6%), and mining operations (37.2%). Notably, mining-derived inputs emerged as the critical risk driver, contributing 58% of non-carcinogenic hazard indices through mercury-dominated exposure pathways. This dual-dimensional analysis (source partitioning + risk allocation) provides actionable intelligence for targeted remediation prioritization, identifying coal cycle activities and mercury as key control targets. The health risk assessment results show that the non-carcinogenic risks of local soil heavy metals to two groups of people require sufficient attention. Hg is the main cause of non-carcinogenic health risks, making it the priority control element for health risks. Coal mining activities are the primary source of non-carcinogenic risks (52.4%), making it a priority control source. Since only a portion of heavy metals that enter the human body can be absorbed and cause harm, future studies should consider adjusting health risk assessment results based on the bioavailability of heavy metals. It is recommended to strengthen soil heavy metal pollution prevention and control in the region, focusing on source management. The coal mine area currently has a large accumulation of coal gangue, so efforts should be made to enhance the resource utilization of coal gangue, reduce its storage, and collect and treat the leachate from gangue piles. Additionally, regional ecological restoration and management should be strengthened, with a focus on investigating and researching Hg element pollution.

Supplementary Materials

The following supporting information can be downloaded at: https://www.mdpi.com/article/10.3390/su17104334/s1, Figure S1: The spatial distribution of pH and SOM of soil in the study area. Table S1. Definition and values of formula parameters. Table S2. Values of reference dose (RfD, mg kg−1 d−1) and slope factor (SF, mg kg−1 d−1) for elements.

Author Contributions

Conceptualization, C.L. and X.C.; methodology, H.C.; software, C.L.; validation, C.L., X.C. and L.Z.; formal analysis, C.L.; investigation, H.C.; resources, L.Z.; data curation, C.L.; writing—original draft preparation, C.L.; writing—review and editing, X.C.; visualization, H.C.; supervision, L.Z.; project administration, X.C.; funding acquisition, L.Z. All authors have read and agreed to the published version of the manuscript.

Funding

This work was supported by the National Natural Science Foundation of China (No. 42277075, 42072201).

Institutional Review Board Statement

Not applicable.

Informed Consent Statement

Not applicable.

Data Availability Statement

The data used to support this study are available within the article.

Conflicts of Interest

The authors declare no conflict of interest.

References

  1. Xu, Z.; Qian, Y.; Hong, X.; Luo, Z.; Gao, X.; Liang, H. Contamination characteristics of polycyclic aromatic compounds from coal sources in typical coal mining areas in Huaibei area. China Sci. Total Environ. 2023, 873, 162311. [Google Scholar] [CrossRef]
  2. You, M.; Hu, Y.; Wang, Z.; Zhang, W. Characterization and Ecological Risk Assessment of Toxic Metal Contaminants in the Soil Around the Coal Gangue Hill in Huainan, Central China. Water Air Soil Pollut. 2023, 234, 667. [Google Scholar] [CrossRef]
  3. Clemens, S.; Aarts, M.G.M.; Thomine, S.; Verbruggen, N. Plant science: The key to preventing slow cadmium poisoning. Trends Plant Sci. 2013, 18, 92–99. [Google Scholar] [CrossRef]
  4. Fang, J.; He, Y.; Huang, N.T.; Zhi, Y.Y.; Fu, W.J. Integrated Analysis on Source-exposure Risk of Heavy Metals in Farmland Soil Based on PMF Model: A Case Study in the E-waste Dismantling Area in Zhejiang Province. Environ. Sci. 2023, 44, 4027–4038. [Google Scholar]
  5. Mielcarek, K.; Nowakowski, P.; Puścion-Jakubik, A.; Gromkowska-Kępka, K.J.; Soroczyńska, J.; Markiewicz-Żukowska, R.; Naliwajko, S.K.; Grabia, M.; Bielecka, J.; Żmudzińska, A.; et al. Arsenic, cadmium, lead and mercury content and health risk assessment of consuming freshwater fish with elements of chemometric analysis. Food Chem. 2022, 379, 132167. [Google Scholar] [CrossRef] [PubMed]
  6. Dong, M.; Huang, R.; Mao, P.; Lei, L.; Li, Y.; Li, Y.; Xia, H.; Li, Z.; Zhuang, P. Immobilization of Cadmium by Molecular Sieve and Wollastonite Is Soil pH and Organic Matter Dependent. Int. J. Environ. Res. Public Health 2021, 18, 5128. [Google Scholar] [CrossRef]
  7. Schroeder, W.H.; Munthe, J. Atmospheric mercury—An overview. Atmos. Environ. 1998, 32, 809–822. [Google Scholar] [CrossRef]
  8. Selin, N.E. Global Biogeochemical Cycling of Mercury: A Review. Annu. Rev. Env. Resour. 2009, 34, 43–63. [Google Scholar] [CrossRef]
  9. Teng, D.Y.; Mao, K.; Ali, W.; Xu, G.M.; Huang, G.P.; Niazi, N.K. Describing the toxicity and sources and the remediation technologies for mercury-contaminated soil. RSC Adv. 2020, 10, 23221–23232. [Google Scholar] [CrossRef]
  10. Habib, M.A.; Islam, A.R.M.T.; Varol, M.; Phoungthong, K.; Khan, R.; Islam, M.S.; Hasanuzzaman, M.; Mia, M.Y.; Costache, R.; Pal, S.C. Receptor model-based source-specific health risks of toxic metal(loid)s in coal basin-induced agricultural soil in northwest Bangladesh. Environ. Geochem. Health 2023, 45, 8539–8564. [Google Scholar] [CrossRef]
  11. Yang, X.; Cheng, B.; Wang, Z.; Wang, S.; Liu, L.; Gao, Y.; Zhang, H. Characteristics and pollution risks of potentially toxic elements and nematode community structure on farm soil near coal mines. Environ. Geochem. Health 2023, 45, 6835–6852. [Google Scholar] [CrossRef] [PubMed]
  12. Liu, H.; Zhang, Y.; Yang, J.; Wang, H.; Li, Y.; Shi, Y.; Li, D.; Holm, P.E.; Ou, Q.; Hu, W. Quantitative source apportionment, risk assessment and distribution of heavy metals in agricultural soils from southern Shandong Peninsula of China. Sci. Total Environ. 2021, 767, 144879. [Google Scholar] [CrossRef] [PubMed]
  13. Lv, J. Multivariate receptor models and robust geostatistics to estimate source apportionment of heavy metals in soils. Environ. Pollut. 2019, 244, 72–83. [Google Scholar] [CrossRef] [PubMed]
  14. Yuanan, H.; He, K.; Sun, Z.; Chen, G.; Cheng, H. Quantitative source apportionment of heavy metal(loid)s in the agricultural soils of an industrializing region and associated model uncertainty. J. Hazard. Mater. 2020, 391, 122244. [Google Scholar] [CrossRef]
  15. Wang, Y.; Zhang, L.; Wang, J.; Lv, J. Identifying quantitative sources and spatial distributions of potentially toxic elements in soils by using three receptor models and sequential indicator simulation. Chemosphere 2020, 242, 125266. [Google Scholar] [CrossRef]
  16. Liao, R.; Ratié, G.; Shi, Z.; Šípková, A.; Vaňková, Z.; Chrastný, V.; Zhang, J.; Komárek, M. Cadmium isotope systematics for source apportionment in an urban–rural region. Appl. Geochem. 2022, 137, 105196. [Google Scholar] [CrossRef]
  17. Salmanzadeh, M.; Hartland, A.; Stirling, C.H.; Balks, M.R.; Schipper, L.A.; Joshi, C.; George, E. Isotope Tracing of Long-Term Cadmium Fluxes in an Agricultural Soil. Environ. Sci. Technol. 2017, 51, 7369–7377. [Google Scholar] [CrossRef]
  18. Zhang, X.; Yan, Y.; Wadood, S.A.; Sun, Q.; Guo, B. Source apportionment of cadmium pollution in agricultural soil based on cadmium isotope ratio analysis. Appl. Geochem. 2020, 123, 104776. [Google Scholar] [CrossRef]
  19. Liu, X.; Zhu, F.; Liu, S.; Tan, Q.; Wang, L.; Yue, Y.; Li, C. Tracing concealed gold deposits using mercury isotopes in surface soils: A study from the Shuiyindong gold deposit, Guizhou province, China. J. Geochem. Explor. 2022, 238, 107015. [Google Scholar] [CrossRef]
  20. Zhang, K.; Liao, L.; Li, Z.; Lin, Y.; Meng, B.; Feng, X. Mercury isotopes trace historical mercury pollution from Pb–Zn smelter in China. Chem. Geol. 2023, 635, 121622. [Google Scholar] [CrossRef]
  21. Wang, Y.; Guo, G.; Zhang, D.; Lei, M. An integrated method for source apportionment of heavy metal(loid)s in agricultural soils and model uncertainty analysis. Environ. Pollut. 2021, 276, 116666. [Google Scholar] [CrossRef] [PubMed]
  22. Xu, J. Regional geochemical baseline based pollution assessment and dominant factors influencing metals in riparian sediment of Yangtze River, China. Catena 2023, 230, 107259. [Google Scholar] [CrossRef]
  23. Chen, Y.; Zheng, L.; Chen, X.; Hu, J.; Li, C.; Zhang, L.; Cheng, H. Distribution of mercury and methylmercury in aquacultured fish in special waters formed by coal mining subsidence. Ecotoxicol. Environ. Saf. 2024, 280, 116546. [Google Scholar] [CrossRef]
  24. Hu, J.; Zheng, L.; Liu, S.; Chen, Y.; Li, C.; Ni, J.; Chen, Y.; An, S. Quantifying the impacts of coal mining activities on topsoil using Hg stable isotope: A case study of Guqiao mining area, Huainan City. Environ. Pollut. 2023, 332, 122378. [Google Scholar] [CrossRef]
  25. Li, H.J. Comprehensive Utilization of Coal Gangue; Chemical Industry Press: Beijing, China, 2010. [Google Scholar]
  26. Yin, R.S.; Feng, X.B.; Shi, W.F. Application of the stable-isotope system to the study of sources and fate of Hg in the environment: A review. Appl. Geochem. 2010, 25, 1467–1477. [Google Scholar] [CrossRef]
  27. Sun, R.Y.; Sonke, J.E.; Liu, G.J.; Zheng, L.G.; Wu, D. Variations in the stable isotope composition of mercury in coal-bearing sequences: Indications for its provenance and geochemical processes. Int. J. Coal. Geol. 2014, 133, 13–23. [Google Scholar] [CrossRef]
  28. Bergquist, B.A.; Blum, J.D. Mass-dependent and -independent fractionation of Hg isotopes by photoreduction in aquatic systems. Science 2007, 318, 417–420. [Google Scholar] [CrossRef]
  29. Liang, J.H.; Tian, Y.Q.; Fei, Y.; Liu, Z.Y.; Shi, H.D.; Qi, J.X.; Mo, L. Source apportionment and potential ecological risk assessment of soil heavy metals in typical industrial and mining towns in north China. Environ. Sci. 2023, 44, 5657–5665. [Google Scholar]
  30. Zhou, W.; Li, Z.; Liu, Y.; Shen, C.; Tang, H.; Huang, Y. Soil type data provide new methods and insights for heavy metal pollution assessment and driving factors analysis. J. Hazard. Mater. 2024, 480, 135868. [Google Scholar] [CrossRef]
  31. CEMS. Soil Background Values of China. Chinese Environmental Monitoring Station; Chinese Environmental Science Press: Beijing, China, 1990; (In Chinese with English Abstract). [Google Scholar]
  32. Yu, L.J.; Ma, H.J.; Wang, C.P. Characteristics, Ecological Risk Assessment, and Source Apportionment of Soil Heavy Metals in the Yellow River Floodplain of Yinchuan City. Environ. Sci. 2023, 45, 2971–2982. [Google Scholar]
  33. Zhang, C.H.; Wang, M.S.; Sun, A.; Hang, Q.; Chen, C.; Liu, D.; Mao, P.; Feng, Q.Q.; Wang, M.Y. Quantitative effects of anthropogenic and natural interactions on heavy metal pollution and spatial distribution in sediment of Qinhe River. Acta Sci. Circumstantiae 2023, 43, 176–186. [Google Scholar]
  34. Tao, L.; Xiao, G.; Song, L. Risk assessment of filling pipeline failure based on variation coefficient method and TOPSIS. Ind. Miner. Process. 2019, 48, 23–26. [Google Scholar]
  35. Hao, W.D. Environmental Impacts of Coal Mine Wastes Stacking on the Soil, Waterbody and Vegetation—Cases study. Master’s Thesis, China University of Mining and Technology, Xuzhou, China, 2016. [Google Scholar]
  36. Stamenkovic, J.; Gustin, M.S. Nonstomatal versus Stomatal Uptake of Atmospheric Mercury. Environ. Sci. Technol. 2009, 43, 1367–1372. [Google Scholar] [CrossRef]
  37. Laacouri, A.; Nater, E.A.; Kolka, R.K. Distribution and uptake dynamics of mercury in leaves of common deciduous tree species in Minnesota, U.S.A. Environ. Sci. Technol. 2013, 47, 10462–10470. [Google Scholar] [CrossRef]
  38. Demers, J.D.; Blum, J.D.; Zak, D.R. Mercury isotopes in a forested ecosystem: Implications for air-surface exchange dynamics and the global mercury cycle. Glob. Biogeochem. Cycles 2013, 27, 222–238. [Google Scholar] [CrossRef]
  39. Wang, S.B.; Luo, K.L.; Wang, X.; Sun, Y.Z. Estimate of sulfur, arsenic, mercury, fluorine emissions due to spontaneous combustion of coal gangue: An important part of Chinese emission inventories. Environ. Pollut. 2016, 209, 107–113. [Google Scholar] [CrossRef]
  40. Zheng, L.; Sun, R.; Hintelmann, H.; Zhu, J.; Wang, R.; Sonke, J.E. Mercury stable isotope compositions in magmatic-affected coal deposits: New insights to mercury sources, migration and enrichment. Chem. Geol. 2018, 479, 86–101. [Google Scholar] [CrossRef]
  41. Wang, P.; Li, Z.; Liu, J.; Bi, X.; Ning, Y.; Yang, S.; Yang, X. Apportionment of sources of heavy metals to agricultural soils using isotope fingerprints and multivariate statistical analyses. Environ. Pollut. 2019, 249, 208–216. [Google Scholar] [CrossRef]
  42. Ren, M.; Zheng, L.; Wang, D.; Chen, X.; Dong, X.; Wei, X.; Cheng, H. Copper isotope ratios allowed for quantifying the contribution of coal mining and combustion to total soil copper concentrations in China. Environ. Pollut. 2022, 308, 119613. [Google Scholar] [CrossRef]
  43. Zhang, X.; Tian, K.; Wang, Y.; Hu, W.; Liu, B.; Yuan, X.; Huang, B.; Wu, L. Identification of sources and their potential health risk of potential toxic elements in soils from a mercury-thallium polymetallic mining area in Southwest China: Insight from mercury isotopes and PMF model. Sci. Total Environ. 2023, 869, 161774. [Google Scholar] [CrossRef]
  44. Chen, X.; Zheng, L.; Sun, R.; Liu, S.; Li, C.; Chen, Y.; Xu, Y. Mercury in sediment reflecting the intensive coal mining activities: Evidence from stable mercury isotopes and Bayesian mixing model analysis. Ecotoxicol. Environ. Saf. 2022, 234, 113392. [Google Scholar] [CrossRef] [PubMed]
  45. Song, Z.; Wang, C.; Ding, L.; Chen, M.; Hu, Y.; Li, P.; Zhang, L.; Feng, X. Soil mercury pollution caused by typical anthropogenic sources in China: Evidence from stable mercury isotope measurement and receptor model analysis. J. Clean. Prod. 2021, 288, 125687. [Google Scholar] [CrossRef]
  46. Cao, F.; Meng, M.; Shan, B.; Sun, R. Source apportionment of mercury in surface soils near the Wuda coal fire area in Inner Mongolia, China. Chemosphere 2021, 263, 128348. [Google Scholar] [CrossRef]
  47. Liu, H.; Shao, J.; Yu, B.; Liang, Y.; Duo, B.; Fu, J.; Yang, R.; Shi, J.; Jiang, G. Mercury isotopic compositions of mosses, conifer needles, and surface soils: Implications for mercury distribution and sources in Shergyla Mountain, Tibetan Plateau. Ecotoxicol. Environ. Saf. 2019, 172, 225–231. [Google Scholar] [CrossRef]
  48. Zhao, D.; Wu, Q.; Zheng, G.; Zeng, Y.; Wang, H.; Mei, A.; Gao, S.; Zhang, X.; Zhang, Y. Quantitative Source Apportionment and Uncertainty Analysis of Heavy Metal(loid)s in the Topsoil of the Nansi Lake Nature Reserve. Sustainability 2022, 14, 6679. [Google Scholar] [CrossRef]
  49. Gao, H.; Huang, Y.; Li, W.; Li, J.; Ouyang, S.; Song, T.; Lv, F.; Zhai, W.; Ma, K. Explanation of heavy metal pollution in coal mines of china from the perspective of coal gangue geochemical characteristics. Environ. Sci. Pollut. Res. 2021, 28, 65363–65373. [Google Scholar] [CrossRef] [PubMed]
  50. Li, C.; Zheng, L.; Jiang, C.; Chen, X.; Ding, S. Characteristics of leaching of heavy metals from low-sulfur coal gangue under different conditions. Int. J. Coal Sci. Technol. 2021, 8, 780–789. [Google Scholar] [CrossRef]
  51. Wang, D.; Zheng, L.; Ren, M.; Li, C.; Dong, X.; Wei, X.; Zhou, W.; Cui, J. Zinc in soil reflecting the intensive coal mining activities: Evidence from stable zinc isotopes analysis. Ecotoxicol. Environ. Saf. 2022, 239, 113669. [Google Scholar] [CrossRef]
  52. Zhang, L.; Zhou, H.; Chen, X.; Liu, G.; Jiang, C.; Zheng, L. Study of the micromorphology and health risks of arsenic in copper smelting slag tailings for safe resource utilization. Ecotoxicol. Environ. Saf. 2021, 219, 112321. [Google Scholar] [CrossRef]
  53. Shentu, J.; Fang, Y.; Wang, Y.; Cui, Y.; Zhu, M. Bioaccessibility and reliable human health risk assessment of heavy metals in typical abandoned industrial sites of southeastern China. Ecotoxicol. Environ. Saf. 2023, 256, 114870. [Google Scholar] [CrossRef]
Figure 1. Map of study area and sample sites. (a): map of China; (b): map of Anhui Province; (c): Specific distribution map of sampling points.
Sustainability 17 04334 g001
Figure 2. The spatial distribution of Hg content of soil in the study area.
Sustainability 17 04334 g002
Figure 3. Igoe of heavy metals in soils. The Igeo can be classified into 7 levels based on the achieved data: Class 0, practically uncontaminated; Class 1, uncontaminated to moderately contaminated; Class 2, moderately contaminated; Class 3, moderately to heavily contaminated; Class 4, heavily contaminated.
Sustainability 17 04334 g003
Figure 4. The composition of δ202Hg and Δ199Hg in the study area. (a): the end members of δ202Hg and Δ199Hg, and (b): the composition of δ202Hg and Δ199Hg.
Sustainability 17 04334 g004
Figure 5. The linear relationship between Δ199Hg and Δ201Hg in the soil of the study area.
Sustainability 17 04334 g005
Figure 6. The contributions of different factors to soil pollution.
Sustainability 17 04334 g006
Figure 7. PMF source component spectrum.
Sustainability 17 04334 g007
Table 1. The concentration of physical and chemical properties and pollutants in soil (mg·kg−1).
pHSOMHgCuZnFeAlPb
Max8.934.50.47913432748,70059,99036.1
Min6.58.90.09823.49525,20023,89020.9
Median7.316.450.26045.5256.534,541.543,874.526.7
Mean7.5216.600.26254.1235.335,477.44161426.7
SD0.76.164.8726.7065.225262.569784.444.25
CV0.090.370.390.490.280.150.240.16
Background value [31]--0.027619.358.63010658026.0
Table 2. The correlation coefficient matrix between different heavy metals.
HgCuZnFeAlPb
Hg1
Cu−0.05 1
Zn0.56 *0.49 *1
Fe−0.20 0.13 −0.22 1
Al−0.12 0.04 −0.10 0.68 **1
Pb0.46 *−0.22 0.39 *−0.47 *−0.21 1
Note: * for p < 0.05, ** for p < 0.01.
Table 3. Soil Hg isotope content in different areas.
Study Areaδ202Hg (‰)Δ199Hg (‰)Δ201Hg (‰)Reference
RangeMeanRangeMeanRangeMean
Guizhou−0.30~0.410.03 ± 0.360.00~0.020.01 ± 0.01−0.05~−0.01−0.03 ± 0.02[43]
Anhui−0.79~0.02−0.45 ± 0.27−0.05~0.050.01 ± 0.03−0.07~0.01−0.02 ± 0.03[44]
Southwest China−1.98~0.08−0.90 ± 0.57-−0.31 ± 0.05--[45]
Nei Monggol−1.71~−0.26−1.19 ± 0.28−0.26~−0.07−0.02 ± 0.03--[46]
Qinghai Tibet−1.65~−0.16−1.15 ± 0.44−0.31~−0.06−0.20 ± 0.07--[47]
This study−1.27~0.04−0.41 ± 0.31−0.07~0.110.01 ± 0.03−0.08~0.07−0.03 ± 0.03-
Table 4. Pollutant-associated health risks from specific sources for adults and children.
TotalAdult Children
F1F2F3TotalF1F2F3Total
Non-carcinogenic
Hg0.210.120.370.700.190.110.330.62
Cu4.66 × 10−78.47 × 10−44.34 × 10−41.28 × 10−34.00 × 10−77.28 × 10−43.73 × 10−41.10 × 10⁻³
Zn2.75 × 10−51.61 × 10−44.97 × 10−46.85 × 10−42.36 × 10−51.38 × 10−44.27 × 10−45.89 × 10⁻⁴
Pb2.40 × 10−31.27 × 10−33.79 × 10−37.46 × 10−32.20 × 10−31.16 × 10−33.46 × 10−36.82 × 10⁻³
THI0.220.120.370.710.190.110.330.63
carcinogenic
Pb4.39 × 10−102.32 × 10−106.93 × 10−101.36 × 10−93.92 × 10−102.08 × 10−106.19 × 10−101.22 × 10⁻⁹
Disclaimer/Publisher’s Note: The statements, opinions and data contained in all publications are solely those of the individual author(s) and contributor(s) and not of MDPI and/or the editor(s). MDPI and/or the editor(s) disclaim responsibility for any injury to people or property resulting from any ideas, methods, instructions or products referred to in the content.

