1. Introduction
Water, energy, and food are essential components for maintaining regional stability and achieving sustainable development [
1]. The Bonn Conference in 2011 first conceptualized the “Nexus” relationship between water, energy, and food security (WEF-Nexus) [
2]. This framework provides a transparent, rational, and logical approach to addressing competition among diverse resource uses without compromising sustainability. It facilitates the coordinated development of resources such as water, energy, and food. Evidently, resource sustainability is intrinsically linked to ecological sustainability. The interaction between ecology systems and the WEF system is direct [
3], and their integration is a vital approach for addressing issues such as water scarcity, energy crises, and food security [
4]. This integration enables the efficient utilization of regional resources and promotes green development. While the WEF-Nexus provides a comprehensive approach to resource coordination, it primarily focuses on water, energy, and food, and tends to overlook the critical role of ecosystems in regulating these resources. The ecological system plays a fundamental role in ensuring the sustainability of water, energy, and food resources by maintaining biodiversity, regulating water cycles, and providing essential ecosystem services [
5]. Therefore, integrating the ecological system into the WEF framework creates the water–energy–food–ecology (WEFE) nexus, offering a more holistic approach to understanding the complexities of regional resource management. Research on the water–energy–food–ecology (WEFE) nexus has been conducted at multiple scales. For example, Wu et al. (2023) [
6] explored the interconnections and spatiotemporal dynamics of the WEFE system across five Central Asian nations. At the national level, Song et al. (2023) [
7] examined the coordinated development of Uzbekistan’s WEFE system. Chen et al. (2023) [
8] established an assessment framework for WEFE interactions in the Yangtze River Economic Belt using the Vulnerability Scoping Diagram (VSD) approach. Zhen et al. (2025) [
9] discussed the WEFE relationship in the Tarim Basin in arid areas. Similarly, Liu et al. (2023) [
10] evaluated the sustainability of the WEFE system in the Beijing–Tianjin–Hebei urban agglomeration. Pan et al. (2024) [
11] used Pu’er City as a case study to evaluate the complex dynamics of the WEFE linkage effects under organic and conventional agriculture, as well as the potential for their coordinated development. From a coupled system perspective, studies have increasingly expanded beyond the traditional WEF triad to incorporate new subsystems [
12]. For example, research has examined the impact of land use on the WEF system [
13], the interactions between forest ecosystems and WEF systems for soil and water conservation [
14], and the influence of social development on WEF systems, including aspects such as health [
15], poverty [
16], governance [
17], and economics [
18].
Diverse methodological approaches have been employed to evaluate the WEFE system. Tan et al. (2025) [
19] developed a model combining CNSGA-II-DE with CP to achieve the goal of enhancing the collaborative optimization of the WEFE system. Ji et al. (2023) [
4] leveraged system dynamics modeling to predict resource supply–demand trends and ecological conditions under different economic scenarios in the Yangtze River Delta. Wu et al. (2023) [
6] adopted a coupling coordination model to analyze spatiotemporal variations in WEFE synergy across Central Asia. Liu et al. (2023) [
20] applied a combination of self-assessment and external evaluation using data envelopment analysis to measure WEFE vulnerability in the Yangtze River Economic Belt. Pan et al. (2022) [
21] employed the SPA-TOPSIS method and ArcGIS to assess WEFE vulnerability and diagnose key obstacles hindering system resilience. Teutschbein et al. (2023) [
22] used a combination of multiple climate models and the hydrological HBV light model to predict various drought indices representing the water, energy, food, and ecology sectors. Given the complexity and broad scope of the WEFE system, no single methodology can comprehensively capture its intricacies. The critical challenge lies in integrating WEFE principles into regional analyses and scientific inquiries to select the most suitable analytical frameworks.
As key engines of economic development, urban agglomerations serve as major hubs of natural resource consumption and are increasingly at the forefront of sustainability challenges. They are hot spots of conflict between resource demands for production and living activities and ecological considerations [
23]. Urban areas account for over 70% of global carbon emissions, with China’s cities consuming 85% of the nation’s energy—well above the global average of 67% [
24]. Additionally, nearly 90% of large cities worldwide faced water supply risks in 2015 [
25], with 933 million urban residents experiencing water shortages, a figure projected to reach 2.065 billion by 2050 [
26]. Key contributors to this crisis include urban expansion and water pollution. Furthermore, increasing extreme weather events [
27], regional conflicts [
28], urban industrialization, and population urbanization rates have exacerbated ecological and food security challenges in cities [
29]. Therefore, focusing on the research of urban agglomeration scale, constructing the water–energy–food–ecology comprehensive evaluation system (WEFE system), and analyzing the evolution of coupling coordination (CCD) are crucial for advancing high-quality urban development, optimizing resource use, and fostering ecological sustainability [
30]. In summary, the following gaps exist in the existing literature: (1) most WEFE studies focus on national, provincial, or watershed scales, often overlooking regional heterogeneity within urban systems. In contrast, urban agglomerations exhibit diverse socio-ecological contexts and development trajectories. This study addresses this research gap by conducting a comparative analysis across three urban agglomerations with distinct development gradients, thereby providing spatially differentiated insights beyond national-level generalizations. (2) While there is a trend toward integrating additional subsystems into the traditional WEF framework, in-depth exploration of the interactions between ecology and the WEF system remains limited. (3) Research methods primarily emphasize evaluating WEFE relationships, calculating CCD, exploring spatial relationships, and predicting future CCD trends. However, there has been insufficient investigation into the mechanisms of coupling and the identification of key contributing factors. This is due to the inherent complexity of the WEFE system, characterized by numerous nonlinear interactions that challenge traditional quantitative approaches.
This study adopts a multi-faceted approach to address the identified gaps. The research framework of this paper first explores the interactive relationships within the WEFE system and then uses panel data from 2008 to 2022 to compare the CCD of the WEFE system across three urban agglomerations with varying developmental gradients: the Pearl River Delta (PRD), Hohhot–Baotou–Ordos–Yulin (HBOY), and Central Jilin Province. The analysis includes urbanization rate, industrialization rate, and per capita GDP as key variables to explore their relationships with CCD. A back-propagation artificial neural networks model is employed to identify the primary factors contributing to differences in CCD across urban agglomerations [
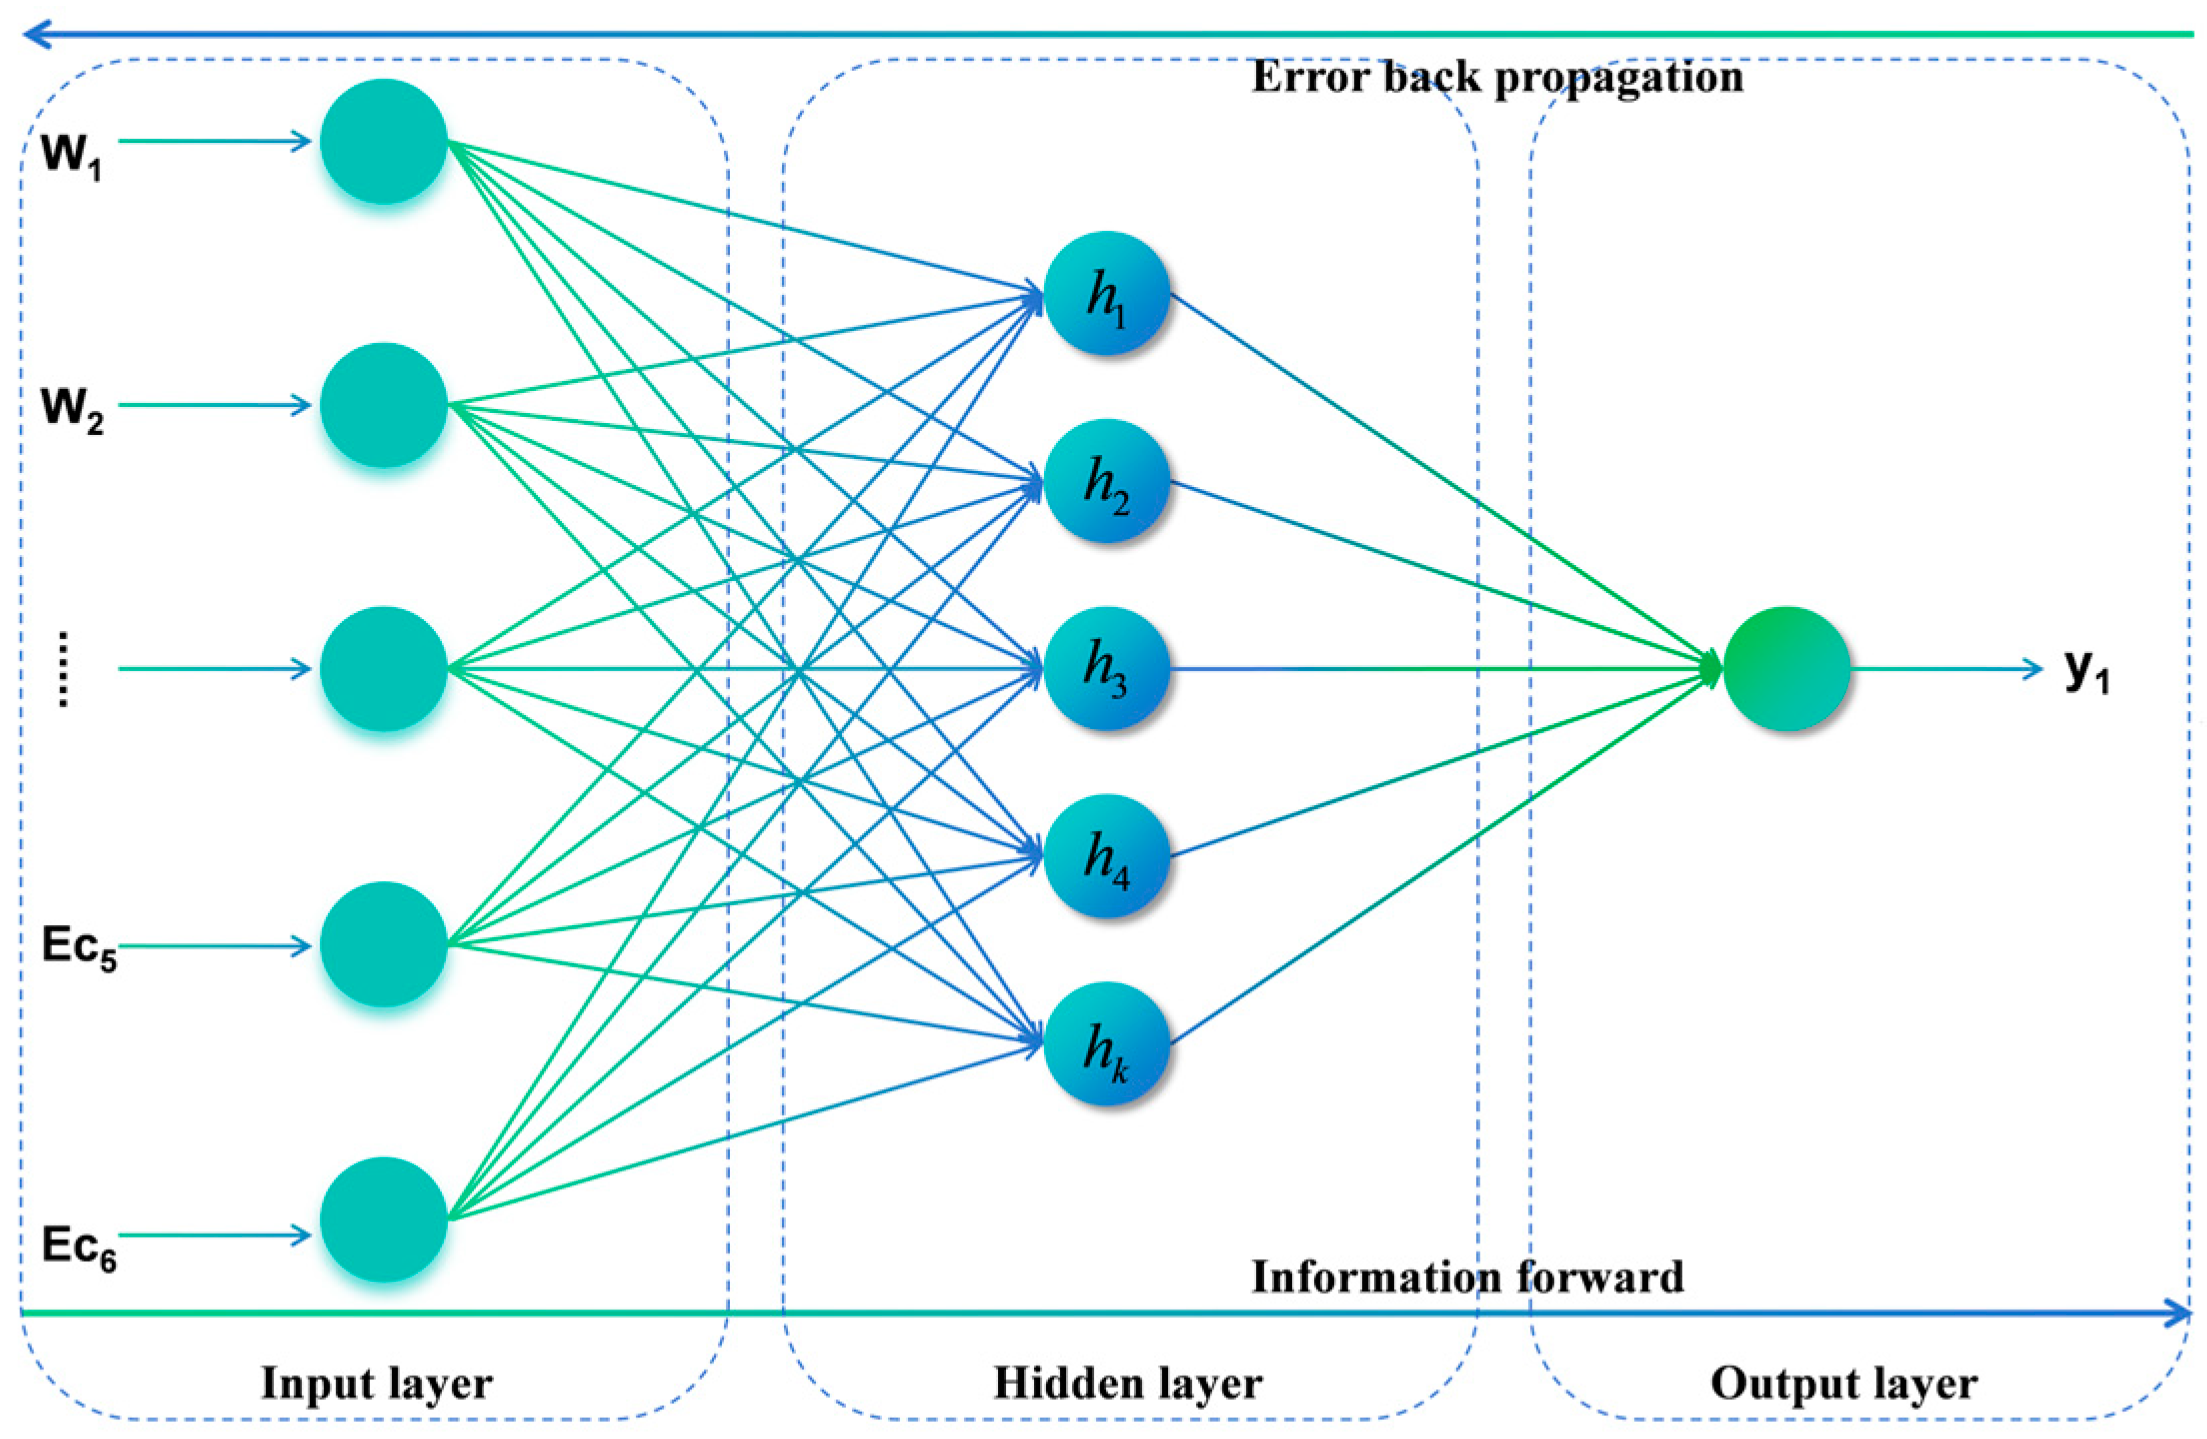
31]. The main innovations of this study are as follows: (1) incorporating ecological subsystems into the WEF framework, which establishes the WEFE system and expands the research paradigm. (2) By focusing on urban agglomerations, the study analyzes the spatiotemporal differences in WEFE coordination across regions with varying development levels. (3) Through clarifying the mechanisms of WEFE coupling coordination, the study applies BPANN (back-propagation artificial neural networks) to systematically examine the contributions of selected indicators to CCD. This provides critical insights for optimizing resource allocation and achieving sustainable development in urban agglomerations, while offering valuable guidance for future policy planning in similar contexts.
3. Results
3.1. Temporal Changes in the Comprehensive Evaluation Index
Based on Equations (1)–(13), the WEFE subsystems and the comprehensive evaluation indices T and CCD of the PRD, HBOY, and CJP urban agglomerations from 2008 to 2022 were calculated.
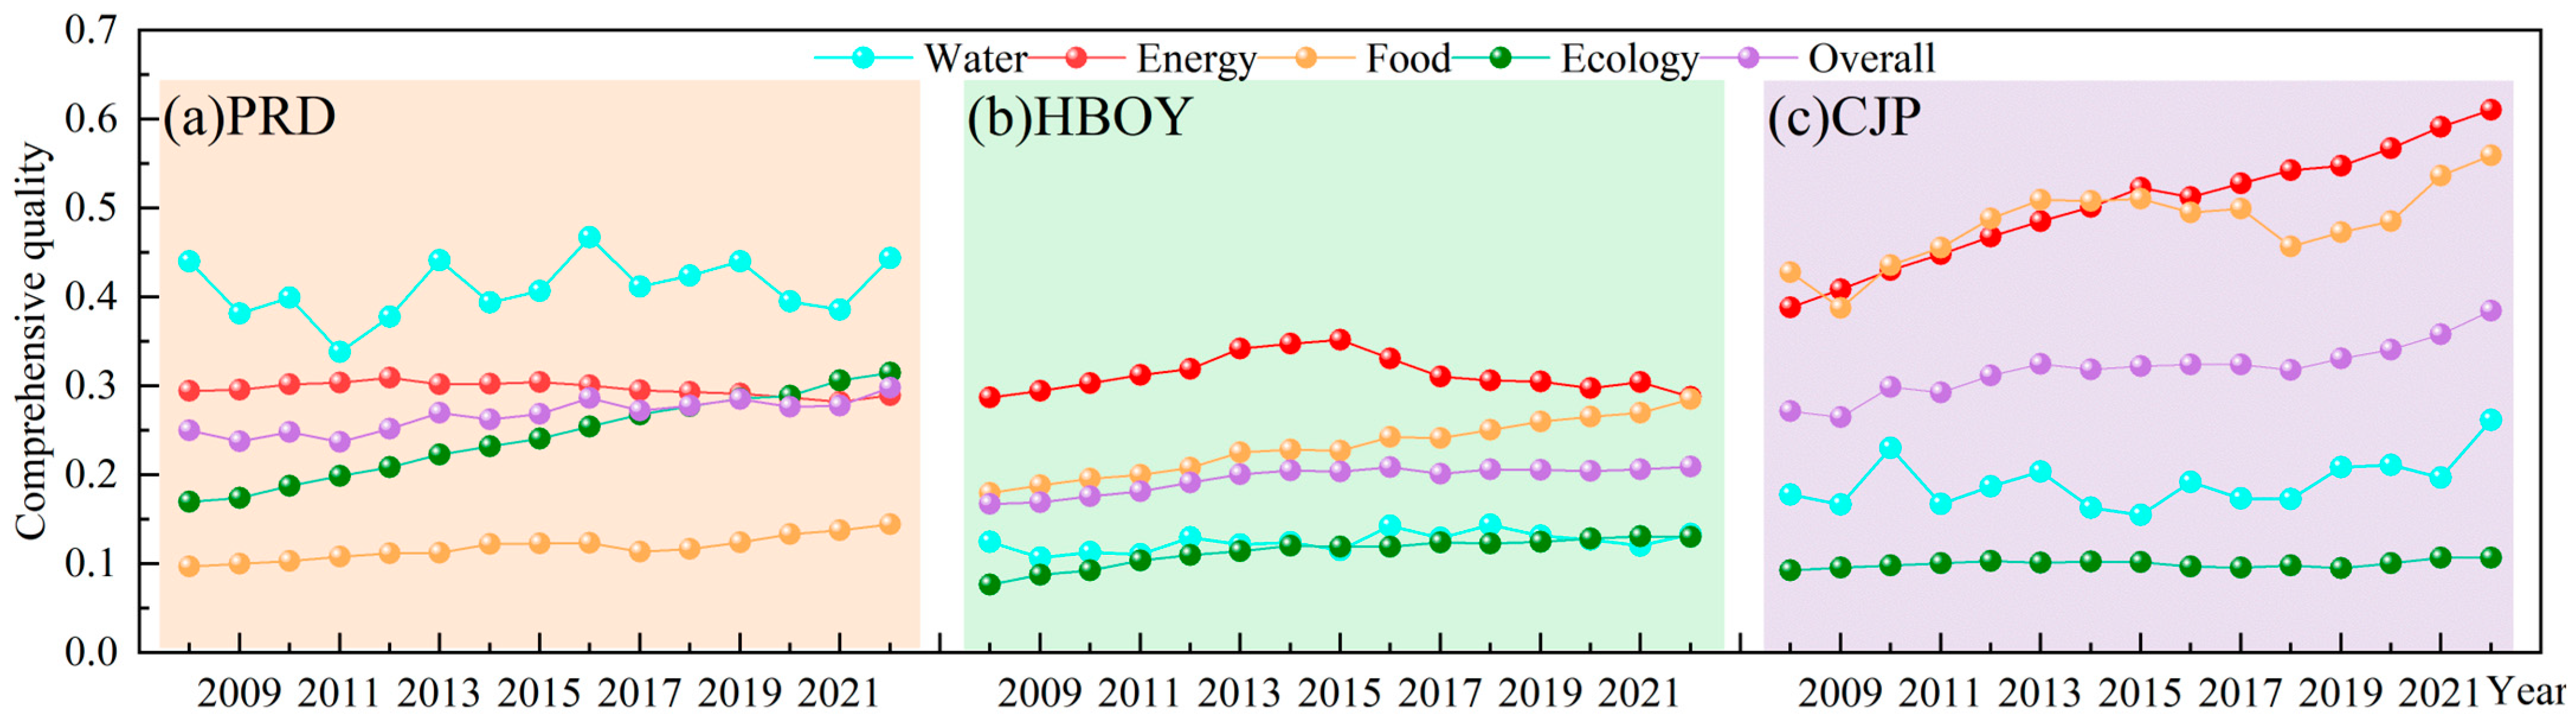
First, from 2008 to 2022, the WEFE system indices of the three urban agglomerations exhibited an overall upward trend but with varying growth rates. The PRD ranged from 0.2 to 0.3, HBOY from 0.1 to 0.2, and CJP from 0.2 to 0.4. HBOY’s index remained low, with limited growth, likely due to its arid climate, reliance on energy and chemical industries, and slow industrial transformation. In contrast, CJP experienced higher and faster growth, driven by agricultural advantages and progress in energy conservation and carbon reduction (
Figure 4).
Second, there were also differences in the evaluation indices of the WEFE subsystems and their temporal changes among the urban agglomerations. (1) The water and ecology subsystems of the PRD urban agglomeration developed best, with long-term average values of 0.41 and 0.24, respectively, both outperforming the HBOY and CJP urban agglomerations. The ecology subsystem saw an impressive growth of 86% over the 15-year period. (2) The energy subsystem evaluation index of the HBOY urban agglomeration was generally at a higher level but showed a “Z”-shaped change, with a sharp decline after 2015. The food subsystem, however, grew rapidly, increasing by 60% over 15 years and gradually approaching or even surpassing the energy subsystem, while the water and ecology subsystems developed slowly. (3) The energy and food subsystem evaluation indices of the CJP urban agglomeration showed significant overall increases, with the energy and food subsystems increasing by 56% and 30%, respectively, from 2008 to 2022. Notably, the food subsystem experienced a significant decline during 2017–2018, which was related to extreme climate conditions in that year, but increased rapidly after 2018. The water and ecology subsystems remained at low development levels, with very limited growth (
Figure 4).
3.2. Analysis of Temporal and Spatial Changes in CCD
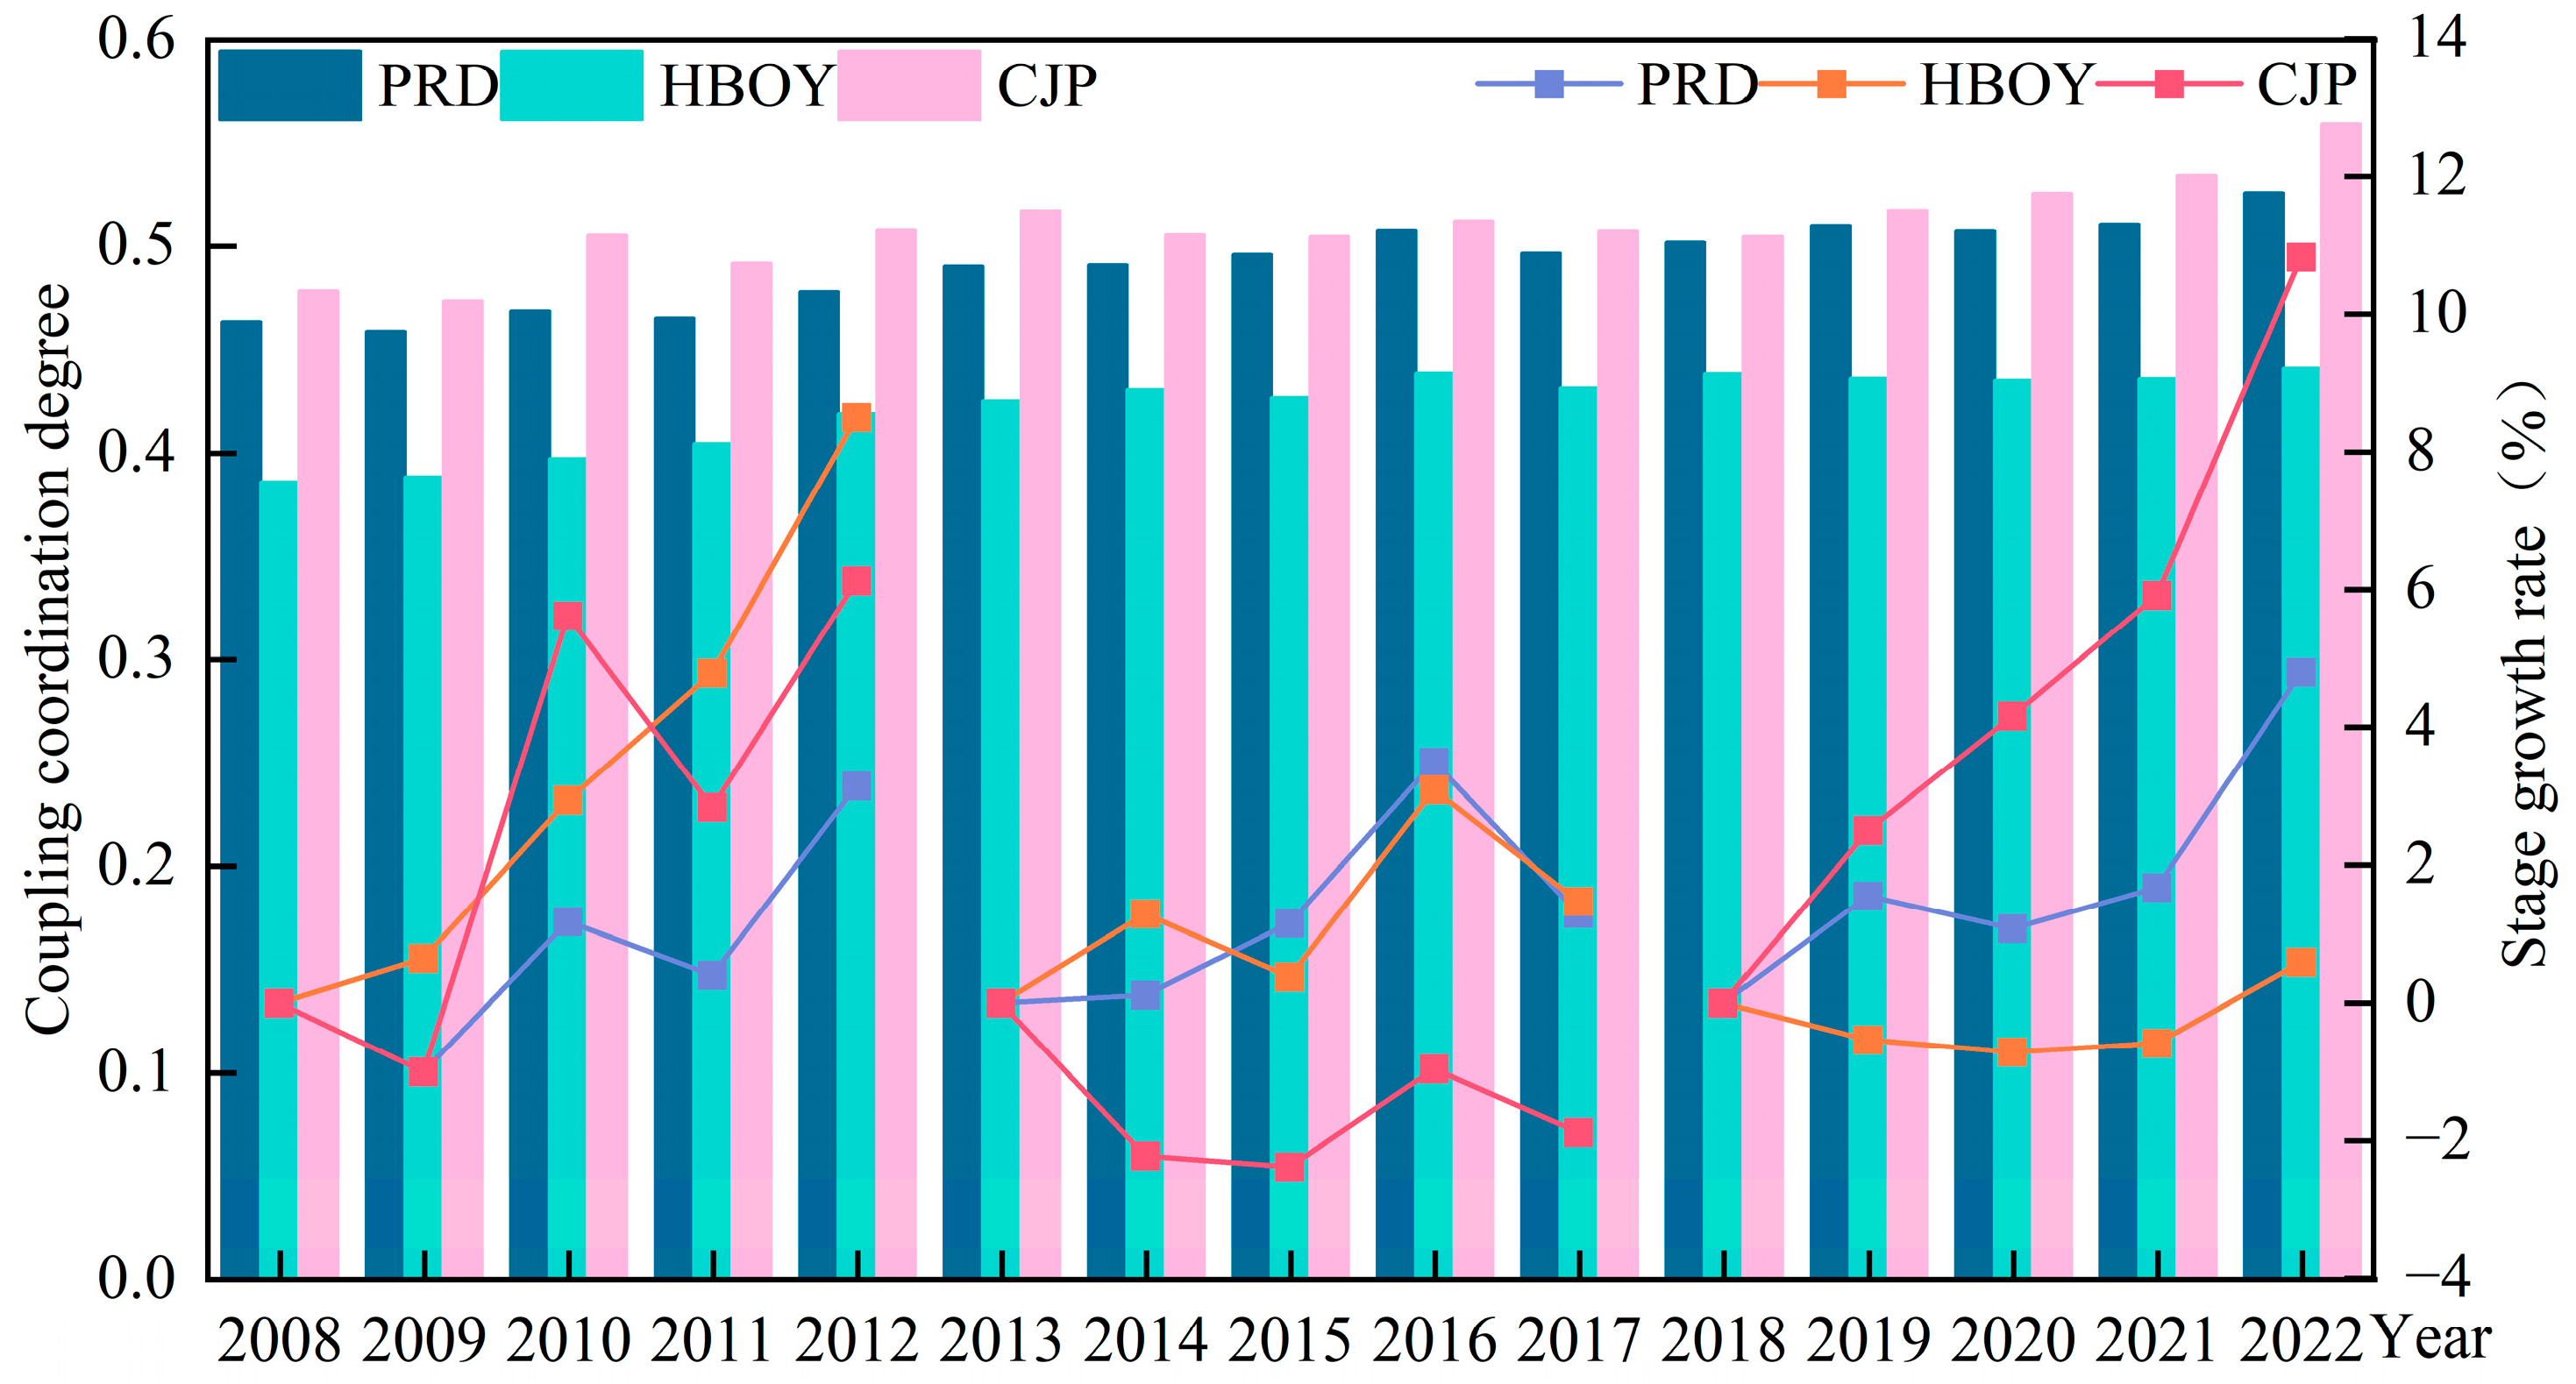
From 2008 to 2022, the CCD of the WEFE systems in the three urban agglomerations showed an overall upward trend, but significant differences existed in the CCD values and evolution trends between urban agglomerations and within individual urban agglomerations. This paper divides the research period from 2008 to 2022 into three stages (2008–2012, 2013–2017, and 2018–2022), with 2008, 2013, and 2018 as the starting points of the three stages, respectively, as the base period, to calculate and compare the growth rate of the WEFE system coupling coordination degree in the subsequent stages. (
Figure 5). For spatial variation analysis, the years 2008, 2015, and 2022 were selected as examples, and ArcGIS was used to visualize the spatial distribution and changes in the CCD of the WEFE systems in the three urban agglomerations (
Figure 6).
3.2.1. Temporal Variation Analysis
From 2008 to 2012, the CCD values of the WEFE systems in the three urban agglomerations showed an overall increasing trend, with growth rates ranking as follows: HBOY (8.5%) > CJP (6.13%) > PRD (3.15%). During this period, the coupling and coordination levels in HBOY and CJP increased significantly, while the PRD showed a slower growth. From 2013 to 2017, the growth rate rankings were HBOY (1.47%) > PRD (1.29%) > CJP (−1.88%). In this phase, the coupled and coordinated development slowed, with CJP even experiencing a decline, while HBOY and PRD continued to improve, though at a slower and more fluctuating pace. From 2018 to 2022, there were new differences in the rate of CCD of the WEFE systems in the three urban agglomerations, with growth rates ranking as follows: CJP (10.82%) > PRD (4.8%) > HBOY (0.59%). In the third phase, the growth rates of CJP and PRD urban agglomerations increased rapidly, while HBOY experienced a slowdown, falling far behind the other two urban agglomerations (
Figure 5).
Overall, HBOY initially experienced rapid improvement in its WEFE system’s coupling and coordination level, but later lost momentum and ultimately recorded the lowest CCD among the three urban agglomerations. This is related to its relatively single energy economic structure. The development of energy resources supported the socio-economic development of the region but also placed tremendous pressure on ecological system management and sustainable development, leading to instability in the coordination and balance of the WEFE system. The CJP urban agglomeration showed rapid improvement in the first and third phases, indicating significant development of its subsystems during these periods, and its overall CCD value was higher than that of the other two urban agglomerations. The PRD urban agglomeration showed stable growth throughout the three phases, suggesting relatively stable development of its subsystems, which is consistent with its mature urban development system. With the transfer or upgrading of lagging industries in the future, the CCD of its WEFE system may experience significant growth.
3.2.2. Spatial Variation Analysis
In 2008, the overall CCD of the three urban agglomerations was relatively low, with significant regional imbalances. The CCD rankings were as follows: PRD > CJP > HBOY. In PRD, except for Guangzhou and Zhaoqing in the north, which were in a barely coordinated stage, and Zhongshan in the south, which was in a mild imbalanced stage, the other cities were in an imminent imbalance stage. In HBOY, the CCD of the WEFE system was low, with all cities except Hohhot in the northeast being in an imminent imbalance stage. In CJP, except for Jilin City in the southeast, which reached a barely coordinated stage, the other cities were in an imminent imbalance stage. In 2015, the CCD of the WEFE systems in all urban agglomerations improved, with overall levels ranking as follows: CJP > PRD > HBOY. In PRD, Huizhou in the north developed rapidly in terms of coordination level, reaching the same barely coordinated stage as Guangzhou and Zhaoqing, while other cities were in an imminent imbalance stage. The overall CCD showed a north-high and south-low spatial difference. In HBOY, all cities except Baotou in the north were in an imminent imbalance stage. In CJP, Changchun in the central region moved from an imminent imbalance stage to a barely coordinated stage, while other cities remained unchanged. By 2022, the CCD of all urban agglomerations had significantly improved, with the overall ranking consistent with 2015, but regional differences further increased. Although all cities in PRD improved, Zhuhai, Dongguan, and Zhongshan remained in an imminent imbalance stage, while other cities were in a barely coordinated stage. In HBOY, Yulin in the south progressed to a barely coordinated stage, while Baotou remained in a mildly imbalanced stage, indicating significant internal differences. In CJP, the CCD increased significantly, with Jilin City in the east transitioning from a barely coordinated to a primary coordinated stage, while Siping, Liaoyuan, and Songyuan moved from an imminent imbalance stage to a barely coordinated stage, showing a pattern of higher coordination in the central and eastern regions compared to the west (
Figure 6).
Overall, from 2008 to 2022, the internal differences in the CCD of the WEFE system in the PRD urban agglomeration gradually narrowed, indicating closer connections between cities, more frequent and in-depth flow of resource elements, capital, and personnel, and a more mature urban agglomeration network system, resulting in more stable CCD fluctuations in the WEFE system. In HBOY, the CCD in the southern part was better than in the north, and the gap between the north and south widened, with overall slow development. This is due to the close relationship between the production and development of resource-based cities and the exploitation and utilization of resources. Yulin and Ordos in the south have abundant coal resources and extensive arable land, providing an advantage in the energy and food subsystems of the WEFE system. In CJP, CCD developed rapidly, with the east outperforming the west, and the overall level consistently leading PRD and HBOY, which is related to its agricultural development advantages and high energy utilization efficiency.
3.3. Relationship Between Different Development Gradient Indicators and CCD in Urban Agglomerations
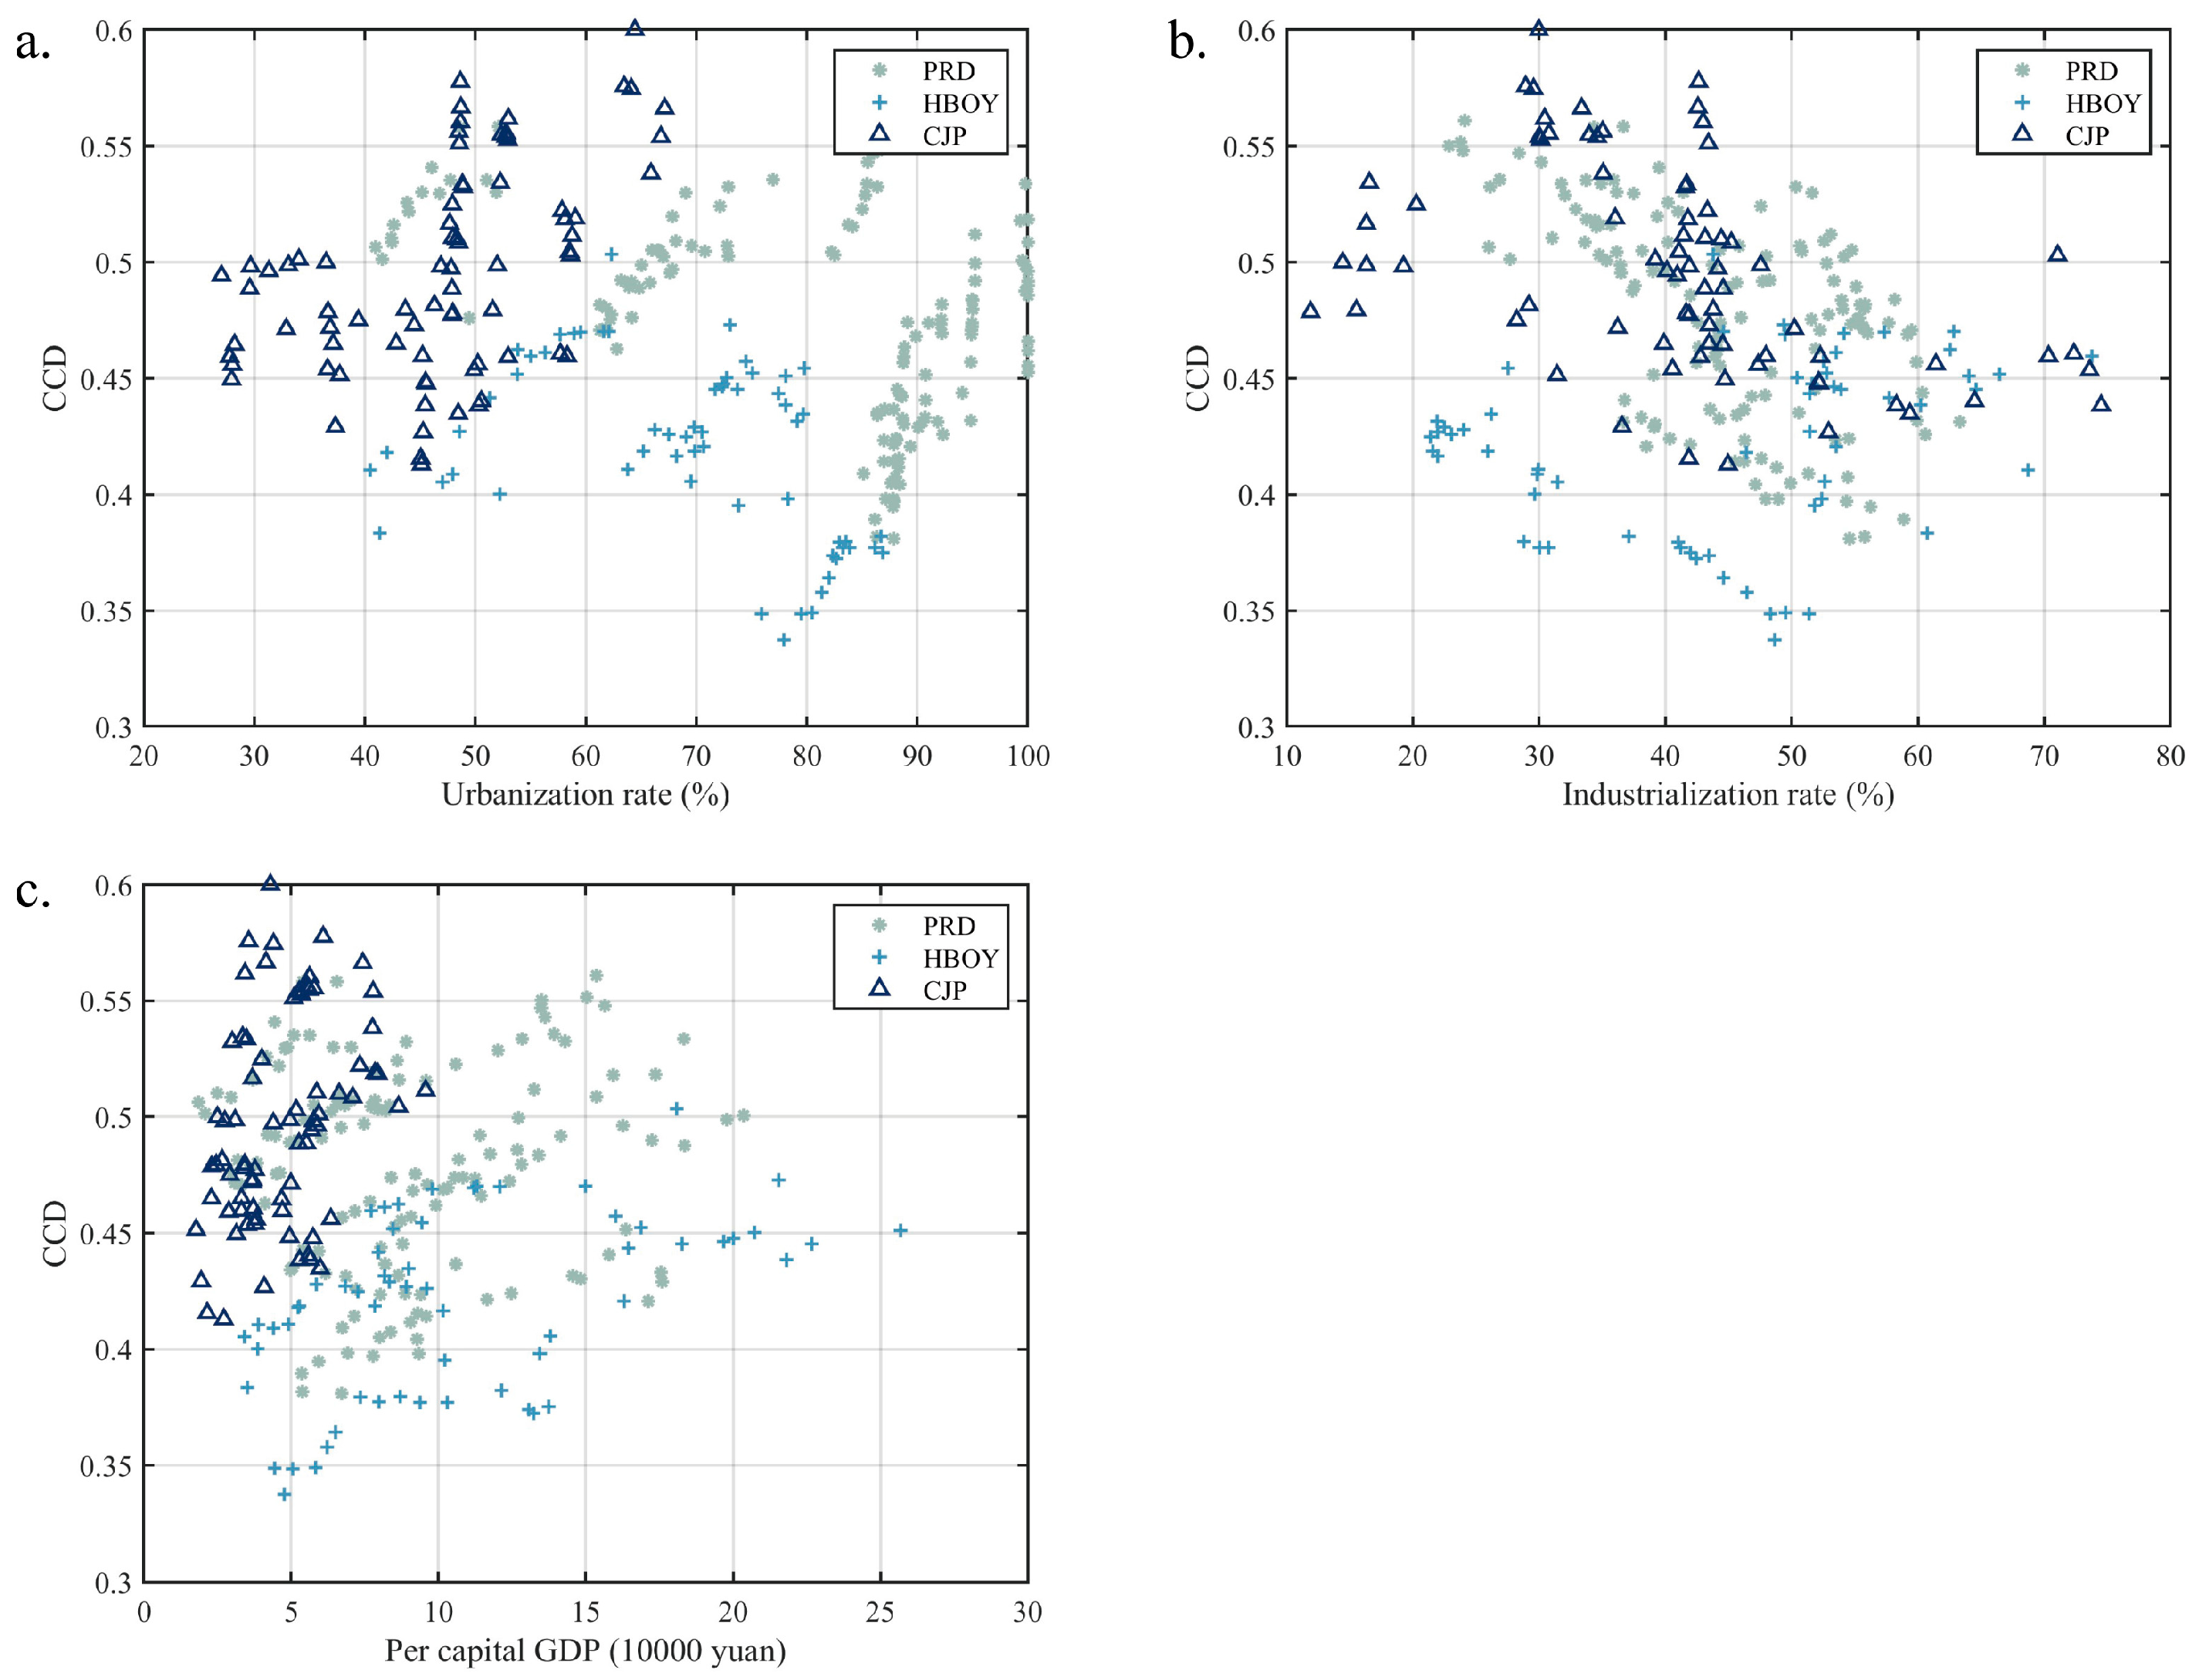
The relationship between the gradient differences in urbanization rate, industrialization rate, and per capita GDP among the three urban agglomerations and the CCD of the WEFE system was analyzed. As illustrated in
Figure 7, the CCD of all cities within the three urban agglomerations from 2008 to 2022 was correlated with urbanization rate, industrialization rate, and per capita GDP.
Figure 7a shows that in PRD and HBOY, there is generally a negative correlation between urbanization rate and CCD, especially when the urbanization rate exceeds 70%. Cities with higher urbanization rates are generally associated with lower CCD values. In contrast, in CJP, where urbanization rates remained below 70%, a significant positive correlation was observed between urbanization rate and CCD. This outcome may be attributed to the early stages of urbanization, where population migration to cities alleviates rural land-use conflicts and promotes resource development and utilization to a certain extent. However, once urban expansion exceeds a certain threshold, this balance is disrupted, leading to issues such as farmland encroachment and the unreasonable exploitation and destruction of natural resources, including water and vegetation.
Figure 7b illustrates that in PRD and CJP, a negative correlation generally exists between industrialization rate and CCD, with cities showing higher industrialization rates tending to have lower CCD values. This is primarily due to the high consumption of energy and water resources associated with industrial development, which is also accompanied by environmental degradation, thereby reducing the CCD of the WEFE system. However, this conclusion is not absolute. In HBOY, the relationship between industrialization rate and CCD presents an overall V-shaped pattern. Before reaching an industrialization rate of 50%, industrialization and CCD are generally negatively correlated, whereas after 50%, the relationship becomes positive. This reflects HBOY’s role as a key energy and chemical production base in China. In certain cities, once industrialization reaches a specific level, the adoption of new technologies, optimization of the industrial structure, transition to cleaner production, and implementation of ecological protection policies have improved the CCD of the WEFE system.
Figure 7c shows that per capita GDP and CCD generally exhibit a positive correlation across all three urban agglomerations, suggesting that higher economic development levels contribute to improvements in the CCD of the WEFE system. Interestingly, despite CJP having the lowest level of economic development, it displayed relatively high CCD values, which can be attributed to its significant emphasis on agricultural development. Agricultural growth has led to strong performance in the food subsystem, although the economic benefits from food production have remained relatively modest.
Overall, urbanization rate generally has a positive effect on CCD, but it needs to be accompanied by industrial upgrading and resource optimization. Mere urbanization does not necessarily guarantee coordinated development. The relationship between industrialization rate and CCD is complex. In the PRD, a negative correlation is observed to some extent, suggesting that a high level of industrialization may impose environmental burdens. In contrast, the CJP exhibits a more balanced industrialization pattern, leading to a relatively high CCD. Per capita GDP shows a certain positive correlation with CCD, but economic growth alone does not necessarily result in a higher level of coordinated development. A well-structured industrial system and effective policy guidance are still required.
3.4. Analysis of Influencing Factors on the WEFE System’s CCD
The identification of driving factors provides an effective scientific basis for improving the coordination of urban WEFE systems. This study uses the BPANN algorithm to systematically analyze the impact of 24 WEFE system indicators on the coupling coordination degree (CCD) and accurately identify key influencing factors. In the research design, the 24 WEFE indicators are treated as input layer neurons, while the CCD is regarded as the output layer neuron, forming a three-layer network structure with dimensions of 24-5-1. By normalizing the data from 18 cities across three urban agglomerations (PRD, HBOY, CJP) from 2008 to 2022, a dataset containing 270 samples was generated (PRD: 135, HBOY: 60, CJP: 75). To ensure robust model training and reliable evaluation of predictive performance, the dataset for each urban agglomeration was partitioned into a training set and a testing set using an 80%/20% split. The training set was used to fit the BPANN model, while the testing set served to assess its generalization ability on unseen data. This approach is widely adopted in neural network modeling and balances the needs of model learning and validation. Furthermore, to mitigate the impact of data partitioning randomness, all samples were randomly shuffled before splitting, ensuring a representative distribution across training and testing subsets.
As shown in
Table 4 and
Figure 8, after multiple rounds of optimization and iteration, the BPANN achieved an R
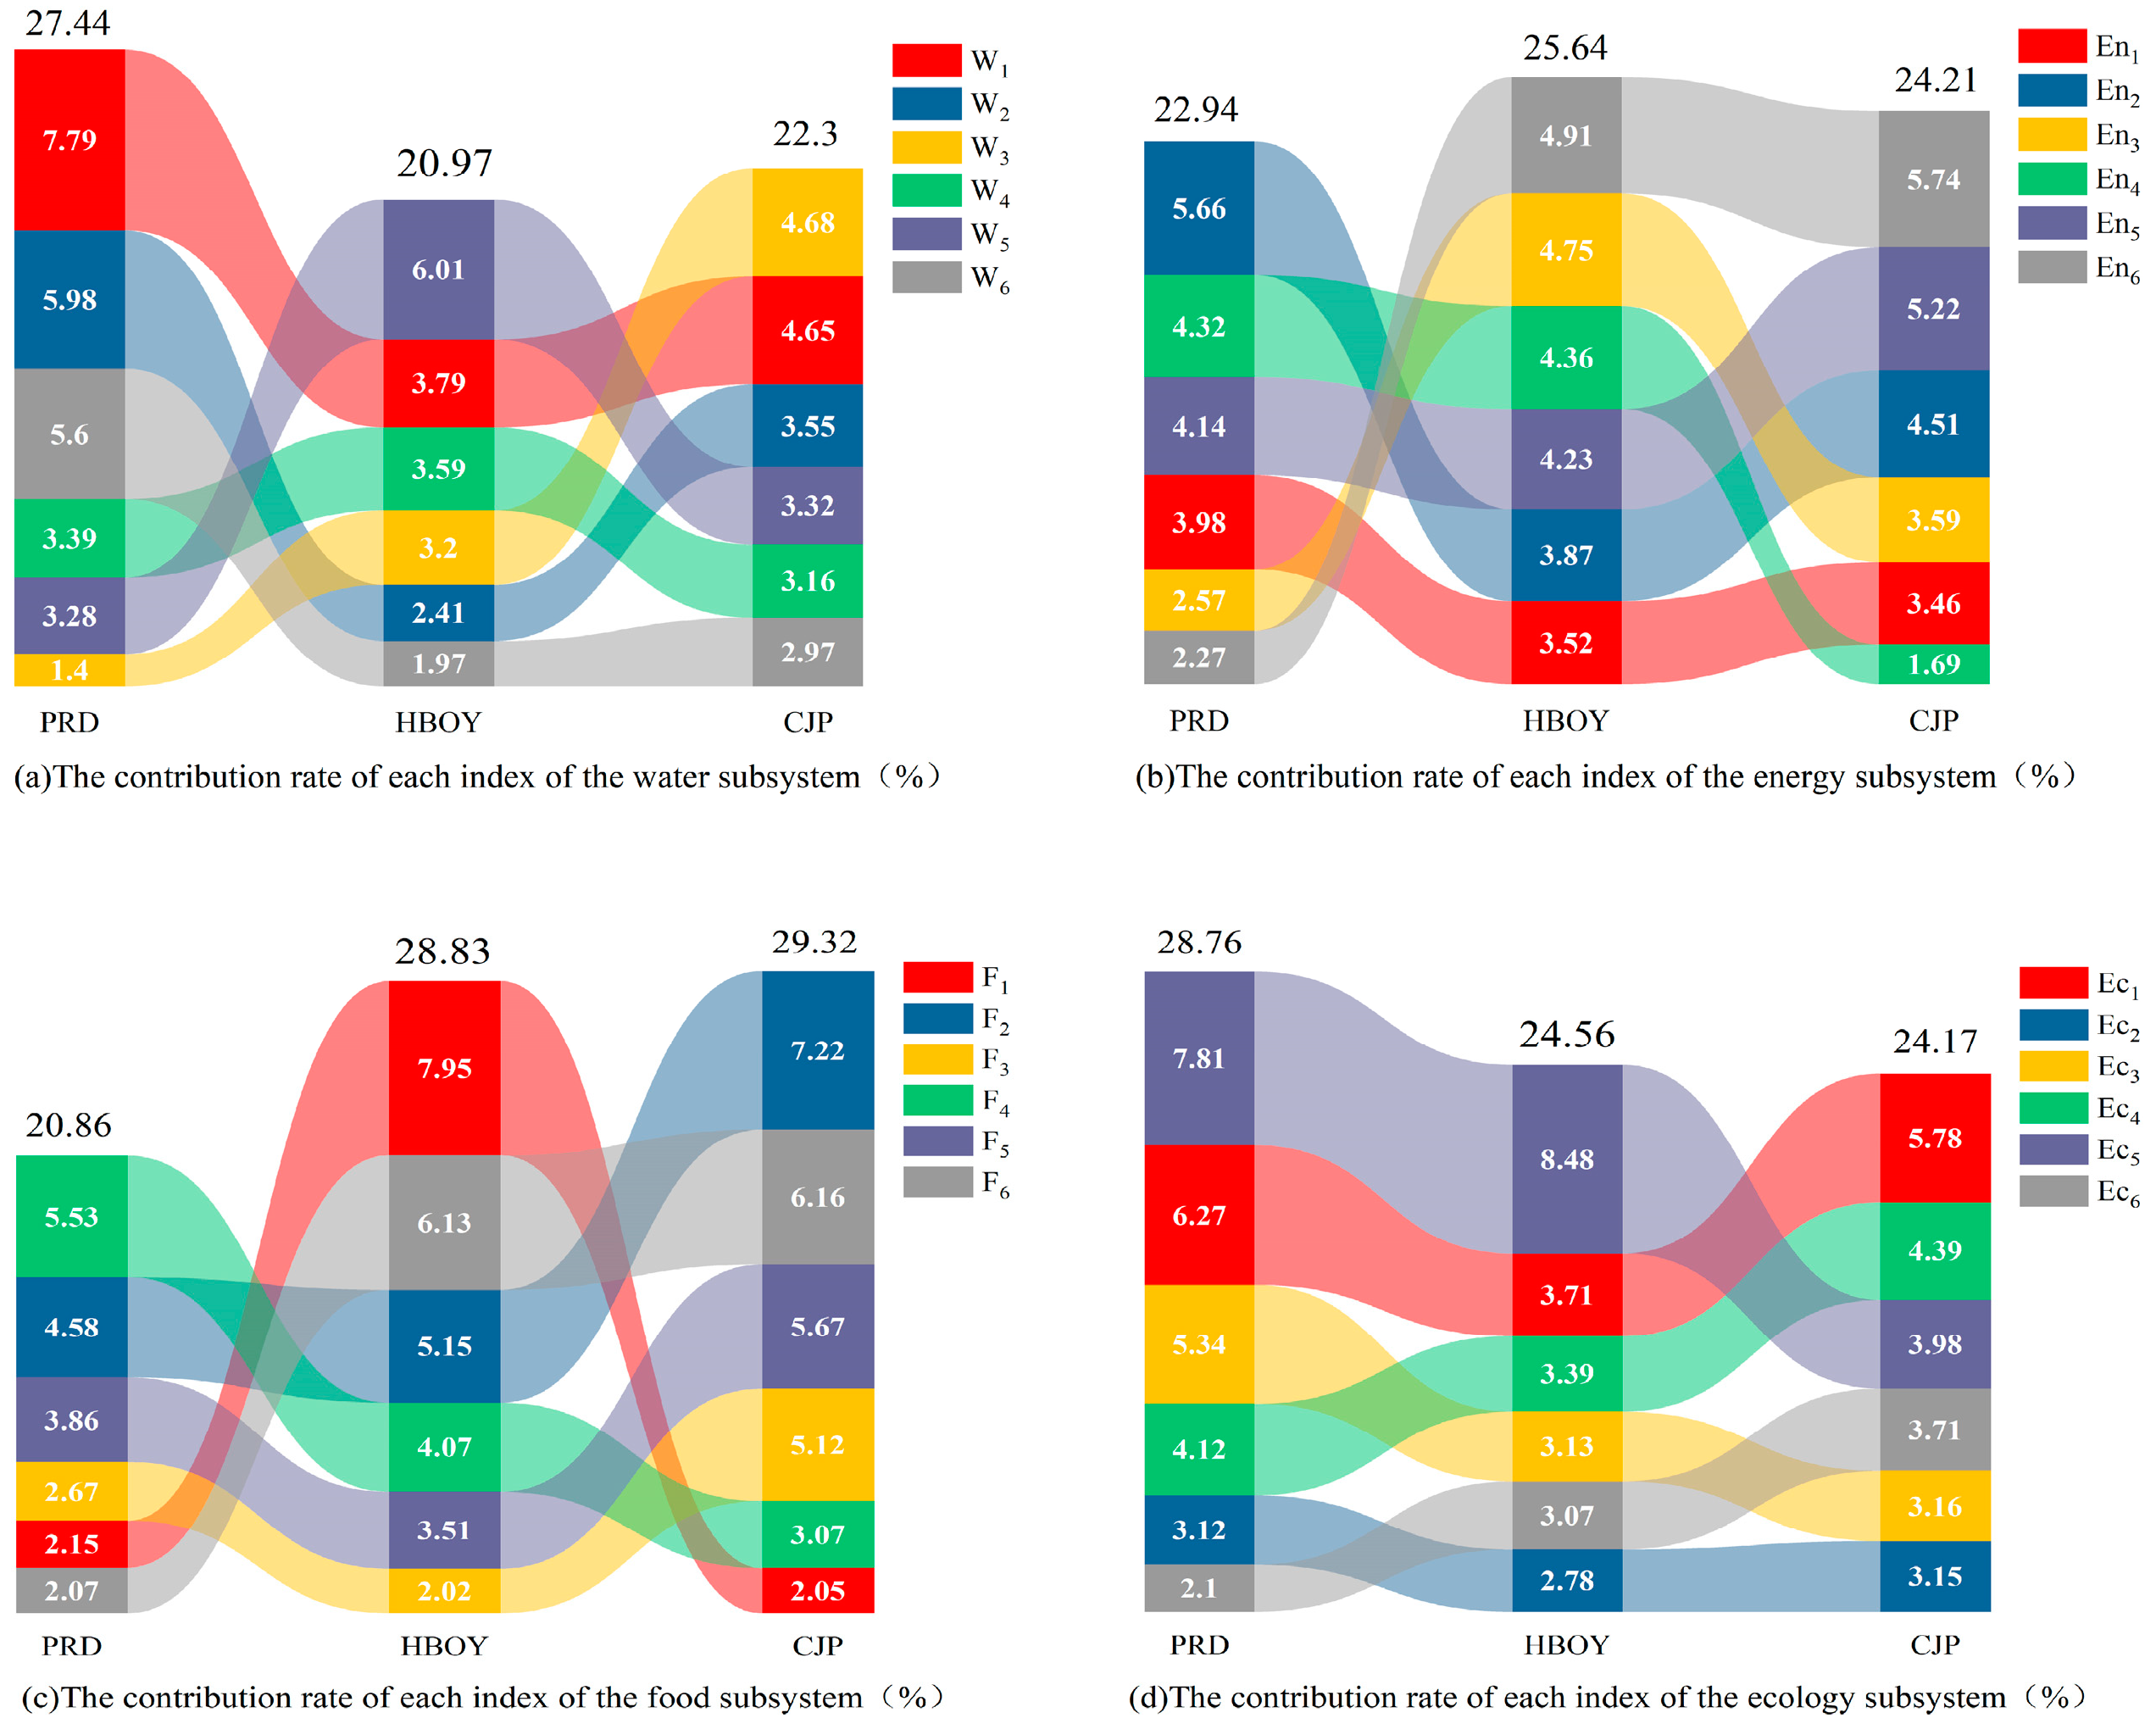
2 value close to 1 across all three datasets, with RMSE and MAE values near zero. The model exhibited excellent fitting performance, with predicted values closely aligning with actual values, thereby confirming the feasibility and efficiency of the BPANN model in evaluating the impact of WEFE indicators on CCD. Based on this analysis, weight information was further extracted from the input layer to the hidden layer, and from the hidden layer to the output layer. By applying Formulas (A1)–(A4), the specific contributions of each indicator in the WEFE system to the CCD were determined. This study presents the contribution rates of each subsystem and each indicator among the three urban agglomerations in the form of a strip chart, as shown in
Figure 9.
It is evident that the primary influencing factors of the WEFE system’s CCD vary significantly across urban agglomerations due to differences in development levels, functional positioning, and natural environmental conditions (
Figure 9).
In the PRD, the ecology subsystem (28.76%) and the water subsystem (27.44%) make the largest contributions, which can be attributed to the region’s high green coverage, advanced urban governance, and mature environmental technologies (Ec5: 7.81%; Ec1: 6.27%). In addition, the PRD’s abundant water resources and excellent urban public water-supply capacity form the basis for the development of the water subsystem (W1: 7.79%; W6: 5.6%). In contrast, the food (22.94%) and energy (20.86%) subsystems have smaller contributions in the PRD. This may be due to the high population density of the region, which increases food demand, as well as the rapid pace of urbanization, which leads to the occupation of arable land and causes extensive energy consumption and pollutant emissions (En2: 5.66%; En5: 4.14%).
In the HBOY urban agglomeration, the food (28.83%) and energy (25.64%) subsystems are the main contributors. This can be explained by HBOY’s relatively low population density and the continuing decline in natural population growth rates in many of its cities in recent years (F1: 7.95%). Moreover, the large land area offers substantial grain cultivation space and favorable production conditions (F4: 4.07%), while the development of animal husbandry has increased access to organic fertilizers, reducing reliance on chemical fertilizers (F6: 6.13%). Although the energy subsystem benefits from abundant local energy resources, the overconsumption of mineral resources (En3: 4.75%) has resulted in substantial pollutant emissions (En5: 4.23%), making its development weaker than that of the food subsystem. Additionally, the contributions of the water (20.97%) and ecology (24.56%) subsystems in HBOY are relatively limited, likely due to the arid climate, the water-intensive nature of energy and agricultural industries, and the high volume of wastewater discharge (W4: 3.59%; W5: 6.01%). Furthermore, the low population density and vast land area contribute to low ecological-economic efficiency (Ec5: 8.48%).
In the CJP urban agglomeration, the food (29.32%) and energy (24.21%) subsystems dominate in terms of contribution. This is closely linked to the favorable conditions for grain cultivation in Central Jilin (F2: 7.22%; F6: 6.16%). The relatively high share of the energy subsystem is associated with high levels of agricultural mechanization (En6: 5.74%) and relatively low pollutant emissions (En5: 5.22%). Meanwhile, the contributions of the water (22.3%) and ecology (24.17%) subsystems are comparatively lower, likely due to the substantial water consumption in agricultural production (W3: 4.68%) and low green coverage (Ec1: 5.78%).
4. Discussion
4.1. Analysis of Coupling Coordination in WEFE Systems Across Different Gradient Urban Agglomerations
The study results show that from 2008 to 2022, the coupling coordination level of the WEFE systems in the three urban agglomerations exhibited an upward trend, which is generally consistent with the findings of Cui et al. (2024) [
46]. Notably, while the PRD urban agglomeration is at a mature development stage and outperforms the other two urban agglomerations in terms of economic development, urbanization rate, industrial structure, and climatic conditions, its WEFE system’s coupling coordination level is only moderate, which does not fully align with its high level of urbanization and economic development. This discrepancy warrants further exploration, as the temporal changes in the evaluation indices of the subsystems indicate that the food and energy subsystems in PRD have developed very slowly or even regressed. Furthermore, the primary influencing factors of CCD in PRD also confirm that the food and energy subsystems are underdeveloped. On the other hand, the CJP urban agglomeration shows the opposite situation, benefiting from favorable agricultural production conditions and agricultural machinery manufacturing technology. Except for the relatively weaker water resource subsystem, the food, energy, and ecology subsystems in CJP are well developed. This suggests that inherent resource advantages are the foundation of the WEFE system’s coordinated development; however, economically developed urban agglomerations often face resource scarcity challenges. This phenomenon is consistent with other related studies, emphasizing the dialectical relationship between economic development and resource utilization [
47].
Moreover, while HBOY possesses abundant energy and agricultural resources, its WEFE system’s coupling coordination level remains the lowest. The analysis of HBOY’s WEFE system coordination development and influencing factors reveals that differences in internal resource advantages within a resource-based urban agglomeration can easily lead to uneven CCD development between cities. Inappropriate energy utilization not only adversely affects the energy subsystem itself but also hinders the development of other subsystems. Despite the rich natural resources in this region, a single resource development model has led to increased environmental pressure and decreased resource utilization efficiency. These findings align with Tang et al.’s (2021) [
48] viewpoint, which suggests that resource-based urban agglomerations often face severe ecological challenges. Thus, resource advantages alone are not sufficient to guarantee coordinated development of the WEFE system; coordination among all subsystems is also crucial. In addition, Zhen et al. (2025) [
9] found that the comprehensive development level and coordination level of WEFE systems in the Tarim River Basin in western China were both on an upward trend; furthermore, energy production and agricultural water consumption became key constraining factors. These conclusions are similar to those derived from the study of HBOY in this paper. The difference lies in the lower coordination level found in this study, as it focuses on urban agglomerations with more intensive human activities. Therefore, this study added an examination of urban greening conditions in ecological indicators, which also leads to subtle differences in the results.
In addition, the CCD values in some cities fluctuated to varying degrees in certain years. After 2008, the coordination level of some developed cities in the PRD urban agglomeration (such as Guangzhou, Shenzhen, and Zhuhai) improved. As a key node in China’s socio-economic development, the hosting of the Beijing Olympics (2008) promoted infrastructure construction nationwide, particularly in transportation, energy, and water resource management, driving resource integration and urbanization. This had a certain impact on the improvement of CCD. In 2017, the implementation of slum renovation policies had a profound impact on central and western regions, especially in the HBOY urban agglomeration. The policy promoted urban restructuring and infrastructure construction, which had a certain impact on the improvement of CCD in HBOY. However, this process may also present challenges such as resource reallocation and industrial transformation. For example, the WEFE system coupling coordination in some CJP cities experienced a brief decline, particularly in the coordination between food production and ecological protection, which still requires further improvement. From 2019 to 2022, the outbreak of COVID-19 had a significant impact on global supply chains, especially on energy production, agricultural production, and urban operations. During this period, although the economies of various urban agglomerations gradually recovered, disruptions in energy and food supply chains led to greater ecological and water resource pressures in some areas (such as Baotou and Ordos in HBOY). Especially at the beginning of the pandemic, production activities were halted, and the sharp changes in energy consumption and water demand posed challenges to the coordination of the WEFE systems in some urban agglomerations.
While the CJP urban agglomeration demonstrates notable advantages in the food and ecology subsystems, its relatively low per capita GDP and urbanization rate indicate potential bottlenecks in economic development. This is consistent with Ji et al.’s (2024) [
49] study, which highlights the importance of economic growth for the sustainable development of the entire urban agglomeration. CJP needs to explore new economic development pathways while maintaining its agricultural advantages, improving agricultural mechanization and technological levels to promote rural economic prosperity and urbanization, and thus driving the continued enhancement of the WEFE system’s CCD.
Finally, we note some intriguing early studies, such as Kennedy et al.’s (2014) [
50], whose research on urban metabolism based on water, energy, and waste materials exhibits certain parallels and contrasts with our work. Both studies examine urban material flows of various resources to explore pathways for promoting healthy and sustainable urban development. However, our study replaces the waste material indicator set with a more comprehensive ecological indicator set. Moreover, driven by concerns over urban food security crises, this research incorporates a food subsystem, thereby refining the analytical framework established by earlier scholars. Additionally, our multi-gradient urban agglomeration approach reveals development stage-dependent patterns, which challenge Kennedy’s hypothesis of a universal metabolic threshold.
4.2. Analysis of Driving Factors for the Coordination of WEFE Systems in Urban Agglomerations with Different Gradients
The dominant role of the ecology subsystem in PRD reflects the region’s long-standing efforts in ecological governance and green transformation. For instance, the Guangdong Province has implemented strict ecological red-line regulations and promoted high-standard ecological zones, which significantly enhance ecological investments and ecosystem services. This is consistent with the observed higher ecological subsystem contribution in the BPANN analysis.
In contrast, CJP’s emphasis on the food subsystem is closely related to its role as China’s core grain production region. It has been the focus of the National Food Security Strategy, receiving continuous support through policies such as farmland protection, grain subsidy schemes, and rural revitalization programs. These policy priorities explain the stronger influence of food-related factors on the region’s WEFE coupling dynamics.
The HBOY urban agglomeration, located in the central–western part of China, shows a dominant contribution from the energy subsystem. This pattern is consistent with the region’s identity as one of the nation’s most important energy production and export bases. Inner Mongolia, where Hohhot, Baotou, Ordos, and surrounding cities are located, possesses abundant coal reserves, as well as rapidly developing wind and solar energy capacities. According to China’s 14th Five-Year Plan, the region is designated as a national energy strategic base, supporting large-scale energy infrastructure projects. Consequently, the local economy is highly dependent on energy-related industries, and the development trajectory is strongly tied to energy system dynamics. The significant influence of the energy subsystem in this region, as captured by the BPANN model, reflects this structural dependency and policy emphasis.
4.3. Limitations of the Study
This paper primarily explores the coupling effects between the water, energy, food, and ecology subsystems in the PRD, HBOY, and CJP urban agglomerations, considering the nonlinear relationships between indicators and CCD, and delving into the key factors influencing CCD. However, there are still some limitations in this study. For instance, while the selected urban agglomerations represent three distinct development gradients, the sample size is relatively small and cannot encompass all types of urban agglomerations. Additionally, the gradient indicators considered only include the three commonly used indicators of urban agglomeration development, whereas the actual development of urban agglomerations is influenced by a multitude of complex factors. Furthermore, this study lacks consideration of external factors affecting the WEFE systems of urban agglomerations—external uncertainties can interfere with the stable development of WEFE systems. Finally, this study focuses solely on identifying influencing factors of CCD in WEFE systems across different gradient urban agglomerations, without predicting future development trends of WEFE systems in different development gradients. These issues will be addressed in future research.
5. Conclusions and Recommendations
5.1. Conclusions
By constructing an evaluation system for the WEFE systems of PRD, HBOY, and CJP urban agglomerations, this paper used comprehensive evaluation indices and a CCD model to assess the coupling coordination level of the three major urban agglomerations from 2008 to 2022. The BP neural network model was further employed to explore the factors affecting the coupling coordination development of WEFE systems under different development gradients. The conclusions are as follows:
The comprehensive indices of the water, energy, food, and ecology subsystems exhibited overall upward trends across all three urban agglomerations, though notable regional disparities persist. The comprehensive evaluation index of the WEFE system was highest in CJP, followed by PRD, and lowest in HBOY.
The CCD of the WEFE systems showed a general increase over time. Nonetheless, differences in coordination levels were evident both across urban agglomerations and within individual cities, though such disparities have narrowed. The WEFE system in HBOY had the lowest CCD values, with most cities ranging from 0.3 to 0.5 (mild imbalance to imminent imbalance). The CCD values in CJP were the highest, ranging from 0.4 to 0.6 (imminent imbalance to barely coordinated). PRD’s CCD values were between those of CJP and HBOY, with a range similar to CJP’s—also between 0.4 and 0.6 (imminent imbalance to barely coordinated).
Analysis of the differences in development gradients among the three urban agglomerations and their relationship with the CCD of the WEFE system revealed certain patterns. After urbanization rates exceeded 70%, the CCD generally exhibited a negative correlation with urbanization. The relationship between industrialization rate and CCD was generally negative, but this was not absolute. Per capita GDP had a generally positive correlation with CCD in all three urban agglomerations.
The primary contributing indicators to the CCD of the WEFE system vary across the three major urban agglomerations. In the PRD, the water and ecology subsystems make the most significant contributions to the overall coordination of the WEFE system. In the HBOY urban agglomeration, the food and energy subsystems are the dominant contributors. In contrast, the food subsystem in the CJP urban agglomeration surpasses the others, playing the leading role in promoting the coordinated development of the WEFE system.
5.2. Recommendations
For mega-urban agglomerations like PRD, efforts should be made to leverage their strong economic capacity and mature urban systems to promote the transfer or upgrading of lagging industries and develop low-energy, high value-added industries. Controlling unplanned population growth and actively building low-carbon cities are also essential [
26]. At the same time, to ensure food and energy security, PRD should improve food and energy reserve systems, increase the scale of reserves, and diversify supply channels. The government can implement compulsory measures to protect arable land and increase support for local agriculture by promoting new agricultural technologies and crop varieties to enhance food self-sufficiency.
In resource-dependent urban agglomerations like HBOY, the role of the energy subsystem in the WEFE system will gradually weaken. Future efforts should focus on optimizing the energy structure, expanding the development and utilization of renewable and clean energy, and shifting from coal-fired power to renewable energy technologies to reduce greenhouse gas emissions and primary energy losses [
51], such as solar and wind energy. Promoting the adoption of advanced energy production and processing technologies and equipment will not only improve energy conversion and utilization efficiency but also reduce environmental pollution. Lastly, the government should establish a mechanism for the coordinated development of the energy industry across urban agglomerations, strengthening communication and coordination among cities in areas such as energy planning, project construction, and joint ecological governance to effectively enhance the efficiency of water, energy, food, and ecological resource utilization.
In agricultural urban agglomerations such as CJP, where the food subsystem has significant advantages, increased agricultural water use and energy consumption are also concerns. Future efforts should focus on improving water resource utilization by promoting agricultural water-saving irrigation technologies, such as drip and sprinkler irrigation, to reduce water wastage in agriculture. Strengthening material and information exchanges between cities, clarifying industrial positioning, reducing internal competition in agricultural development, and establishing a system of complementary advantages in water, energy, food, and ecology will collectively promote the coordinated development of the WEFE system in surrounding cities.


