Article

Investigating the Influence of Renewable Energy Use and Innovative Investments in the Transportation Sector on Environmental Sustainability—A Nonlinear Assessment

by
Mohammed Adgheem Alsunousi Adgheem
* and
Göktuğ Tenekeci
Department of Civil Engineering, Institute of Graduate Studies and Research, Cyprus International University, 99100 Haspolat, Cyprus
*
Author to whom correspondence should be addressed.
Sustainability 2025, 17(10), 4311; https://doi.org/10.3390/su17104311
Submission received: 27 March 2025 / Revised: 28 April 2025 / Accepted: 5 May 2025 / Published: 9 May 2025

Abstract

:
Ecologically sustainable economic development is increasingly recognized as essential to global efforts to improve and protect environmental and socio-economic conditions. The transportation sector is also important regarding the movement of human beings and goods. Fossil fuels are primarily used in transport vehicles and emit carbon dioxide into the atmosphere. Hence, innovative investments in the transportation system and the use of renewable energy play a key role in overcoming this lingering problem. This study utilizes nonlinear autoregressive distributed lag (NARDL) methods to uncover key drivers influencing innovative investments in the transportation sector and the impact of renewable energy use on environmental sustainability in France between 1995 and 2020. The results indicate that renewable energy use and transport infrastructure innovations positively and negatively impact environmental sustainability. Both variables have different influences on the dependent variable depending on the economic shock period. Based on the outcomes, this study offers the following significant policy insights: (i) France could invest in innovations in renewable energy sourcing and incentivize switching from combustion engine-based transport systems. (ii) France should commit to the Europe 2020 strategy for green growth to ensure resource efficiency and promote environmental sustainability, which requires a coordinated effort to invest in smart transport systems that leverage technologies like the Internet of Things, artificial intelligence, and big data analytics. (iii) Given that two-thirds of France’s electricity is produced from nuclear sources, the government needs to implement policies in the renewable energy sector to reduce over-reliance on nuclear energy sourcing.

1. Introduction

The environmental sustainability concept refers to the ability to maintain the ecological balance of the natural environment and conserve natural resources that support the well-being of current and future generations. For corporations, the concept that supports a healthier environment also helps them to produce, build brand trust, increase customer loyalty, and improve employee satisfaction. It is currently not a luxury but a corporate social responsibility.
Regrettably, the never-ending quest for economic growth has driven global resource use and environmental pollution to unprecedented levels. Global economic activities require increasing levels of energy consumption, causing destruction to the ozone layer and leading to global warming and climate change. Some studies across the broader literature affirm that it is evident that without proper reverence for natural resources, the world would exceed the limit of resource endowments, which offer humankind life, food, healthcare, biodiversity, and water [1,2,3]. This call is anchored on the environmental Kuznets curve (EKC) by [4], which scientifically claims the existence of an inverted U-shaped relationship between growing economic output and rising environmental pollution levels. Figure 1 shows the per capita CO2 emissions in France from 1802 to 2023, which is the case study of this research.
Given that these situations threaten human existence, scientists have indicated an urgent need for academic and policy action. Prior research admits that the call to address these environmental sustainability crises remains unsettled based on unique factors like transportation investment innovations and renewable energy utilization [5].
Standing at the cusp of sustainable transformation, decarbonizing the transport sector has become a primary global focus due to the urgency to address the climate crisis by limiting the sector’s contribution to global warming through green innovations and reaching net-zero emissions by 2050. Globally, the transport sector has historically been pivotal to enhancing economic development. It adds to economic output and improves access to social and environmental opportunities, notwithstanding its associated direct and indirect externalities, including traffic congestion, air pollution, and human fatalities. Theoretically, a sustainable and green transport sector is critical to meeting the objectives of several 2030 sustainable development agenda targets. The role of the government in investing in innovations in the transport sector to stimulate economic development while protecting the environment is crucial. According to [6], these innovation-based investments are required purposely to mitigate the adverse effects of carbon emissions and promote human health, especially in city environments for cases of CO2 and SO2 (i.e., PM10 and PM2.5) across the world [7]. Traditional developments in personalized vehicles have contributed to massive traffic jams on major roads, culminating in severe mobility and energy use problems [8]. Some studies claim that innovations in transport investments could make road and sea transport more efficient [9,10]. In 2012, the European Commission urged member countries to prepare strategic frameworks to implement innovative transport sector research that promotes micro- and macro-mobility, realizes economic growth, and limits environmental pollution. Innovations in low-carbon transportation technologies help to improve the fuel economy and reduce emissions.
Additionally, innovations in Electric Vehicles (EVs) contribute to reducing greenhouse gases and ensure the future of the economy’s low-carbon mobility. In micro-mobility and active transport (e.g., scooters, bikes, etc.), innovations resonate with modern consumers since, in addition to reducing greenhouse gas emissions, they can improve connection to public transit and reduce reliance on private vehicles. This notwithstanding, IEA scenarios indicate that LDVs will continue to be powered by internal combustion engines in conventional, hybrid, and plug-in hybrid configurations in the next 50 years. In order to achieve a sustainable transport system, vehicle efficiency must be improved, and low-carbon vehicles and fuels must be adopted. The benefits of innovation include the reduction in costs, the promotion of technology learning, and the improvement in the performance of conventional and zero-emission vehicles (electric or fuel cell electric). In the hardest-to-abate modes like heavy-duty vehicles, maritime, and aviation, where technologies that are currently commercially available alone cannot deliver the emission reductions outlined in the SDS, it is particularly important to innovate efficiency technologies and low-carbon vehicles and fuels. In addition to improving efficiency at the system level, innovation can also play an important role. Innovations in digital technologies, such as deep learning algorithms and communications technology [11], may facilitate the matching and optimization of supply and demand in the transport industry.
Further, several other scholars have claimed that transport sector innovations in energy use could encourage the adoption of environment-friendly energy consumption, including liquefied petroleum gas, biofuels, and hydro-based electricity [12,13]. Furthermore, innovations in digital and electronic transportation equipment have been found to reduce transport-sector-based carbon emissions. However, critics argue that this claim represents overly simplistic views for reducing CO2 emissions without relevant policy actions [14,15].
Renewable energy utilization represents another critical factor widely found to help promote environmental sustainability. Across the world, governments have found that overspending on fossil fuels in the energy sector leads to rising global carbon emissions, a major threat to global warming [16]. For instance, researchers have found that reducing this climate challenge requires promoting the penetration of renewable energy for economic activities [17]. In their investigations on emerging Asian markets, [18] found that increased fossil fuel use, including resource depletion, economic growth, and population growth, causes increases in carbon dioxide emissions. However, they found that green energy utilization (e.g., solar, wind, and hydro) stimulates economic growth and reduces carbon emissions. Other scholars who obtained similar results include [19,20,21].
Theoretically, renewable energy sourcing to facilitate economic growth requires technological progress [22]. Nonetheless, critics claim that renewable energy sourcing creates unplanned demand for new natural resources [23]. In this case, research acknowledges that renewable energy sourcing, overwhelmingly touted as a panacea for fossil energy use, can potentially hinder global dematerialization goals [24]. Figure 2 shows France’s per capita renewable energy consumption from 1965 to 2023.
To obtain answers to these questions, the economy of France presents a suitable case study for scientific investigation, as the country is a European Union member that is strongly committed to fighting against climate change, but strangely, 31% of her total greenhouse gas emissions come from the transport sector, with no significant sign of decreasing in the recent decade. Figure 3 illustrates carbon dioxide emissions from the transportation sector in selected European Union members in 2022.
France must commit to implementing important sustainable transport sector policies to maintain compliance with the Paris Agreement and remain within the UN’s requirements within the 1.5 degree Celsius limit. Accordingly, the country implemented the Mobility Orientation Law on Transport, passed in 2019, which makes green mobility a national priority. This strategically commits the economy to participate in competitive innovations in smart transportation products and services. In the area of ecological transition, the country is implementing transportation policies, including developing more efficient and less polluting vehicles, constructing sustainable transport systems, and reinforcing the adoption of mobility services and collective transportation.
Consequently, the country has committed to supporting innovative investments in producing an estimated two million electric and hybrid vehicles with EUR 2.5 billion. In 2022, budget allocations of EUR 100 million will support innovative charging infrastructure nationwide. To develop green and smart airplanes, the government has invested EUR 1.2 billion in research and development through the government aero research entity CORAC, ambitiously aiming at 30 percent savings in fuel and, ultimately, hydrogen fuel use by 2035. Toward developing 5G and quantum technologies for future connected transportation, the country is implementing mobility 3.0, targeting sensors, wireless communications, computing, real-time, and localization technologies.
Given this understanding, it is important to investigate the following questions: (i) Is there a relationship between renewable energy utilization, innovative investments in the transportation sector, and environmental sustainability? (ii) If any, how can this relationship be explained? This study addresses lingering questions, such as those in France between 1995 and 2020. This study employs novel nonlinear autoregressive distributive lag (NARDL) approaches, widely validated to have the capacity to accurately capture long-run asymmetries among time series variables [25]. The NARDL model, a technique established by [26], offers numerous benefits over the traditional ARDL model. This model is distinguished by its independence from linearity assumptions, its analysis of asymmetric long-term impacts of both positive and negative influences, and its ability to incorporate cointegration within a single equation [27].
Besides, the NARDL estimator can decompose and differentiate positive and negative shocks independent of the dependent variable [28,29]. It is anticipated that insights from this study could serve as a guide for enacting environmental sustainability delivery by the United Nations and France. Finally, the results of this investigation could be helpful to future works of environmental scientists. This paper is organized as follows: the next section reviews the existing literature on the topic, followed by the methodology. Thereafter, this study will conduct an estimation and discuss relevant outcomes. The final section is the conclusion and policy recommendations.

2. Literature Review

In accordance with the Paris Agreement, France aims to reduce greenhouse gas emissions and the reliance on hydrocarbons by 20% by 2020. A number of measures have been taken to achieve this goal, including the use of modal transfer and complementary and less polluting means of transportation, which reduce unnecessary travel and develop innovative systems that meet the needs of economic, ecological, and social cohesion. Theoretically, experts have found that the complexity of assessing environmental sustainability largely hinges on infinite economic growth and continuous striving for qualitative improvements for humanity in a finite and non-expandable earth [30,31]. Some experts have observed economies that have experienced growth but lacked development. Theoretically, economic growth with quantitative throughput growth is experienced when infrastructure and industrial developments are high or reach maturity before throughput growth stagnates with qualitative improvements in citizens. At this point, the goals of environmental sustainability are achieved [32].
However, several other scientists claim it is possible to alter growth trends and establish sustainable ecological and economic stability through innovations and technology [33].
This review seeks to investigate scientific studies on the relationship between renewable energy utilization, transportation investment innovations, and environmental sustainability. In doing so, this review will consider economic growth and primary energy consumption as controlled factors in this paper.

2.1. Transport Infrastructure Innovations and Environmental Sustainability

In recent times, relations between transport infrastructure innovations and environmental sustainability have been central due to heightened environmental consciousness and the need to enhance the environmental performance of the transport sector, innovation, and formulation of relevant sustainability policies. Transport infrastructure is fundamental to delivering a modern economy and ensuring the mobility of people, goods, and services. The transport sector’s environmental performance is significant due to its contribution to environmental pollution, resource diminution, greenhouse gas emissions, and long-term cost savings [34]. The sustainability of transportation systems is a significant concern for urbanization, as demonstrated by the escalating air pollution concerns in large cities. Consequently, enhancing the transportation system must be meticulously strategized for global sustainability, which is called green transportation or sustainable transportation [7].
Kapur et al. [35] defined transportation infrastructure as the fundamental transport development framework that enables the transport system (including airports, roads, railways, seaports, and canals) to function correctly. However, delivering such a framework requires a great deal of financial investments, material resources, and policy decisions, which have remained problematic and debatable among policymakers and researchers for decades. Ref. [36] devised a transport model for four passengers in Northern France, encompassing urban and intercity journeys via walking, cycling, public transport, and private vehicles. This model assesses the effects on traffic flows and pollutant emissions resulting from two pricing reforms: complementary public transport and road pricing in Lille, the principal metropolitan area of the study region. Evidence indicates that free public transit facilitates a substantial shift in transportation modes, leading to decreased private car usage. The road pricing model we have evaluated yields comparable effects, albeit to a limited extent.
With the strong argument that innovations and technological growth improve transport sector services delivery with less pollution [14,37,38,39,40], critics are of the view that such innovations tend to create carbon emissions and degrade the quality of the environment. The critics explain that transport sector innovations result in massive equipment whose application causes significant destruction to material resources. Nevertheless, proponents argue that environmental destruction is avoided if investments in the transport sector are in the green and digital sectors [37,38]. Ref. [41] examine French governmental policies aimed at reducing carbon dioxide emissions from freight transportation in small and medium-sized enterprises. The findings indicate that these enterprises, motivated by internal initiatives and customer expectations, adopt sustainable strategies and implement various measures to establish a greener supply chain.

2.2. Renewable Energy Consumption and Environmental Sustainability

With an expanding global economy and growing population, the daily energy requirement cannot change despite calls for reducing carbon emissions [42,43]. Globally, mitigating climate change caused by fossil fuel use without creating vulnerability and poverty remains the prime challenge of energy policy. Accordingly, renewable energy has become a “focusing device” in global climate and energy strategies and guiding policy [44,45]. Renewable energy, such as solar, wind, geothermal, hydro, and biomass, is naturally sourced and renewable [46]. In their definition of renewable energy, the European Union includes wind, solar, hydro and tidal power, geothermal energy, biofuels, and recyclable waste fractions [47]. Empirically, this has received validation from several academics [22,48].
Notwithstanding, however, critics argue that the renewable energy concept is problematic and ambiguous [49]. They argue that five significant issues underpin their views on the renewable energy concept. (i) First, they claim that the renewability of energy does not guarantee sustainability; (ii) second, the critic warns that renewables produce varying forms of energy and policy challenges; (iii) third, they argue that global renewable energy policies have yielded mixed outcomes; (iv) the renewable energy concept generates an environmentally harmful bait-and-switch; and (v) the renewable energy concept is misleading. Additionally, many environmental experts argue that the growth of renewable energy sourcing creates new needs for natural resources and hinders global dematerialization goals [23,24]. Ref. [50] identified three new challenges for French energy policy: moving away from carbon-based fossil fuels, investing in electricity generation to meet the growing demand for electricity as a result of the electrification of energy uses, and providing the large-scale storage and retrieval of renewable energies. In their study, ref. [51] suggested that France should be committed to increasing the contribution of renewable energy in its energy mix to reach at least 40% of total consumption by 2030 to achieve carbon neutrality by 2050. The study also reiterated that growth poses several new challenges that require policymakers and regulators to act on technological changes and the expanding need for flexibility in power systems.

2.3. Total Energy Supply and Environmental Sustainability

Another determining factor in environmental sustainability modeling is the estimation of the total energy supply of economies. Total energy supply is defined as an economy’s overall energy supply requirements, not including international aviation and maritime bunkers. Other scholars determine this to include other fuels used elsewhere, including “fuel tourism” for cases of road transportation. It is instructive to note that, in general, researchers claim that global energy demand has increased by a third since 2000 amidst current economic growth levels, and this is projected to continue rising in business-as-usual situations. They explain that approximately 83% of global energy use is from fossils. In theory, industrialization and other high-energy-consuming activities cause environmental pollution and material over-extraction [52,53].
To reverse this environmental problem, experts have called for the adoption of innovation and technology in energy sourcing and use [54], citing instances of successful case studies of waste, material exploitation, pollution, and economic growth decoupling [55,56]. Besides, energy productivity conception has been recommended for implementing closed-loop systems, energy efficiency practices, system optimization, and business model transformations.
Several critics argue that despite the positive impacts of innovation and technological advancements in renewable energy sourcing, such innovations produce inefficient material-sourcing equipment, which tends to hinder the global quest for dematerialization [24,57]. Besides, critics argue that reducing waste, material demand, and pollution is impossible if innovations around the energy mix are not green or efficient.

2.4. Economic Growth and Environmental Sustainability

In recent history, a key area of public policy has been answering questions on the how and the extent of protecting the quality of the environment, especially in the pursuit of economic growth. The policy problems gained momentum from researchers in the early 1970s with the realization of the need to ensure environmental sustainability amidst rising economic growth. Economic growth means a persistent rise in economic activity toward improving quality of life. Unfortunately, environmentalists claim that such economic growth activities negatively impact the quality of the environment because the two are interlinked [58]. It remains highly debated as traditional economic theorists suggest a trade-off between economic growth and the quality of the environment [59,60] while several other scholars agree that economic growth and environmental sustainability are closely related [61,62]. The study carried out by [63] in G7 economies using the panel NARDL approach revealed that economic growth has a positive and significant relationship with environmental performance. However, a decline in economic growth positively influences environmental performance in the long term.
Theoretically, [4] explained an inverted U relationship between gross domestic product increases and unit indicators of environmental quality and statistically coined the term ‘Environmental Kuznets Curve’ (EKC). Environmental performance diminishes during the economic development and growth process, but beyond a certain threshold, it begins to improve. In economic growth, the throughput of materials and energy tends to culminate in waste generation, environmental pollution, and material depletion [64,65]. By explaining this through the environmental Kuznets curve (EKC) hypothesis, ref. [4] claimed that pollution increases during the initial stages of economic output until a given threshold is reached, before we observe a downward slope when innovation and technology applications take shape.
While some studies have validated the EKC hypothesis [66,67,68], several others indicate that the EKC hypothesis is invalid in certain contexts [40,69]. Other studies on the EKC hypothesis also find inconclusive outcomes [70,71]. Another theoretical debate emerging in the economic growth and environment quality nexus is the pollution haven hypothesis [72] which claims that industries use trade to invest in countries with relaxed pollution control laws. The Heckscher–Ohlin model [73] on its part, explains how economies deliberately relax their pollution laws to attract foreign investments [74].
Based on this review exercise, it is evident that studies on the interest variables have inconclusive outcomes. It is also clear that the effect of the interest variables produces varied outcomes on environmental quality depending on various factors. To validate these findings, this paper seeks to investigate the effect of innovative investments in the transportation sector and renewable energy utilization on environmental sustainability in the case of France between 1995 and 2020 using novel nonlinear autoregressive distributed lag (NARDL) approaches for their capacity to produce accurate and robust outcomes for policy action.

3. Methodology

3.1. Data Sourcing

This paper investigates the effect of transport investment innovations and renewable energy supply on France’s environmental sustainability between 1995 and 2020. The role of economic growth and total energy supply is controlled to realize this objective. The data for carbon emissions as a proxy for environmental sustainability were sourced from the World Bank’s World Development Indicators [75]. Other variables were extracted from the OECD database [76]. The variables’ details, descriptions, and sources are in Table 1 below.
Data were selected for this assessment based on theoretical and empirical insights into the reviewed literature [77]. This paper controls variables to avoid scaling problems by transforming and expressing them in natural logarithm forms, except for the renewable energy supply [78].
The analytical flowchart below (Figure 4) illustrates various steps and the order in which the analysis was carried out. It is a diagrammatic representation of the analytical process for this empirical investigation.

3.2. Empirical Model

Nonlinear Model

As mentioned, the empirical model is based on nonlinear relationships between the explanatory variables x and y as the explanatory variable. Taking into account both the positive and the negative shocks, the effects of the regressors are decomposed. In this case, a “shock” refers to the movement of the value of an x variable at a specific time. If the variable is leveled or lagged, its new value will be the pre-shock average plus the shock value. The shock lasts for one period if the variable is in differences or lagged differences (since permanent changes in a differenced variable would indicate that it is changing every period). Nonlinear functional forms can be decomposed into the following categories:
Y = ƒ ( X 1 t + , X 1 t ,   X 2 t + ,   X 2 t ,   X 3 t + ,   X 3 t ,   X 4 t + ,   X 4 t )
Here, X t + and X t are partial sums of positive and negative explanatory variables, respectively, on variations in X t due to economic shock. The logged nonlinear ARDL model is as follows:
L C O 2 i t = ϑ 0 + ϑ 1 L G D P 1 t + , L G D P 1 t , + ϑ 2 L T E S 2 t + ,   L T E S 2 t + ϑ 3 L T I I 3 t + ,   L T I I 3 t + ϑ 4 R E N 4 t + ,   R E N 4 t + ε i t
The dependent variable reacts as (+) or (−) sums to a variant form of the independent variable.

3.3. Econometric Approaches

3.3.1. BDS Test

A stochastic hidden nonlinear pattern can be detected with [79] BDS test, which can detect any stochastic hidden nonlinear pattern if any exists. It is considered significant if the significance level is 5% in hypothesis testing. As a result of the test, the hypothesis will be as follows: H0: the data are independently and identically distributed (I.I.D). H1: the data are not I.I.D., which implies that the time series are nonlinearly dependent if the natural logarithms’ first differences are considered. In order to detect model misspecification, it is necessary to perform this test, which is expressed as follows:
B D S m T ( ɛ ) = T 1 / 2 C m , T ɛ C 1 , T ɛ m / δ m T ( ɛ )
where T refers to the sample size, ɛ is the proximity parameter, and δ m T (ɛ) is the standard deviation of the statistic’s numerator that varies with dimension “m” [80].

3.3.2. Unit Root Tests

Stationarity prevents spurious regression estimates [81]. The ADF Unit Root Test with Break Point developed by [81] was used in this study. The following equations mathematically represent this Unit Root Test:
Δ x t = ϕ x t 1 + ε t
where Δ x refers to variations in the data, t denotes time, ϕ is the slope coefficient, and ε is the error term. The efficiency of estimates is through model augmentation as
Δ x t = 0 + γ t t + ( ϕ 1 ) x t 1 + i = 1 p β i Δ x t p + 1 + ε t  
where the null hypothesis is (ϕ − 1) and x follows a random walk ∆ and is the first difference operator. Previously, ignoring structural breaks resulted in unit-biased or false null hypotheses [82].

3.3.3. NARDL Bounds Test

Positive and negative shocks must be determined to find hidden long-run cointegration accurately in modern econometrics. This follows the NARDL cointegration model used initially by [28] that explains how the dependent variable, Y t , increases (+) and decreases (−) with variations in each independent variable of Xit and is specified as
Y t = β o + β 1 X t + μ t
Y t is the target variable, Xt is the regressor, and β1 explains changes in Y t per unit variation in Xit. Using the [83] two-step framework, the model is reformulated as follows:
Y t = β o + β 1 + X t + + β 1 + X t + μ t
To begin, the paper specifies the asymmetric regression model:
Δ y t = β 0 + i = 1 p 1 λ i   Δ y t i + i = 0 q δ i +   Δ x 1 i i + + i = 0 q δ i   Δ x 1 i i + i = 0 q λ i +   Δ x 2 i i + + i = 0 q λ i   Δ x 2 i i + + ρ Y t 1 + φ 1 + X 1 t 1 + + φ 1 X 1 t 1 + φ 2 + X 2 t 1 + + φ 2 X 2 t 1 + μ t
In this model, the long-run asymmetric effects of X 1 on Y are calculated as L M 1 + = φ 1 + ρ , and L M 1 = φ 1 ρ is the short-run asymmetric effects of X 1 on Y. If the symmetry hypothesis is rejected, the impact of X on Y is asymmetric.

3.3.4. NARDL Estimation Model

The nonlinear autoregressive distributed lag (NARDL) model postulated by [26] was employed for the estimation. It combines the cointegration and nonlinear asymmetry in a single equation with a small sample size and does not need the integration of the variables in the same sequence. The NARDL model examines the impact of the positive and negative fluctuations in the deconstructed variables on the dependent variable. This technique calculates all effects by considering heterogeneous slopes and assuming Es. Despite the short sample size, it offers strong empirical results because it is, in essence, a dynamic error correction representation [26,84]. The NARDL model for this study is shown below:
Δ L P C O 2 t = β α 0 + i = 1 p α 1 Δ L P C O 2 t i + i = 0 p α 3 Δ L G D P t i + + i = 0 q α 3 Δ L G D P t i + i = 0 p α 2 Δ L T E S t i + + i = 0 q α 3 Δ L T E S t i + i = 0 p α 4 Δ L T I I t i + + i = 0 q α 3 Δ L T I I t i + i = 0 p α 4 Δ R E N t i + +   i = 0 q α 3 Δ R E N t i + ρ L P C O 2 t 1 + φ 1 + L G D P t 1 + + φ 2 L G D P t 1 + φ 1 + L T E S t 1 + + φ 2 L T E S t 1 + φ 1 + L T I I t 2 + + φ 2 L T I I t 2 + φ 1 + R E N t 2 + + φ 2 R E N t 1
where Δ Y t = α 0 + i = 1 p α 1   Δ y t 1 + i = 0 q α 2   Δ X t i + + i = 0 q α 3   Δ X t i denotes short-run and ρ y t 1 + φ 1 + X t 1 + + φ 2 X t 1 + indicates long-run estimates. Also, X t + and X t are the partial sums of POS (+) and NEG (−) changes in X t . Like the ARDL Bounds test, the NARDL models determine the long-run relationship between the independent variables or X + , X , and the dependent variable or Y [85].
For purposes of the robustness of estimates, this paper will conduct B-P-G Heteroskedasticity [86], Ramsey Reset [87], and Breusch–Godfrey Serial Correlation tests [88]. For example, similar to other regression models, multicollinearity can be an issue with ARDL models as well. In fact, when independent variables are highly correlated, this can render the coefficient estimates to be inaccurate and the model may be difficult to interpret as a result of multicollinearity [89].

4. Empirical Outcomes and Discussion

This paper examines the effect of innovative investments in the transportation sector and renewable energy use on environmental sustainability in France between 1995 and 2020. Both economic growth and total energy supply are used as statistical controls to achieve this goal. Table 2 explains the variables’ statistical characteristics.
As can be seen, the BDS estimates (Table 3) indicate hidden nonlinear patterns since all variables have “dimensional critical values” that are more significant than the BDS estimates. In this case, the null hypothesis of independent and identically distributed variables (I.D.D) is rejected. As a result, the variables are nonlinearly dependent upon each other after taking the first differences of their natural logarithms.
This paper utilizes the ADF Unit Root Test to determine the variables’ unit root features. Table 4 presents the results of the ADF Unit Root Test with the Break Point test.
The ADF Unit Root Test outcome with breaks (Table 4) indicates that all variables are integrated at the order I (1) with different breakpoints at a 1% significance level. At a 5% significance level, LTRI seems I (0). Based on the ADF Unit Root Test outcome with breaks in Unit Root Tests, this paper estimates long-run relationships among the variables using the N-ARDL Bounds test.
As seen in Table 5a, the F-statistics of the N-ARDL Bounds test are greater than the critical value. This means there is a long-run linkage among the variables, and further testing is required.
As shown in Table 5b, the NARDL long-run equilibrium estimates for LTII indicate a nonlinear causal impact on LCO2. To be more precise, the coefficient estimates show varying outcomes in different shock periods, with a statistical significance of 1%. An increase in LTII by 1% causes a rise in LCO2 by approximately 0.65% under positive shock situations, while a decrease in LTII causes a rise in LCO2 by 0.49% under negative shock situations. The car industry is one of the highest spenders on research and development, representing nearly 25% of global R&D spending in 2018 [90]. Numerous technologies can lead to fuel economy improvements, including energy-efficient tires, improved aerodynamics, fuel-efficient combustion technologies, engine downsizing, and powertrain electrification. Reducing vehicle weight is a key means to improve fuel efficiency. Lightweighting techniques such as using high-strength steel and aluminum in the chassis can reduce the mass of the vehicle while cutting both fuel consumption and total life-cycle CO2 emissions [91]. Based on the results, the response to the impact is nonlinear or moves in a similar direction. Because of this study, the hypothesis established for this study is also validated (i.e., investments in transportation infrastructure lead to a variety of in-country carbon emission outcomes in France).
This outcome validates the findings of [92], who found that sustainable mobility was only used for urban planning purposes in France. However, it did not reduce polluting modes of travel due to bypassing road infrastructure constructed to reduce negative impacts in inner cities. Even though high-speed rails are less polluting than short-speed rails, there has been a lack of investment in the rail sector for years. As a direct result of economic growth, the transportation sector consumes considerable energy and produces significant carbon emissions. France’s transport development policy must reflect technology adoption, green multimodality, and decoupling from economic growth to resolve these environmental issues.
Second, according to the NARDL long-run cointegration assessments (Table 5b), LTES has a positive and a negative long-term causal impact on LCO2 as both coefficients are positively significant (i.e., 5.8854222% for LTES_ (+)) and negatively significant (i.e., −4.793189 for LTES (−)) and statistically significant at 1%. Based on these results, any 1% increase in LTES increases LCO2 by approximately 58.85% during periods of positive shock. During negative shock periods, however, a 1% decrease in LTES leads to an increase in LCO2 of 47.93%. Based on this outcome, the hypothesis developed for this assessment has been validated (i.e., the overall energy supply in France results in varied in-country carbon emissions). France’s economic growth has resulted in a consistent increase in biomass imports since 2000. Despite the Energy and Climate Law of September 2019, the share of renewable energy in total energy consumption in 2018 was only 16.5% [51].
A third finding (from Table 5b) shows that, in the case of LGDP, there is a causal impact on LCO2 that is both positive and negative. These findings can be seen from the coefficients, which are both positive (i.e., 8.059837% for REN_ (−)) and negative (i.e., −3.272161% for REN_ (+)) and statistically significant at the 1% level. In the case of France, these results indicate that an increase in LGDP of 1% leads to a reduction in LCO2. However, at negative shock periods, a 1% decrease in LGDP results in a surprise decrease in LCO2, as the two variables move in a similar direction (as evidenced by the positive relationship between the independent and dependent variables). Compared to negative shock periods, positive shock periods for LGDP reduce LCO2 for France. Because of this, this study validated the hypothesis established for this study (i.e., economic growth has varied effects on in-country emissions in France). A reduction in in-country emissions can be attributed to exogenous technological progress in abatement processes, as described by [93], thereby contributing to ensuring strict environmental policies on long-term economic growth, such as in the case of France. In summary, the burning of fossil fuels for the generation of electricity and heat contributes significantly to global warming. As long as coal, oil, or gas is burned to generate electricity, carbon dioxide and nitrous oxide are produced as powerful greenhouse gases that blanket the Earth and trap the sun’s rays.
A fourth finding of the NARDL long-run equilibrium tests (see Table 5b) is that LCO2, in the case of REN, experiences both positive and negative nonlinear changes in the long run. The significance of these coefficient estimates can be explained by the fact that they are both positive (i.e., 0.030948% for REN_ (−)) and negative (i.e., −0.035880% for REN_ (+)) but statistically significant at a 1% level. Based on these results, an increase of 1% in REN at positive shock periods causes a decrease in LCO2 of approximately 0.035%. As opposed to this, for negative shock periods in France, a 1% decrease in REN results in a 0.0309% decrease in LCO2, as both variables appear to follow similar paths. Based on these findings, the hypothesis (i.e., increased investments in renewable energy supply have a varied effect on France’s in-country emissions) is confirmed. However, in-country emissions were less during negative than positive shock periods. This implies that France is committed to a dedicated effort to increase the share of renewable energy and the productivity of materials, with a target of 30% by 2030. France must, therefore, reduce its in-country emissions by using less primary energy and material. The results of this study confirm those of [94].
Model diagnostic statistics were calculated using the Breusch–Pagan–Godfrey heteroscedasticity test [86], Breusch–Godfrey Serial Correlation LM test [88] and Ramsey Reset test [87], as shown in Table 6. As a result of the Breusch–Pagan–Godfrey heteroscedasticity estimates, the null hypothesis of homoscedasticity could not be rejected, indicating that the model is homoscedastic. Additionally, the Breusch–Godfrey Serial Correlation LM estimations indicate that the null hypothesis of no serial correlation at up to two lags cannot be rejected, indicating that there is no serial correlation at up to two lags. The Ramsey Reset test confirms that the estimated model is correctly specified and stable since the probability is greater than 5%.
It is instructive to note that, according to [95], ARDL models help to significantly reduce spurious regression possibilities. In their study, they found that ARLD models help solve spurious regression problems in both unit root calculations and missing variable errors, especially by introducing lag-dependent values in the analysis.

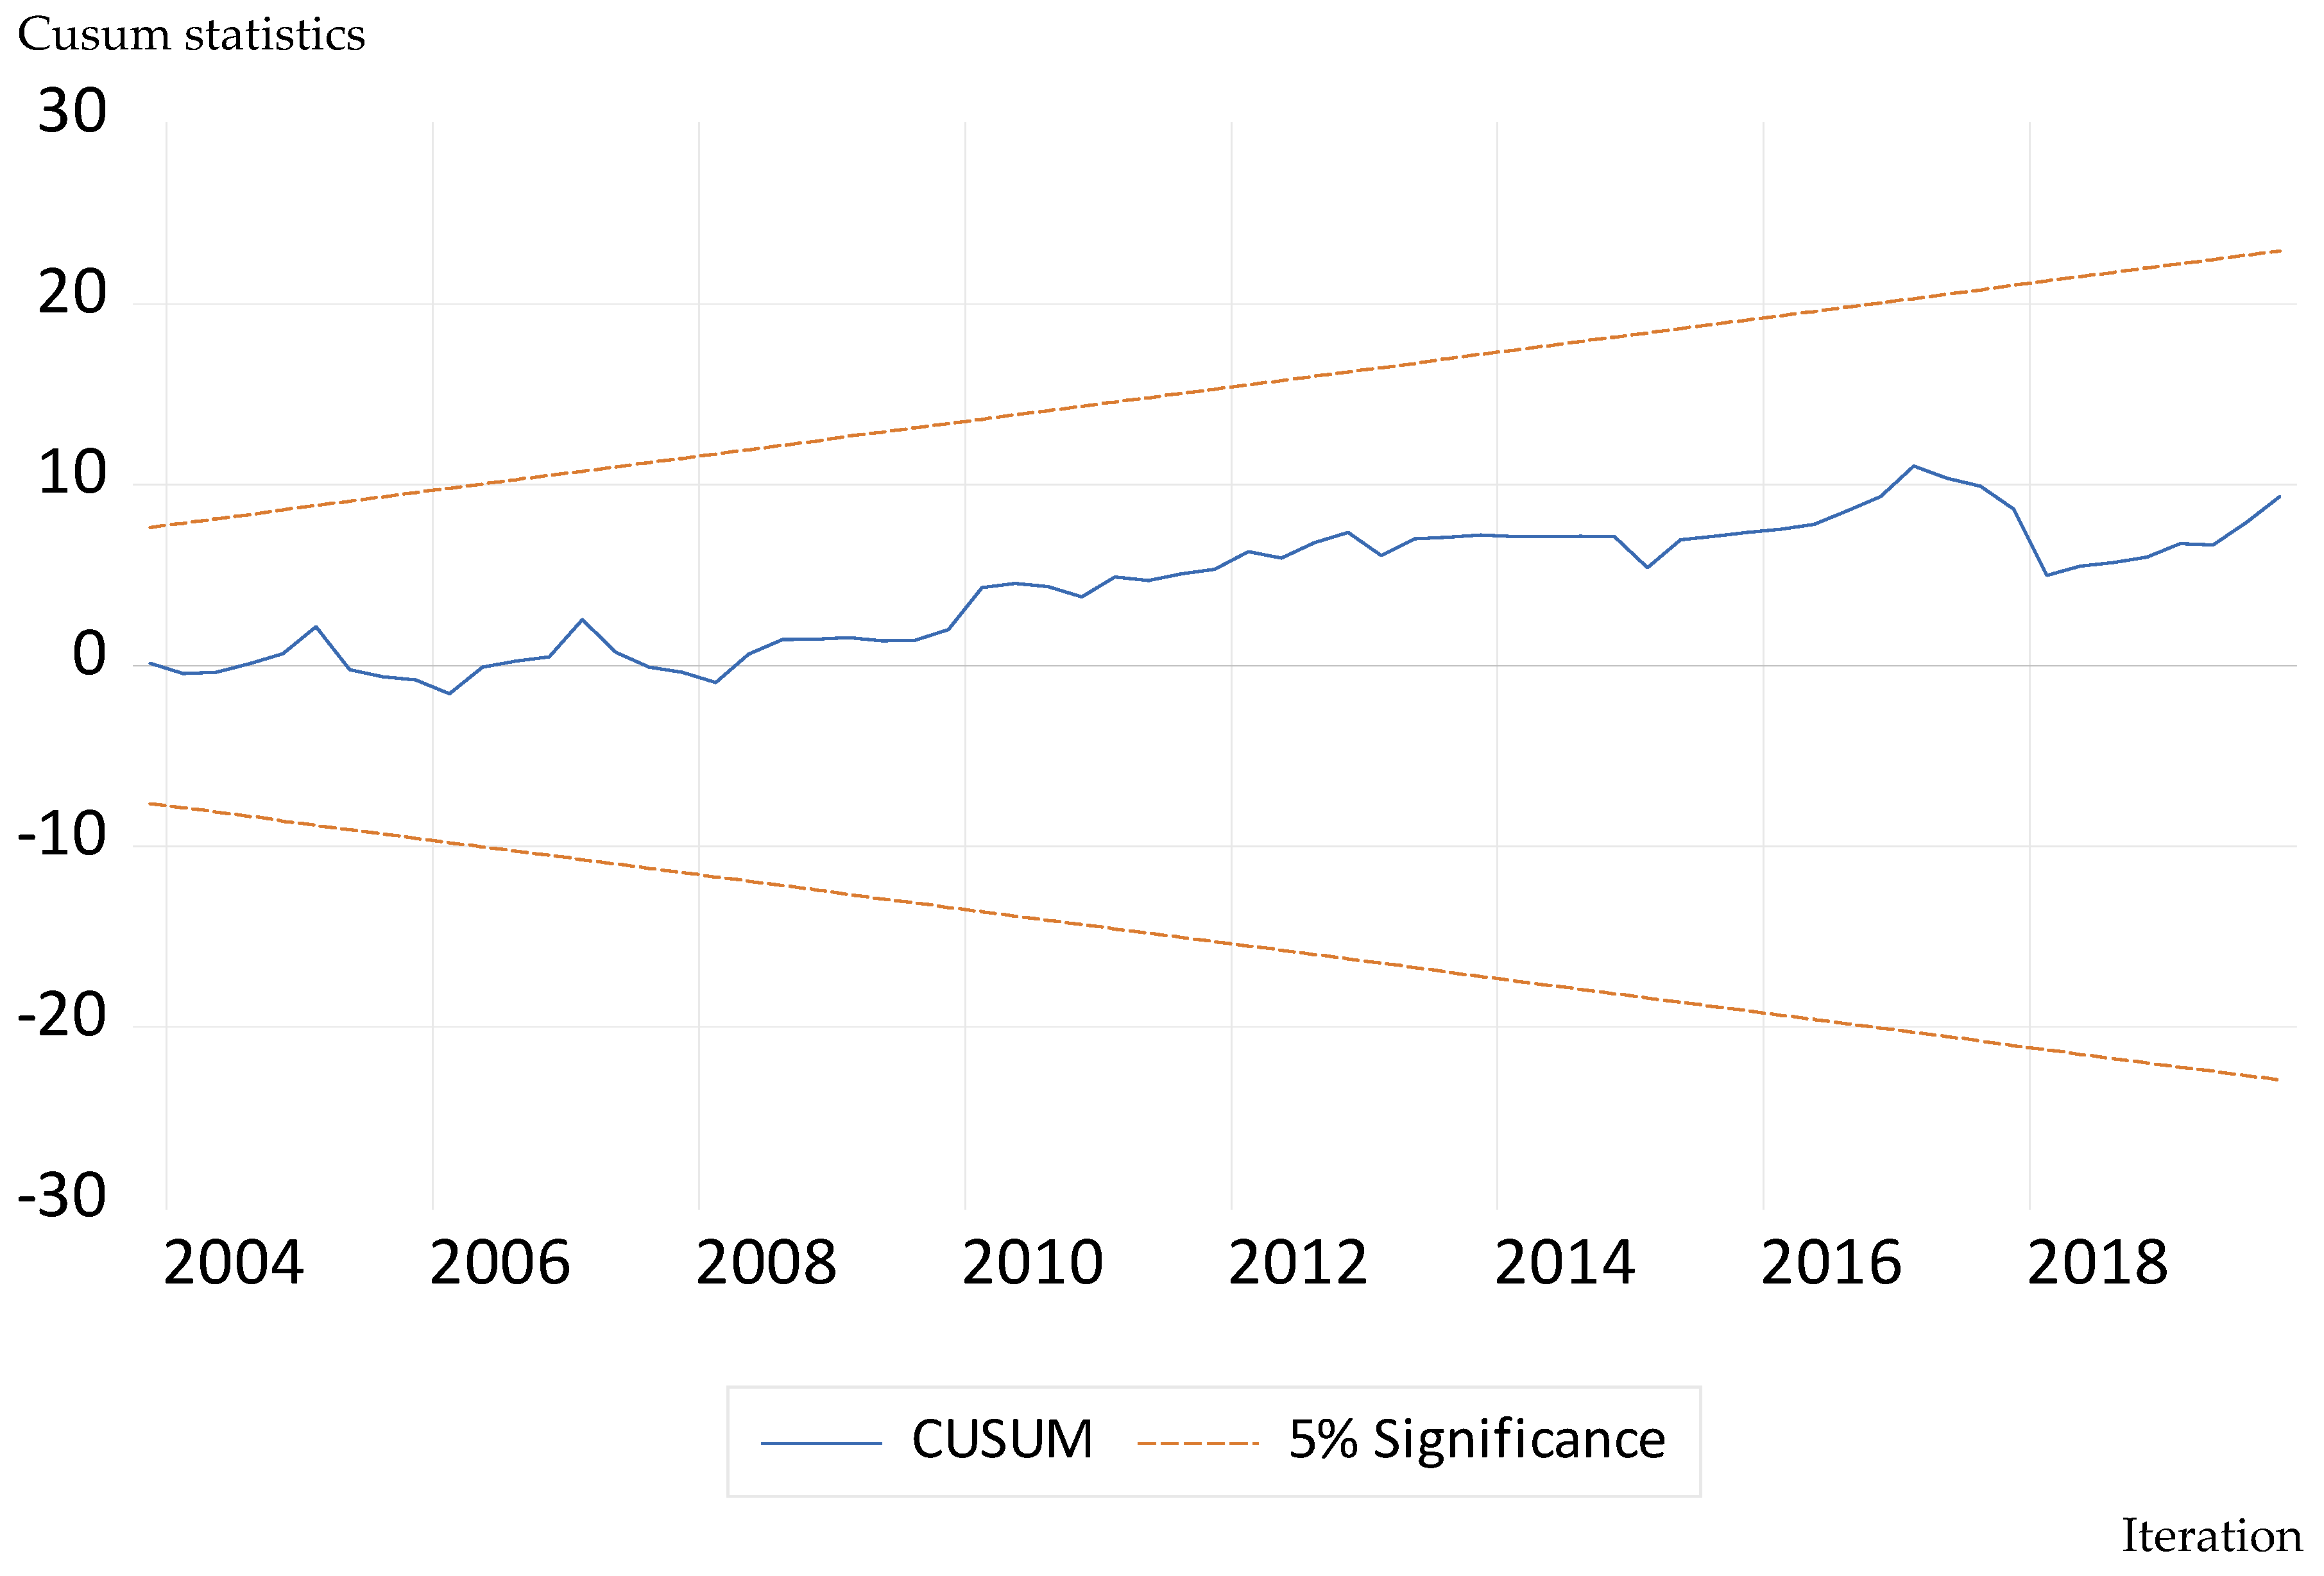
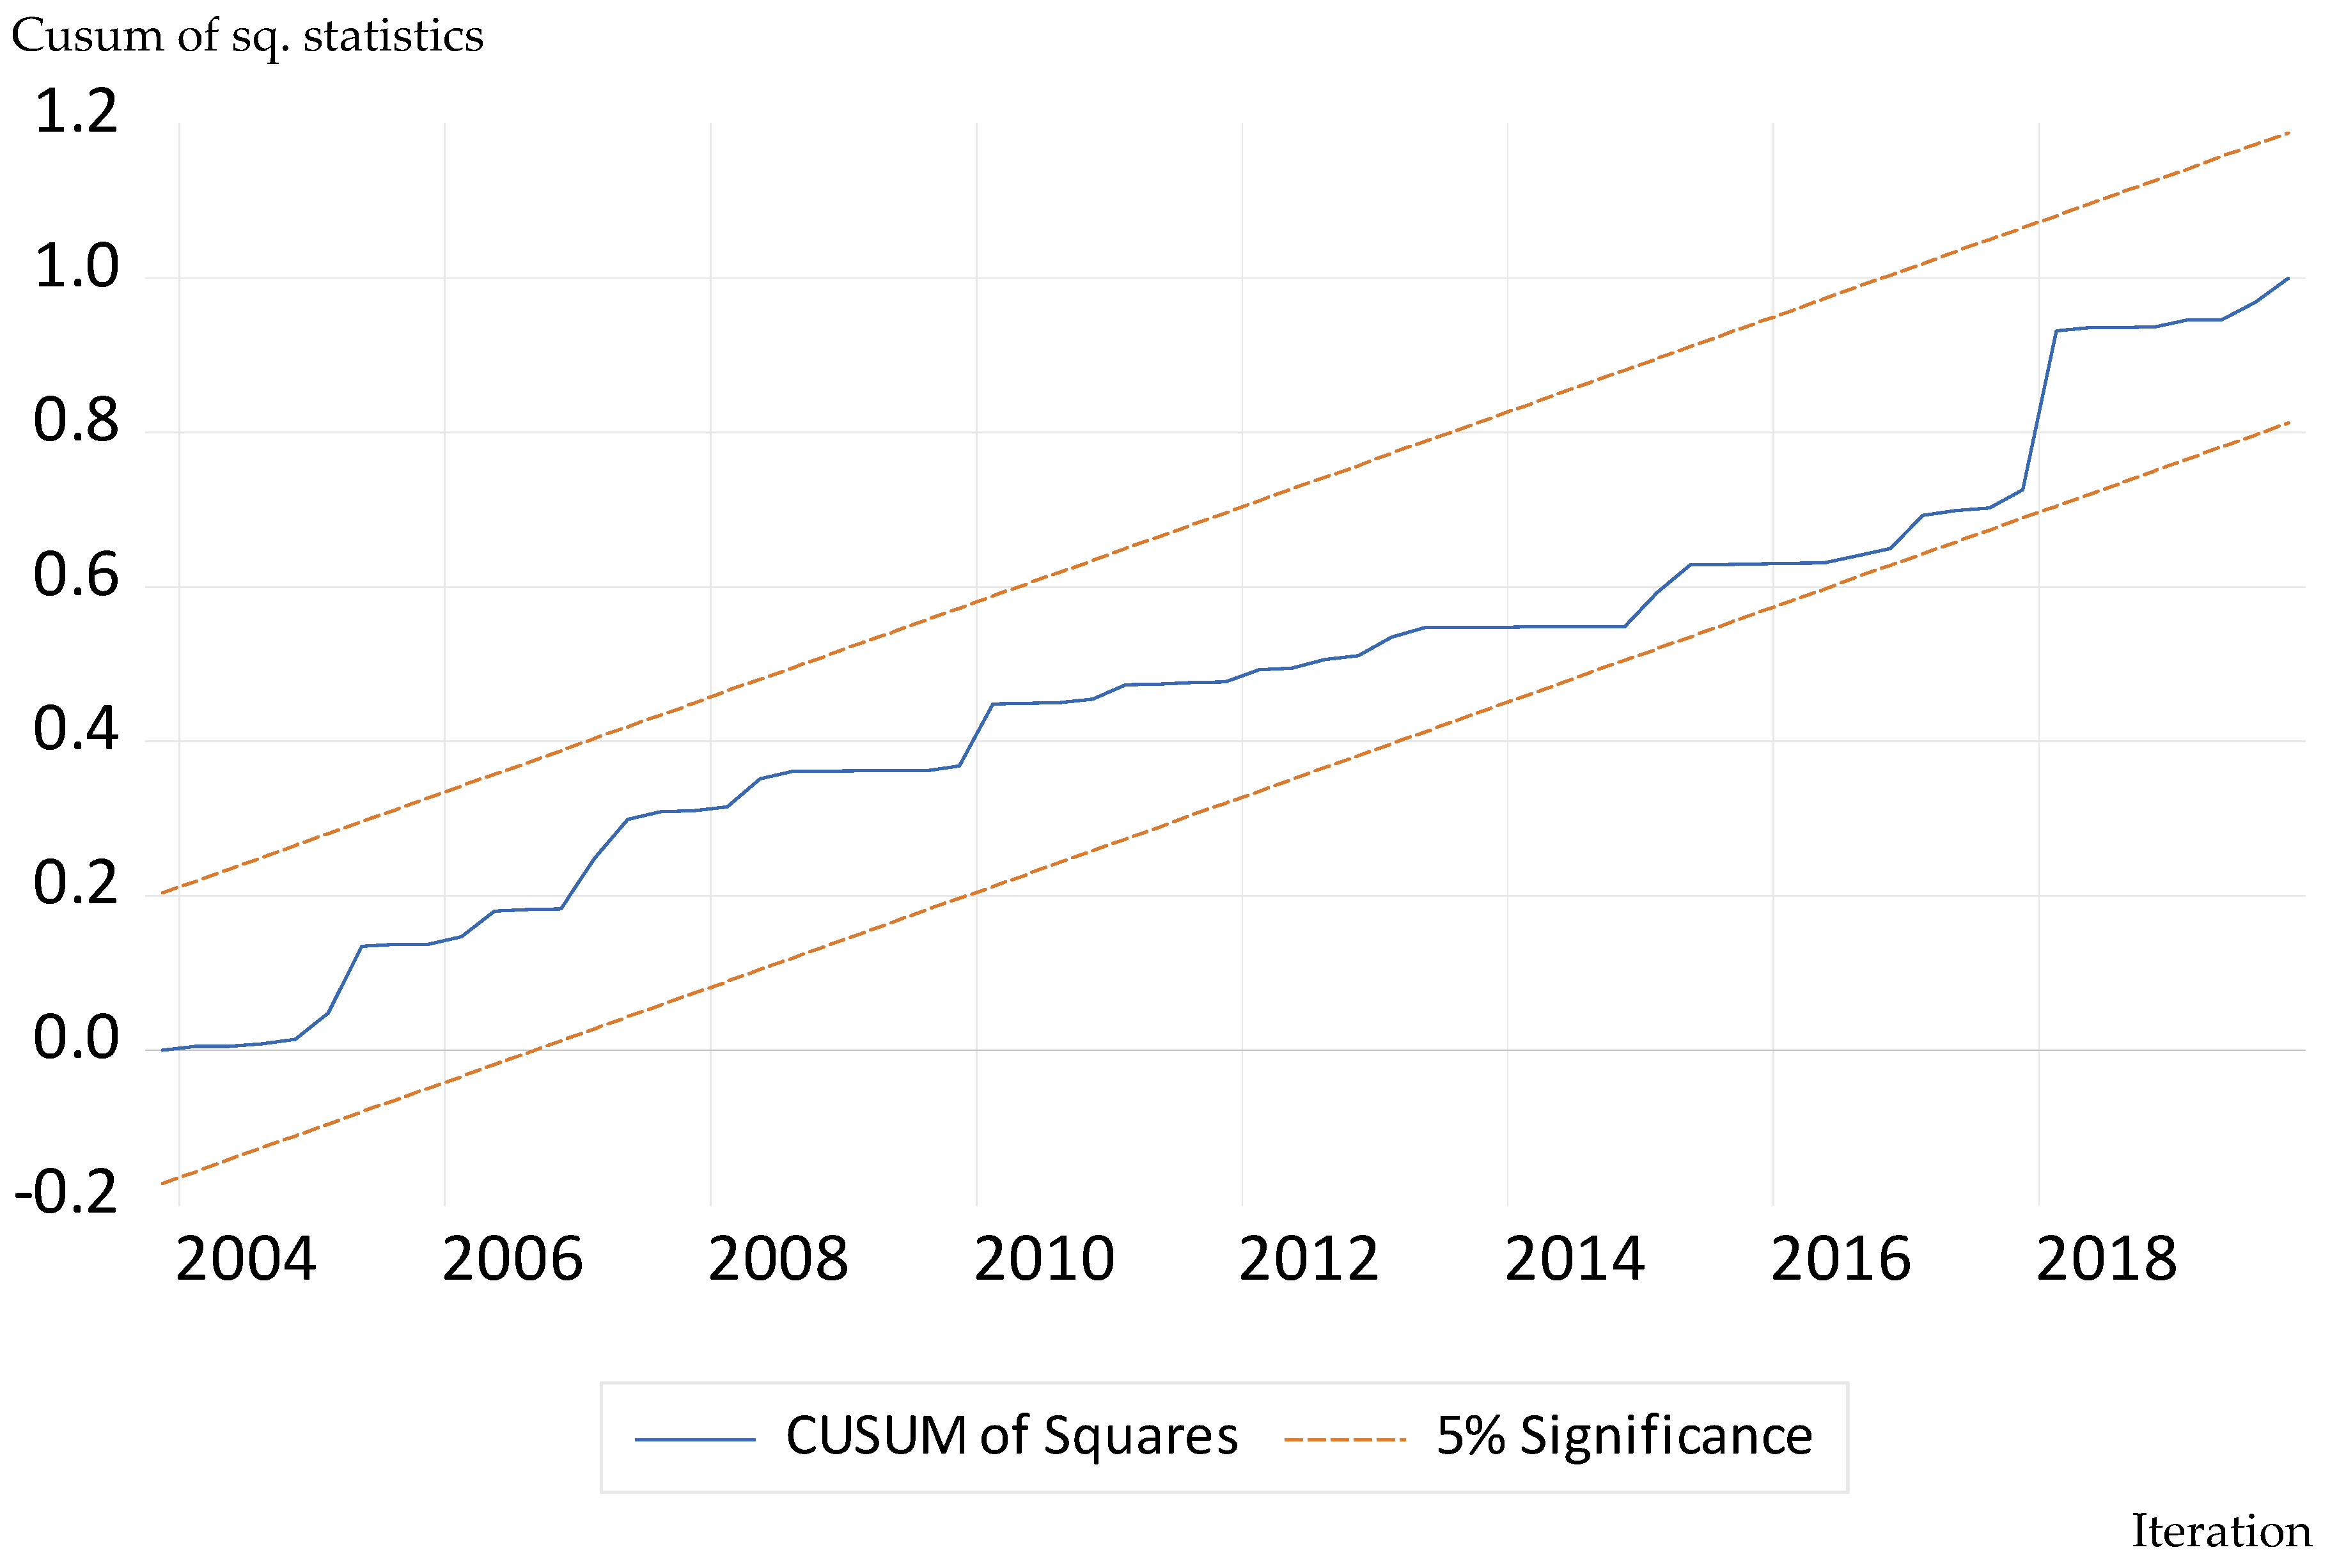
Residual Diagnostics

Historically, researchers have considered the stability of the model and residual diagnostic assessments to be essential when conducting empirical studies. For France to reduce its in-country emissions, the coefficient estimates in the error-correction model should be stable to make recommendations regarding the behavior of independent variables. Accordingly, this study uses the cumulative stability test of [96] to determine model stability. For serial correlation issues, the Breusch–Godfrey Serial Correlation LM test was employed, as well as the Breusch–Pagan Heteroskedasticity test developed by Trevor Breusch and Adrian Pagan to detect the presence of variance in the error term and its relations to predictor variables in the model [97].
As demonstrated in Figure 5 and Figure 6, both the CUSUM and the CUSUM of squares tests for model structural stability indicate that the models’ statistical estimates are within acceptable limits. The statistics are significant at the 5% significance level, indicating that the coefficients in the models are structurally stable [96]. Table 6’s results indicate that the model does not exhibit heteroscedasticity or serial correlation. Lastly, the Ramsey Reset test (Table 6) revealed that the model is free of omitted variable bias.

5. Conclusions, Policy Recommendations, and Future Research Directions

Across the world, experts have agreed that decarbonizing development means decarbonizing the world economy. The science has been unequivocal in recent years: stabilizing climate change implies bringing net carbon emissions to zero. According to the United Nations, decarbonizing the world economy requires global policymakers to act swiftly by enacting policy packages that trigger changes in investment innovations, technologies, and behaviors. As a European Union member, France leads regional climate change campaigns. France has demonstrated climate leadership under the European Union framework by enacting climate law, planning climate legislation toward net zero in 2019, and engaging in various climate negotiations culminating in the landmark Paris Agreement of 2015. To deliver ambitious climate goals, France needs academic support to enact policies toward realizing its domestic environmental targets.
This study investigated the effects of transport sector innovations and renewable energy use on France’s environmental sustainability from 1995 to 2020. The nonlinear autoregressive distributed lag (NARDL) estimates indicate that renewable energy use and transport infrastructure innovations positively and negatively impact environmental sustainability.
Based on this outcome, the following policy insights are offered to France on its efforts to deliver realistic pollution and net-zero targets. First, France could invest in renewable energy sourcing innovations and incentivize switching from combustion engine-based transport systems. The government of France could also foster the need to shift to low-carbon fuels and support the adaptation of France’s oil and gas infrastructure by engaging in cross-border cooperation on other fuels, such as hydrogen. This also involves supporting research and innovation in emerging clean energy technologies to be ready for the market in time. To change the course of their overly high focus on new nuclear reactors and reluctance to close the gap in existing clean energy sourcing, the government could invest heavily in the renewable energy sector to reduce over-reliance on nuclear sourcing. It is instructive to warn that such a policy to increase investment in renewable energy innovation may face challenges in terms of funding, technology, and markets in the short run. The situation may not be different in implementing policies to reduce reliance on nuclear energy since doing so may have a serious impact on short-run energy supply security.
Second, France could commit to the Europe 2020 green growth strategy to ensure resource efficiency and promote environmental sustainability. This requires a coordinated effort to invest in smart transport systems, which leverage technologies like the Internet of Things, artificial intelligence, and big data analytics. The transport sector of France currently contributes 32% of total greenhouse gas emissions. It is imperative that France increases its investments in renewable energy resources and provide incentives for electric mobility adoption, given the low proportion of renewable energy sources in the country’s energy mix. As part of its efforts to decarbonize its vast fleet of vehicles, France could heavily encourage the development of low-carbon liquid fuels, biogas, electricity, and hydrogen.
Third, the government must implement policies in the renewable energy sector that reduce the over-reliance on nuclear energy sources while improving energy productivity. At present, the economy is at a crossroads regarding energy and decarbonization. Therefore, key decisions for its sustainable future energy system require investing in energy efficiency, renewable energy, and radically decommissioning nuclear power (reactors) to realize its climate goals. This is because France has always, for many years, believed that although cutting nuclear power plants is necessary, in the medium term, the relevant choice from ecological, economic, and cost-least perspectives requires continuous investments in power plants and a renewable energy sourcing strategy until 2035. However, the authors believe that this position on nuclear power needs to radically change toward an effective realization of climate goals.
The shortcomings of this study provide insights into future research directions. In particular, data were captured on only France for analysis. Future studies could gather data on several other economies for analysis to gain robust estimates. Besides, the data were sourced from 1995 to 2020. Future studies could explore a long-term data collection size. Additionally, although studies on in-country emissions abound, this study focused on a few parameters (such as renewable energy use and transport sector innovations) that have not been exhaustively explored. First, future studies could consider several more economies, given that this study only focused on one country. Second, future investigations could consider other less explored environmental-sustainability-determining variables such as artificial intelligence, blockchain, and smart cities. Further, future studies could prioritize socio-economic determinants of in-country emissions in several economies, given available facts about the dynamism of consumer behavior and choices.

Author Contributions

M.A.A.A.: conceptualization, methodology, and writing—original draft. G.T.: methodology and writing—review and editing. All authors have read and agreed to the published version of the manuscript.

Funding

This research received no external funding.

Institutional Review Board Statement

Not applicable.

Informed Consent Statement

Not applicable.

Data Availability Statement

Data are available online.

Conflicts of Interest

The authors declare no conflicts of interest.

References

  1. Pirgmaier, E.; Hinterberger, F. What Kind of Growth is Sustainable?: A Presentation of Arguments. In Growth in Transition; Routledge: Abingdon, UK, 2013; pp. 13–53. [Google Scholar]
  2. Munasinghe, M. Sustainability in the Twenty-First Century: Applying Sustainomics to Implement the Sustainable Development Goals; Cambridge University Press: Cambridge, UK, 2019. [Google Scholar]
  3. Feng, Y.; Hu, J.; Afshan, S.; Irfan, M.; Hu, M.; Abbas, S. Bridging resource disparities for sustainable development: A comparative analysis of resource-rich and resource-scarce countries. Resour. Policy 2023, 85, 103981. [Google Scholar] [CrossRef]
  4. Grossman, G.M.; Krueger, A.B. Environmental Impacts of a North American Free Trade Agreement. 1991. Available online: https://www.nber.org/system/files/working_papers/w3914/w3914.pdf (accessed on 4 May 2025).
  5. Røpke, I. The unsustainable directionality of innovation–The example of the broadband transition. Res. Policy 2012, 41, 1631–1642. [Google Scholar] [CrossRef]
  6. Sun, J.; Dai, X.; Wang, Q.; Van Loosdrecht, M.C.; Ni, B.J. Microplastics in wastewater treatment plants: Detection, occurrence and removal. Water Res. 2019, 152, 21–37. [Google Scholar] [CrossRef] [PubMed]
  7. Shah, K.J.; Pan, S.Y.; Lee, I.; Kim, H.; You, Z.; Zheng, J.M.; Chiang, P.C. Green transportation for sustainability: Review of current barriers, strategies, and innovative technologies. J. Clean. Prod. 2021, 326, 129392. [Google Scholar] [CrossRef]
  8. Fan, H.; Zhao, C.; Yang, Y. A comprehensive analysis of the spatio-temporal variation of urban air pollution in China during 2014–2018. Atmos. Environ. 2020, 220, 117066. [Google Scholar] [CrossRef]
  9. Björklund, M. Influence from the business environment on environmental purchasing—Drivers and hinders of purchasing green transportation services. J. Purch. Supply Manag. 2011, 17, 11–22. [Google Scholar] [CrossRef]
  10. Lee, C.T.; Hashim, H.; Ho, C.S.; Van Fan, Y.; Klemeš, J.J. Sustaining the low-carbon emission development in Asia and beyond: Sustainable energy, water, transportation, and low-carbon emission technology. J. Clean. Prod. 2017, 146, 1–13. [Google Scholar] [CrossRef]
  11. Xing, Z.; Ma, G.; Wang, L.; Yang, L.; Guo, X.; Chen, S. Towards Visual Interaction: Hand Segmentation by Combining 3D Graph Deep Learning and Laser Point Cloud for Intelligent Rehabilitation. IEEE Internet Things J. 2025. [Google Scholar] [CrossRef]
  12. Raza, M.Y.; Lin, B. Renewable energy substitution and energy technology impact in a transitional economy: A perspective from Pakistan. J. Clean. Prod. 2022, 360, 132163. [Google Scholar] [CrossRef]
  13. He, L.; Liu, S.; Shen ZJ, M. Smart urban transport and logistics: A business analytics perspective. Prod. Oper. Manag. 2022, 31, 3771–3787. [Google Scholar] [CrossRef]
  14. Georgatzi, V.V.; Stamboulis, Y.; Vetsikas, A. Examining the determinants of CO2 emissions caused by the transport sector: Empirical evidence from 12 European countries. Econ. Anal. Policy 2020, 65, 11–20. [Google Scholar] [CrossRef]
  15. Shahbaz, M.; Topcu, B.A.; Sarıgül, S.S.; Vo, X.V. The effect of financial development on renewable energy demand: The case of developing countries. Renew. Energy 2021, 178, 1370–1380. [Google Scholar] [CrossRef]
  16. Jacobson, M.Z.; Delucchi, M.A.; Bazouin, G.; Dvorak, M.J.; Arghandeh, R.; Bauer, Z.A.; Cotte, H.; de Moor, G.M.T.H.; Goldner, E.G.; Heier, C.; et al. A 100% wind, water, sunlight (WWS) all-sector energy plan for Washington State. Renew. Energy 2016, 86, 75–88. [Google Scholar] [CrossRef]
  17. Saint Akadiri, S.; Alola, A.A.; Akadiri, A.C.; Alola, U.V. Renewable energy consumption in EU-28 countries: Policy toward pollution mitigation and economic sustainability. Energy Policy 2019, 132, 803–810. [Google Scholar] [CrossRef]
  18. Hanif, S.; Nawaz, A.; Hussain, A.; Bhatti, M.A. Linking non renewable energy, renewable energy, globalization and CO2 emission under EKC hypothesis: Evidence from ASEAN-6 countries through advance panel estimation. Pak. J. Humanit. Soc. Sci. 2022, 10, 391–402. [Google Scholar] [CrossRef]
  19. Bento, J.P.C.; Moutinho, V. CO2 emissions, non-renewable and renewable electricity production, economic growth, and international trade in Italy. Renew. Sustain. Energy Rev. 2016, 55, 142–155. [Google Scholar] [CrossRef]
  20. Ohler, A.; Fetters, I. The causal relationship between renewable electricity generation and GDP growth: A study of energy sources. Energy Econ. 2014, 43, 125–139. [Google Scholar] [CrossRef]
  21. Wang, Y.; Wang, D.; Yu, L.; Mao, J. What really influences the development of renewable energy? A systematic review and meta-analysis. Environ. Sci. Pollut. Res. 2023, 30, 62213–62236. [Google Scholar] [CrossRef]
  22. Regueiro-Ferreira, R.M.; Alonso-Fernández, P. Interaction between renewable energy consumption and dematerialization: Insights based on the material footprint and the Environmental Kuznets Curve. Energy 2023, 266, 126477. [Google Scholar] [CrossRef]
  23. Yufenyuy, M.; Pirgalıoğlu, S.; Yenigün, O. The asymmetric effect of biomass energy use on environmental quality: Empirical evidence from the Congo Basin. Environ. Dev. Sustain. 2023, 27, 1–34. [Google Scholar] [CrossRef]
  24. Calvo, G.; Valero, A. Strategic mineral resources: Availability and future estimations for the renewable energy sector. Environ. Dev. 2022, 41, 100640. [Google Scholar] [CrossRef]
  25. Bahmani-Oskooee, M.; Fariditavana, H. Nonlinear ARDL approach and the J-curve phenomenon. Open Econ. Rev. 2016, 27, 51–70. [Google Scholar] [CrossRef]
  26. Shin, Y.; Yu, B.; Greenwood-Nimmo, M. Modelling asymmetric cointegration and dynamic multipliers in a nonlinear ARDL framework. Festschr. Honor. Peter Schmidt Econom. Methods Appl. 2014, 281–314. [Google Scholar]
  27. Çıtak, F.; Uslu, H.; Batmaz, O.; Hoş, S. Do renewable energy and natural gas consumption mitigate CO2 emissions in the USA? New insights from NARDL approach. Environ. Sci. Pollut. Res. 2021, 28, 63739–63750. [Google Scholar] [CrossRef] [PubMed]
  28. Pesaran, M.H.; Shin, Y.; Smith, R.P. Pooled Mean Group Estimation of Dynamic Heterogeneous Panels. J. Am. Stat. Assoc. 1999, 94, 621–634. [Google Scholar] [CrossRef]
  29. Adebayo, T.S.; Ramzan, M.; Iqbal, H.A.; Awosusi, A.A.; Kinsola, G.D. The environmental sustainability effects of financial development and urbanization in Latin American countries. Environ. Sci. Pollut. Res. 2021, 28, 57983–57996. [Google Scholar] [CrossRef] [PubMed]
  30. Boulding, K.E. The economics of the coming spaceship Earth. In Environmental Quality in a Growing Economy; RFF Press: Washington, DC, USA, 2013; pp. 3–14. [Google Scholar]
  31. .Mishan, E.J. Evaluation of life and limb: A theoretical approach. J. Political Econ. 1971, 79, 687–705. [Google Scholar] [CrossRef]
  32. Goodland, R. The Concept of Environmental Sustainability. Annu. Rev. Ecol. Syst. 1995, 26, 1–24. Available online: http://www.jstor.org/stable/2097196 (accessed on 4 May 2025).
  33. Meadows, D. Indicators and information systems for sustainable development. In The Earthscan Reader in Sustainable Cities; Routledge: Abingdon, UK, 2021; pp. 364–393. [Google Scholar]
  34. Nwafor, M.E.; Onya, O.V. Road transportation service in Nigeria: Problems and prospects. Adv. J. Econ. Mark. Res. 2019, 4, 104–117. [Google Scholar]
  35. Kapur, R.; Das, S.; Nandineni, R.D. Sustainable transportation infrastructure’s role in attaining sustainable development goals. In Industry, Innovation and Infrastructure; Springer International Publishing: Cham, Switzerland, 2021; pp. 1135–1147. [Google Scholar] [CrossRef]
  36. Kilani, M.; Diop, N.; De Wolf, D. A multimodal transport model to evaluate transport policies in the north of France. Sustainability 2022, 14, 1535. [Google Scholar] [CrossRef]
  37. Saidi, S.; Hammam, S. Do Transport Infrastructures Promote the Foreign Direct Investments Attractiveness? Empirical Investigation from Four North African Countries. Rom. Econ. J. 2018, 20, 110–125. [Google Scholar]
  38. 3Gorus, M.S.; Aydin, M. The relationship between energy consumption, economic growth, and CO2 emission in MENA countries: Causality analysis in the frequency domain. Energy 2019, 168, 815–822. [Google Scholar] [CrossRef]
  39. Magazzino, C.; Giolli, L. The relationship among railway networks, energy consumption, and real added value in Italy. Evidence from ARDL and Wavelet analysis. Res. Transp. Econ. 2021, 90, 101126. [Google Scholar] [CrossRef]
  40. Beşer, N.Ö.; Tütüncü, A.; Beşer, M.; Magazzino, C. The impact of air and rail transportation on environmental pollution in Turkey: A Fourier cointegration analysis. Manag. Environ. Qual. Int. J. 2024, 35, 1836–1857. [Google Scholar] [CrossRef]
  41. Touratier-Muller, N.; Machat, K.; Jaussaud, J. Impact of French governmental policies to reduce freight transportation CO2 emissions on small-and medium-sized companies. J. Clean. Prod. 2019, 215, 721–729. [Google Scholar] [CrossRef]
  42. Edenhofer, O.; Flachsland, C.; Debiel, T.; Hippler, J.; Roth, M.; Ulbert, C. Transforming the Global Energy System-Pathways Towards a Sustainable Energy Supply. In Global Trends 2013; Stiftung Entwicklung und Frieden/Development and Peace Foundation: Bonn, Germany, 2012; pp. 53–71. [Google Scholar]
  43. Kaygusuz, K. Dynamics of Energy Utilization Patterns in Turkey for Sustainable Development. J. Eng. Res. Appl. Sci. 2016, 5, 399–407. Available online: https://www.journaleras.com/index.php/jeras/article/view/60 (accessed on 6 February 2025).
  44. Rosenberg, H. Transport of iron into bacterial cells. In Methods in Enzymology; Academic Press: Cambridge, MA, USA, 1979; Volume 56, pp. 388–394. [Google Scholar]
  45. IEA. Energy, Water and the Sustainable Development Goals; IEA: Paris, France, 2018; Available online: https://www.iea.org/reports/energy-water-and-the-sustainable-development-goals (accessed on 5 March 2025).
  46. IEA. World Energy Outlook 2024; IEA: Paris, France, 2024; Available online: https://www.iea.org/reports/world-energy-outlook-2024 (accessed on 5 March 2025).
  47. EUROSTAT. Database. 2018. Available online: https://ec.europa.eu/eurostat/data/database (accessed on 5 March 2025).
  48. Soytas, U.; Magazzino, C.; Mele, M.; Schneider, N. Economic and environmental implications of the nuclear power phase-out in Belgium: Insights from time-series models and a partial differential equations algorithm. Struct. Change Econ. Dyn. 2022, 63, 241–256. [Google Scholar] [CrossRef]
  49. Harjanne, A.; Korhonen, J.M. Abandoning the concept of renewable energy. Energy Policy 2019, 127, 330–340. [Google Scholar] [CrossRef]
  50. Percebois, J.; Pommeret, S. New challenges for French energy policy. Reflets Phys. 2024, 77, 30–35. [Google Scholar] [CrossRef]
  51. Lebrouhi, B.E.; Schall, E.; Lamrani, B.; Chaibi, Y.; Kousksou, T. Energy transition in France. Sustainability 2022, 14, 5818. [Google Scholar] [CrossRef]
  52. Ang, B.W.; Pandiyan, G. Decomposition of energy-induced CO2 emissions in manufacturing. Energy Econ. 1997, 19, 363–374. [Google Scholar] [CrossRef]
  53. Greaker, M. Spillovers in the development of new pollution abatement technology: A new look at the Porter hypothesis. J. Environ. Econ. Manag. 2006, 52, 411–420. [Google Scholar] [CrossRef]
  54. Steinberger, J.K.; Krausmann, F.; Getzner, M.; Schandl, H.; West, J. Development and dematerialization: An international study. PLoS ONE 2013, 8, e70385. [Google Scholar] [CrossRef]
  55. Mikayilov, J.I.; Galeotti, M.; Hasanov, F.J. The impact of economic growth on CO2 emissions in Azerbaijan. J. Clean. Prod. 2018, 197, 1558–1572. [Google Scholar] [CrossRef]
  56. Naqvi, A.; Zwickl, K. Fifty Shades of Green: Revisiting decoupling by economic sectors and air pollutants. Ecol. Econ. 2017, 133, 111–126. [Google Scholar] [CrossRef]
  57. Yang, Y.; Yan, F.; Yang, Y.; Chen, Y. Evaluating provincial carbon emission characteristics under China’s carbon peaking and carbon neutrality goals. Ecol. Indic. 2023, 156, 111146. [Google Scholar] [CrossRef]
  58. Orubu, C.O.; Omotor, D.G. Environmental quality and economic growth: Searching for environmental Kuznets curves for air and water pollutants in Africa. Energy Policy 2011, 39, 4178–4188. [Google Scholar] [CrossRef]
  59. Smulders, J.A. Economic growth, liberalization, and the environment. In Encyclopedia of Energy Economics; Elsevier: Amsterdam, The Netherlands, 2004. [Google Scholar]
  60. Stagl, S. Delinking Economic Growth from Environmental Degradation? A Literature Survey on the Environmental Kuznets Curve Hypothesis. 1999. Available online: https://papers.ssrn.com/sol3/papers.cfm?abstract_id=223869 (accessed on 4 May 2025).
  61. Hill, R.J.; Magnani, E. An exploration of the conceptual and empirical basis of the environmental Kuznets curve. Aust. Econ. Pap. 2002, 41, 239–254. [Google Scholar] [CrossRef]
  62. Addai, K.; Serener, B.; Kirikkaleli, D. Empirical analysis of the relationship among urbanization, economic growth, and ecological footprint: Evidence from Eastern Europe. Environ. Sci. Pollut. Res. 2022, 29, 27749–27760. [Google Scholar] [CrossRef]
  63. Zhao, J.; Rahman, S.U.; Afshan, S.; Ali MS, E.; Ashfaq, H.; Idrees, S. Green investment, institutional quality, and environmental performance: Evidence from G-7 countries using panel NARDL approach. Environ. Sci. Pollut. Res. 2023, 30, 100845–100860. [Google Scholar] [CrossRef]
  64. Ayres, R.U. Sustainability economics: Where do we stand? Ecol. Econ. 2008, 67, 281–310. [Google Scholar] [CrossRef]
  65. Fischer-Kowalski, M.; Haberl, H. Tons, joules, and money: Modes of production and their sustainability problems. Soc. Nat. Resour. 1997, 10, 61–85. [Google Scholar] [CrossRef]
  66. Alam, M.M.; Murad, M.W.; Noman AH, M.; Ozturk, I. Relationships among carbon emissions, economic growth, energy consumption and population growth: Testing Environmental Kuznets Curve hypothesis for Brazil, China, India and Indonesia. Ecol. Indic. 2016, 70, 466–479. [Google Scholar] [CrossRef]
  67. Alsamara, M.; Mrabet, Z.; Saleh, A.S.; Anwar, S. The environmental Kuznets curve relationship: A case study of the Gulf Cooperation Council region. Environ. Sci. Pollut. Res. 2018, 25, 33183–33195. [Google Scholar] [CrossRef]
  68. Destek, M.A.; Sarkodie, S.A. Investigation of environmental Kuznets curve for ecological footprint: The role of energy and financial development. Sci. Total Environ. 2019, 650, 2483–2489. [Google Scholar] [CrossRef]
  69. Destek, M.A.; Ulucak, R.; Dogan, E. Analyzing the environmental Kuznets curve for the EU countries: The role of ecological footprint. Environ. Sci. Pollut. Res. 2018, 25, 29387–29396. [Google Scholar] [CrossRef]
  70. Apergis, N.; Ozturk, I. Testing environmental Kuznets curve hypothesis in Asian countries. Ecol. Indic. 2015, 52, 16–22. [Google Scholar] [CrossRef]
  71. Gökmenoğlu, K.; Taspinar, N. The relationship between CO2 emissions, energy consumption, economic growth, and FDI: The case of Turkey. J. Int. Trade Econ. Dev. 2016, 25, 706–723. [Google Scholar] [CrossRef]
  72. Majeed, M.T.; Mazhar, M. Financial Development and Ecological Footprint: A global Panel Data Analysis. Pak. J. Commer. Soc. Sci. (PJCSS) 2019, 13, 487–514. Available online: https://hdl.handle.net/10419/201002 (accessed on 28 February 2025).
  73. Heckscher, E.F.; Heckscher, G. An Economic History of Sweden; Harvard University Press: Cambridge, MA, USA, 1954; Volume 95. [Google Scholar]
  74. Assamoi, G.R.; Wang, S.; Liu, Y.; Gnangoin YT, B. Investigating the pollution haven hypothesis in Cote d’Ivoire: Evidence from autoregressive distributed lag (ARDL) approach with structural breaks. Environ. Sci. Pollut. Res. 2020, 27, 16886–16899. [Google Scholar] [CrossRef]
  75. World Bank. World Bank’s World Development Indicators. 2024. Available online: https://databank.worldbank.org/source/world-development-indicators (accessed on 25 January 2025).
  76. OECD Database. OECD (Organisation for Economic Co-operation and Development). 2024. Available online: https://www.oecd.org/en/data/indicators.html?orderBy=mostRelevant&page=0 (accessed on 25 January 2025).
  77. Saboori, B.; Sulaiman, J.; Mohd, S. Economic growth and CO2 emissions in Malaysia: A cointegration analysis of the environmental Kuznets curve. Energy Policy 2012, 51, 184–191. [Google Scholar] [CrossRef]
  78. Tarazkar, M.H.; Dehbidi, N.K.; Ozturk, I.; Al-Mulali, U. The impact of age structure on carbon emission in the Middle East: The panel autoregressive distributed lag approach. Environ. Sci. Pollut. Res. 2021, 28, 33722–33734. [Google Scholar] [CrossRef] [PubMed]
  79. Brooks, C. Testing for Non-linearity in Daily Sterling Exchange Rates. Appl. Financ. Econ. 1996, 6, 307–317. [Google Scholar] [CrossRef]
  80. Kočenda, E. Macroeconomic convergence in transition countries. J. Comp. Econ. 2001, 29, 1–23. [Google Scholar] [CrossRef]
  81. Dickey, D.A.; Fuller, W.A. Distribution of the estimators for autoregressive time series with a unit root. J. Am. Stat. Assoc. 1979, 74, 427–431. [Google Scholar] [CrossRef]
  82. Perron, P. Testing for a unit root in a time series with a changing mean. J. Bus. Econ. Stat. 1990, 8, 153–162. [Google Scholar] [CrossRef]
  83. Engle, R.F.; Granger, C.W. Cointegration and error correction: Representation, estimation, and testing. Econom. J. Econom. Soc. 1987, 55, 251–276. [Google Scholar] [CrossRef]
  84. Li, A.; Li, S.; Chen, S.; Sun, X. The role of Fintech, natural resources, and renewable energy consumption in Shaping environmental sustainability in China: A NARDL perspective. Resour. Policy 2024, 88, 104464. [Google Scholar] [CrossRef]
  85. Pesaran, M.H.; Shin, Y.; Smith, R.J. Bounds testing approaches to the analysis of level relationships. J. Appl. Econom. 2001, 16, 289–326. [Google Scholar] [CrossRef]
  86. Uyanto, S.S. Monte Carlo power comparison of seven most commonly used heteroscedasticity tests. Commun. Stat.-Simul. Comput. 2022, 51, 2065–2082. [Google Scholar] [CrossRef]
  87. Andreas, H.; Günther, M. On the Ramsey test analysis of ‘because’. Erkenntnis 2019, 84, 1229–1262. [Google Scholar] [CrossRef]
  88. Hyun, J.Y.; Mun, H.H.; Kim, T.H.; Jeong, J. The effect of a variance shift on the Breusch–Godfrey’s LM test. Appl. Econ. Lett. 2010, 17, 399–404. [Google Scholar] [CrossRef]
  89. Granger, C.W.; Newbold, P. Spurious regressions in econometrics. J. Econom. 1974, 2, 111–120. [Google Scholar] [CrossRef]
  90. Dutta, S.; Lanvin, B.; León, L.R.; Wunsch-Vincent, S. (Eds.) Global Innovation Index 2021: Tracking Innovation Through the COVID-19 Crisis. World Intellectual Property Organization (WIPO). 2021. Available online: https://books.google.com.cy/books?hl=en&lr=&id=43FMEAAAQBAJ&oi=fnd&pg=PP1&dq=IEA+(2019)+-+The+car+industry+is+one+of+the+highest+spenders+on+research+and+development (accessed on 25 January 2025).
  91. Serrenho, A.C.; Norman, J.B.; Allwood, J.M. The impact of reducing car weight on global emissions: The future fleet in Great Britain. Philos. Trans. R. Soc. A Math. Phys. Eng. Sci. 2017, 375, 20160364. [Google Scholar] [CrossRef] [PubMed]
  92. Reigner, H.; Brenac, T. Safe, sustainable but depoliticized and uneven–A critical view of urban transport policies in France. Transp. Res. Part A Policy Pract. 2019, 121, 218–234. [Google Scholar] [CrossRef]
  93. Brock, W.A.; Taylor, M.S. The green Solow model. J. Econ. Growth 2010, 15, 127–153. [Google Scholar] [CrossRef]
  94. Razzaq, A.; Ajaz, T.; Li, J.C.; Irfan, M.; Suksatan, W. Investigating the asymmetric linkages between infrastructure development, green innovation, and consumption-based material footprint: Novel empirical estimations from highly resource-consuming economies. Resour. Policy 2021, 74, 102302. [Google Scholar] [CrossRef]
  95. Ghouse, G.; Khan, S.A.; Rehman, A.U. ARDL Model as a Remedy for Spurious Regression: Problems, Performance and Prospectus. 2018. Available online: https://mpra.ub.uni-muenchen.de/83973/1/MPRA_paper_83973.pdf (accessed on 25 January 2025).
  96. Brown, R.L.; Durbin, J.; Evans, J.M. Techniques for testing the constancy of regression relationships over time. J. R. Stat. Soc. Ser. B Stat. Methodol. 1975, 37, 149–163. [Google Scholar] [CrossRef]
  97. Breusch, T.S.; Pagan, A.R. A Simple Test for Heteroscedasticity and Random Coefficient Variation. Econometrica 1979, 47, 1287–1294. [Google Scholar] [CrossRef]
Figure 1. Per capita CO2 emissions (source: Our World in Data. https://ourworldindata.org/grapher/co-emissions-per-capita?tab=chart&country=~FRA, accessed on 1 March 2025).
Sustainability 17 04311 g001
Figure 2. Per capita consumption of renewable energy in France (Source: Our World in Data at https://ourworldindata.org/grapher/per-capita-renewables?tab=chart&country=~FRA, accessed on 1 March 2025).
Sustainability 17 04311 g002
Figure 3. Carbon dioxide emissions from the transportation sector in selected European Union members in 2022 (source: statista.com/statistics).
Sustainability 17 04311 g003
Figure 4. Analysis flowchart.
Sustainability 17 04311 g004
Figure 5. Cusum.
Figure 5. Cusum.
Sustainability 17 04311 g005
Figure 6. Cusum of squares.
Sustainability 17 04311 g006
Table 1. Variable description and sources.
Variable SourcedCODEDefinition of VariableRoleSource
In-country carbon emissionsLCO2Production-based carbon emissionsProxy for environmental
sustainability and
dependent variable
World bank
Renewable energyRENNaturally regeneratable energy Independent variableOECD
database
Transport investment innovationsLTIIInvestments in the fundamental transport development framework of an economy that provide an enabling environment for the operation of an effective transport systemIndependent variableOECD
database
Gross domestic
product per capita
LGDPPer unit total gross value of residents by mid-year population, plus any product taxes (constant 2015 USD)Proxy for economic growth (independent variable)OECD
database
Total energy supplyLTESOverall energy supply required in an economy, excluding international aviation and maritime bunkersIndependent variableOECD database
Table 2. Descriptive statistics.
VariableLCO2LGDPLTESLTIIREN
Mean3.06712.3452.40723.6208.099
Median3.08312.3582.40623.6727.439
Max.3.13312.4212.43623.92512.950
Min.2.99612.2462.35723.3645.327
Std. Dev.0.0460.0470.0160.1722.035
Skewness−0.094−0.600−0.145−0.0880.710
Kurtosis1.3682.3702.6101.6102.292
Jarque–Bera11.2407.6550.9868.17810.498
Probability0.0040.0210.6100.0160.005
Table 3. BDS test.
Table 3. BDS test.
VariablesLCO2LGDPLTESLTIIREN
DimensionBDS Stat.BDS Stat.BDS Stat.BDS Stat.BDS Stat.
20.190 *0.207 *0.165 *0.196 *0.174 *
30.320 *0.353 *0.265 *0.328 *0.285 *
40.404 *0.454 *0.326 *0.416 *0.354 *
50.456 *0.524 *0.365 *0.474 *0.394 *
60.486 *0.573 *0.398 *0.512 *0.416 *
Note: * denotes 1% level of statistical significance.
Table 4. ADF Unit Root Test with Break Point.
At LevelAt First Difference
VariableADFBreak PointVariableADFBreak Point
LCO2−3.2152010LCO2−5.177 **2008
LGDP−3.1302010LGDP−6.086 ***2018
LTES−1.6812019LTES−5.157 **1997
LTII−4.759 **2013LTII−5.945 ***2014
REN−2.1162004REN−5.537 **1998
Note: ** and *** denote statistically significant at the 5% and 10% levels, with critical values at −4.949, −4.443, and −4.193, respectively.
Table 5. a. N-ARDL Bounds and long-run results. b: N-ARDL long-run estimates.
a.
N-ARDL Bounds Results
F-Statistics3.302 **
K8
b.
0.031Coeff.Std. Errort-StatsProbVariableCoeff.Std. Errort-StatsProb
Positive shock periodsNegative shock periods
LGDP_ −3.2721.579−2.0720.041 **LGDP_ 8.0593.6632.1990.031 **
LTES_ 5.8852.1502.7360.007 *LTES_ −4.7931.981−2.4190.018 *
LTII_ 0.6500.1743.7160.000 *LTII_ 0.4910.2262.1730.033 **
REN_ −0.0350.010−3.5720.000 *REN_ 0.03010.0161.9290.057 **
a: ** denotes values that are statistically significant at 5% level; b: *, ** denote values that are statistically significant at 1% and 5% levels, respectively.
Table 6. Model diagnostics.
TestF-StatisticProb.
B-P-G Heteroskedasticity1.6010.068 ***
Ramsey Reset approach1.4220.237
Serial Correlation2.5080.089 ***
Note: *** denotes values that are statistically significant at 10% level.
Disclaimer/Publisher’s Note: The statements, opinions and data contained in all publications are solely those of the individual author(s) and contributor(s) and not of MDPI and/or the editor(s). MDPI and/or the editor(s) disclaim responsibility for any injury to people or property resulting from any ideas, methods, instructions or products referred to in the content.

