Abstract
Marine biofouling is a significant challenge for industries that rely on seawater. This study examined the effect of structural materials, carbon concentration, and salinity on biofilm formation. Furthermore, it compares the disinfection efficiency of chlorine (NaClO) and bromine (NaBr) biocides and attempts to identify their optimal dosing. Among tested materials, PVC exhibited the highest microbial attachment (40%), followed by plastic (30%) and concrete (23%). Biofilm attachment and growth increased with higher concentrations of total organic carbon (TOC), which depends upon the seawater’s salinity. The simultaneous reduction of salinity and TOC concentration further enhanced the biofilm attachment and growth. A strong positive linear correlation (r = 0.98 and p = 0.003) was found between the initial cell count of seawater and biofilm formation. Disinfection experiments showed that NaBr (97.36%) was slightly more effective than NaClO (95.83%). Response Surface Methodology (RSM) identified optimal disinfection conditions: 0.6 mg/L biocide concentration and 138 min dosing period. Generally, there are three strategies for reducing biofilm growth: selecting appropriate materials, controlling carbon concentrations, or optimizing concentrations and dosing periods with biocides.
1. Introduction
Industries near coastal areas utilize seawater for various purposes, including cooling systems. A cooling water system in a power plant consumes approximately 800–1000 million gallons of seawater daily [1]. However, prolonged exposure of submerged structures to untreated seawater leads to an undesirable accumulation of microorganisms, plants, algae, and animals [2]. This high biological activity causes marine biofouling on structures [3]. Marine biofouling reduces the thermal efficiency of heat exchangers, which in turn results in a decrease in heat transfer [4]. The heat transmission can be reduced by 10 to 50% through the deposition of biofouling with a thickness of 3 mm [5,6]. Furthermore, biofouling promotes corrosion and degradation of equipment and has the potential to obstruct conduits and circuits, thereby increasing the operational and maintenance expenses of the system [7]. The biofouling-related issues in the United States, Japan, and the United Kingdom resulted in an average non-productive cost of 9.00, 3.06, and 0.82 billion USD, respectively [6,8,9]. Addressing marine biofouling is, therefore, critical to maintaining efficient industrial operations.
Biofouling develops through five key processes: initiation, transport, adhesion, growth, and dispersion. The rate of each process is dependent upon several types of factors, such as the initial quantity of biofouling organisms [10], salinity [11], surface material [12], and nutrients [13]. Sahan et al. (2007) [14] conducted a study on the variation in the composition of biofilm organisms in the Westerschelde estuary with respect to various salinities, including 5.4, 17.6, and 20.4 ppt. The results suggest that the attachment of biofilm organisms varied according to the fluctuating salinity. While prior research has extensively examined individual factors like salinity and material type, the relationship between initial bacterial cell count in seawater and subsequent biofilm formation remains less explored. Understanding this correlation is crucial for developing predictive models and effective biofouling control strategies.
Industries implement marine biofouling control by applying antifouling treatments, including physical, electrokinetic, surface modification, and chemical methods [15]. Among these, chemical biocides are the most cost-effective and efficient treatments [16]. Biocides are classified as either oxidants (chlorine base products, bromine base products, hydrogen peroxide, and ozone) or nonoxidizing agents (amines, heavy metals, and aldehydes) [15]. Abosaty et al. [17] evaluated the efficiency of three biocides, including benzalkonium bromide, sodium hypochlorite, and glutaraldehyde, to prevent microbial-induced corrosion (MIC) occurring in nuclear power plants. Among these biocides tested, glutaraldehyde was found to be the most effective, eliminating Thiobacillus bacterial growth at a concentration of 50 mg/L. Similarly, higher concentrations of benzalkonium bromide (2.5 mg/L) and sodium hypochlorite (8 mg/L) were needed to achieve complete bacterial removal. The results highlighted that higher biocide concentrations were more effective in inhibiting bacterial growth. Selecting the most appropriate biocide includes considering the biofouling organism, the treatment cost, the water’s composition, and the biocides’ toxicity and persistence [2,18].
Chlorination is the most extensively used efficient biocide to control marine biofouling [19]. Certain limitations, however, are associated with its efficacy, stability, and chemical behavior when used for seawater disinfection. Chlorine is highly effective in the pH range of 6.5 to 7.5, forming hypochlorous acid (HOCl), which is a strong disinfectant [20]. Nevertheless, most of the HOCl can convert to hypochlorite ion (OCl−), a weak disinfectant, because of the higher pH of seawater. Furthermore, chlorine is significantly reactive with organic matter, ammonia, and bromide ions, which can lead to a decrease in free chlorine available and a consequent decrease in disinfection efficiency [2,21].
Bromine, an alternative chemical biocide, is more stable than chlorine in marine environments and remains effective over a broader pH range (7.0–8.5) as hypobromous acid (HOBr). It is also less reactive with organic matter, making it a strong candidate for marine biofouling control [22]. In a recent study by Shukla et al. (2024) [23], biofilm inhibition was observed to be limited at a concentration of 1 ppm of active bromide. However, significant inhibition was observed at 5 ppm and 10 ppm of active bromide. NaClO is employed as a biocide in most nuclear power facilities. Bromine was employed as an alternative biocide in a limited number of plants, particularly NaBr. The Madras Atomic Power Station (MAPS) in Kalpakkam, South India, utilizes a bromine-based biocide in its once-through cooling water system to prevent biofouling in condenser tubing. Nevertheless, there is limited scientific evidence regarding the effectiveness of bromine-based biocides, particularly in the control of biofouling in industrial cooling systems. Despite extensive research on these biocides, direct comparative studies evaluating their effectiveness under varying operational conditions are limited. Additionally, optimizing key parameters such as biocide concentration and dosing period remains an ongoing challenge.
The overall objective of the present study is to assess the factors that influence biofouling growth and to evaluate the efficiency of both chlorine and bromine biocides for preventing marine biofouling. Specifically, the study investigates (1) the influence of material type, salinity, and carbon concentration on biofilm formation; (2) the correlation between initial bacterial cell counts and biofilm growth; (3) the disinfection efficiency of NaClO and NaBr under controlled conditions; and (4) optimal biocide application and disinfection operating conditions using Response Surface Methodology (RSM). By bridging these research gaps, this study provides valuable insights into biofouling mechanisms and offers strategies to enhance industrial biofouling control.
2. Materials and Methods
2.1. Materials
A biofilm annular reactor (Model 1320LJ, BioSurface Technologies Corporation, Bozeman, MT, USA) (Figure S1) and various PVC (Size (L*W): 150 mm*12.7 mm, Code: BAR 503-PVC), plastic (Size (L*W): 150 mm*12.7 mm, Code: BAR 503-ABS), and concrete (Size (L*W): 150 mm*12.7 mm, Code: BAR 503-CC) test coupons were acquired from BioSurfaces Technologies Corporation (Bozeman, MT, USA). The material concrete is commonly used in large structural components such as cooling towers, intake structures, and pipelines. Its porous nature makes it prone to microbial colonization. Plastic is the material used in smaller components, gaskets, and fittings. While smoother than concrete, some plastics can still develop biofilms, especially under warm, nutrient-rich conditions. PVC is the material frequently used for piping due to its chemical resistance and durability. Biofouling on PVC can reduce flow efficiency and contribute to MIC. The following analytical grade reagents in the experiments were purchased from Sigma-Aldrich. The chemicals were sodium nitrate NaNO3 (98.5%), dipotassium hydrogen phosphate K2HPO4 (98.5%), magnesium sulfate heptahydrate MgSO4⋅7H2O (99%), calcium chloride dihydrate CaCl2⋅2H2O (99%), citric acid monohydrate C6H8O7⋅H2O (99.5%), disodium EDTA dihydrate Na2EDTA⋅2H2O, and anhydrous sodium carbonate Na2CO3 (99.8%). For preparing trace metal solution following analytical grade reagents used containing anhydrous boric acid H3BO3 (99.5%), manganese chloride tetrahydrate MnCl2⋅4H2O (99.5%), zinc sulfate heptahydrate ZnSO4⋅7H2O (99%), sodium molybdate dihydrate Na2MoO4⋅2H2O (99.5%), copper sulfate pentahydrate CuSO4⋅5H2O, cobalt (II) nitrate hexahydrate Co(NO3)2⋅6H2O. Seawater was collected and filtered through a Whatman 20 µm filter to remove large particulates before use in experiments.
2.2. Batch-Scale Biofilm Reactor Setup
A batch-scale biofilm reactor was set up in a 1 L glass beaker (Figure S2). The 1 L beakers were filled with 1 L of seawater, which contained the nutrients and seed of the activated sludge. Each beaker contained coupons for PVC, concrete, and plastic. BG-11 media served as the nutrient source and glucose (C6H12O6) was used as the carbon source. The BG-11 was prepared according to the instructions mentioned by The Culture Collection of Algae at the University of Texas at Austin (UTEX). The composition of BG-11 is presented in Table S9. The carbon source C6H12O6 was added according to the COD as follows (g/L): 1000 COD: 0.76; 2000 COD: 1.52. The reactors were continuously mixed using magnetic stirrers, and aeration was maintained to support microbial growth. Real seawater was used for all the experiments in the laboratory. Activated sludge was used as the seed for the biofilm formation. Activated sludge was obtained from a local domestic wastewater treatment plant that treats domestic wastewater that has a COD of 600 mg/L. Aeration was implemented through an air pump to facilitate the proliferation of microorganisms. A fresh nutrient medium was introduced after the decline of nutrients to prevent disruptions to the growing process. To replicate real seawater conditions, the reactors underwent a gradual acclimatization process, where seawater salinity was initially reduced and then progressively increased. A fresh nutrient medium was periodically added to maintain microbial activity. The biofilm formation experiments were conducted over one month.
2.3. Factors Affecting Biofilm Growth
Six experimental conditions were designed to examine the impact of carbon concentration, salinity, and coupon materials on biofilm growth (Table 1). Seawater salinity was adjusted using deionized (DI) water, as shown in Table 2. The total volume of stock water that was prepared was 1000 mL. The initial weight of each coupon was recorded before immersion, and the final weight and bacterial cell count were measured at the end of the experiment (after a month).

Table 1.
Experimental conditions for biofilm growth batch studies.
Table 2.
Preparation of seawater of different salinity.
2.4. Correlation Between Seawater Initial Cell Count and Biofilm Growth
Five batch-scale reactors were used to investigate the correlation between seawater’s initial bacterial cell count and the bacterial cell count on the PVC coupons following biofilm formation. Similarly, a correlation study was conducted to investigate the relationship between the initial bacterial cell count in the seawater and the increased percentage of coupons’ weight. The correlation between the variables was determined using the Pearson correlation coefficient (r). It was determined that variables were statistically significant at a significance level of p < 0.05. Each batch-scale reactor was supplied with 1 L of real seawater, and five distinct initial bacterial cell-count concentrations were generated using acclimatized sludge. The initial cell counts and initial weights of the coupons were evaluated before the beginning of the experiments. The initial bacterial cell counts of seawater were 136.72 × 10⁶, 207.69 × 10⁶, 351.76 × 10⁶, 432.13 × 10⁶, and 437.74 × 10⁶ cells/mL. The reactor contained four coupons of similar material. Weight calculations were conducted using two sets. The biofilm affixed to the other two sets of coupons was scraped out and placed in the phosphate buffer solution (PBS) to determine the bacterial cell count. The final weight of the coupons and the total bacterial cell count present in the coupons were estimated at the end of the studies, which lasted for a month.
2.5. Disinfection Study
2.5.1. Biofilm Annular Reactor for Disinfection Testing
To evaluate the disinfection efficiency of sodium hypochlorite (NaClO) and sodium bromide (NaBr), biofilm-covered coupons from the batch reactors were transferred to a biofilm annular reactor (Figure S1). Before transferring the coupons, initial weight and cell count were evaluated. Each experiment used 2 L of real seawater. Biocide concentrations and dosing period varied according to a Central Composite Design (CCD) matrix (Table 3). The final weight of the coupons and the cell count on the coupons were evaluated after each experiment.
Table 3.
CCD Design matrix.
2.5.2. Optimization Using Response Surface Methodology (RSM)
RSM was used to optimize the initial biocide concentration (X1) and the dosing period (X2) to maximize the disinfection efficiency. Separate trials were conducted for NaClO and NaBr, using minimum and maximum concentration values of 0.2 mg/L and 1 mg/L, respectively, and dosing periods ranging from 30 to 120 min. A second-order model was fed each parameter’s minimum and maximum values, and the results are summarized in Table S1. The quadratic model was employed to establish the relationship between the initial concentration of biocides (X1) and dosing period (X2) and the percentage disinfection efficiency (Y) as follows:
where β, 0, and ϵ represent constant and residual terms, respectively.
The effect of X1 and X2 variables on biofilm removal was further analyzed using ANOVA, and contour plots were generated to visualize their interactions. To predict the relationship between independent and dependent parameters, the p-value is compared to the significance level.
2.6. Biofilm Growth Quantification
2.6.1. Gravimetric Analysis of Biofilm Growth
Biofilm growth was quantified through gravimetric analysis. The initial weight (Wi) of the dried coupons was determined prior to their placement in the beaker for biofilm attachment. The coupons were collected from the beaker after the end of the biofilm study. The collected wet coupons were placed overnight in an oven at a temperature of 50 °C to ensure that it is completely dried. The dry coupons were weighed (Wf), and Equation (2) was employed to determine the percentage of biofilm growth.
where Wi—Initial weight of the coupons before immersion; Wf—Final weight of the coupons after drying.
2.6.2. Flow Cytometry for Cell Count
Flow cytometry (FCM) was used to quantify the cell count on the coupons. It is vital to prepare a single-cell suspension of biofilm because of its variability, heterogeneity, and high abundance of bacterial cells. Furthermore, it is imperative to make a single-cell suspension to prevent cell clumping, which ensures accurate counting. Biofilm samples were scraped from coupons, and to ensure the complete disaggregation of the flocs and the dispersion of free cells in the bulk liquid, the biofilms were sonicated for approximately 5 min at a transferred specific energy (Es) of 80 kJ/L. The free cell suspension was then filtered through a 20 µm membrane to remove coarse particles to help prevent blockage in the nozzle of the flow cytometer during FCM analysis. The filtered suspension was diluted to 1:400 (v/v) in PBS to reach 106–107 cell count per mL. Duplicates of the diluted sample were used for FCM analysis. The FCM was conducted on BD Accuri C6 Plus (BD Biosciences, San Jose, CA, USA) flow rate was set to 0.66 μL/min with a Sample Injection Probe (SIP) core size of up to 22 μm. Each run was performed with a limit of 10,000 events per sample, and data were analyzed on the FCS Analyzer v3.1 open ware software (FCS Analyzer, ISAC, Washington, DC, USA). To prevent contamination of the SIP, it was rinsed and backflushed with DI water. Subsequently, the FACS Clean solution (BD FACS Clean™, Cat. No. 340345) was employed for further cleaning. Equation (3) represents the calculation of the absolute cell count present in the biofilm:
where A = Bacterial cell event from the FCM analysis; B = Beads event from the FCM analysis; C = Number of beads added to the sampling volume; D = Total volume of sample (µL).
3. Results and Discussion
3.1. Biofilm Growth Trends Across Different Materials
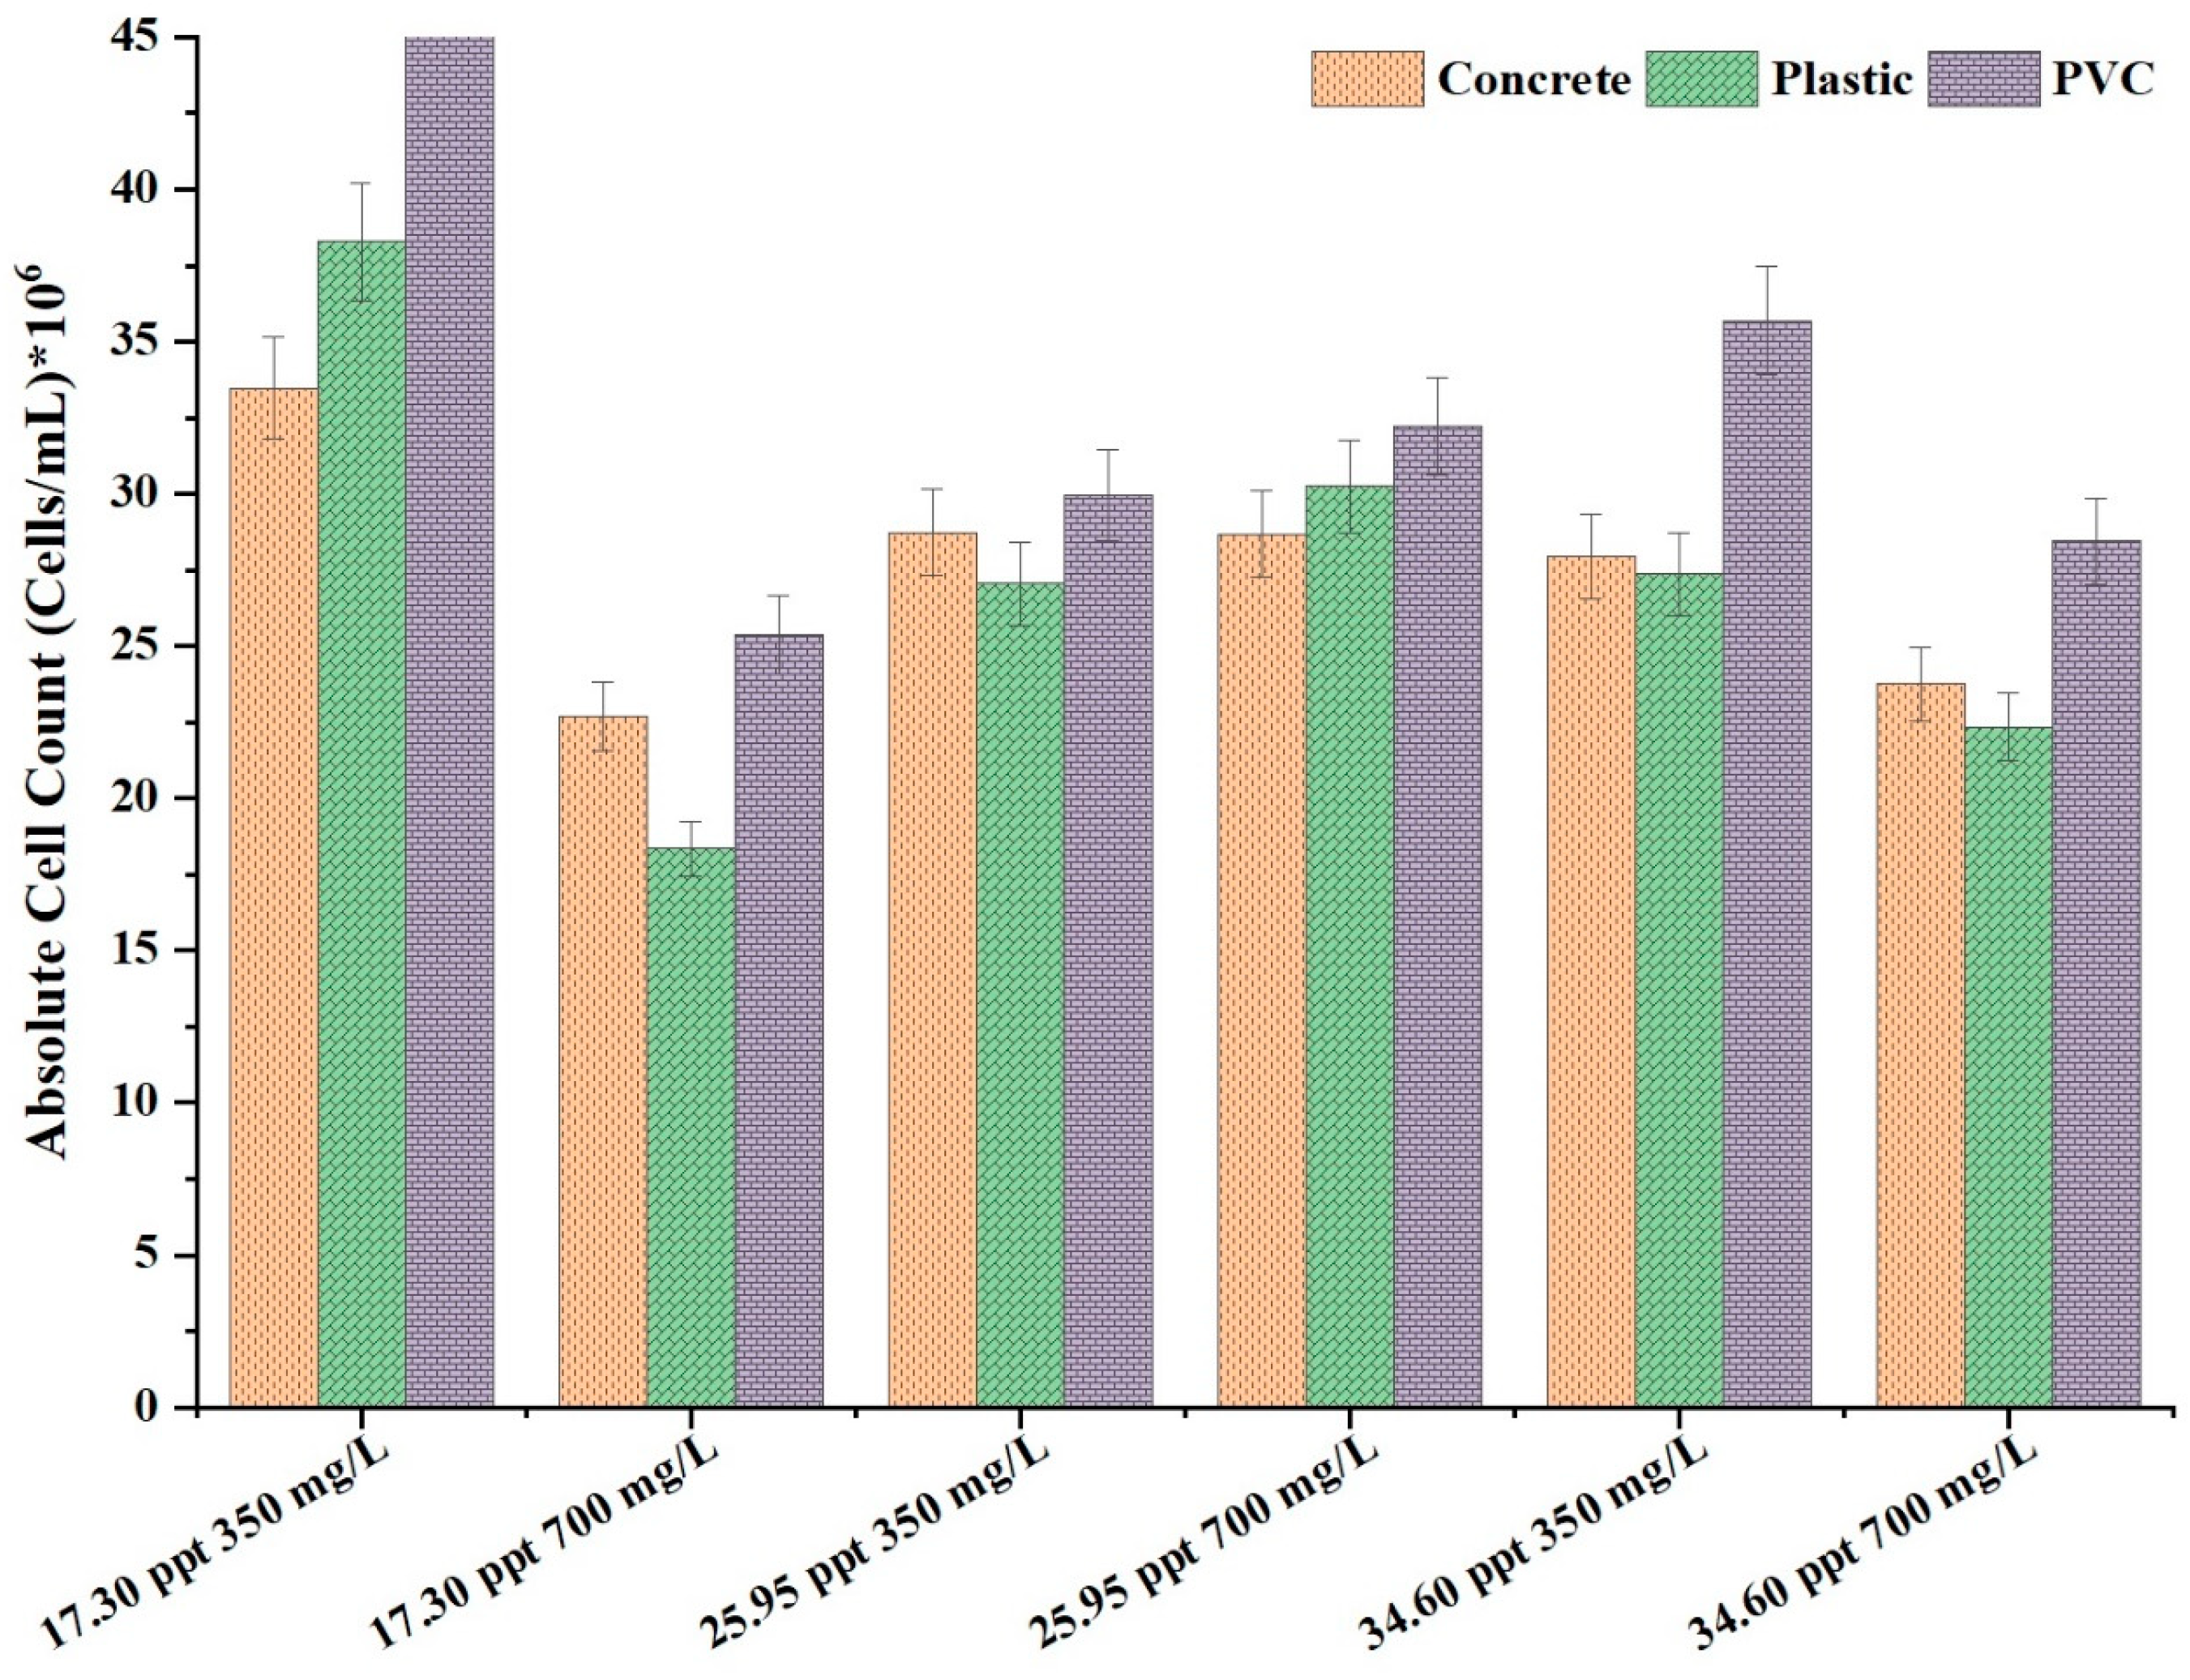
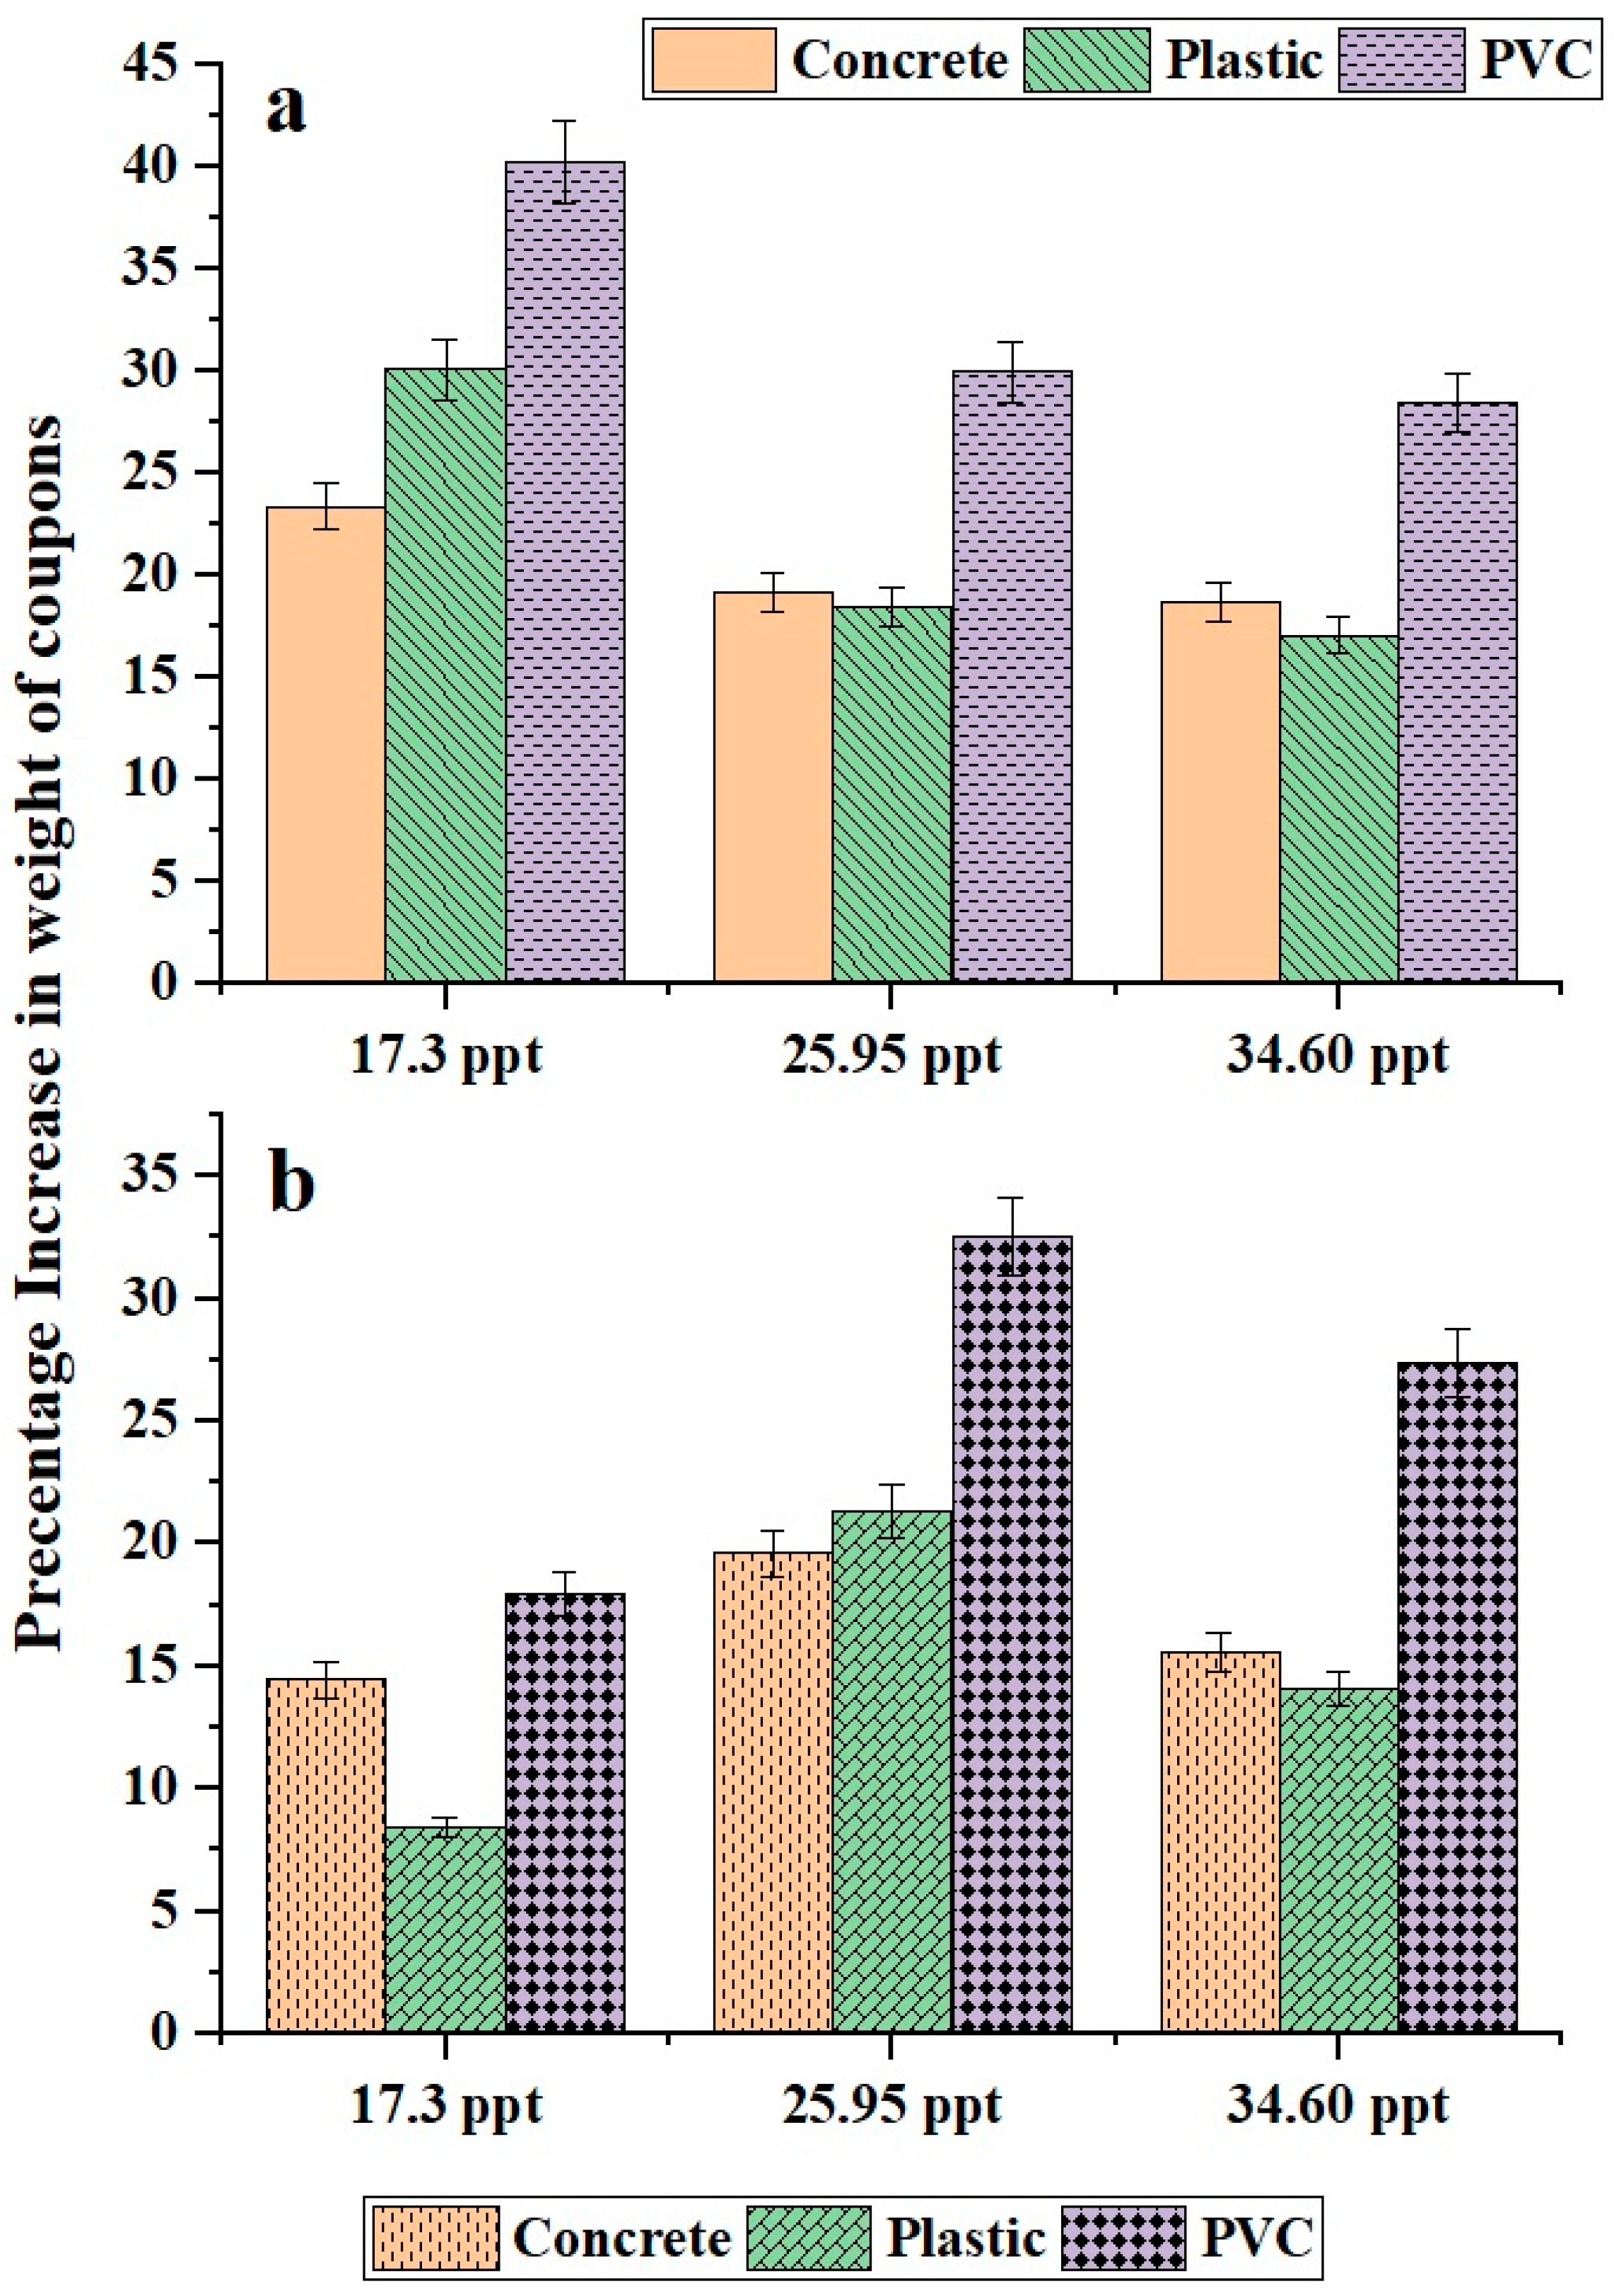
Biofilm growth was quantified based on the percentage increase in coupon weight and cell count. The effectiveness of biofilm attachment on the marine structure depends upon the material’s surface properties. Three coupons were employed to ascertain the influence of coupon material on biofilm formation: concrete, plastic, and PVC. The percentage increase in weight ranged between 8.43% and 40.22%. The respective cell count was 18.34 × 10⁶/mL and 49.64 × 10⁶/mL. Concrete, plastic, and PVC coupons experienced the highest weight increases, with 23.39%, 30.10%, and 40.22%, respectively (Figure 1). Similarly, the highest bacterial cell count on concrete, plastic, and PVC coupons were 33.48 × 10⁶/mL, 38.28 × 10⁶/mL, and 49.64 × 10⁶/mL (Figure 2). The results indicate that PVC coupons show the highest biofilm attachment compared to plastic and concrete coupons. This suggests that material properties play a significant role in microbial adhesion.
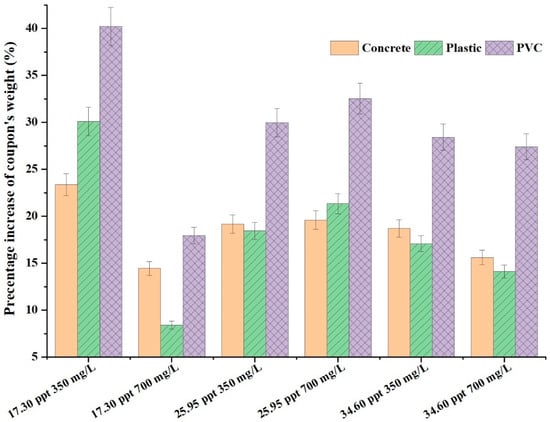
Figure 1.
Comparison of biofilm growth, represented by the percentage increase in coupon’s weight, on different coupon materials. The X-axis presents the levels of salinity in ppt and TOC concentration in mg/L.
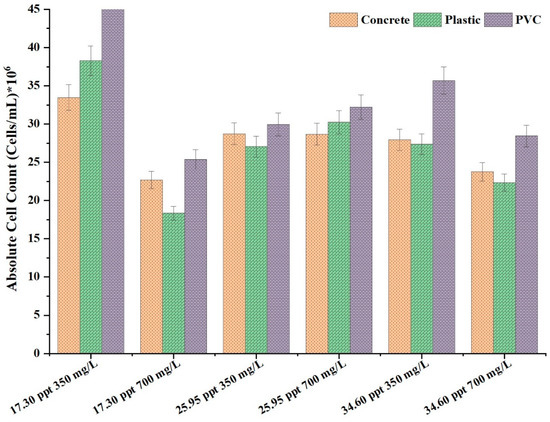
Figure 2.
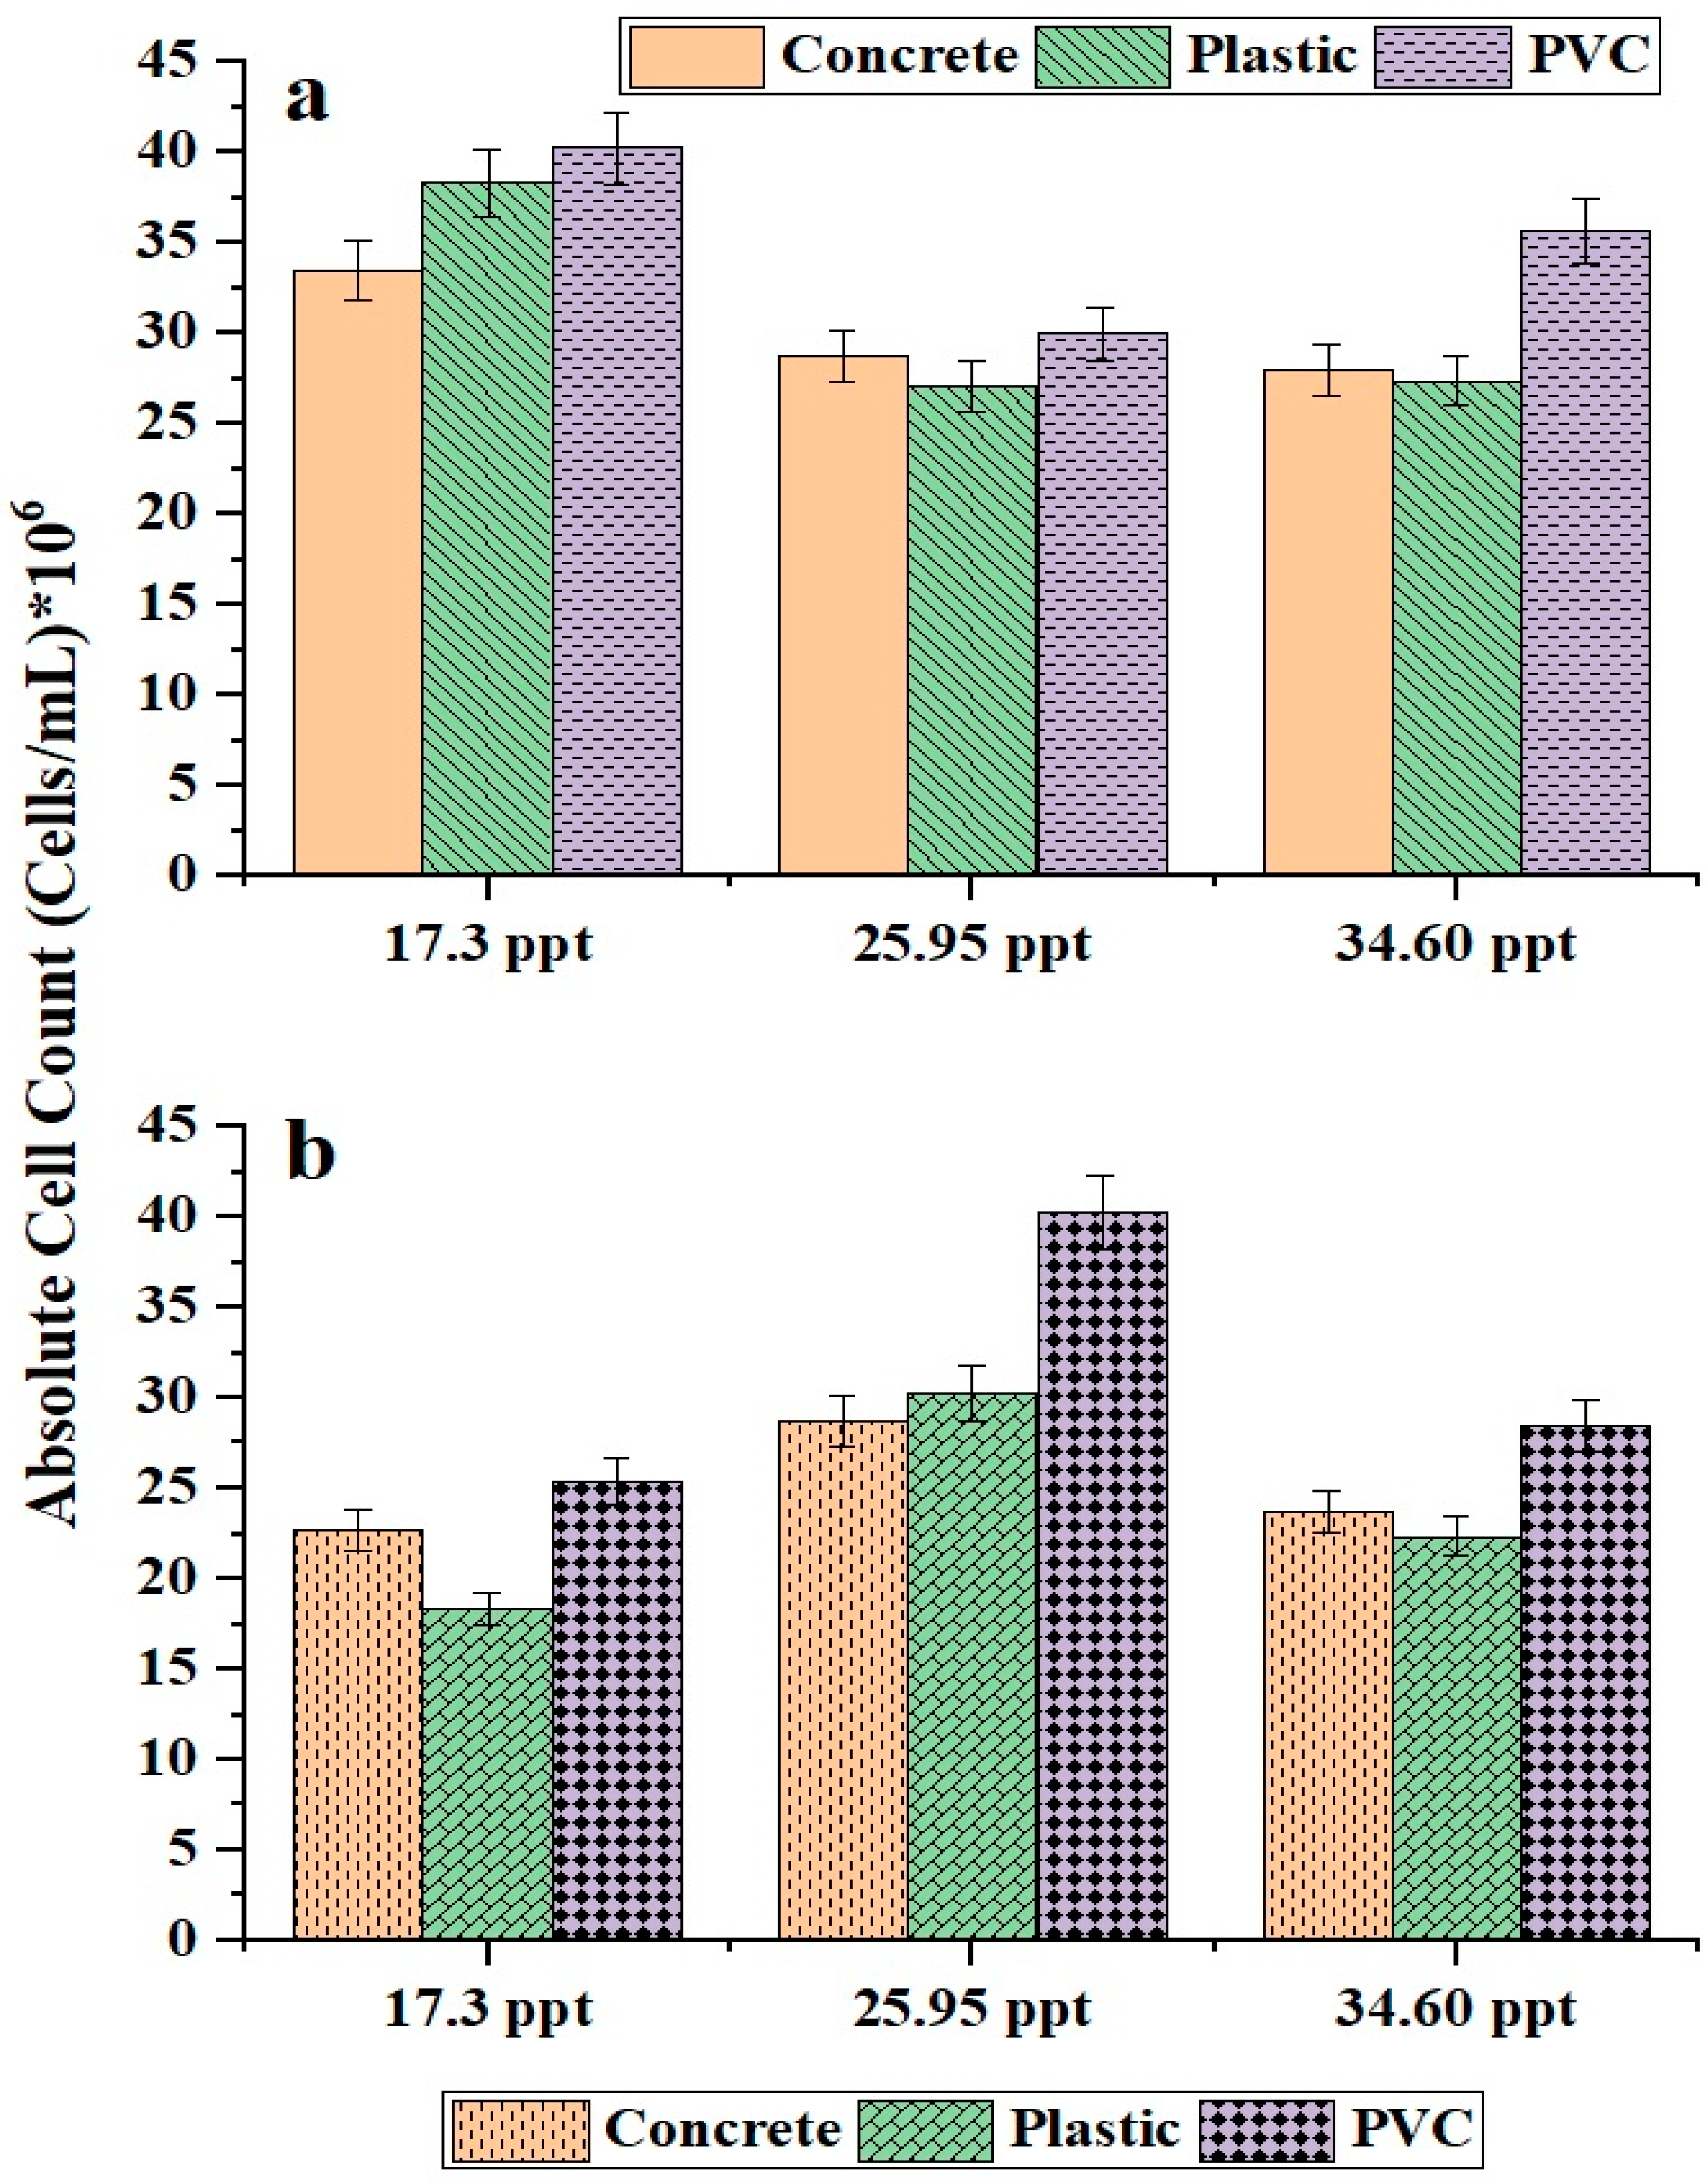
Comparison of biofilm growth, represented by absolute cell count, on different coupon materials. The X-axis presents the levels of salinity in ppt and TOC concentration in mg/L.
Xavier et al. [12] conducted a comparison of the attachment of the biofouling organism bryozoan to four distinct materials: metal, PVC, nautical ropes, and PET. The research indicates that the most significant attachment of bryozoans occurred with PVC. Similarly, Papale et al. [24] conducted a study comparing marine biofilm characteristics and microbial community on PVC and polyethylene (PE). The results of the study indicate that the microbial community composition of PVC was more uniform and structured than that of PE. The attachment of biofilms to PVC is greater than that of concrete and plastics for various reasons, such as surface properties, hydrophobicity, and texture. PVC is more hydrophobic than concrete, which repels water and attracts organic materials, providing a superior surface for bacterial adhesion. Biofilm formation is facilitated by the stronger adhesion of hydrophobic microorganisms to hydrophobic surfaces, such as PVC. Even though PVC is smoother than concrete, it still contains micro-crevices that allow bacteria to establish an anchor and begin the formation of biofilms. On the other hand, concrete is porous and abrasive. Still, it also enables better water retention and mineral deposits that can occasionally impede biofilm formation due to natural biofilm detachment forces. PVC surfaces can retain organic matter and nutrients better than some plastics and concrete, providing a favorable environment for microbial growth. Some studies suggest that PVC has a more neutral or slightly negative surface charge and hydrophobic nature [25,26], which can enhance microbial adhesion compared to the highly alkaline nature of fresh concrete, which can be inhibitory to initial microbial colonization [27]. Compared to plastics like polyethylene or polypropylene, PVC has a different surface energy and can more effectively support biofilm formation.
3.2. Influence of Carbon Concentration and Salinity on Biofilm Growth
The present study examined the impact of two distinct TOC concentrations, 346 and 692 mg/L, and three distinct salinities: 34.60, 25.95, and 17.30 ppt on biofilm attachment. Figure 3 and Figure 4 illustrate the impact of varying carbon concentrations and salinity on the formation of biofilm. The biofilm growth on three coupons—concrete, plastic, and PVC—decreased by 8.94, 21.67, and 22.26%, respectively, as the TOC increased from 346.4 to 692.8 mg/L at a salinity of 17.30 ppt. Similarly, the biofilm growth on three coupons—concrete, plastic, and PVC—decreased by 3.11, 2.98, and 1.03%, respectively, when the TOC increased from 346.4 to 692.8 mg/L at a salinity of 34.60 ppt. In contrast, the biofilm growth on three coupons, concrete, plastic, and PVC, increased by 0.42, 2.92, and 2.56%, respectively, as TOC increased from 346.4 to 692.8 mg/L at a salinity of 25.95 ppt. The highest percentage of biofilm attachment on three coupons—concrete, plastic, and PVC—with increments of 23.39, 30.10, and 40.22%, respectively, at a salinity of 25.95 ppt and a TOC concentration of 692.8 mg/L. For cell counts, comparable outcomes were observed. Results indicate a complex relationship between biofilm growth, TOC concentration, and salinity across different surface materials. These findings suggest that low and high salinities with higher organic content conditions may inhibit biofilm development, possibly due to microbial competition or unfavorable changes in nutrient composition. In addition, high salinity may impose stress on microbial communities, possibly leading to reduced colonization or biofilm stability, even with elevated TOC levels. Conversely, a medium salinity with higher organic content promoted biofilm growth across all materials. This condition appears to provide an optimal balance of salinity and organic nutrients that supports microbial colonization and biofilm stability. The most substantial biofilm attachment was also observed under medium salinity levels at the highest TOC concentration.
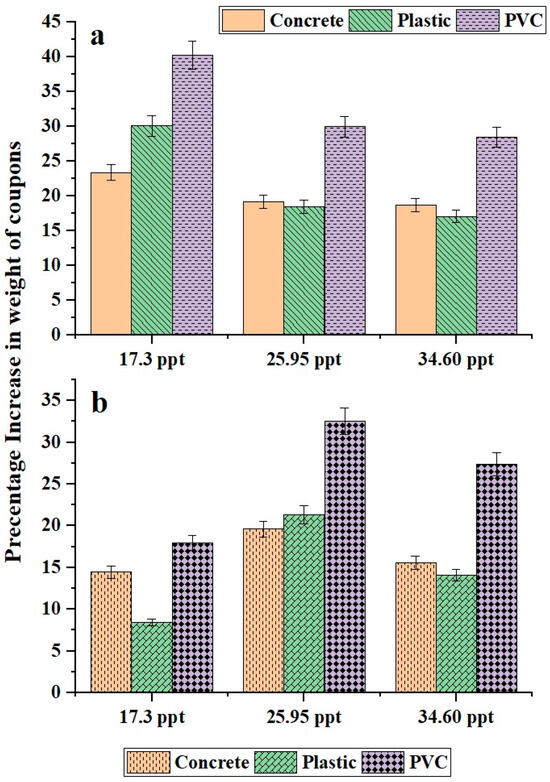
Figure 3.
Impact of carbon concentrations and salinities on biofilm growth in terms of weight of coupons (a) TOC 346.4 mg/L, (b) 692.8 mg/L.
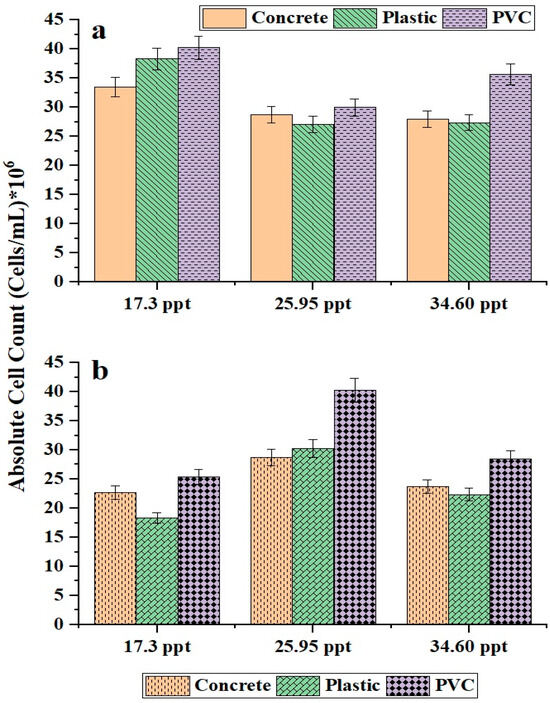
Figure 4.
Effects of carbon concentration and salinities on the biofilm formation in terms of cell count (a) TOC 346.4 mg/L, (b) 692.8 mg/L.
Huang et al. [28] conducted a study that demonstrated an increase in biofilm thickness and cell counts when the TOC concentration of seawater increased from 0.03 to 2 mg/L in a pilot-scale desalination plant. The “Initiation” phase of the biofouling mechanism is the initial phase, during which nutrients and organic compounds present in the seawater progressively absorb and deposit on the surface of cooling water system components [10]. The biofilm attachment on the coupons is initiated and increased by the availability of nutrients, particularly carbon sources. An organic carbon source is the primary nutrient source for microorganisms. An increase in the population of microorganisms occurs when there is an adequate supply of carbon, which enables them to develop more rapidly. In addition, microorganisms frequently utilize organic carbon as an energy source, facilitating their growth and proliferation. An increase in the rate of microbial growth leads to an increased number of cells adhering to surfaces and aggregating, forming a biofilm. Similarly, the salinity tolerance of bacterial species may result in variations in biofilm growth. The previous study conducted by Yang et al. [13] indicated that the total cell count on the RO membrane was higher in the influent seawater with low and medium salinities than in the high salinity influent seawater. In addition, the study found that cell prefoliation is more prevalent in low salinity, while cell attachment is more prevalent in medium salinity. The discrepancy in biofilm attachment at varying salinities may be attributed to variations in substrate utilization kinetics [11]. The substrate utilization may be greater in medium and lower salinities than in high salinity.
3.3. Correlation Between Initial Cell Count and Biofilm Growth
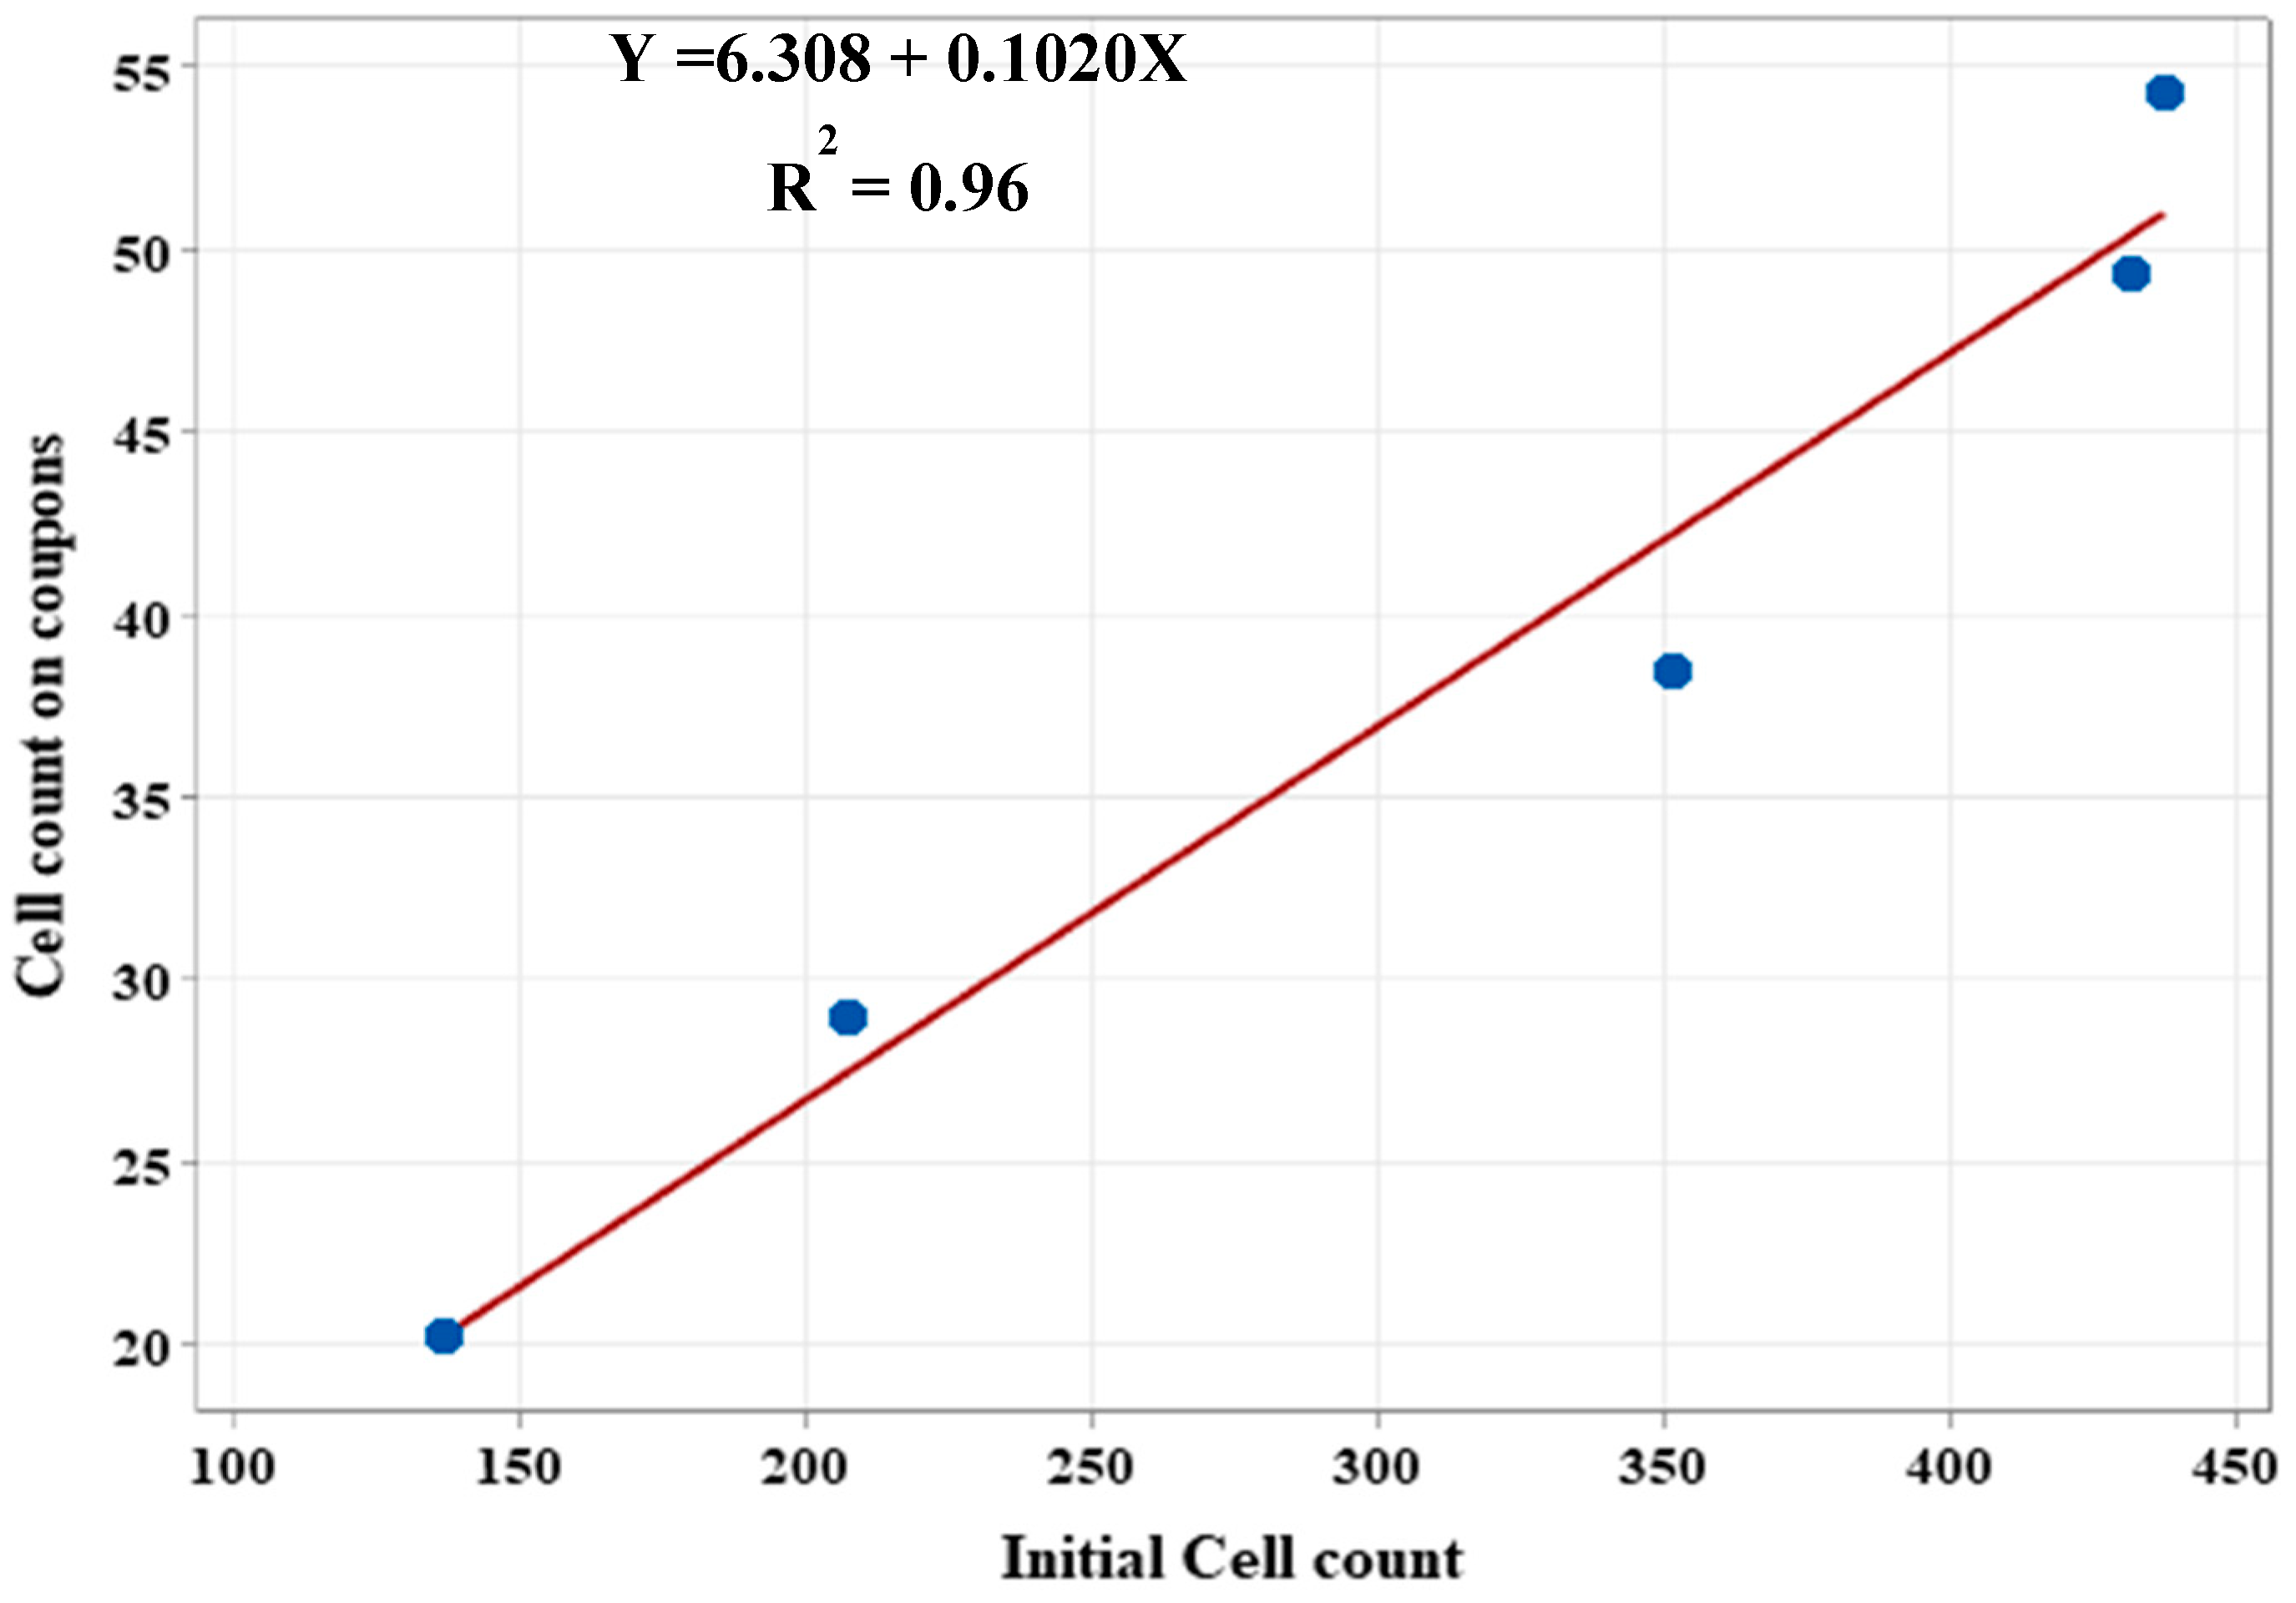
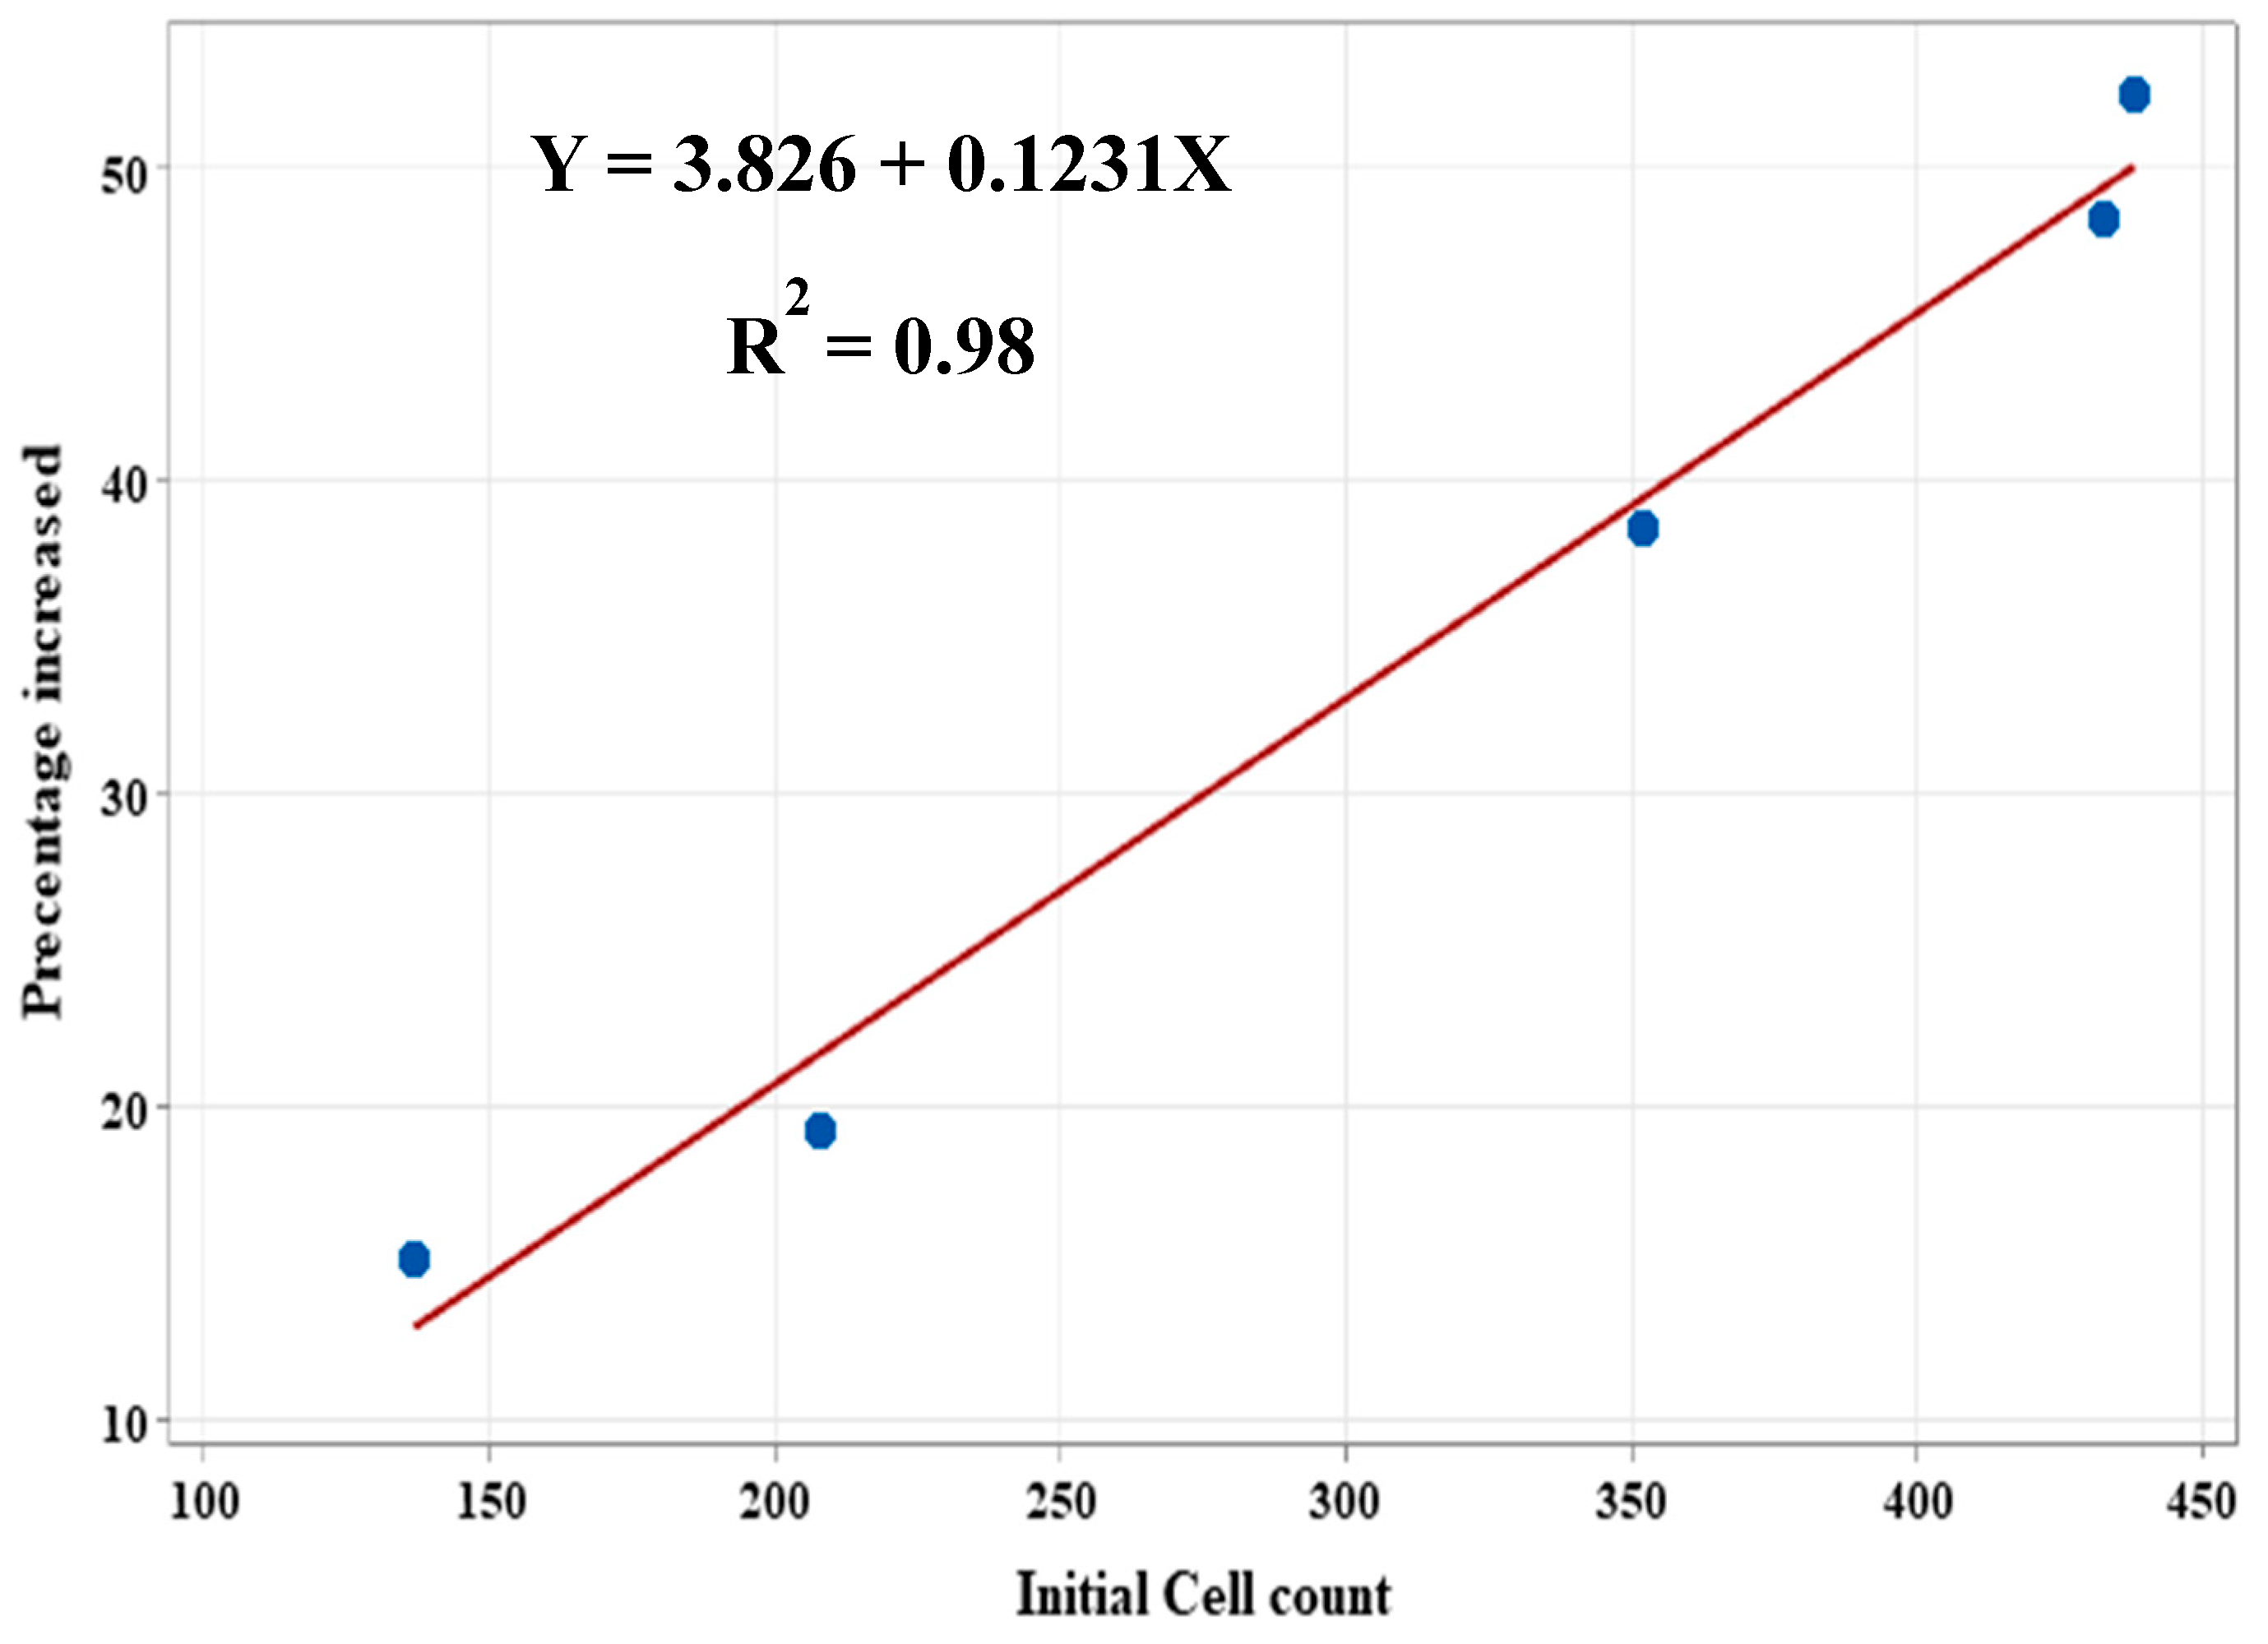
The correlation between biofilm attachment and initial cell count is the term used to describe the relationship between the number of cells that adhere to a surface and the subsequent development of a biofilm. The initial critical stage in forming biofilms is the attachment of cells to the surface of coupons. Organic matter, salinity, and the material of coupons are among the factors that influence the biofilm attachment to a coupon, as previously mentioned in Section 3.2. Likewise, the initial concentration of bacteria in the seawater can also influence the attachment and proliferation of cells on the coupon material. A batch-scale study was conducted in the present study to ascertain the correlation between the initial bacterial cell count and the cell count present on the coupons at the end of the batch study. The batch study employed five sets of seawater with five different initial cell counts. PVC was used as the coupon material for the batch study, as it exhibited the highest biofilm attachment, as specified in Section 3.1. Figure 5 and Figure 6 represent the correlation graph between the initial cell count of seawater, the cell count on coupons, and the percentage increase of biofilm attachment. The results show strong positive linear correlations between the initial cell count of seawater and the cell count on coupons, with a Pearson correlation coefficient (r) of 0.98. Furthermore, the high R2 value (0.96) and p-value (0.003) less than 0.05 indicated that the cells attached to the coupons increased as the initial cell count of seawater increased. Similarly, there is a strong positive linear correlation between the initial cell count of seawater and the percentage increase of biofilm attachment, with an r-value of 0.98. Similar results were reported in the previous study conducted by Faria et al. [10]. Based on the findings of the study, there is a significant correlation between the number of biofilm cells on day 42 and the number of cells present during the “Initiation” phase. Consequently, the biofilm attachment on the coupons depends upon the initial cell count of biofouling organisms in the seawater.

Figure 5.
Correlation between Initial Cell Count and Cell count on coupons during biofilm formation.
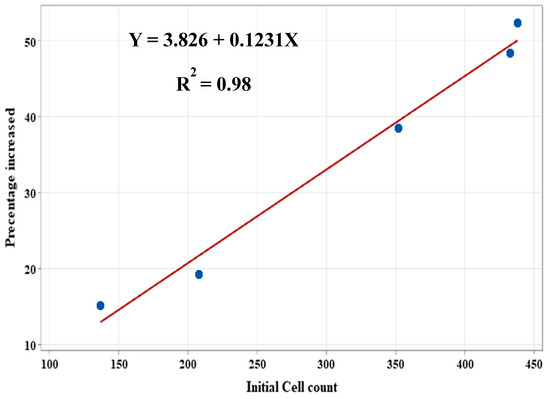
Figure 6.
Correlation between Initial Cell Count and weight of coupons during biofilm formation.
3.4. Comparison of Disinfection Efficiency: NaClO vs. NaBr
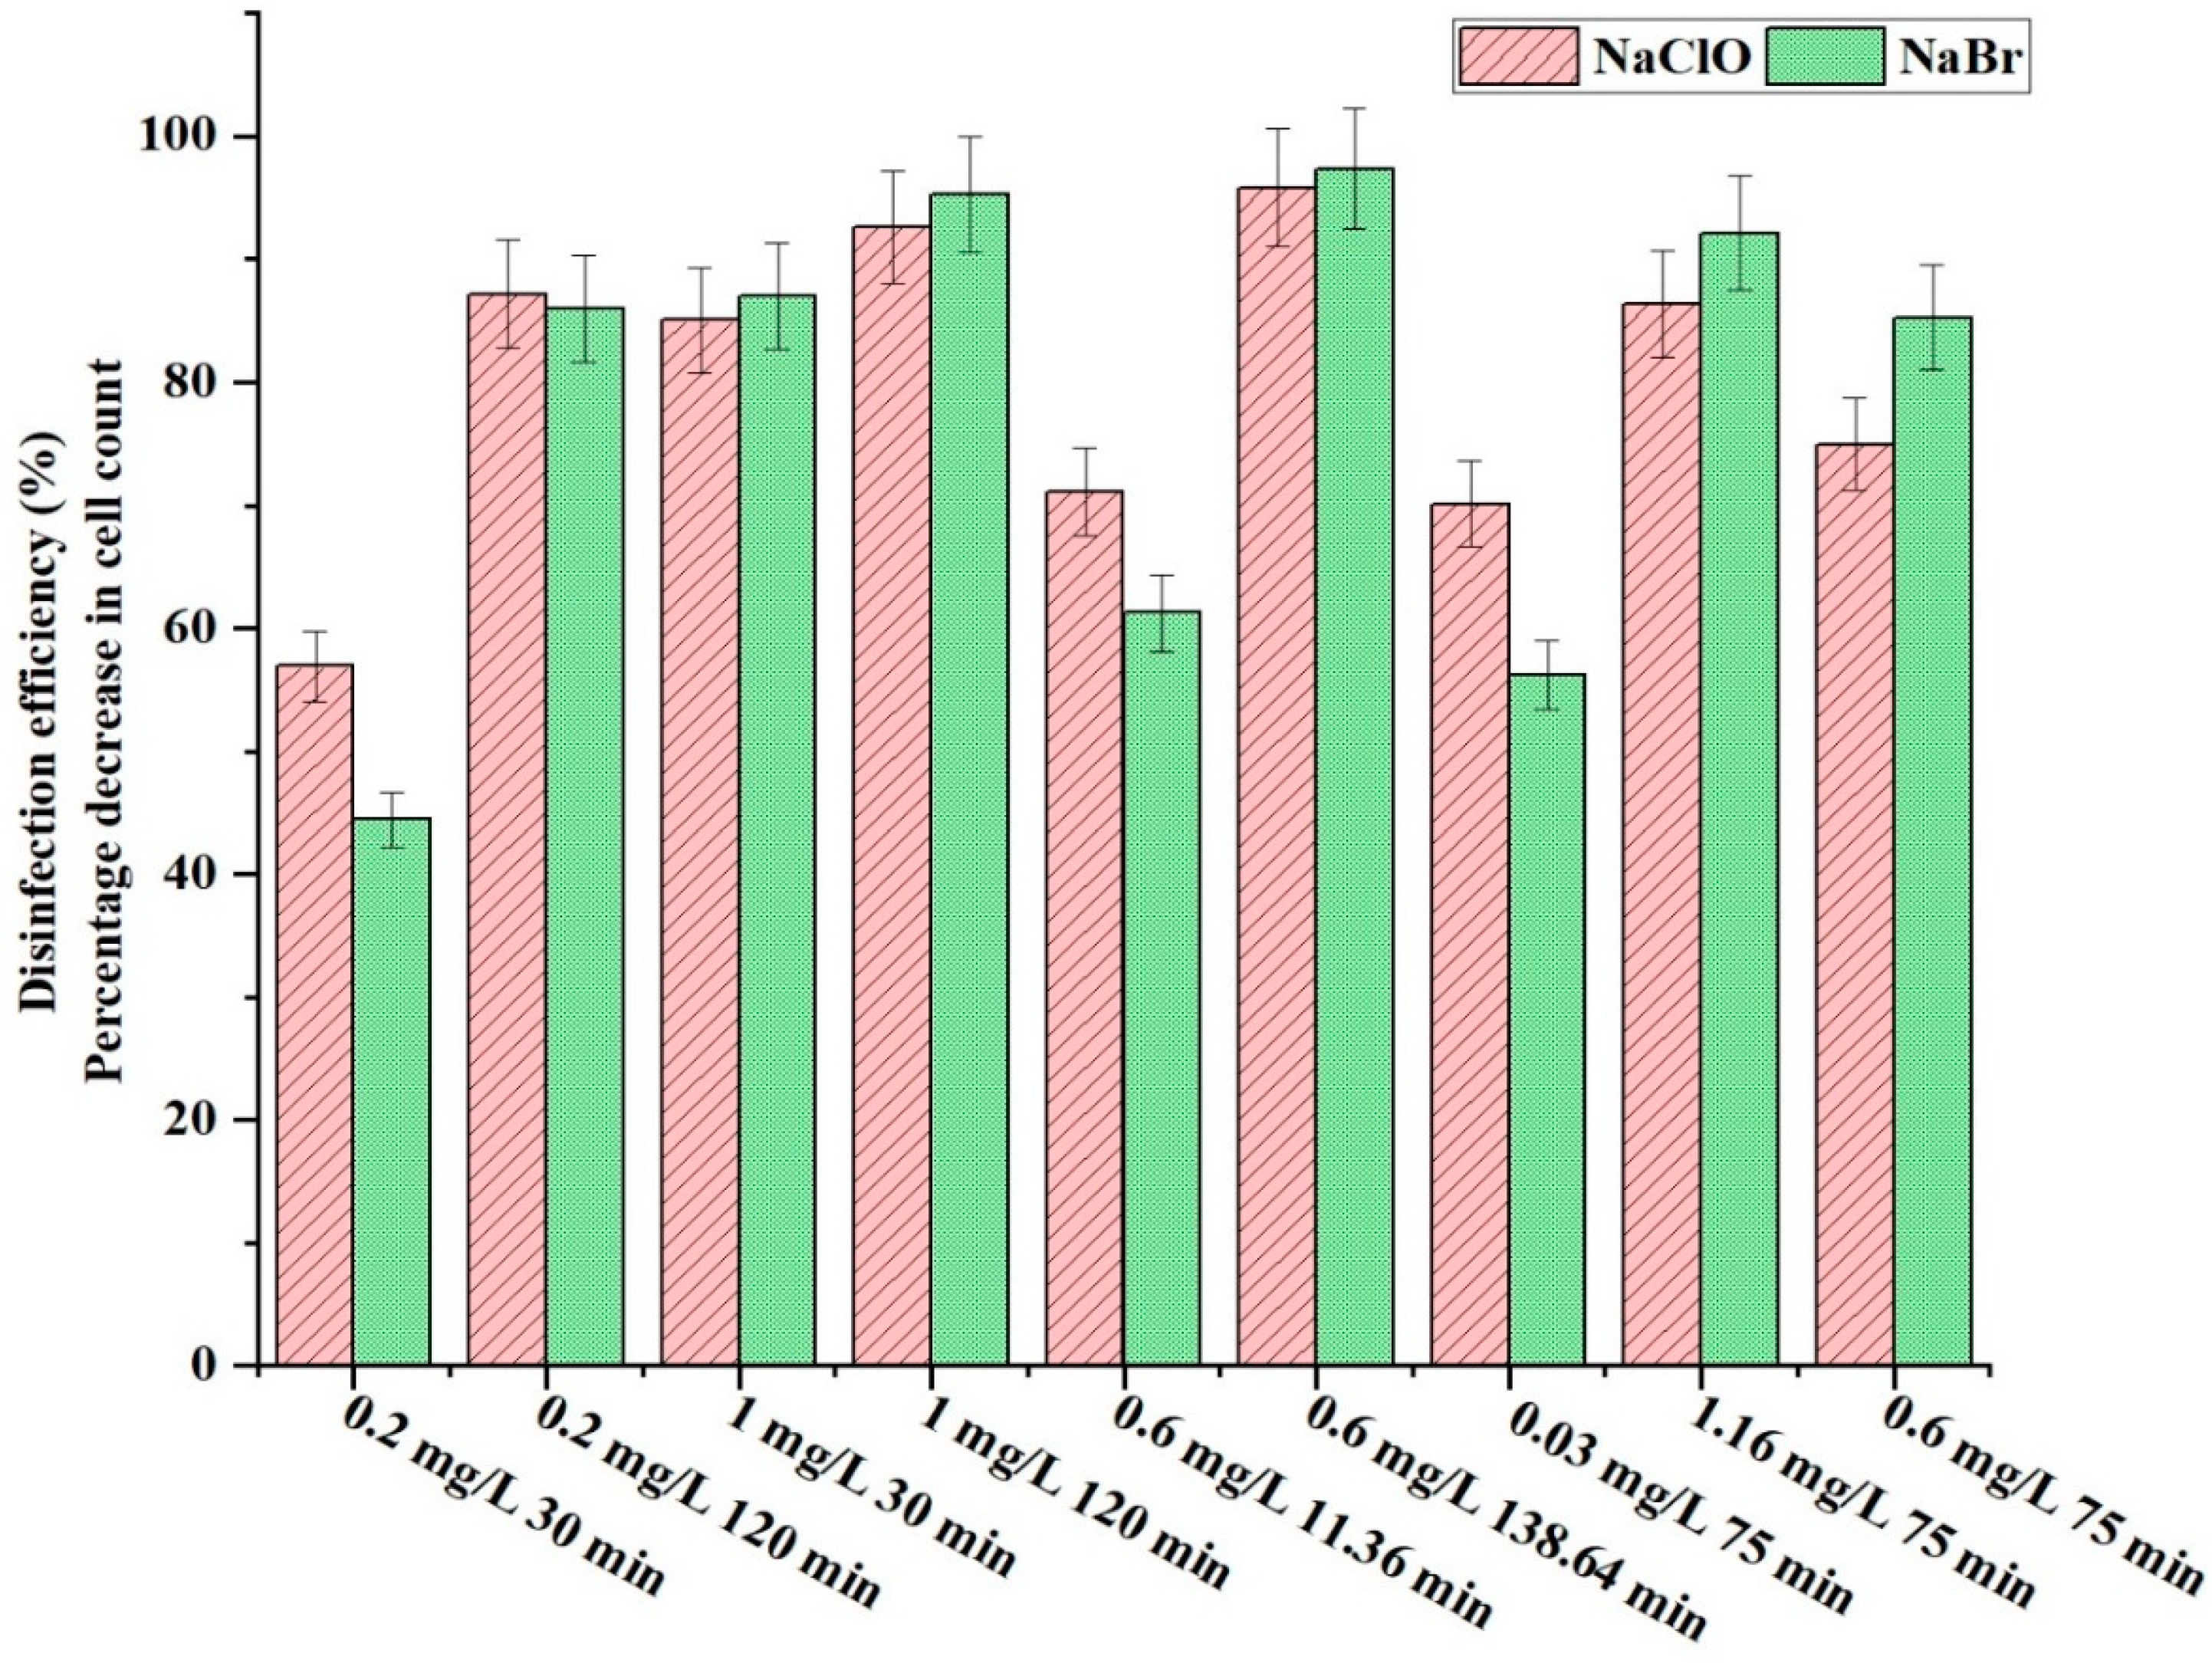
The most common mitigation strategy to prevent biofouling has been chemical removal [16]. A biocide is a chemical compound that induces cell death and is damaging to biofouling organisms, thereby inhibiting biofouling. It accomplishes this by hindering the activity and proliferation of the microorganisms that generate biofouling conditions [29]. A comparison of the disinfection efficacy of NaClO and NaBr was conducted in the current study. Figure 7 and Figure 8 represent the disinfection efficiency (cell count) and percentage decrease in the coupon’s weight. NaClO and NaBr exhibited maximum cell-count removal efficiencies of 95.57 and 97.69%, respectively. Furthermore, the impacts of initial cell concentrations on the disinfection efficacy of NaClO and NaBr were determined. The disinfection efficiencies of both biocides, NaClO and NaBr, were slightly reduced as the initial cell count on the coupons increased. The finding suggests that NaBr exhibited a higher level of disinfection efficiency than NaClO. Similar results were found in previous studies [30,31]. Burton & Margrey [31] conducted a comparative disinfection study in the cooling systems of the Calvert Cliffs Nuclear Power Plant in the United States, which was operated by the Baltimore Gas and Electric Company. The study utilized estuarine water with a salinity of 12 ppt. According to the findings, the colonization of biofouling organisms was reduced by 85% through bromine dosing, while chlorine dosing was inhibited by 79%. This inhibition happened when both chlorine and bromine were administered at a continuous rate of 0.1 mg/L for a period of 20 days. The previous study by Fujioka et al. [30] evaluated the effectiveness of two disinfectants, stabilized hypobromite and chlorine, in controlling biofouling in a reverse osmosis (RO) membrane that processes seawater. The bacterial counts in seawater decreased by 49.47% when the maximum chlorine dose of 5 mg-Cl2/L was applied. Similarly, stabilized hypobromite dosed at the same dosing concentration as the seawater led to an even greater decrease of 99.32%. The results showed that stabilized hypobromite was a better disinfectant for controlling biofouling compared to chlorine.
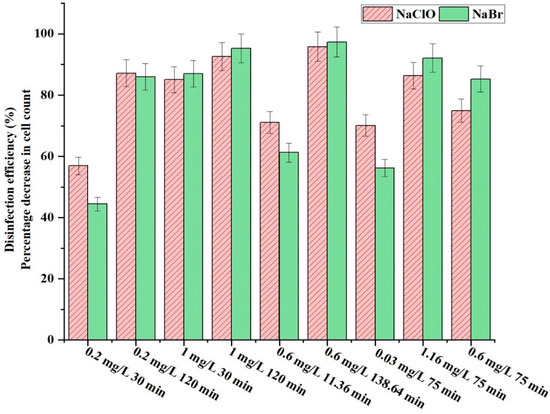
Figure 7.
Comparison of disinfection efficiency (cell count) of NaClO and NaBr.
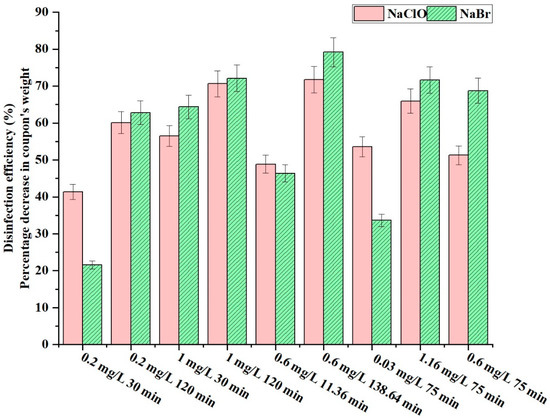
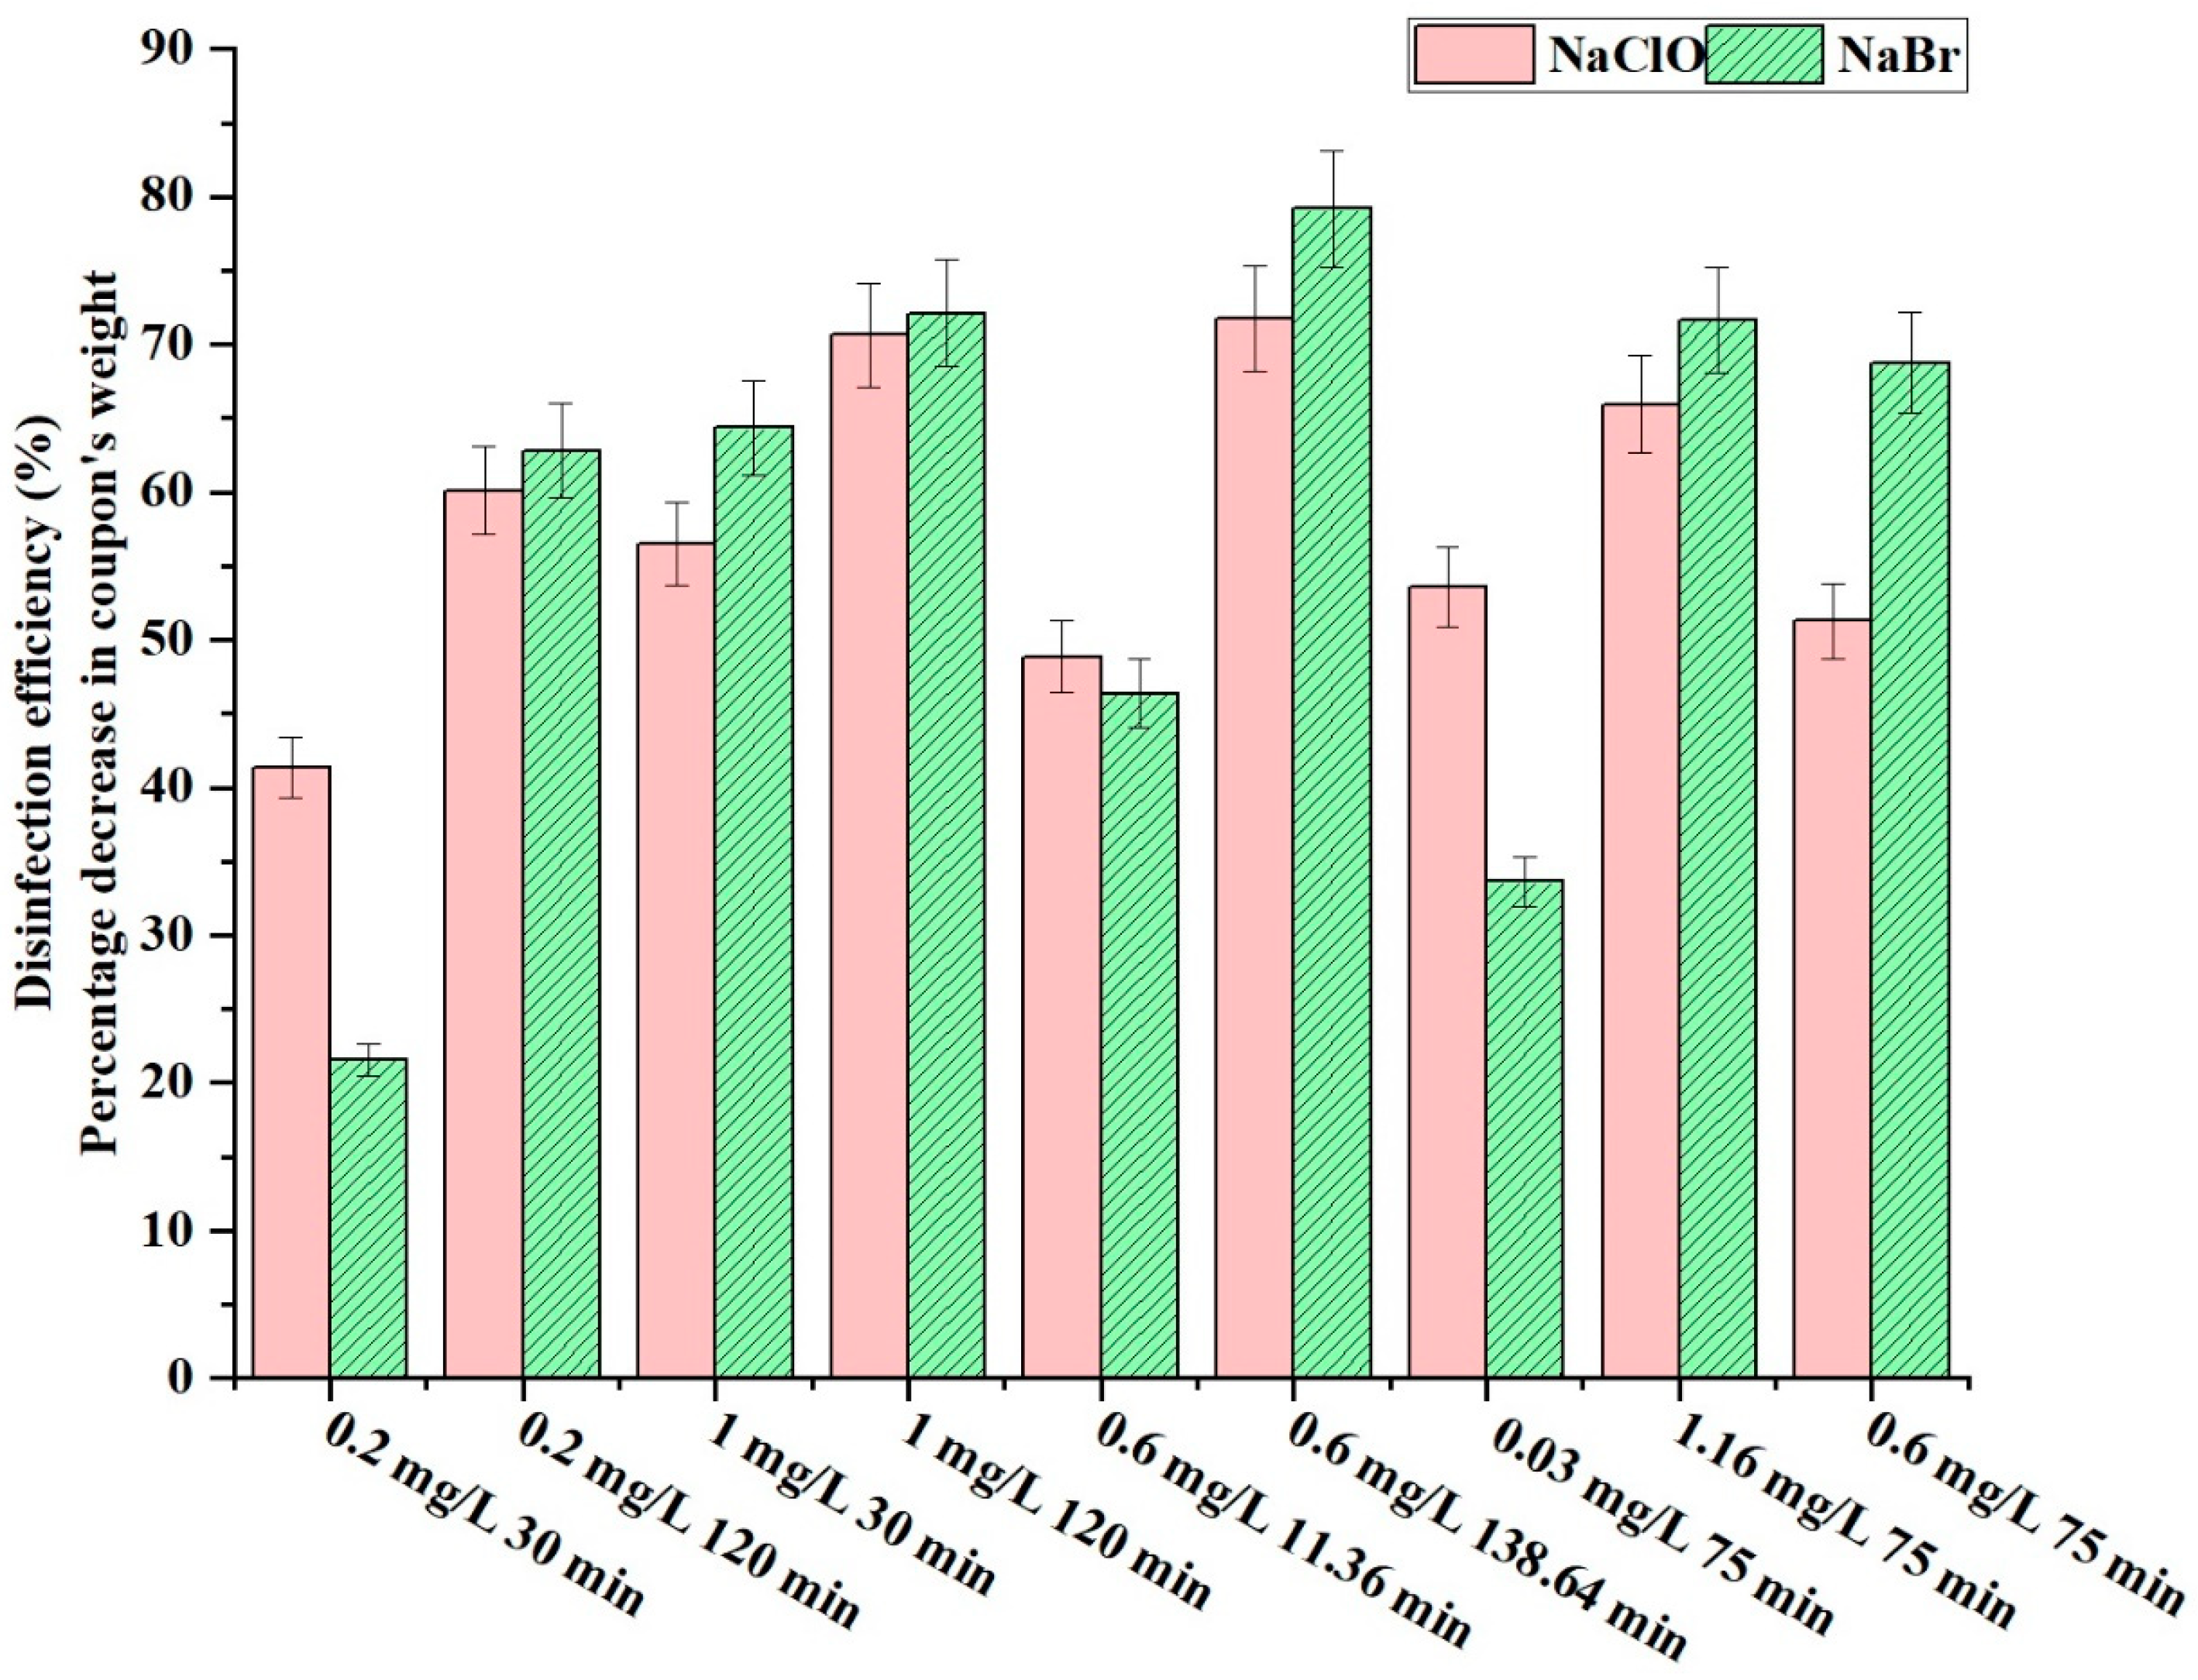
Figure 8.
Comparison of disinfection efficiency (coupon’s weight) of NaClO and NaBr.
The more effective disinfection of NaBr was primarily attributed to its chemical stability and reactivity at high pH. In seawater, which typically has a high pH (~8.0–8.3), NaClO largely exists as a hypochlorite ion (OCl−) rather than as hypochlorous acid (HOCl). HOCl is the more effective antimicrobial species, but its proportion decreases significantly at high pH, thus reducing the biocidal efficiency of NaClO [32]. In contrast, when NaBr is used, it generates hypobromous acid (HOBr), which remains a strong and effective biocidal agent even at higher pH [33]. In addition, HOBr is more effective at penetrating and destroying microbial cell walls than HOCl or OCl− because it is less charged and more lipophilic. Similarly, bromine is less reactive with ammonia and organic nitrogen compounds than chlorine, meaning it remains active longer in seawater that contains organic matter. However, chlorine tends to quickly form chloramines when reacting with ammonia or organics, reducing its disinfecting ability. Another advantage of NaBr tends to maintain an effective residual concentration longer under seawater conditions compared to NaClO, providing more sustained biofouling control. Therefore, NaBr can better target and disrupt biofilms under high pH conditions typical of seawater [20,32,33].
3.5. Optimization of Disinfection Parameters Using RSM
Various variables influence disinfection efficiency, including the initial concentration of biocides and dosing duration. The disinfection efficacy of biocides can be enhanced by optimizing these variables. The optimization was conducted in the present investigation using RSM modeling. Table S1 illustrates the types of variables and their respective levels following the CCD design. Considering the minimum and maximum values of the initial concentrations of NaClO and NaBr (0.2 and 1 mg/L), the dosing period (30 and 120 min), along with the central and axial points, a total of 13 tests were designed in one block. The results were validated by conducting an RSM modeling of the 13 distinct sets of combinations of initial concentrations of biocides and dosing period. The disinfection efficacy was demonstrated by reducing the cell count and the weight of the coupons. The experimental and predicted values of all combinations were presented in Tables S2 and S3.
The regression equations with six coefficients that were obtained in the ANOVA analysis for NaClO and NaBr in terms of reduction in cell count were presented in Equations (4) and (5), respectively. Similarly, Equations (3) and (4), respectively, represent the regression equation obtained in the ANOVA analysis for NaClO and NaBr with respect to the reduction in the coupon’s weight.
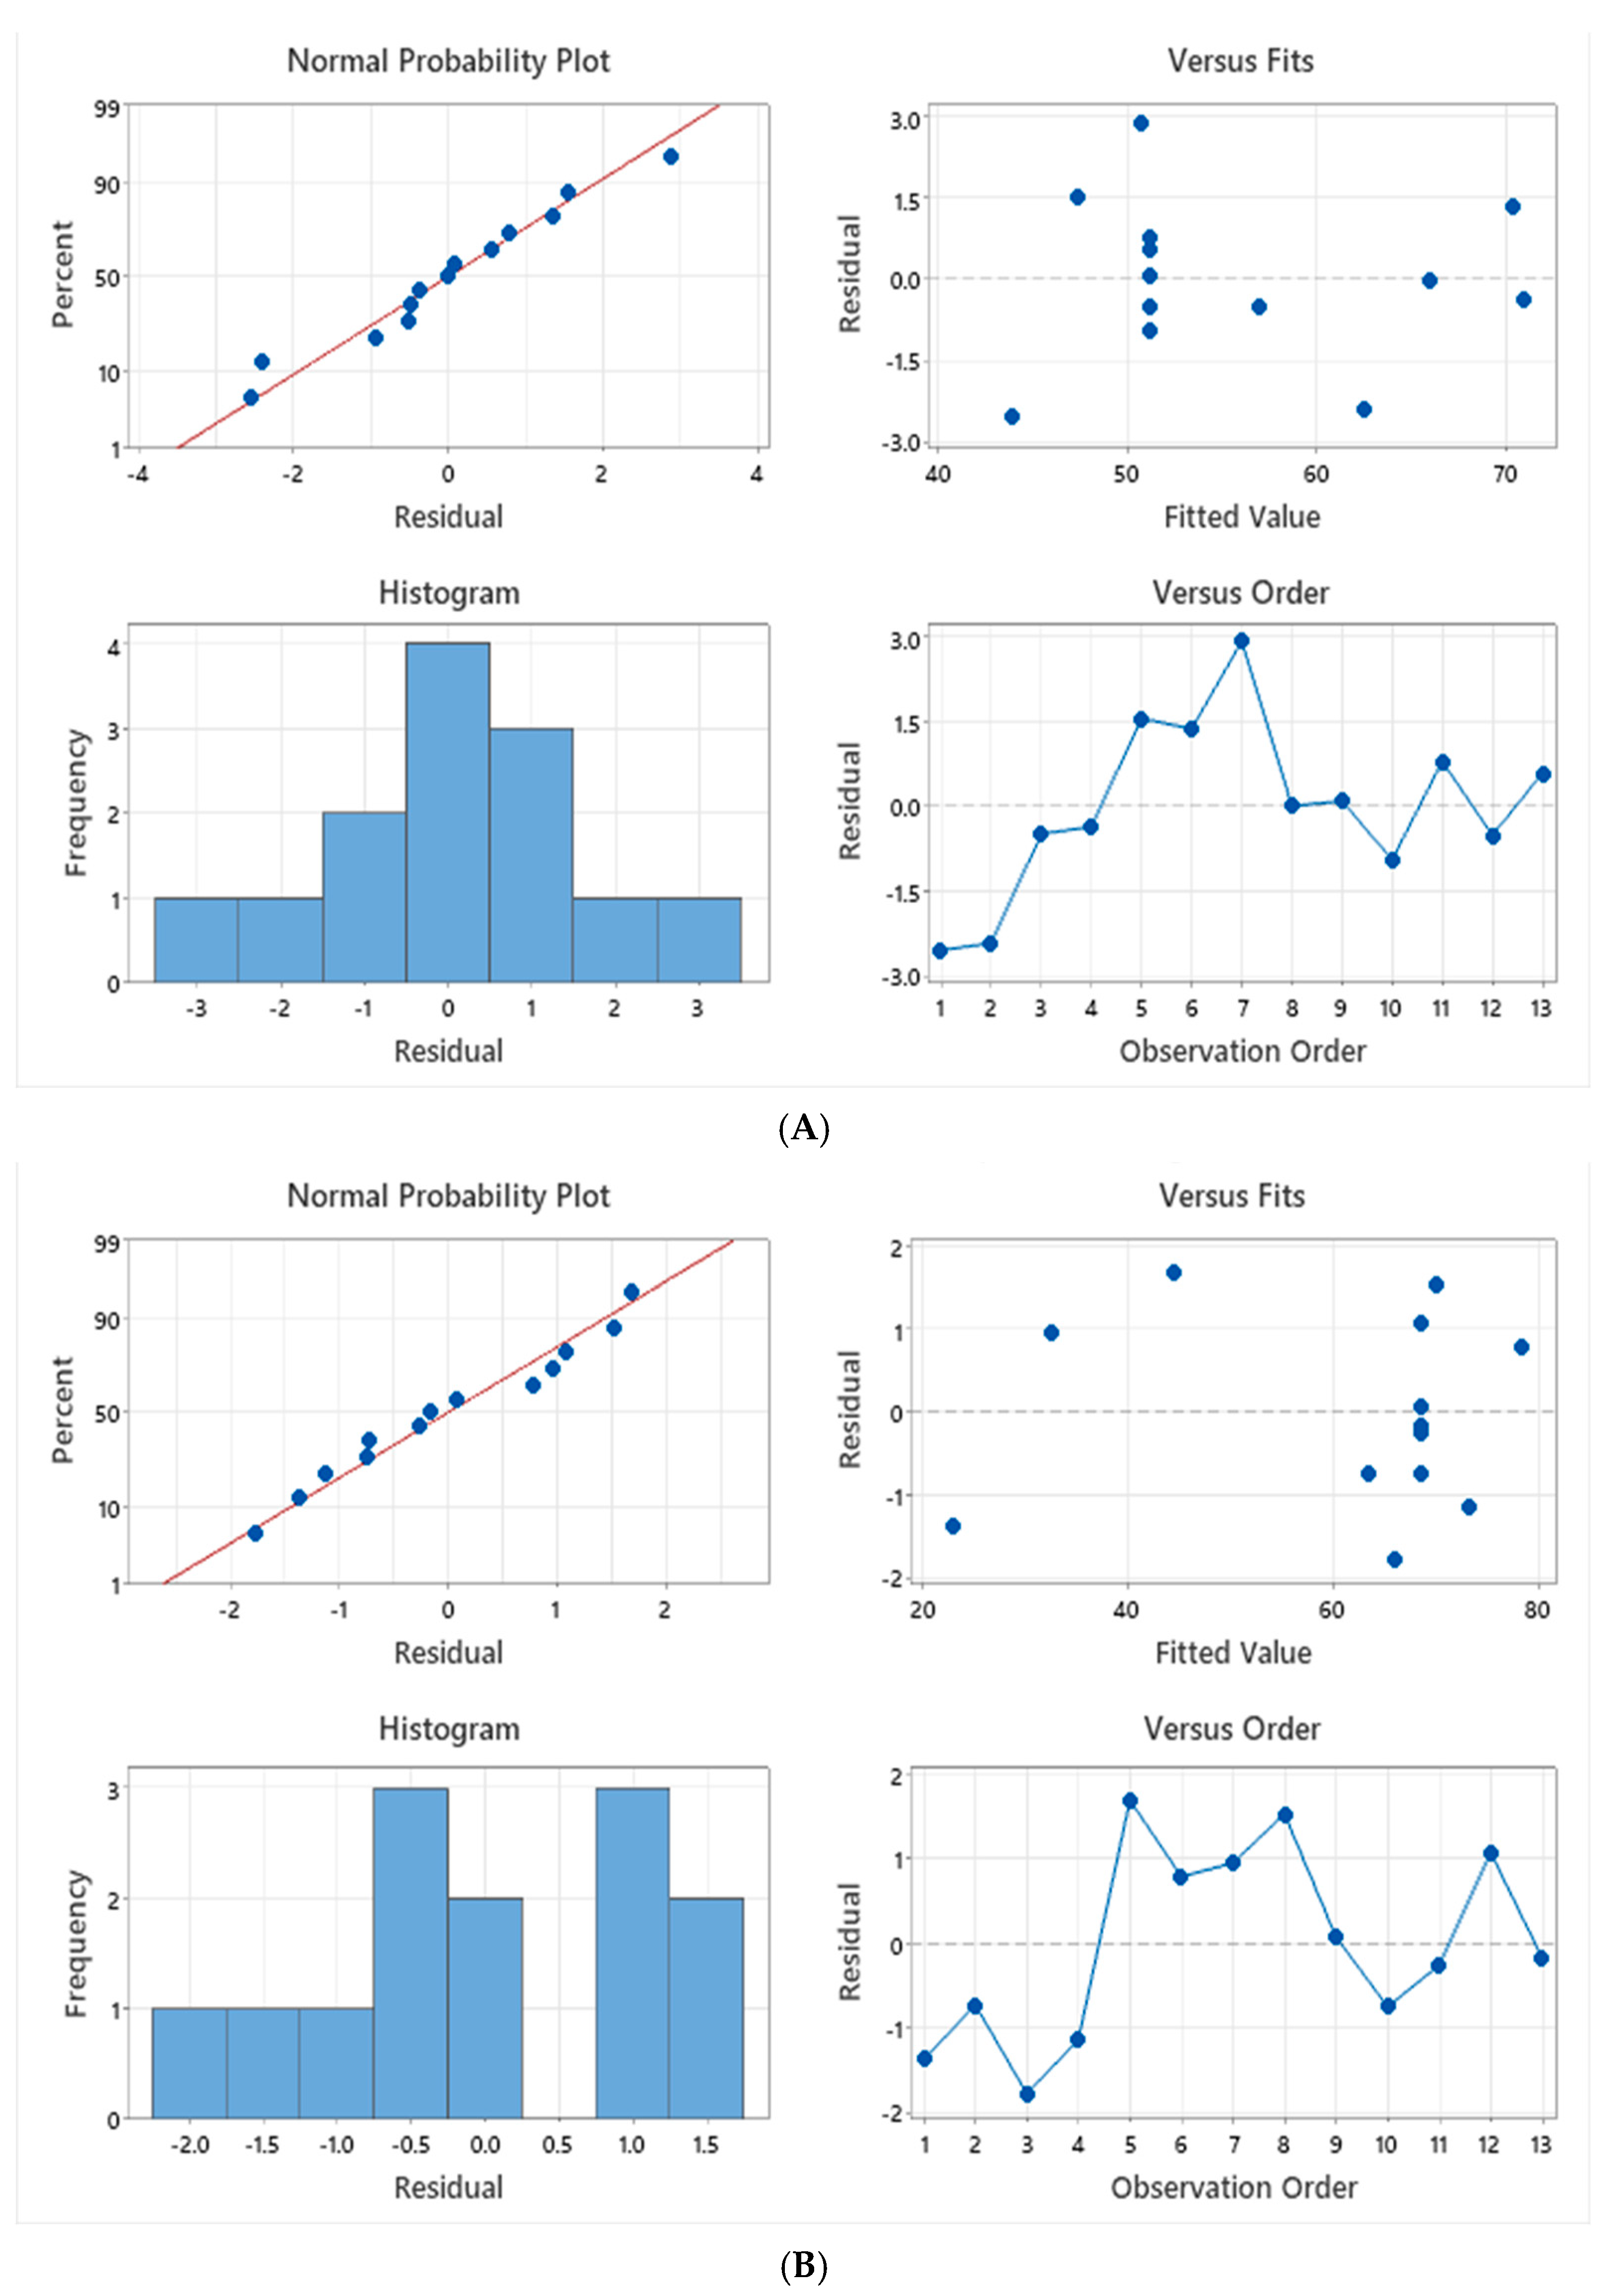
p-values were employed to evaluate the statistical significance of the analysis. The disinfectant efficiency was significantly influenced by the initial concentration of biocides and dosing period, as demonstrated by the fact that the overall p-values (0.000) of the model were less than the level of significance in all cases (Tables S4 and S5). This was evident in both cases, including a reduction in cell count and coupon weight. The variance of the coefficient is represented in terms of the variance inflation factor (VIF). Multicollinearity between the predictors was not observed, as the VIF values of the design model were consistently around 1. Figure 9 and Figure 10 illustrate the residual plots of NaClO and NaBr, which validate the model by examining the patterns in these figures. The histogram of residual plots displayed the residual distribution generated for each combination. The normality of the residuals was more effectively assessed using a normal probability plot because the sample size was 13 (<20). The residuals were distributed normally, as demonstrated by the fact that the normal probability plot of the model followed a straight line. The points were distributed indiscriminately around the line passing through the center, as demonstrated by the residual versus order plots.
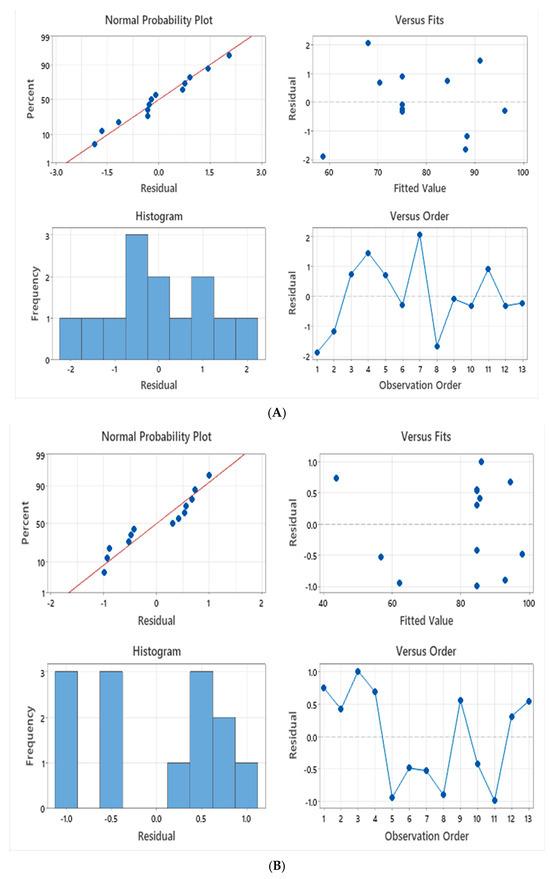
Figure 9.
Residual plots of RSM design under (A) NaClO (B) NaBr: Cell Count.

Figure 10.
Residual plots of RSM design under (A) NaClO (B) NaBr: Coupon’s Weight.
The ANOVA analysis was also used to analyze the individual p-values (see Tables S6 and S7). For the disinfection efficiency in terms of cell count and coupon weight, the p-values of X1 and X2 were zero for both NaClO and NaBr, which is less than the level of significance of 0.05. The results indicate that the disinfection efficiency was dependent upon both variables, such as the initial concentration of biocides and the dosing period. F-values of the model were 113.74 and 691.00, respectively, for NaClO and NaBr when the disinfection efficiency was measured in terms of cell count. Similarly, the F-values of the model were 48.28 and 309.02, respectively, for NaClO and NaBr when the disinfection efficiency was measured in terms of coupon weight. Results indicate that the model developed is statistically significant, as illustrated by the very high F-values for the corresponding p-values. The p-values of the linear and quadratic terms of both factors (X1 and X2) were zero, suggesting that the variables had a synergetic effect on disinfection efficiency. Table S8 shows the practical aspect of the model based on the design summary. The model that expresses the disinfection efficiency in terms of cell count produced R-squared values of 98.78% and 99.80% for NaClO and NaBr, respectively. Similarly, R-square values of 98.18% and 99.55% for NaClO and NaBr, respectively, for the model that expresses the disinfection efficiency in terms of the coupon’s weight. The findings suggest that the model variables (dosing period and initial concentration of biocides) significantly influenced the dependent factor (disinfection efficiency), and the practical significance of the model is high.
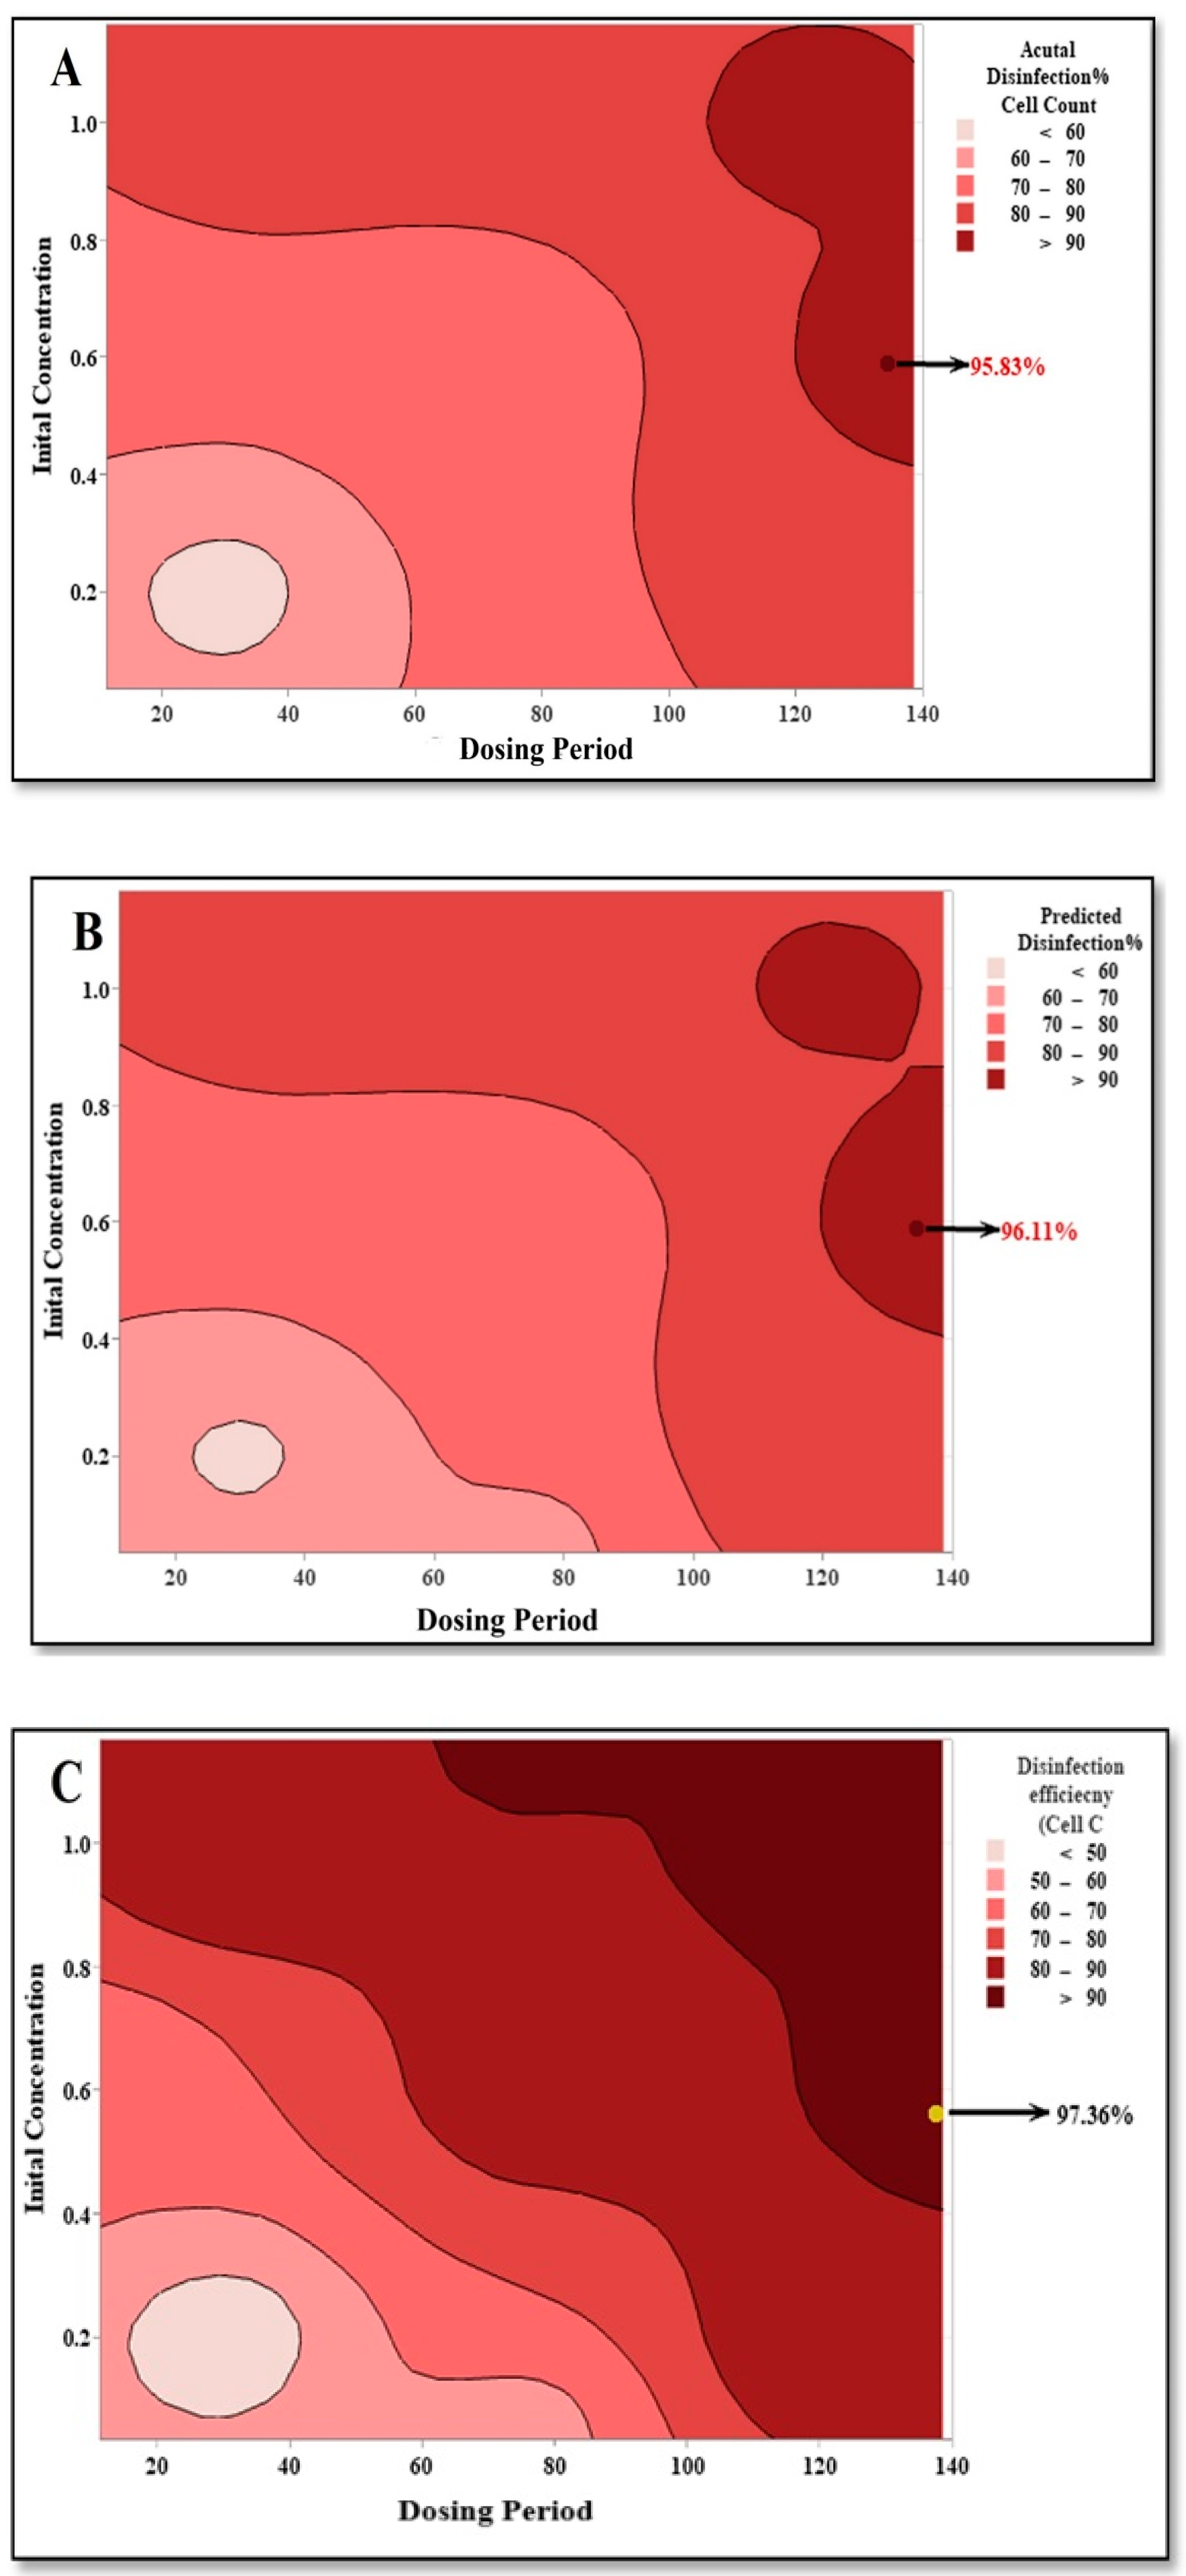
Figure 11 and Figure 12 represent the contour plots, which show the relationship between the dosing period and initial concentration of NaClO and NaBr, respectively. NaClO and NaBr exhibited the highest actual disinfection efficiencies (95.83% and 97.36%, respectively) in terms of cell count at an initial concentration of 0.6 mg/L and a dosing period of 138 min. Similarly, predicted disinfection efficiencies in terms of cell count from the model were confirmed, with an optimal value of 96.11% and 97.84% for NaClO and NaBr, respectively. The maximum actual disinfection efficiencies in terms of coupon weight were 71.80% and 79.20% for NaClO and NaBr, respectively, as determined by the experimental value. The maximum predicted disinfection efficiencies in terms of coupon weight were 70.44% and 78.41% for NaClO and NaBr, respectively, as predicted by the model. The optimum disinfection efficiencies in terms of cell count and coupon weight were achieved for both biocides at an initial concentration of 0.6 mg/L and a dosing period of 138 min. There was a stronger correlation between the experimental values and the model-predicted values, as the maximum disinfection efficiency was achieved at a lower initial concentration of biocides and a longer dosing duration. The disinfection efficiency of NaBr was marginally higher than that of NaClO, as indicated in Section 3.4. NaClO and NaBr exhibited higher R2 values of 0.98 and 0.99, respectively, when a linear fit was performed between the predicted and actual disinfection efficiency in terms of cell count. Similarly, the linear fit of the predicted versus actual disinfection efficiency in terms of coupon weight demonstrated higher R2 values of 0.97 and 0.99 for NaClO and NaBr, respectively. The model-predicted values are not significantly different from the experimental values. Consequently, the model that was developed was well-fitted.
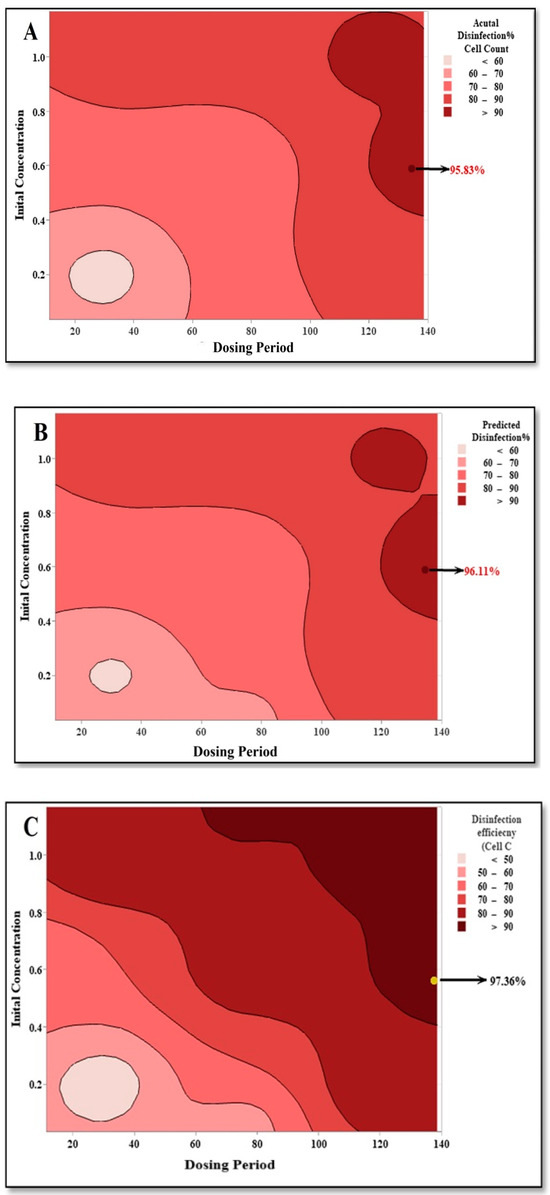
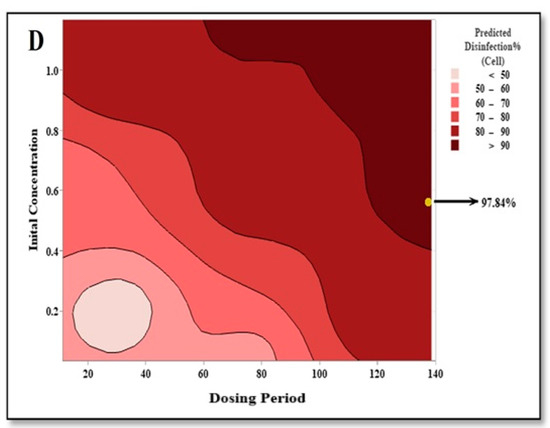
Figure 11.
Contour plot of (A) actual and (B) predicted disinfection efficiency (cell count) for NaClO and (C) actual and (D) predicted disinfection percentage (cell count) for NaBr.
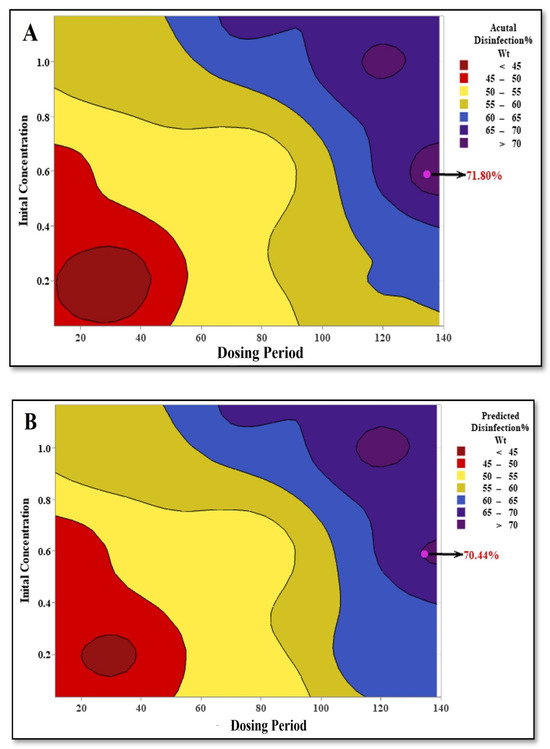
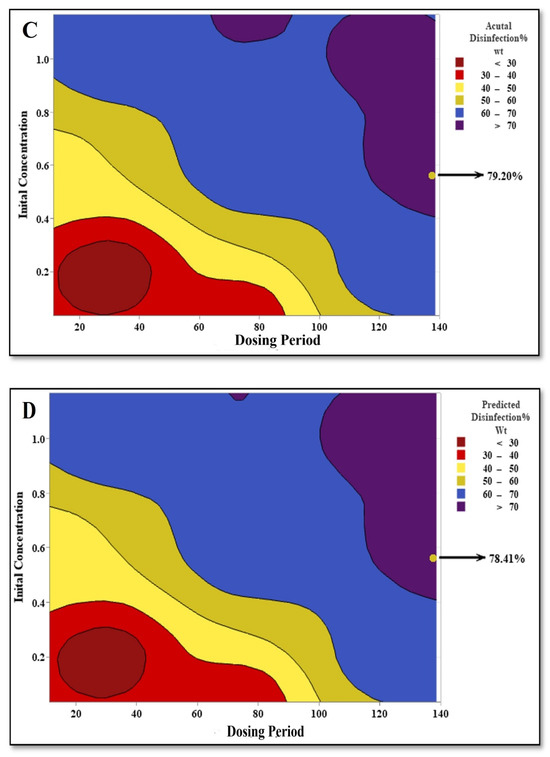
Figure 12.
Contour plot of (A) actual and (B) predicted disinfection efficiency (Coupon’s Weight) for NaClO and (C) actual and (D) predicted disinfection percentage (Coupon’s Weight) for NaBr.
4. Conclusions
This study evaluated biofilm growth on concrete, plastic, and PVC coupons, assessing their biofilm attachment based on weight increase and cell count. The formation of biofilm is significantly influenced by the material of the coupons. The PVC exhibits the highest biofilm attachment (40.22% weight increase, 49.64 × 10⁶/mL cell count), followed by plastic and concrete. The carbon concentration and the salinity of seawater had a substantial impact on the formation of biofilm. Increased carbon concentrations stimulate biofilm growth; however, the impact is mitigated by salinity. Microbial attachment was diminished at high salinity (34.6 ppt), whereas optimal biofilm growth was observed at moderate salinity (25.95 ppt). A strong correlation was observed between initial bacterial cell count and biofilm development, emphasizing the need for pre-treatment strategies. In comparing biocide efficiency, NaBr demonstrated superior disinfection performance over NaClO, likely due to its stability in seawater pH conditions. The RSM model was used to validate the optimum conditions for optimal disinfection efficiency, which were a dosing period of 138 min and an initial concentration of biocides of 0.6 mg/L. These findings contribute to the development of improved biofouling management strategies for industrial seawater intake systems, offering both material selection and chemical treatment guidelines for reducing biofilm-related operational challenges.
5. Limitations and Future Perspectives
This study offers valuable insights into the effects of salinity, organic carbon concentration, and biocide application on biofilm development; however, several limitations must be acknowledged. Under controlled laboratory conditions, the experiments were conducted, which may not accurately represent the complexity of natural marine environments, including factors such as temperature fluctuations and intermittent flow rates. In addition, the behavior of native marine biofilm-forming organisms may not be accurately represented by the use of domestic wastewater as the microbial source, particularly at higher salinity levels. The investigation was restricted to three material types (concrete, plastic, and PVC), and the influence of material properties on biofilm formation was not extensively examined. Furthermore, the investigation concentrated on oxidizing biocides without comparing them to nonoxidizing alternatives, which could potentially restrict the scope of the chemical treatment strategies that were assessed. Finally, the biocide dosing period and concentration were optimized for laboratory settings. However, they necessitated additional validation through pilot-scale or full-scale field studies to evaluate their environmental impact and efficiency in practical applications. Future research should concentrate on the following: (1) assessing the synergistic effects of biocides in conjunction with antifouling coatings, (2) contrasting oxidizing and nonoxidizing biocides, (3) testing a broader selection of industrially relevant materials, (4) conducting pilot-scale experiments under semi-industrial conditions, and (5) assessing the expense, toxicity, and environmental impact of prolonged NaBr use in industrial systems. These advancements would not only substantiate laboratory findings but also improve the practical applicability of the results, thereby facilitating the development of more sustainable and effective biofouling management strategies in industrial seawater intake systems.
Supplementary Materials
The following supporting information can be downloaded at: https://www.mdpi.com/article/10.3390/su17104262/s1, Figure S1: Experimental setup employing the biofilm annular reactor; Figure S2: Batch-scale biofilm reactor setup; Table S1: The actual and coded levels of the independent parameters; Table S2: CCD design matrix for two variables with experimental and predicted values for disinfection efficiency of NaClO; Table S3: CCD design matrix for two variables with experimental and predicted values for disinfection efficiency of NaBr; Table S4: Factors effect and associated p-values for disinfection efficiency (Cell Count) using NaClO and NaBr; Table S5: Factors effect and associated p-values for disinfection efficiency (Coupon’s weight) using NaClO and NaBr; Table S6: Analysis of variance of selected quadratic model for NaClO and NaBr: Cell count; Table S7: Analysis of variance of selected quadratic model for NaClO and NaBr: Coupon’s Weight; Table S8: CCD model summary results; Table S9: BG-11 Media Composition.
Author Contributions
Conceptualization, A.A.H. and M.A.H.; Data curation, S.N.J., A.A.A., A.B.A., F.M.A., N.H.A.B. and S.K.H.; Formal analysis, S.N.J.; Funding acquisition, A.A.H. and M.A.H.; Investigation, S.N.J., A.A.A., A.B.A., F.M.A., N.H.A.B. and S.K.H.; Methodology, S.N.J., A.A.H. and M.A.H.; Project administration, S.N.J., A.A.H. and M.A.H.; Resources, A.A.H. and M.A.H.; Software, S.N.J.; Supervision, S.N.J., A.A.H. and M.A.H.; Validation, S.N.J., A.A.H. and M.A.H.; Visualization, S.N.J., A.A.A., A.B.A., F.M.A., N.H.A.B. and S.K.H.; Writing—original draft, S.N.J., A.A.A., A.B.A., F.M.A., N.H.A.B. and S.K.H.; Writing—review and editing, S.N.J., A.A.H. and M.A.H. All authors have read and agreed to the published version of the manuscript.
Funding
This research was funded by the UAE University SURE Plus Grant Program, grant number G00004762, and the APC was funded by the same grant.
Institutional Review Board Statement
Not applicable.
Informed Consent Statement
Not applicable.
Data Availability Statement
The original contributions presented in this study are included in the article/supplementary material. Further inquiries can be directed to the corresponding author.
Conflicts of Interest
The authors declare no conflicts of interest.
References
- An, L.; Wang, L.; Ou, D.; Jia, C.; Li, W.; Ding, Y.; You, C.; Liao, J.; Huang, H. The ecological mechanisms of Acetes blooms as a threat to the security of cooling systems in coastal nuclear power plants. J. Coast. Conserv. 2021, 25, 55. [Google Scholar] [CrossRef]
- Rubio, D.; López-Galindo, C.; Casanueva, J.F.; Nebot, E. Monitoring and assessment of an industrial antifouling treatment. Seasonal effects and influence of water velocity in an open once-through seawater cooling system. Appl. Therm. Eng. 2014, 67, 378–387. [Google Scholar] [CrossRef]
- Satpathy, K.K.; Mohanty, A.K.; Sahu, G.; Biswas, S.; Prasad, M.V.R.; Slvanayagam, M. Biofouling and its Control in Seawater Cooled Power Plant Cooling Water System—A Review. Nucl. Power 2010, 191–242. [Google Scholar] [CrossRef]
- Cristiani, P.; Perboni, G. Antifouling strategies and corrosion control in cooling circuits. Bioelectrochemistry 2014, 97, 120–126. [Google Scholar] [CrossRef] [PubMed]
- Dobersek, D.; Goricanec, D. Influence of Water Scale on Thermal Flow Losses of Domestic Appliances. Int. J. Math. Models Methods Appl. Sci. 2007, 1, 55–61. [Google Scholar]
- Li, J.; Tang, M.; Ye, Z.; Chen, L.; Zhou, Y. Scale formation and control in oil and gas fields: A review. J. Dispers. Sci. Technol. 2016, 38, 661–670. [Google Scholar] [CrossRef]
- López-Galindo, C.; Casanueva, J.F.; Nebot, E. Efficacy of different antifouling treatments for seawater cooling systems. Biofouling 2010, 26, 923–930. [Google Scholar] [CrossRef] [PubMed]
- Macadam, J.; Parsons, S.A. Calcium carbonate scale formation and control. Rev. Environ. Sci. Bio/Technol. 2004, 3, 159–169. [Google Scholar] [CrossRef]
- Barton, F.; Shaw, S.; Morris, K.; Graham, J.; Lloyd, J.R. Impact and control of fouling in radioactive environments. Prog. Nucl. Energy 2022, 148, 104215. [Google Scholar] [CrossRef]
- Faria, S.I.; Teixeira-Santos, R.; Morais, J.; Vasconcelos, V.; Mergulhão, F.J. The association between initial adhesion and cyanobacterial biofilm development. FEMS Microbiol. Ecol. 2021, 97, fiab052. [Google Scholar] [CrossRef]
- Rodriguez-Sanchez, A.; Leyva-Diaz, J.C.; Poyatos, J.M.; Gonzalez-Lopez, J. Influent salinity conditions affect the bacterial communities of biofouling in hybrid MBBR-MBR systems. J. Water Process Eng. 2019, 30, 100650. [Google Scholar] [CrossRef]
- Xavier, E.A.; Almeida, A.C.S.; Nogueira, M.M.; Vieira, L.M. Effects of substratum type and orientation on the recruitment of bryozoans in an artificial area of the Western Atlantic. Biofouling 2023, 39, 748–762. [Google Scholar] [CrossRef]
- Yang, H.L.; Pan, J.R.; Huang, C.; Lin, J.C.T. The effect of feed salinity on the biofouling dynamics of seawater desalination. Biofouling 2011, 27, 561–567. [Google Scholar] [CrossRef] [PubMed]
- Sahan, E.; Sabbe, K.; Creach, V.; Hernandez-Raquet, G.; Vyverman, W.; Stal, L.J.; Muyzer, G. Community structure and seasonal dynamics of diatom biofilms and associated grazers in intertidal mudflats. Aquat. Microb. Ecol. 2007, 47, 253–266. [Google Scholar] [CrossRef]
- Bartolomé, M.C.; Sánchez-Fortún, S. Effects of selected biocides used in the disinfection of cooling towers on toxicity and bioaccumulation in Artemia larvae. Env. Toxicol Chem 2005, 24, 3137–3142. [Google Scholar] [CrossRef]
- Cloete, T.E.; Jacobs, L.; Brözel, V.S. The chemical control of biofouling in industrial water systems. Biodegradation 1998, 9, 23–37. [Google Scholar] [CrossRef] [PubMed]
- Abosaty, M.; Hefnawi, H.; Ayaat, N.; Abousaty, A. Assessment and Control of Microbial Induced Corrosion in Sea Water in Nuclear Power Plant Materials. Arab. J. Nucl. Sci. Appl. 2023, 56, 15–28. [Google Scholar] [CrossRef]
- Murthy, P.S.; Venkatesan, R.; Nair, K.V.K.; Ravindran, M. Biofilm control for plate heat exchangers using surface seawater from the open ocean for the OTEC power plant. Int. Biodeterior. Biodegrad. 2004, 53, 133–140. [Google Scholar] [CrossRef]
- Nebot, E.; Casanueva, J.F.; Casanueva, T.; Sales, D. Model for fouling deposition on power plant steam condensers cooled with seawater: Effect of water velocity and tube material. Int. J. Heat Mass Transf. 2007, 50, 3351–3358. [Google Scholar] [CrossRef]
- Chang, Y.S.; Munro, C.J.; Fortunato, L.; AlAli, A.; Marciulescu, C.; Harvey, S.L.; Vrouwenvelder, J.; Arafat, H.; Dumée, L.F. Macrofouling remediation strategies for water intakes of desalination and other industrial plants—A review. Desalination 2024, 590, 117987. [Google Scholar] [CrossRef]
- Allonier, A.S.; Khalanski, M.; Camel, V.; Bermond, A. Characterization of Chlorination By-products in Cooling Effluents of Coastal Nuclear Power Stations. Mar. Pollut. Bull. 1999, 38, 1232–1241. [Google Scholar] [CrossRef]
- Bartholomew, R.; Powell, S.T.; Bartholomew, R.D. Bromine-Based Biocides for Cooling Water Systems: A Literature Review. Combustion 1998, 2, 1–30. [Google Scholar]
- Shukla, S.K.; Rao, T.S.; M, N.; Mohan, T.V.K. Active-bromide and surfactant synergy for enhanced microfouling control. Arch. Microbiol. 2024, 206, 430. [Google Scholar] [CrossRef]
- Papale, M.; Fazi, S.; Severini, M.; Scarinci, R.; Dell’Acqua, O.; Azzaro, M.; Venuti, V.; Fazio, B.; Fazio, E.; Crupi, V.; et al. Structural properties and microbial diversity of the biofilm colonizing plastic substrates in Terra Nova Bay (Antarctica). Sci. Total. Environ. 2024, 943, 173773. [Google Scholar] [CrossRef]
- Cai, H.; Wang, Y.; Wu, K.; Guo, W. Enhanced hydrophilic and electrophilic properties of polyvinyl chloride (PVC) biofilm carrier. Polymers 2020, 12, 1240. [Google Scholar] [CrossRef] [PubMed]
- Almousa, R.; Wen, X.; Na, S.; Anderson, G.; Xie, D. Hydrophilic polymer-coated PVC surface for reduced cell and bacterial adhesions. Biosurface Biotribology 2022, 8, 34–43. [Google Scholar] [CrossRef]
- Roberts, D.J.; Nica, D.; Zuo, G.; Davis, J.L. Quantifying microbially induced deterioration of concrete: Initial studies. Int. Biodeterior. Biodegrad. 2002, 49, 227–234. [Google Scholar] [CrossRef]
- Huang, S.; Voutchkov, N.; Jiang, S. Balancing carbon, nitrogen and phosphorus concentration in seawater as a strategy to prevent accelerated membrane biofouling. Water Res. 2019, 165, 114978. [Google Scholar] [CrossRef]
- Bott, T.R. Biofouling control in cooling water. Int. J. Chem. Eng. 2009, 2009, 619873. [Google Scholar] [CrossRef]
- Fujioka, T.; Ngo, M.T.T.; Boivin, S.; Kawahara, K.; Takada, A.; Nakamura, Y.; Yoshikawa, H. Controlling biofouling and disinfection by-product formation during reverse osmosis treatment for seawater desalination. Desalination 2020, 488, 114507. [Google Scholar] [CrossRef]
- Burton, D.T.; Margrey, S.L. Control of Fouling Organisms in Estuarine Cooling Water Systems by Chlorine and Bromine Chloride. Environ. Sci. Technol. 1979, 13, 684–689. [Google Scholar] [CrossRef]
- Rajagopal, S. Chlorination and biofouling control in industrial cooling water systems. In Operational and Environmental Consequences of Large Industrial Cooling Water Systems; Springer: Greer, SC, USA, 2012; pp. 163–182. [Google Scholar] [CrossRef]
- Venkatesan, R.; Murthy, P.S. Macrofouling Control in Power Plants. In Marine and Industrial Biofouling; Flemming, H.C., Murthy, P.S., Venkatesan, R., Cooksey, K., Eds.; Springer: Berlin/Heidelberg, Germany, 2008. [Google Scholar] [CrossRef]


Disclaimer/Publisher’s Note: The statements, opinions and data contained in all publications are solely those of the individual author(s) and contributor(s) and not of MDPI and/or the editor(s). MDPI and/or the editor(s) disclaim responsibility for any injury to people or property resulting from any ideas, methods, instructions or products referred to in the content. |
© 2025 by the authors. Licensee MDPI, Basel, Switzerland. This article is an open access article distributed under the terms and conditions of the Creative Commons Attribution (CC BY) license (https://creativecommons.org/licenses/by/4.0/).