
Understanding the Determinants of Electric Vehicle Range: A Multi-Dimensional Survey

 , and
, and
Abstract
1. Introduction
2. Technical Factors
2.1. Battery Capacity
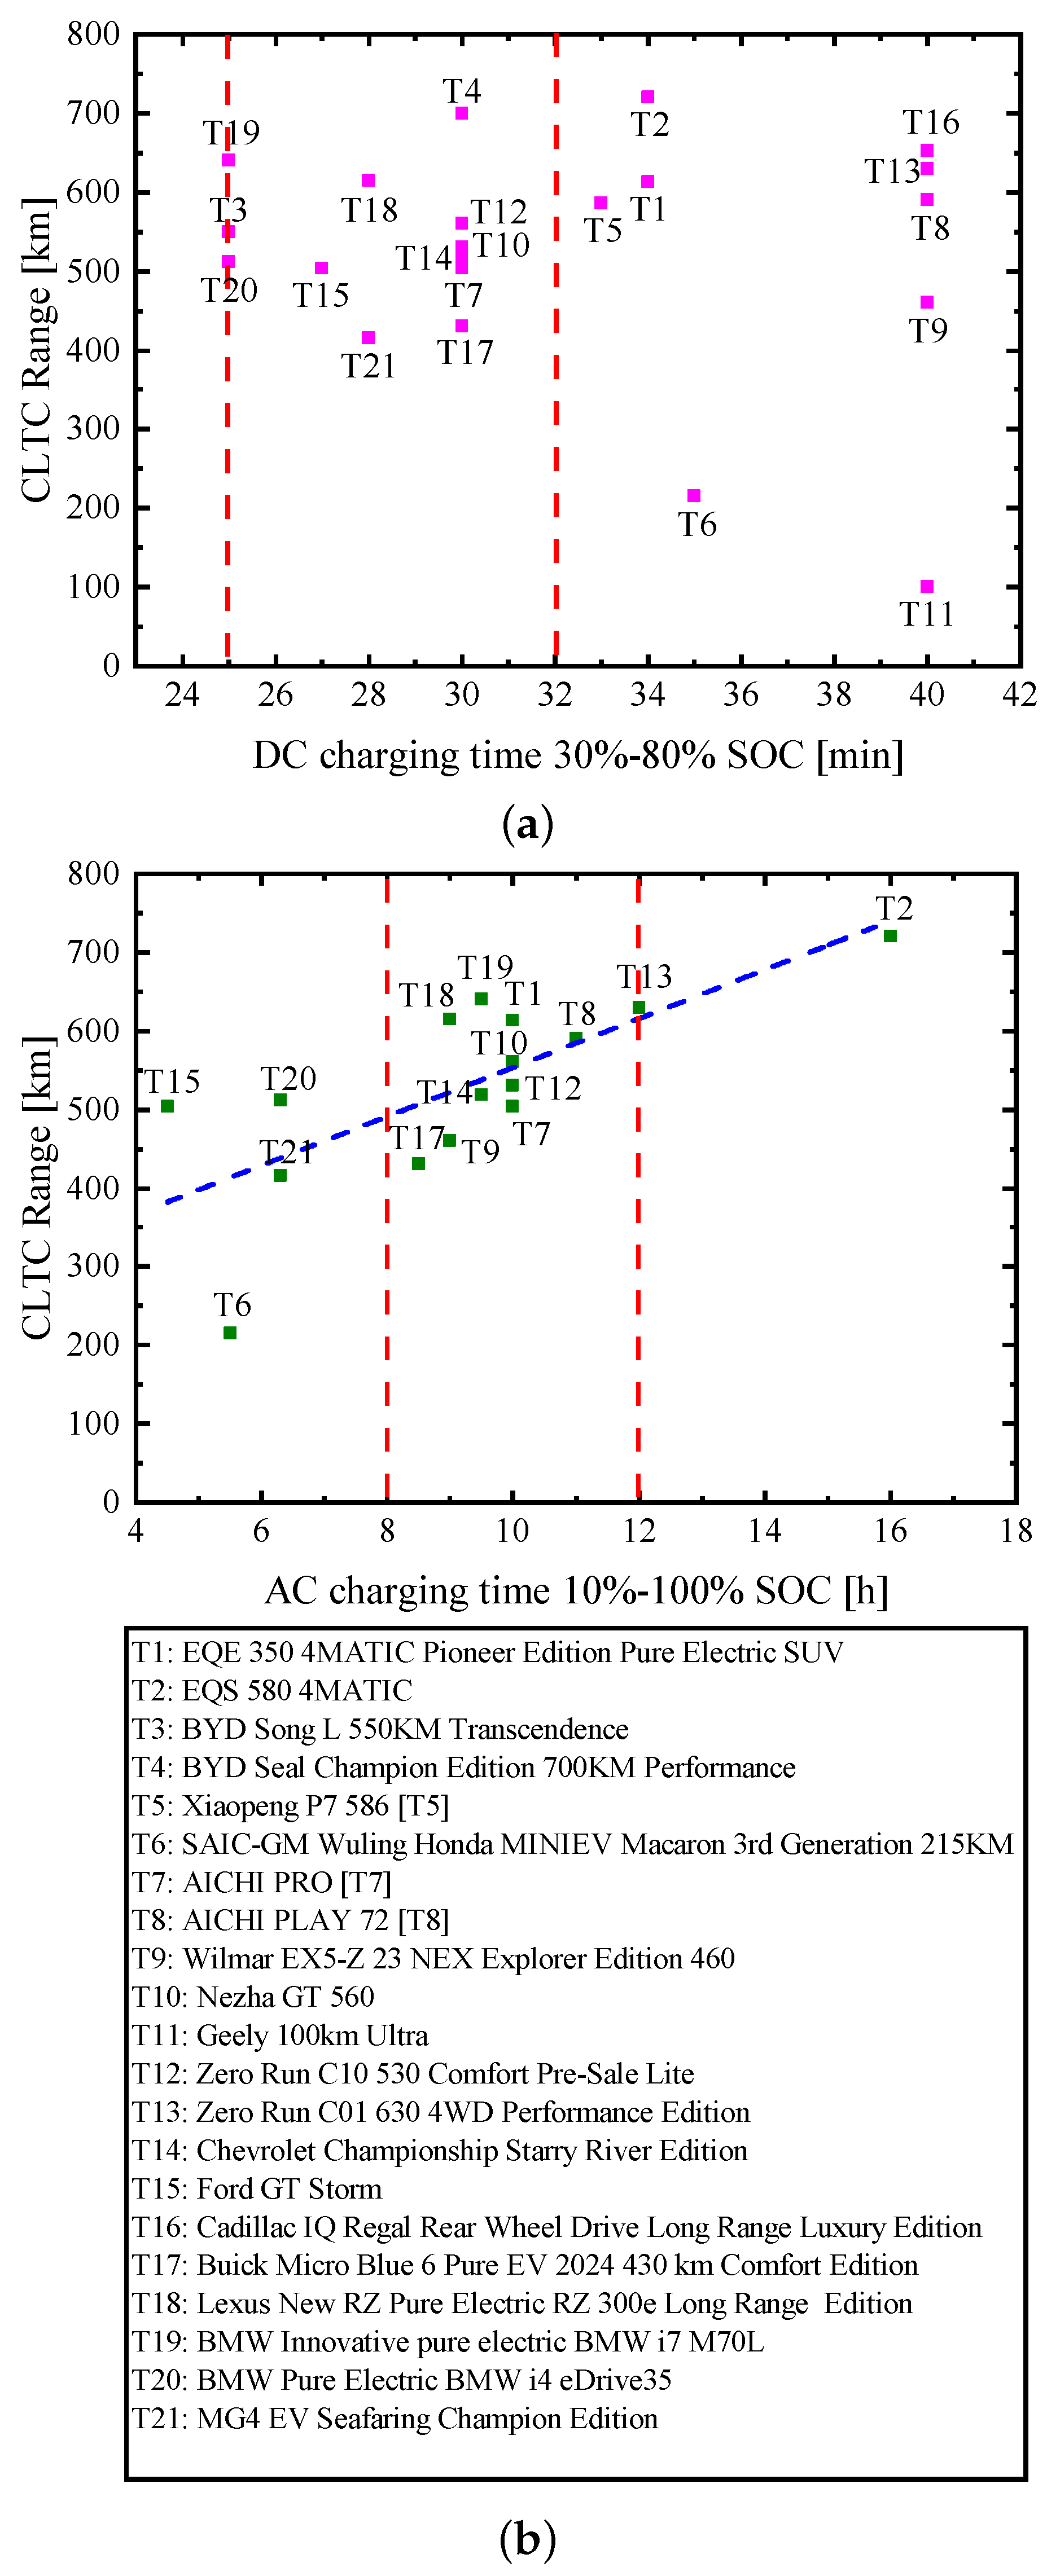
2.2. Charging Time
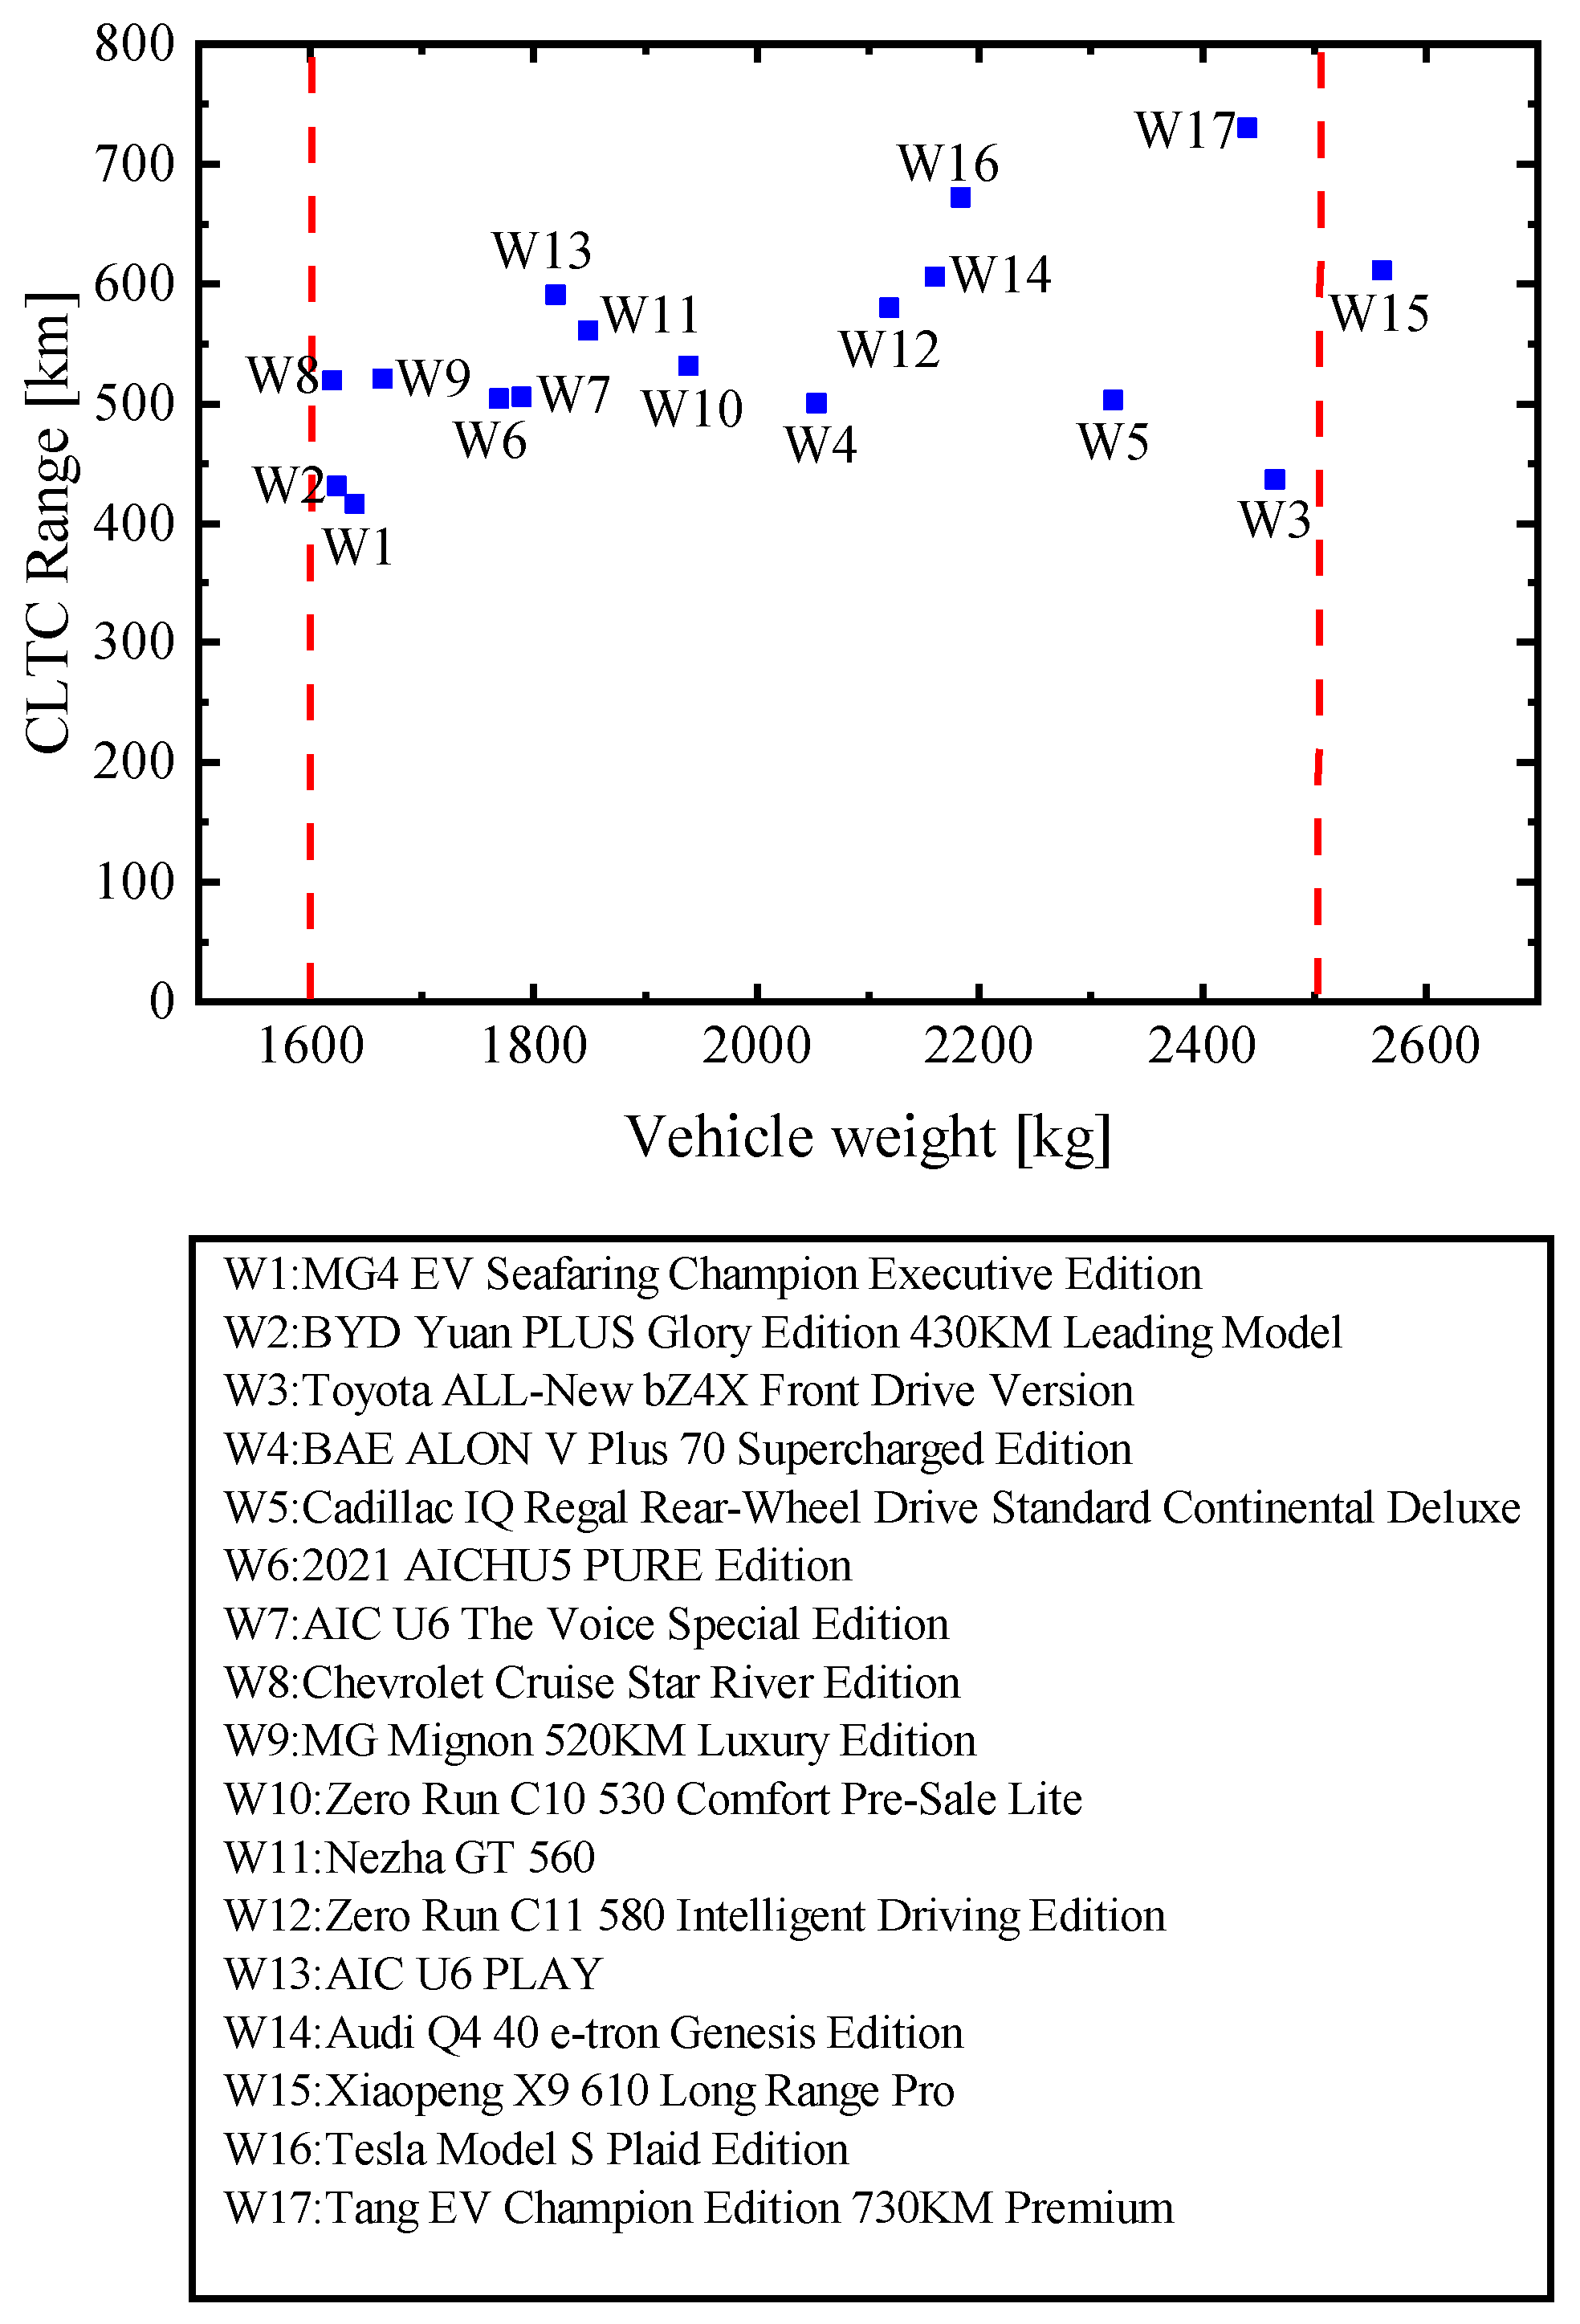
2.3. EV Weight
3. Environmental Factors
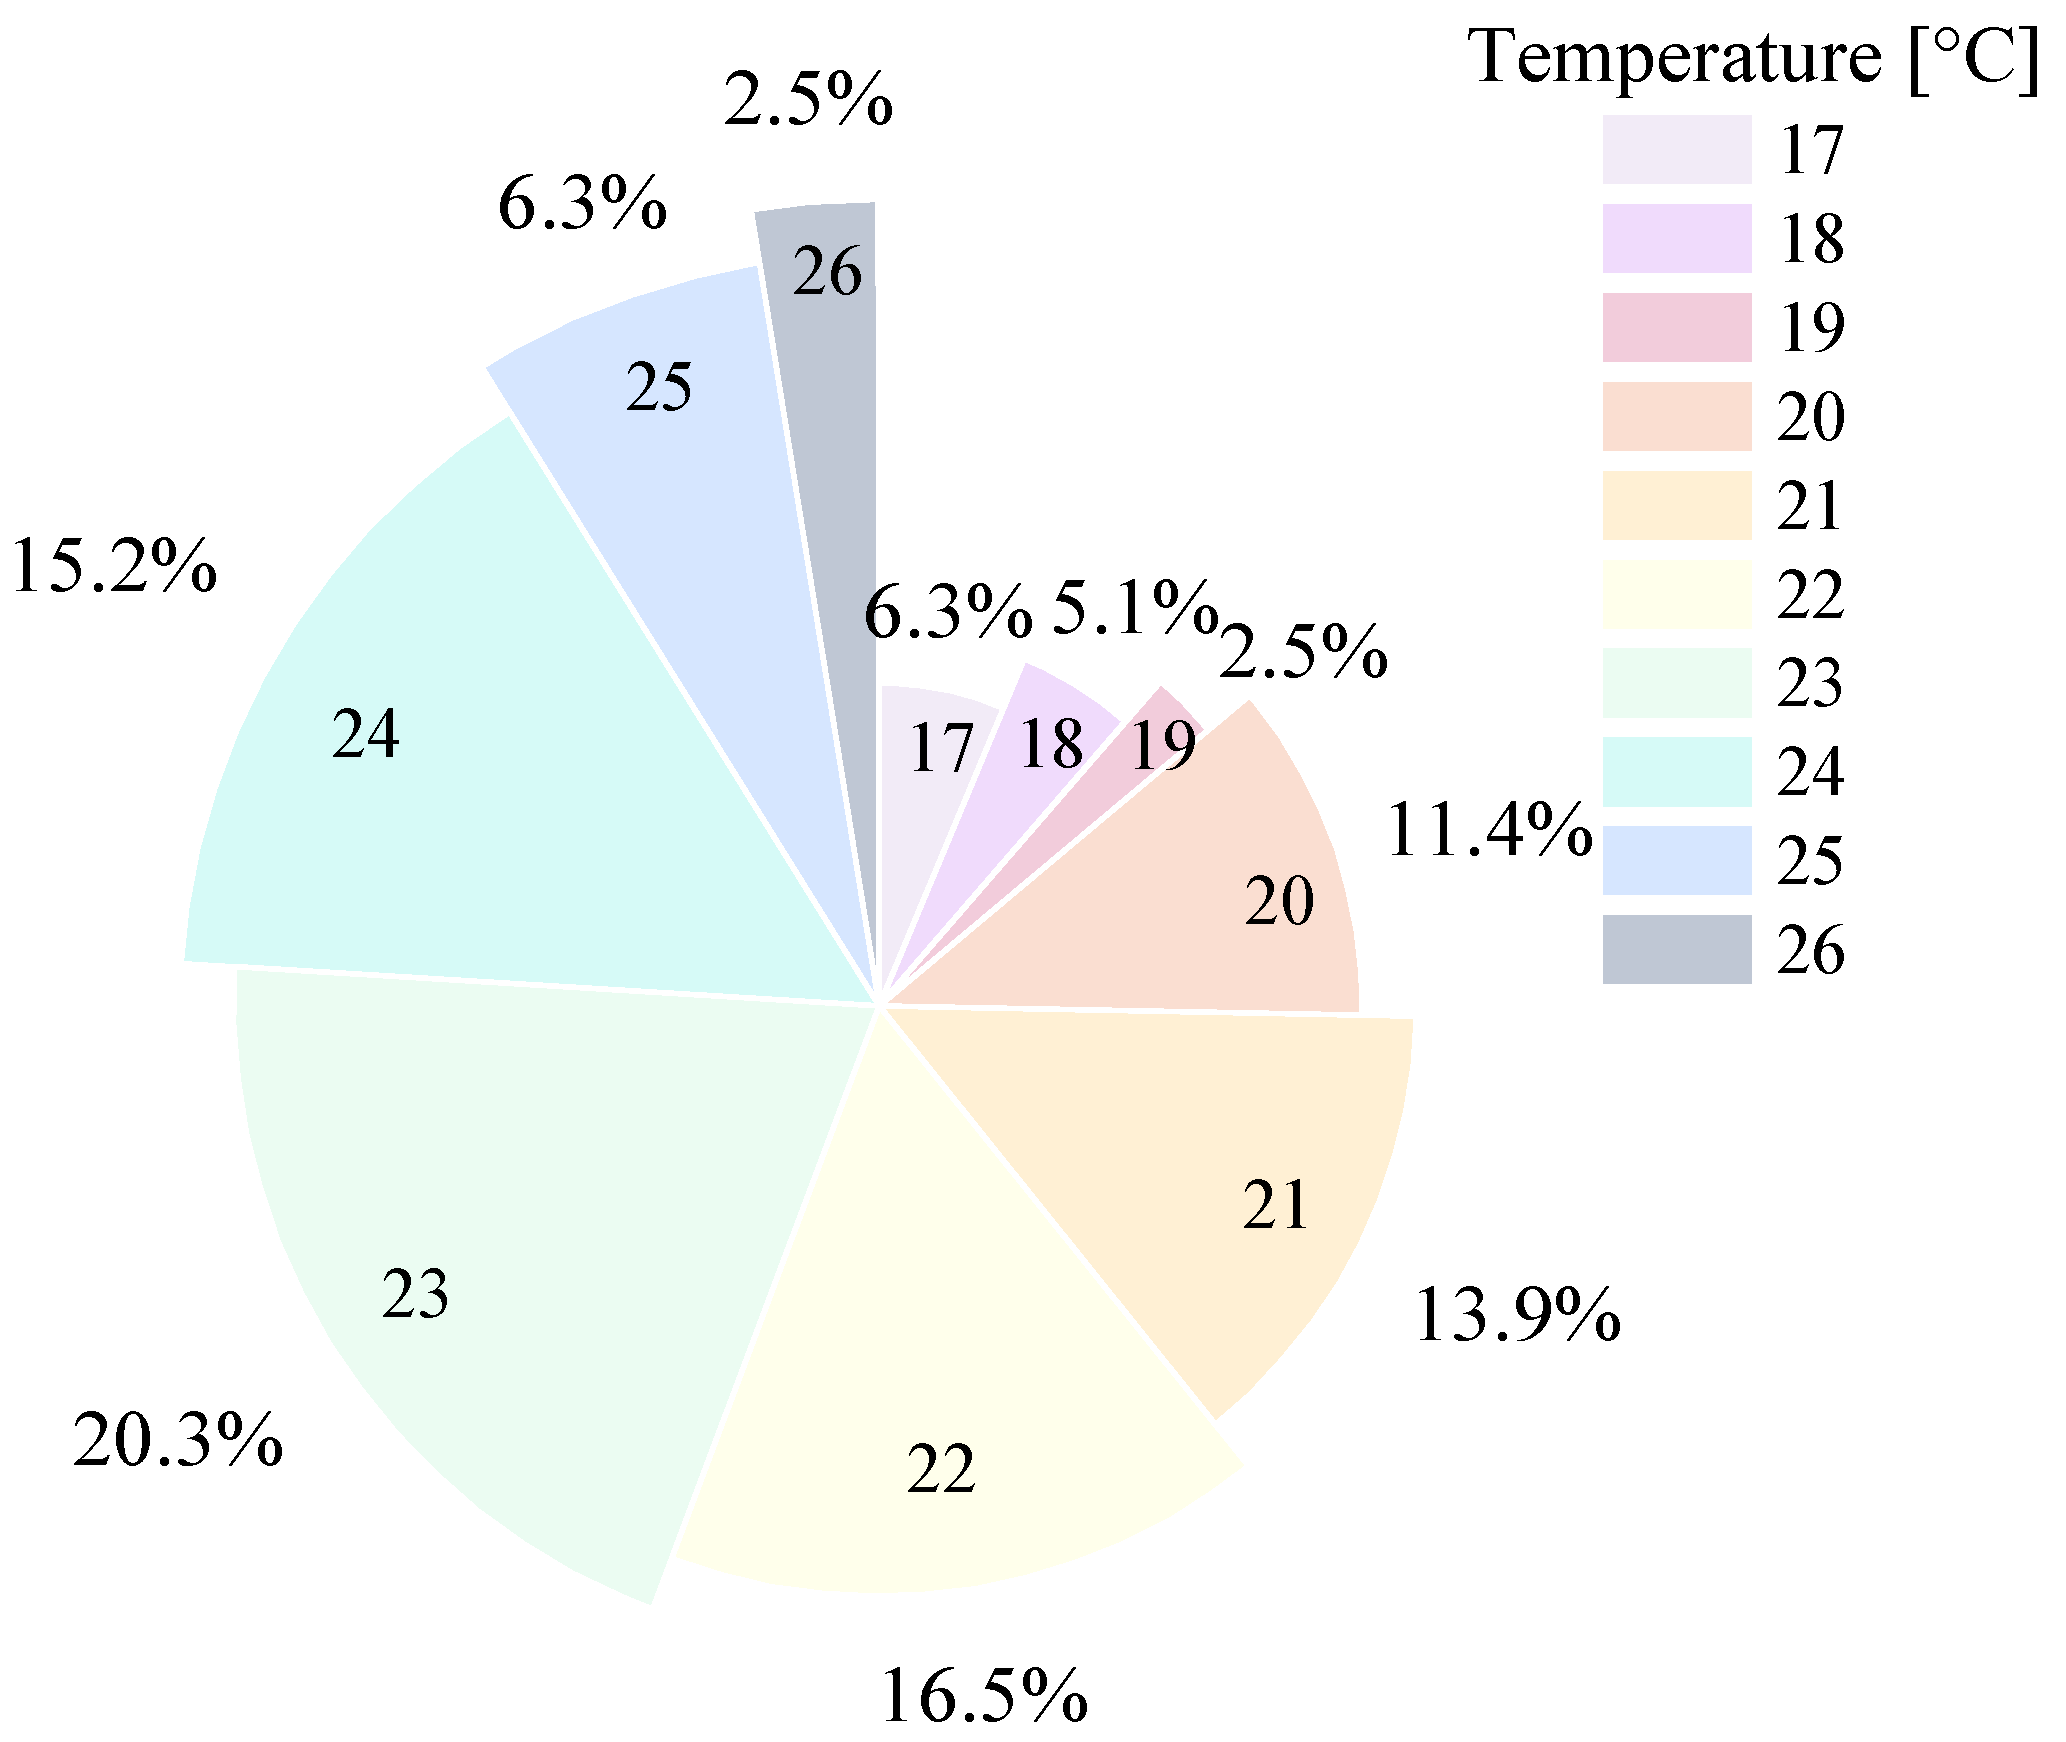
3.1. Temperature
3.2. Terrain
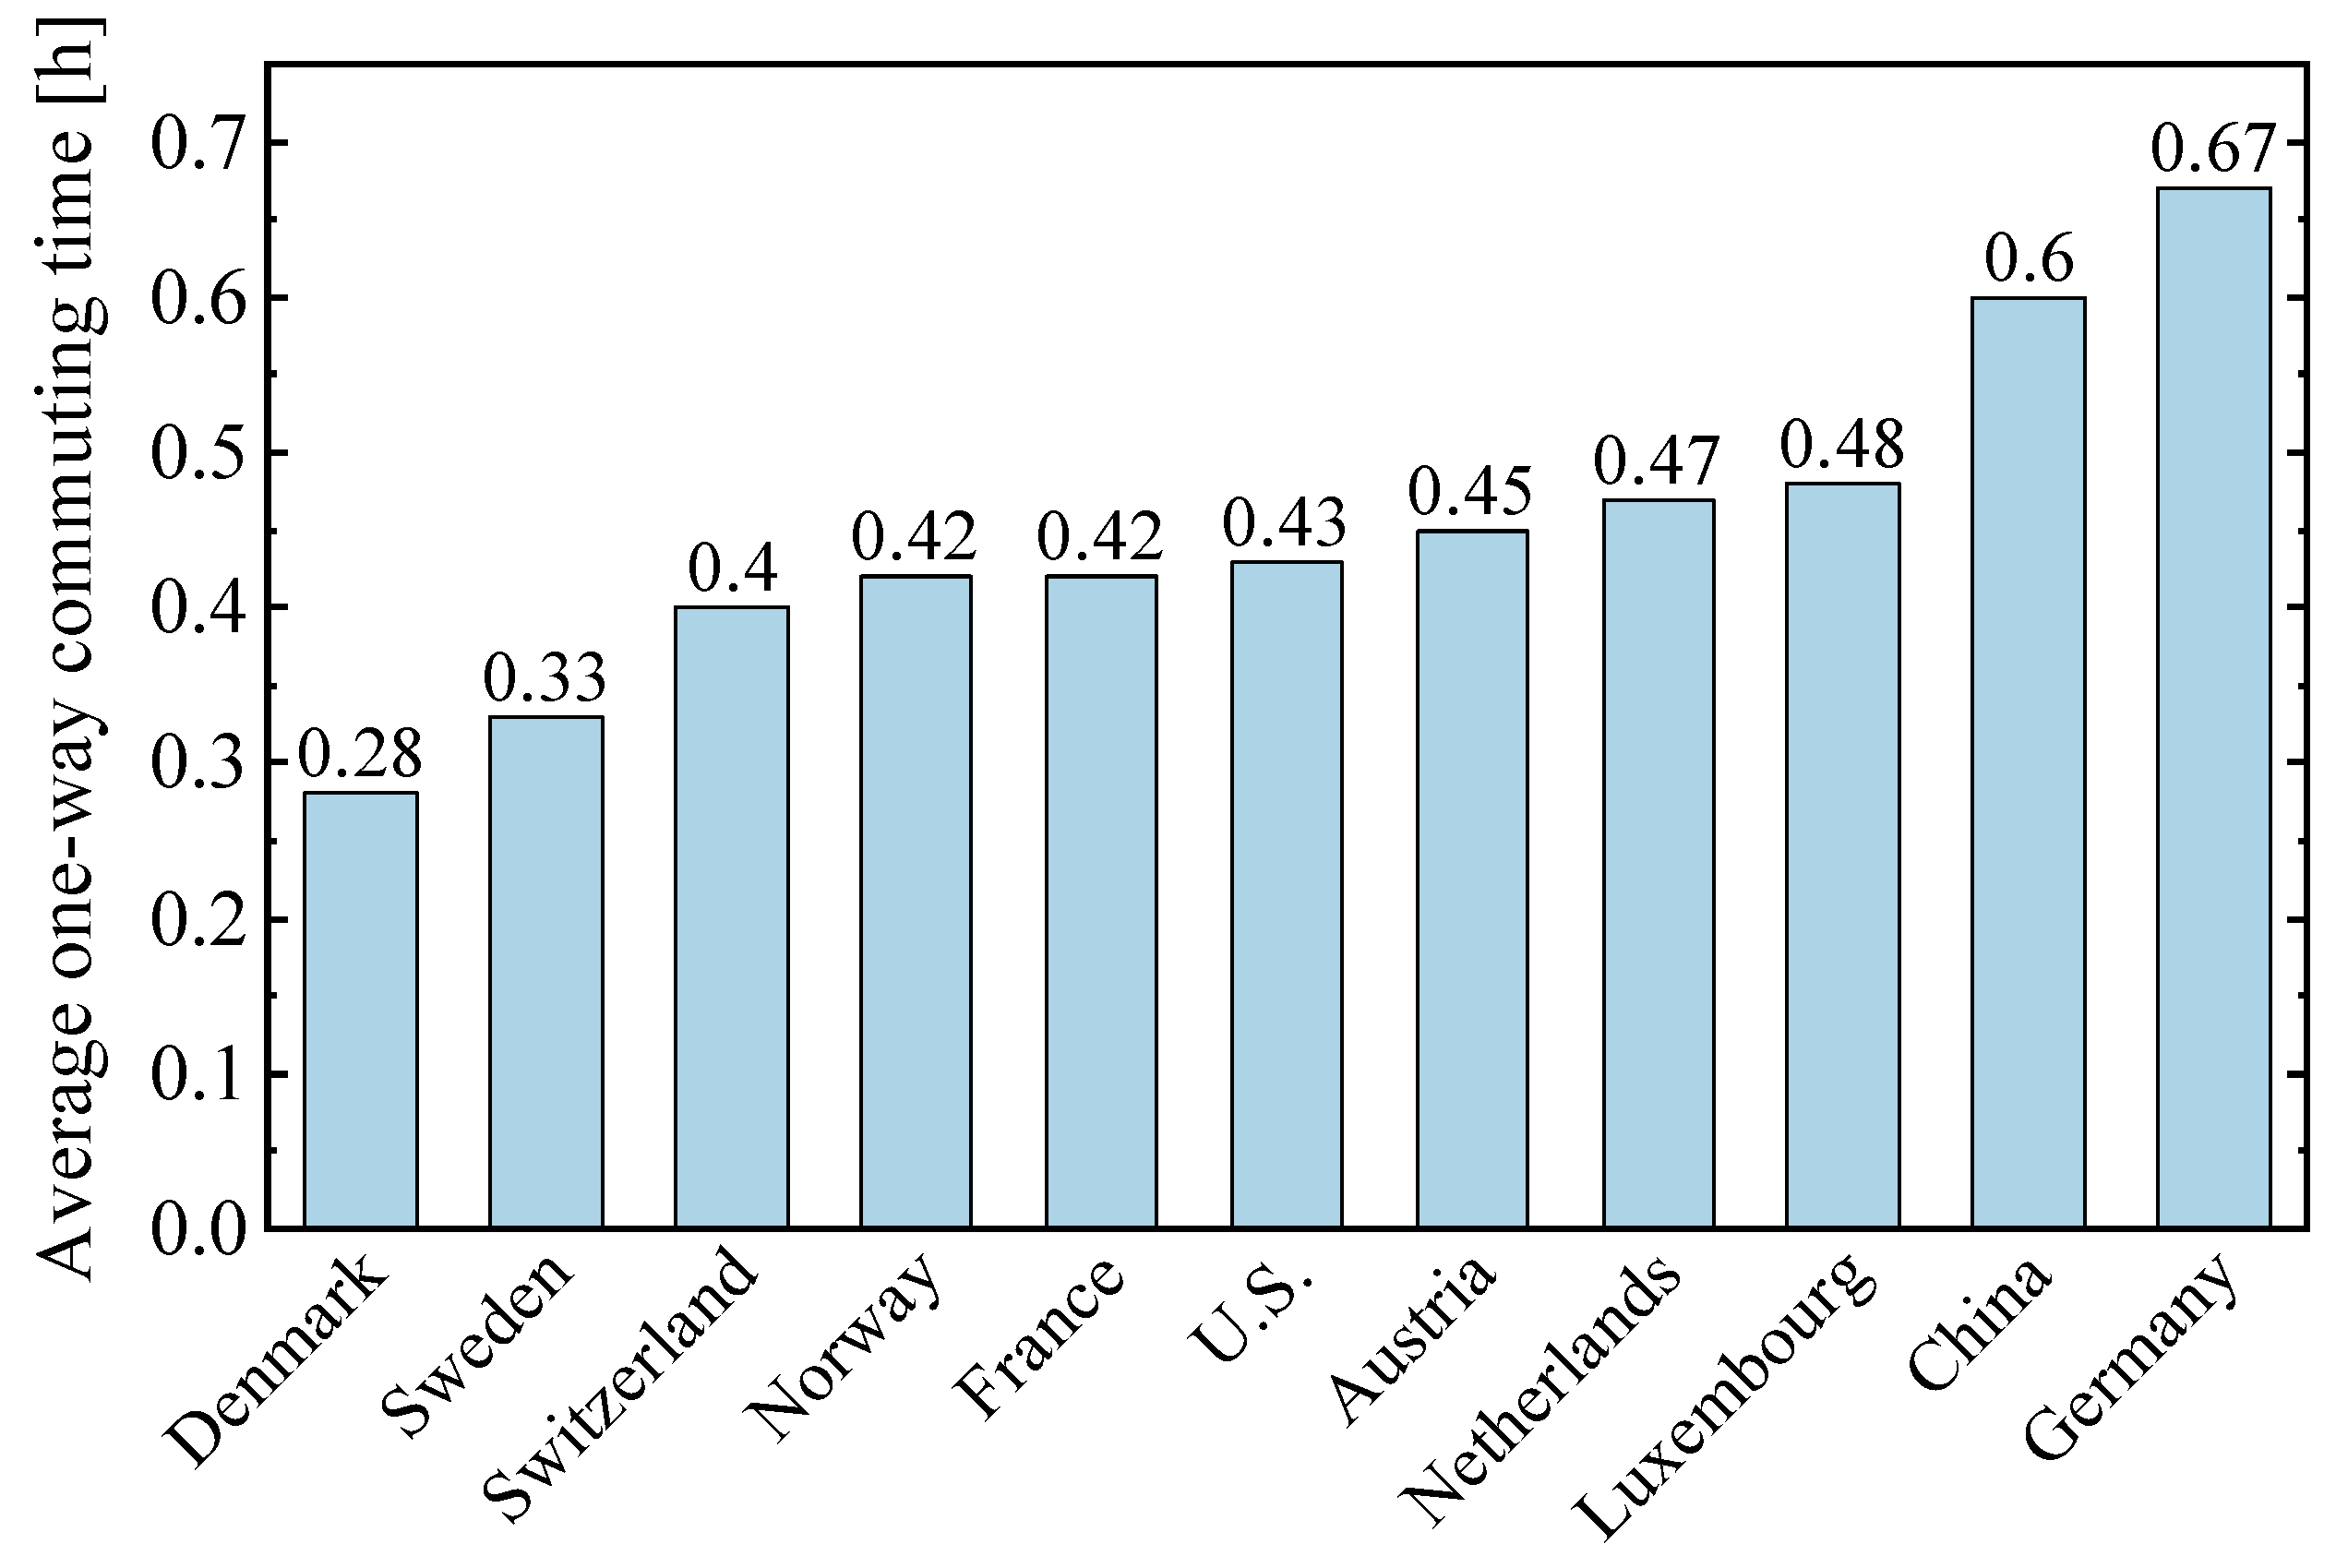
4. User-Related Factors
5. Economic Factors
5.1. Battery Cost
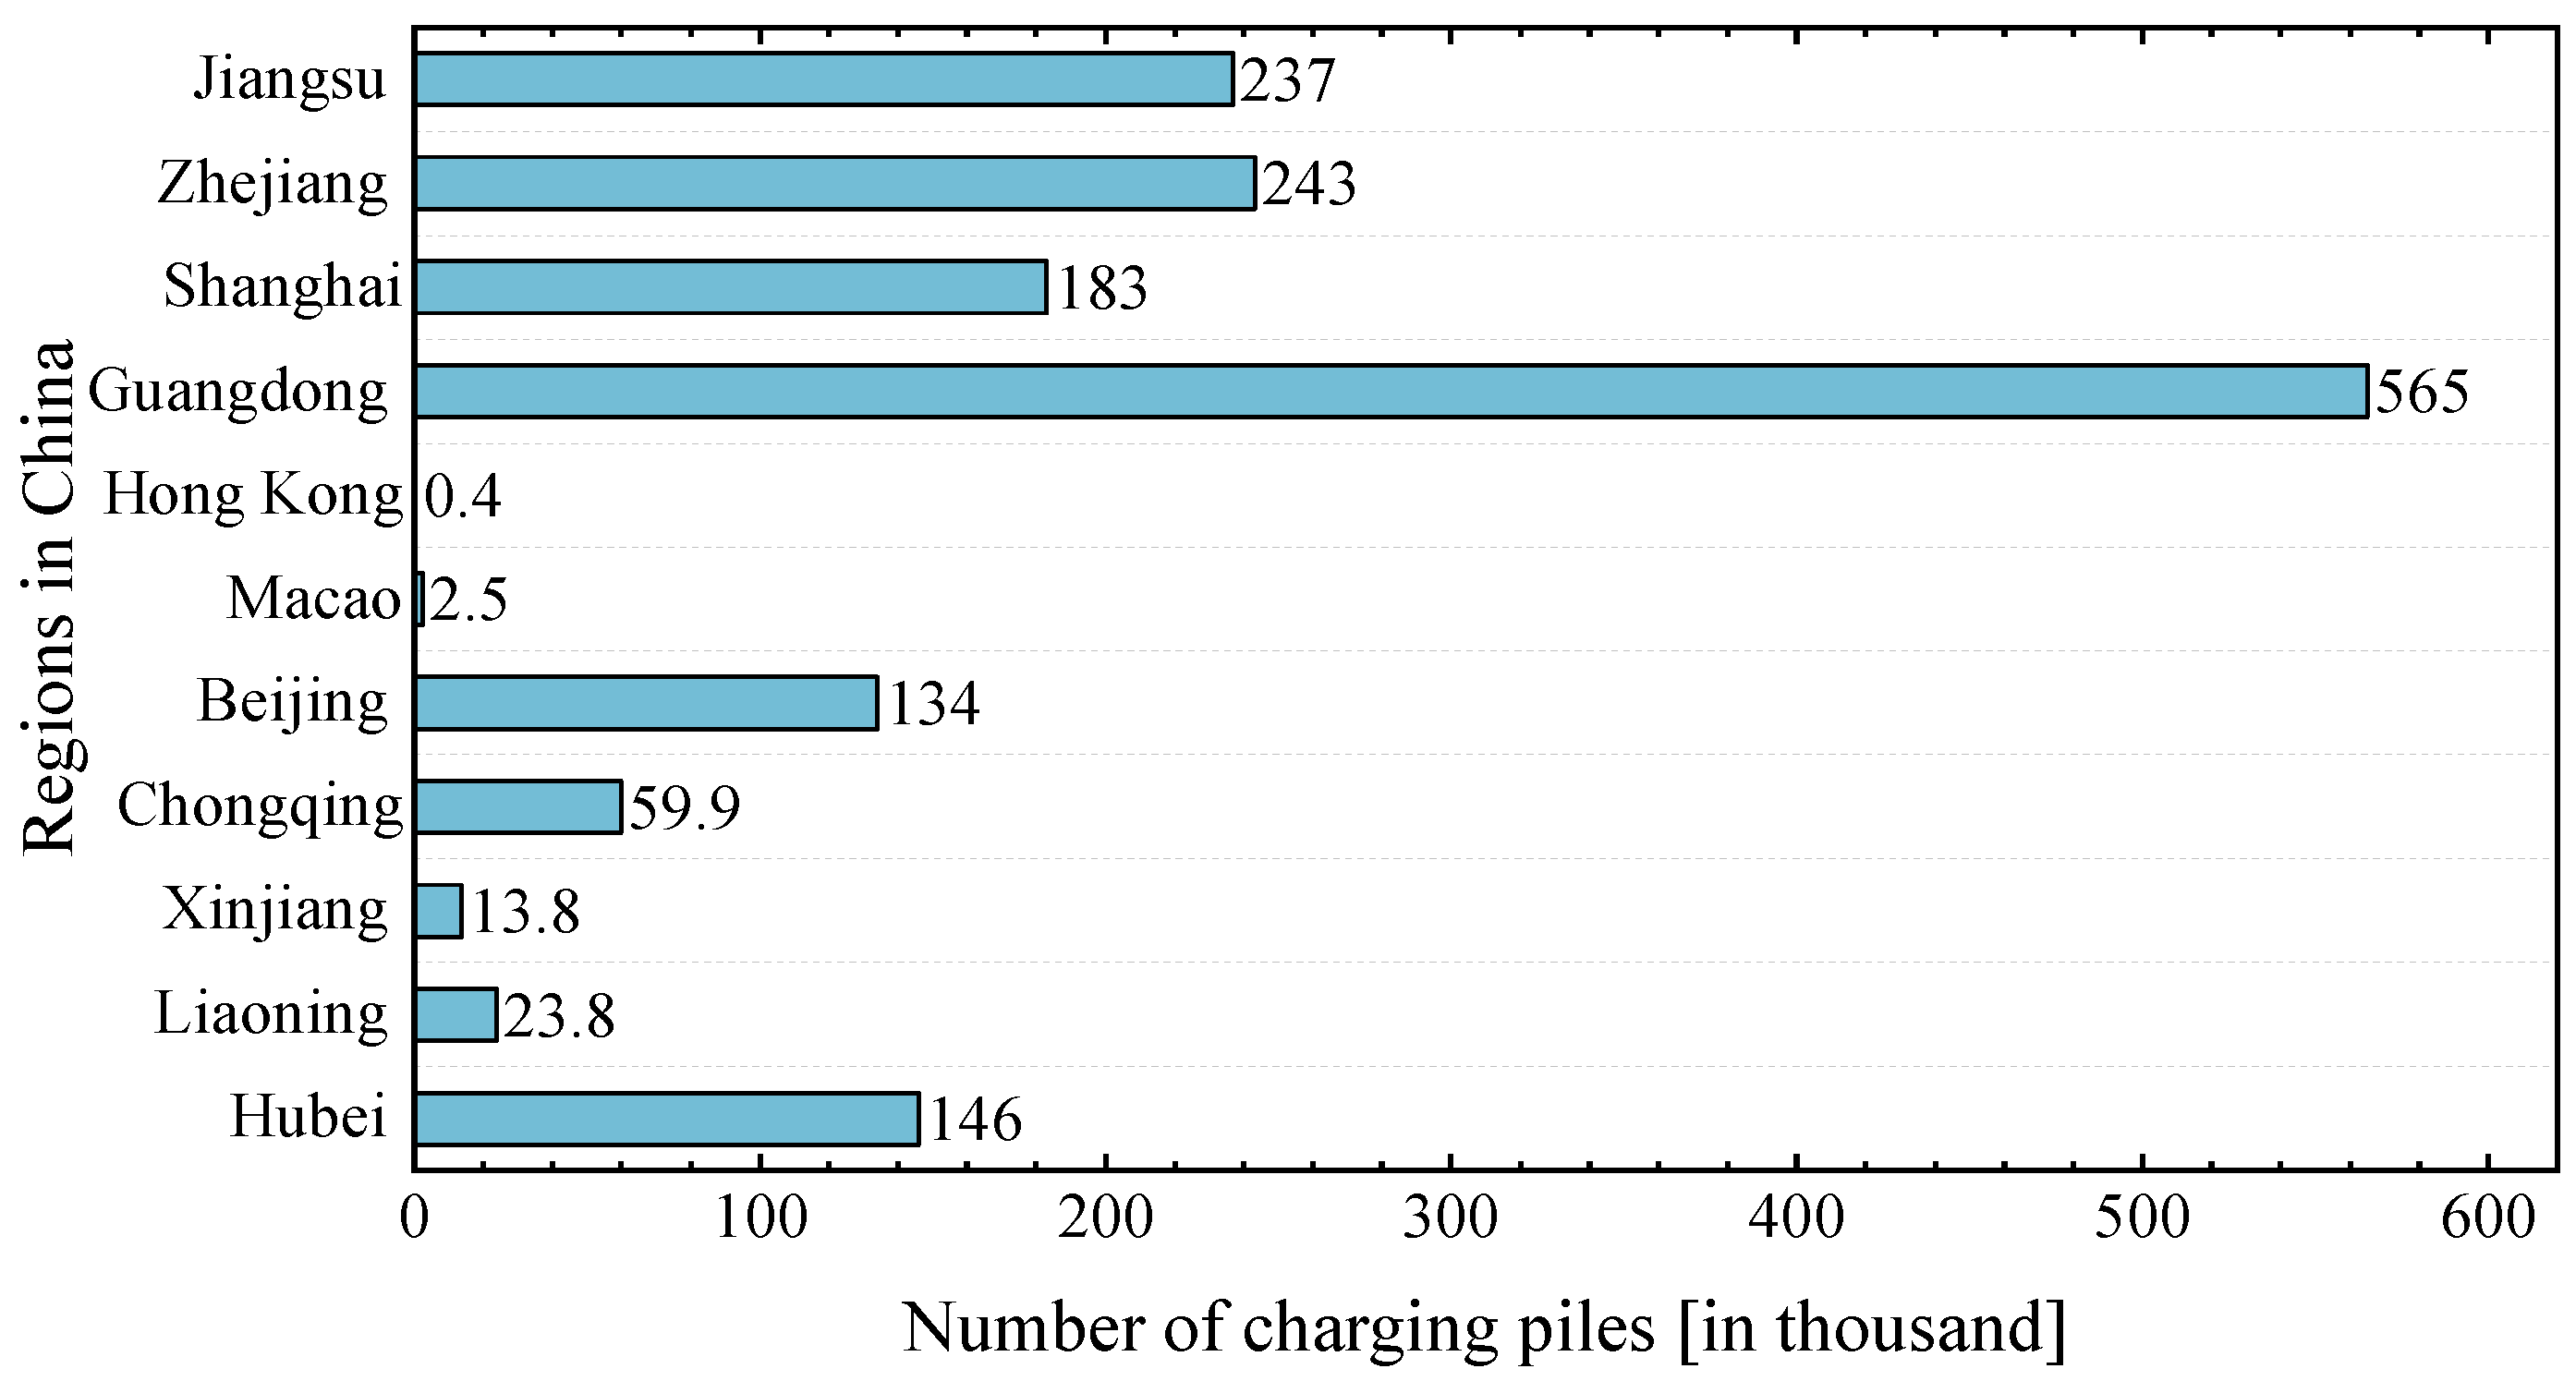
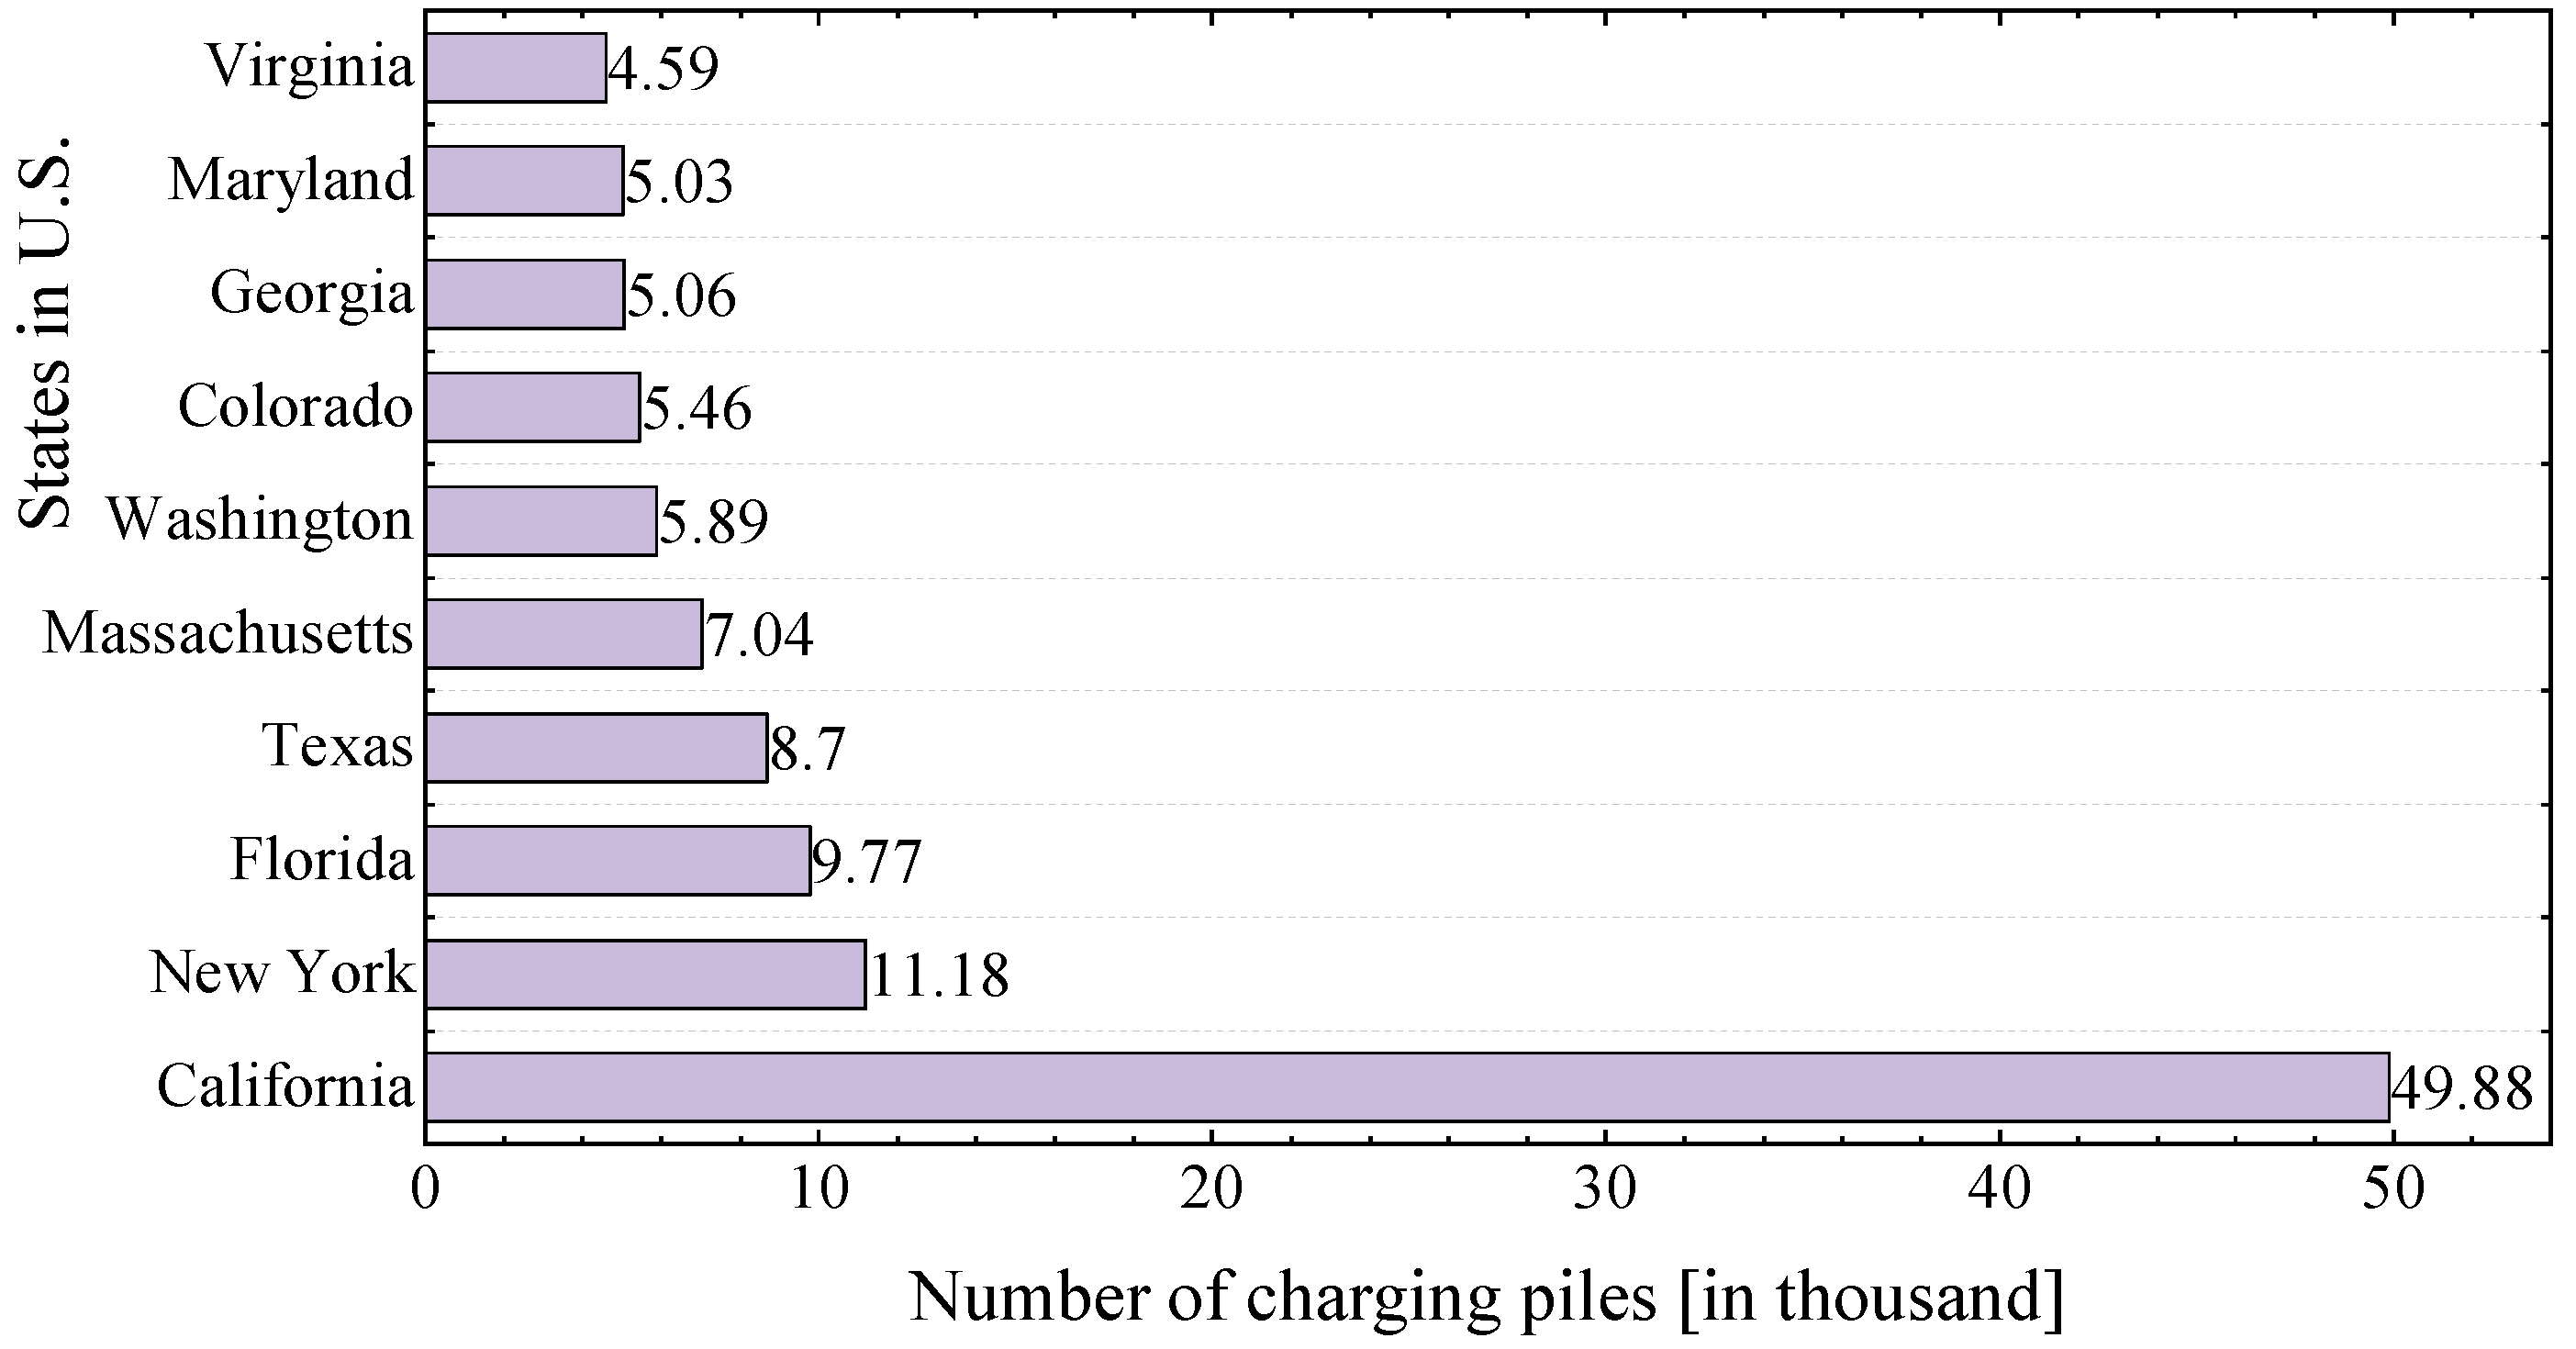
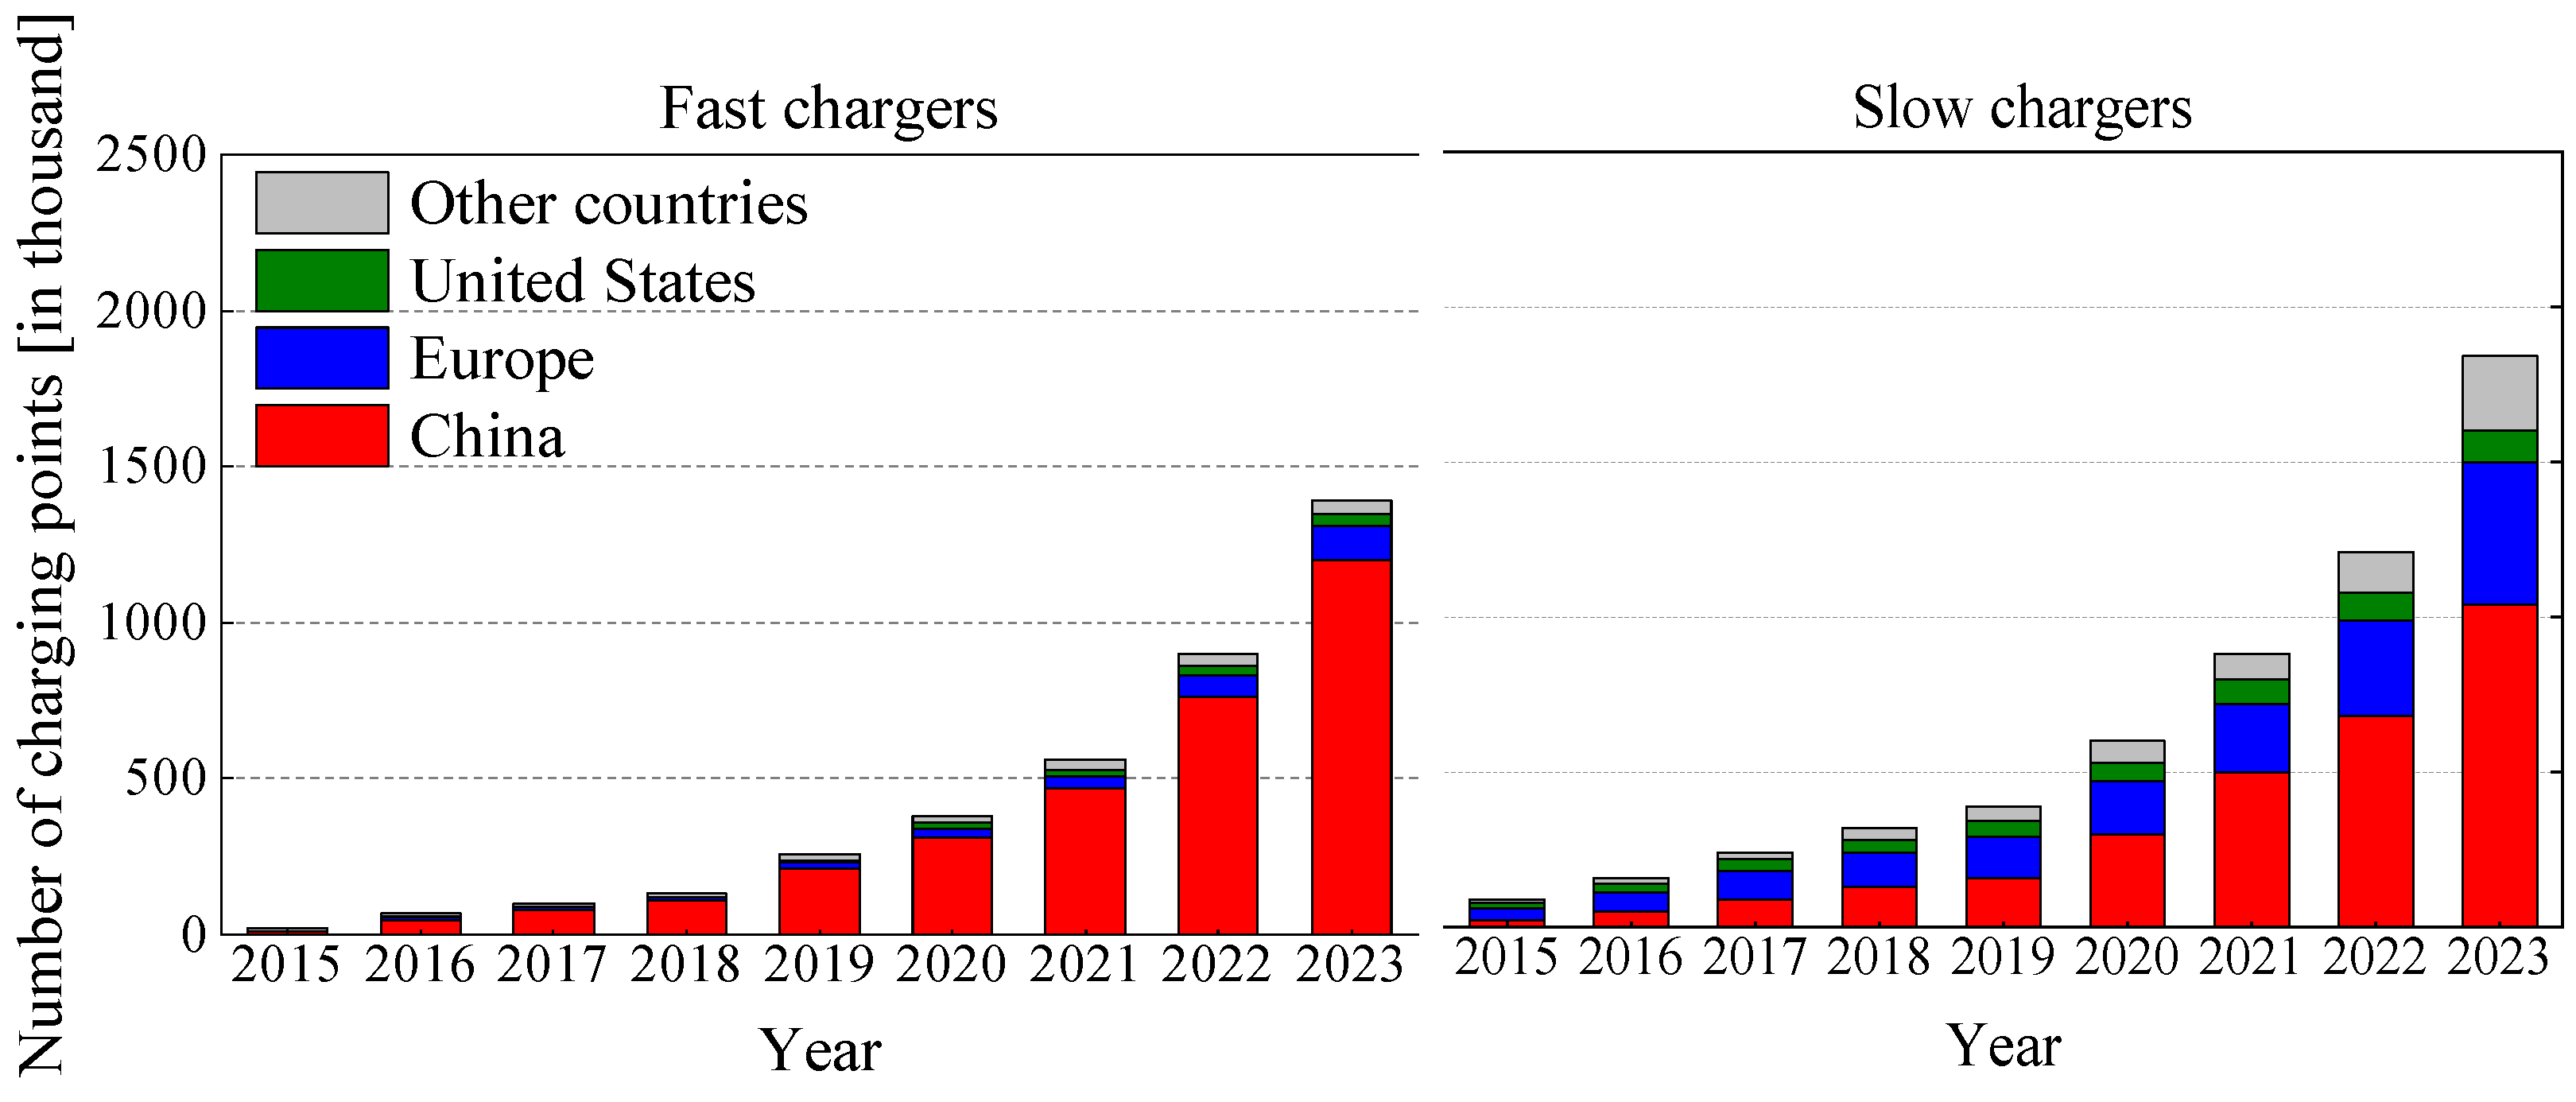
5.2. Availability of Charging Infrastructure
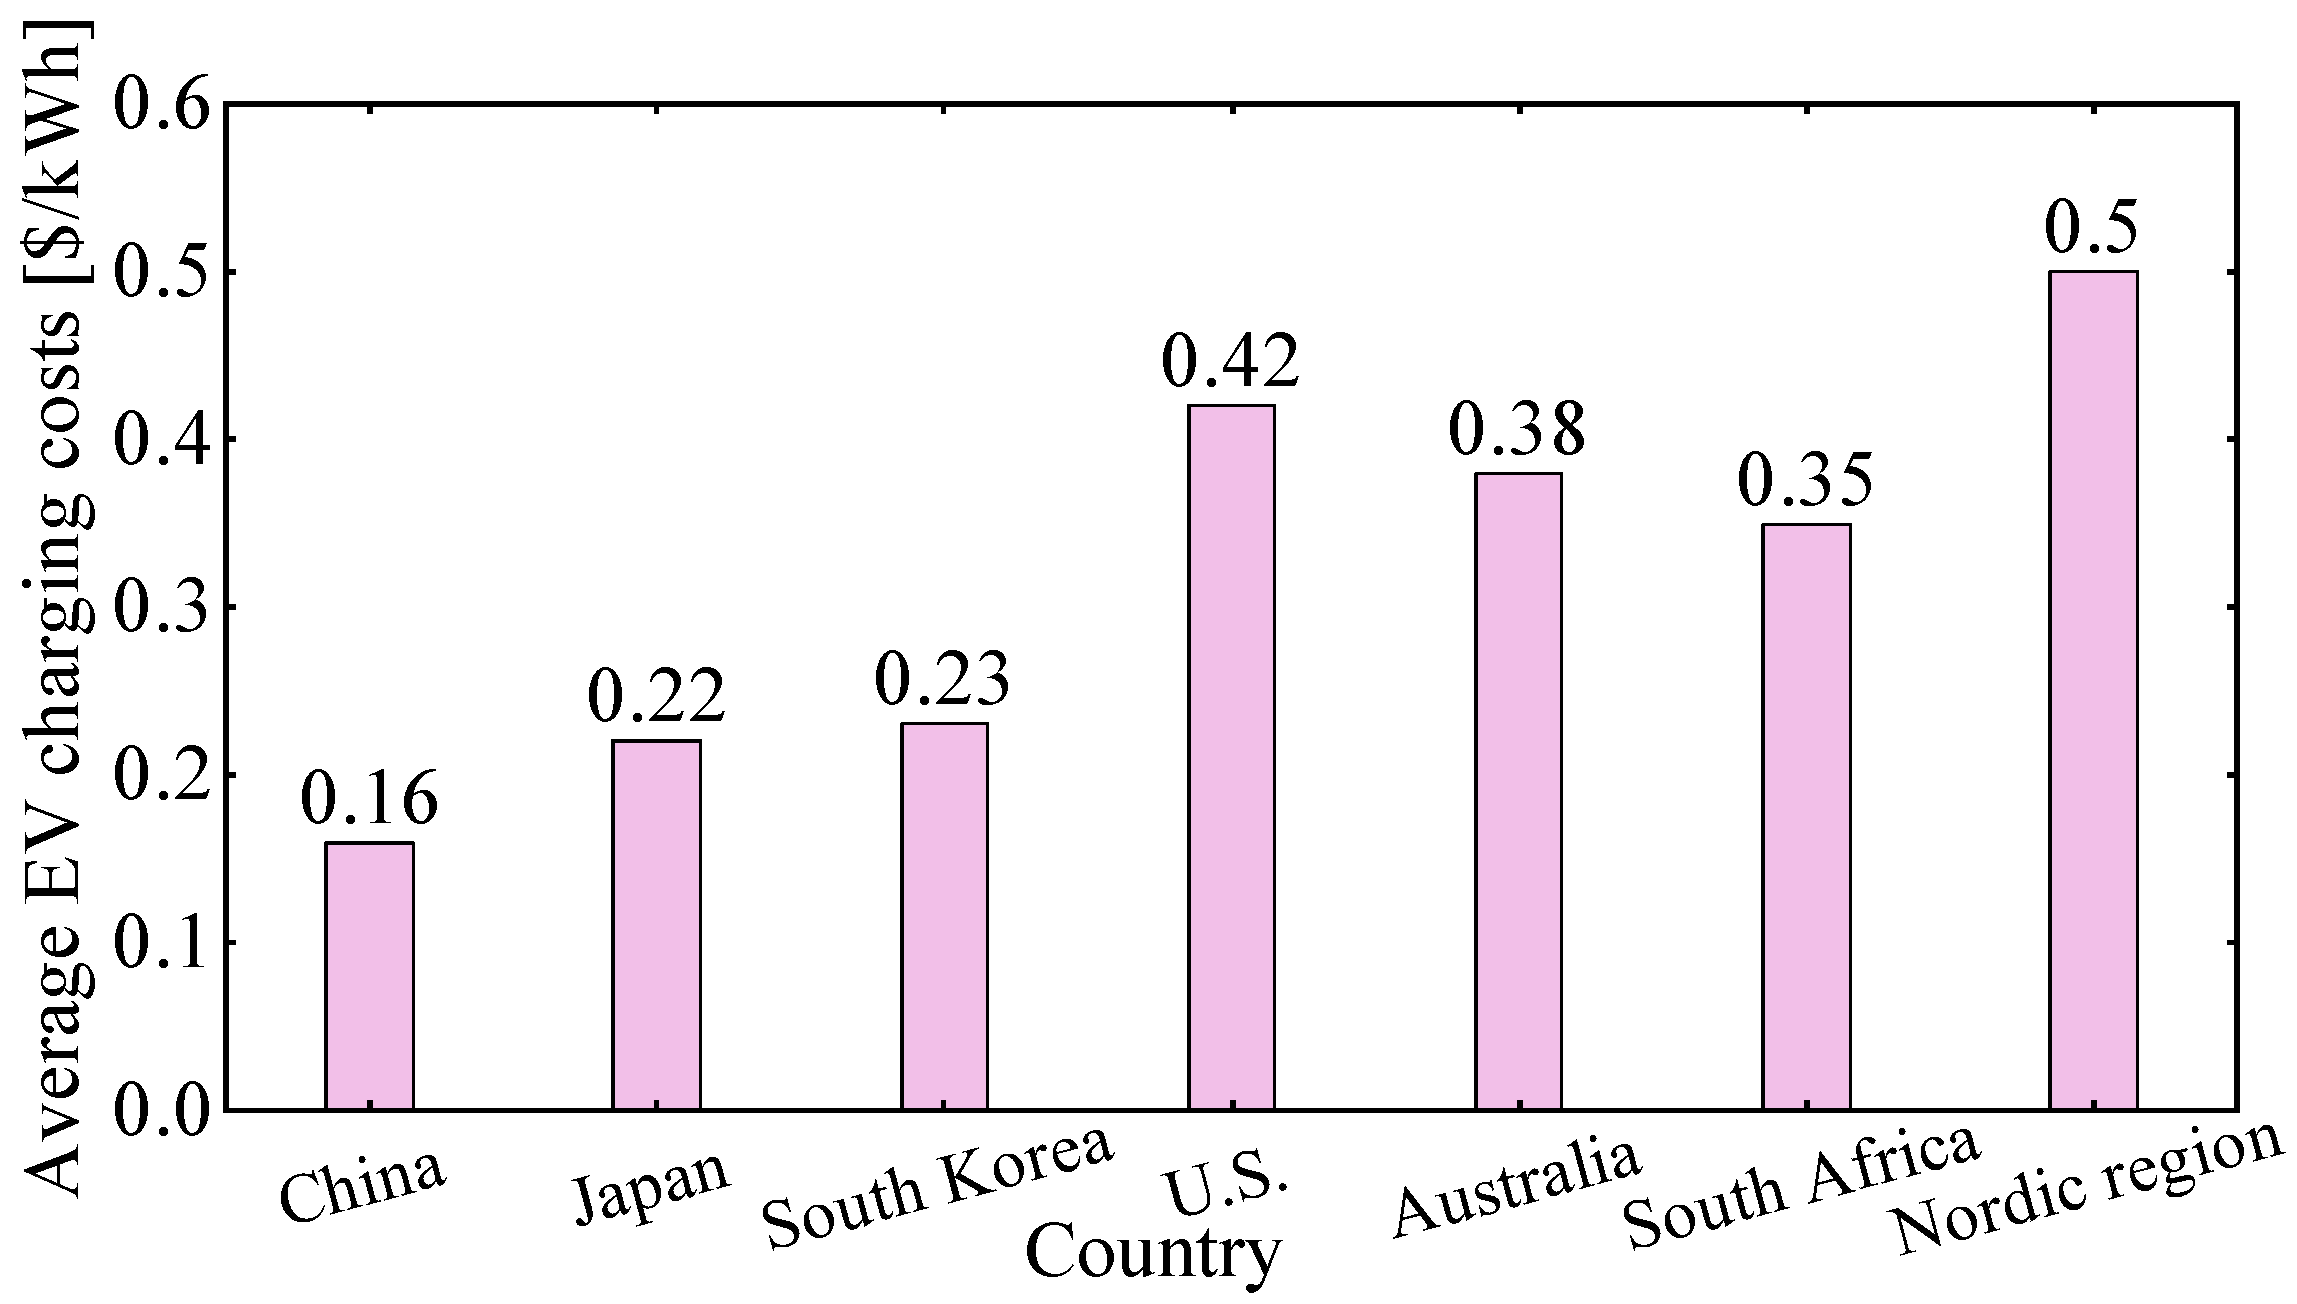
5.3. Electricity Prices
6. Policy Factors
6.1. Government Incentives
6.2. Infrastructure Investment
7. Cultural Factors
7.1. Social Values
7.2. Environmental Sustainability
8. Summary and Future Perspectives
8.1. Technical Factors
8.2. Environmental Factors
8.3. User-Related Factors
8.4. Economic Factors
8.5. Policy Factors
8.6. Cultural Factors
9. Conclusions
Author Contributions
Funding
Institutional Review Board Statement
Informed Consent Statement
Data Availability Statement
Conflicts of Interest
References
- Aminzadegan, S.; Shahriari, M.; Mehranfar, F.; Abramović, B. Factors affecting the emission of pollutants in different types of transportation: A literature review. Energy Rep. 2022, 8, 2508–2529. [Google Scholar]
- Ritchie, H.; Rosado, P.; Roser, M. CO2 and Greenhouse Gas Emissions Our World Data 2023. Available online: https://ourworldindata.org/co2-and-greenhouse-gas-emissions (accessed on 12 August 2024).
- Kucukvar, M.; Onat, N.C.; Kutty, A.A.; Abdella, G.M.; Bulak, M.E.; Ansari, F.; Kumbaroglu, G. Environmental efficiency of electric vehicles in Europe under various electricity production mix scenarios. J. Clean. Prod. 2022, 335, 130291. [Google Scholar]
- IEA. Global EV Outlook 2022—Analysis—IEA. Available online: https://www.iea.org/reports/global-ev-outlook-2022. (accessed on 12 August 2024).
- Caulfield, B.; Furszyfer, D.; Stefaniec, A.; Foley, A. Measuring the equity impacts of government subsidies for electric vehicles. Energy 2022, 248, 123588. [Google Scholar]
- García, A.; Monsalve-Serrano, J.; Martinez-Boggio, S.; Golke, D. Energy assessment of the ageing phenomenon in Li-Ion batteries and its impact on the vehicle range efficiency. Energy Convers. Manag. 2023, 276, 116530. [Google Scholar]
- CATL. Cutting-Edge Technology. Available online: https://www.catl.com/research/technology/ (accessed on 16 April 2025).
- Lee, J.; Choe, H.; Yoon, H.Y. Past trends and future directions for circular economy in electric vehicle waste battery reuse and recycling: A bibliometric analysis. Sustain. Energy Technol. Assess. 2025, 75, 104198. [Google Scholar]
- Zeng, X.; Xie, C.; Xu, M.; Chen, Z. Optimal en-route charging station locations for electric vehicles with heterogeneous range anxiety. Transp. Res. Part Emerg. Technol. 2024, 158, 104459. [Google Scholar]
- Federal Highway Administration. National Electric Vehicle Infrastructure Standards and Requirements. Available online: https://www.federalregister.gov/documents/2023/02/28/2023-03500/national-electric-vehicle-infrastructure-standards-and-requirements (accessed on 16 April 2025).
- Hemavathi, S.; Shinisha, A. A study on trends and developments in electric vehicle charging technologies. J. Energy Storage 2022, 52, 105013. [Google Scholar]
- Al-Wreikat, Y.; Serrano, C.; Sodré, J.R. Effects of ambient temperature and trip characteristics on the energy consumption of an electric vehicle. Energy 2022, 238, 122028. [Google Scholar]
- Secinaro, S.; Calandra, D.; Lanzalonga, F.; Ferraris, A. Electric vehicles’ consumer behaviours: Mapping the field and providing a research agenda. J. Bus. Res. 2022, 150, 399–416. [Google Scholar]
- Mekky, M.F.; Collins, A.R. The Impact of state policies on electric vehicle adoption-A panel data analysis. Renew. Sustain. Energy Rev. 2024, 191, 114014. [Google Scholar]
- Ju, N.; Kim, S.H. Electric vehicle resistance from Korean and American millennials: Environmental concerns and perception. Transp. Res. Part Transp. Environ. 2022, 109, 103387. [Google Scholar] [CrossRef]
- Xiao, Y.; Mao, Y.; Li, T.; Hao, X.; Wang, W. Facile Synthesis of a SiO x-Graphite Composite toward Practically Accessible High-Energy-Density Lithium-Ion Battery Anodes. ACS Appl. Mater. Interfaces 2023, 15, 45938–45948. [Google Scholar] [CrossRef] [PubMed]
- Jeon, S.U.; Park, J.W.; Kang, B.K.; Lee, H.J. Study on battery charging strategy of electric vehicles considering battery capacity. IEEE Access 2021, 9, 89757–89767. [Google Scholar] [CrossRef]
- Capasso, C.; Veneri, O. Experimental analysis on the performance of lithium based batteries for road full electric and hybrid vehicles. Appl. Energy 2014, 136, 921–930. [Google Scholar] [CrossRef]
- Alonso, E.; Lee, T.M.; Bjelkengren, C.; Roth, R.; Kirchain, R.E. Evaluating the potential for secondary mass savings in vehicle lightweighting. Environ. Sci. Technol. 2012, 46, 2893–2901. [Google Scholar] [CrossRef]
- Berjoza, D.; Jurgena, I. Effects of change in the weight of electric vehicles on their performance characteristics. Agron. Res. 2017, 15, 952–963. [Google Scholar]
- Nicoletti, L.; Romano, A.; König, A.; Köhler, P.; Heinrich, M.; Lienkamp, M. An estimation of the lightweight potential of battery electric vehicles. Energies 2021, 14, 4655. [Google Scholar] [CrossRef]
- Aiways. Official Website of Aiways. 2025. Available online: http://ai-ways.eu/ (accessed on 16 April 2025).
- Audi China. Official Website of Audi China. 2025. Available online: https://www.audi.cn/ (accessed on 16 April 2025).
- BYD Auto. Official Website of BYD Auto. 2025. Available online: https://www.byd.com/cn (accessed on 16 April 2025).
- Chevrolet China. Official Website of Chevrolet China. 2025. Available online: https://www.chevrolet.com.cn/ (accessed on 16 April 2025).
- Hozon Auto. Official Website of Hozon Auto (Nezha). 2025. Available online: https://www.hozonauto.com/ (accessed on 16 April 2025).
- Tesla China. Official Website of Tesla China. 2025. Available online: https://www.tesla.cn/ (accessed on 16 April 2025).
- Leapmotor. Official Website of Leapmotor. 2025. Available online: https://cn.leapmotor.com/home.html (accessed on 16 April 2025).
- Li Auto. Official Website of Li Auto. 2025. Available online: https://www.lixiang.com/en/#li (accessed on 16 April 2025).
- Toyota China. Official Website of Toyota China. 2025. Available online: https://www.toyota.com.cn/ (accessed on 16 April 2025).
- Donkers, A.; Yang, D.; Viktorović, M. Influence of driving style, infrastructure, weather and traffic on electric vehicle performance. Transp. Res. Part Transp. Environ. 2020, 88, 102569. [Google Scholar] [CrossRef]
- Neaimeh, M.; Hill, G.A.; Hübner, Y.; Blythe, P.T. Routing systems to extend the driving range of electric vehicles. IET Intell. Transp. Syst. 2013, 7, 327–336. [Google Scholar] [CrossRef]
- Li, W.; Stanula, P.; Egede, P.; Kara, S.; Herrmann, C. Determining the main factors influencing the energy consumption of electric vehicles in the usage phase. Procedia CIRP 2016, 48, 352–357. [Google Scholar] [CrossRef]
- Argue, C. To What Degree Does Temperature Impact EV Range? Available online: https://www.geotab.com/blog/ev-range/ (accessed on 17 September 2024).
- Unveiling The Truth: Electric Car Range City vs Highway—Which Comes out on Top? Available online: https://cookupexperts.com/electric-car-range-city-vs-highway/ (accessed on 12 August 2024).
- Steinstraeter, M.; Heinrich, T.; Lienkamp, M. Effect of Low Temperature on Electric Vehicle Range. World Electr. Veh. J. 2021, 12, 115. [Google Scholar] [CrossRef]
- Liu, X.; Zhao, F.; Geng, J.; Hao, H.; Liu, Z. Comprehensive assessment for different ranges of battery electric vehicles: Is it necessary to develop an ultra-long range battery electric vehicle? iScience 2023, 26, 106654. [Google Scholar] [CrossRef]
- Pevec, D.; Babic, J.; Carvalho, A.; Ghiassi-Farrokhfal, Y.; Ketter, W.; Podobnik, V. A survey-based assessment of how existing and potential electric vehicle owners perceive range anxiety. J. Clean. Prod. 2020, 276, 122779. [Google Scholar] [CrossRef]
- Demirci, A.; Tercan, S.M.; Cali, U.; Nakir, I. A comprehensive data analysis of electric vehicle user behaviors toward unlocking vehicle-to-grid potential. IEEE Access 2023, 11, 9149–9165. [Google Scholar]
- The Department of Energy’s (DOE’s) Vehicle Technologies Office. Electric Vehicle Battery Pack Costs for a Light-Duty Vehicle in 2023. Available online: https://www.energy.gov/eere/vehicles/articles/fotw-1354-august-5-2024-electric-vehicle-battery-pack-costs-light-duty (accessed on 14 September 2024).
- Punshi, M.; Dhar, R.; Demeulenaere, X. Battery Cost Trends in the European Union and Mainland China. Available online: https://www.sipotra.it/wp-content/uploads/2022/01/Battery-cost-trends-in-the-European-Union-and-mainland-China.pdf (accessed on 20 October 2024).
- The Electric Vehicles Initiative (EVI). Global EV Outlook 2024. Available online: https://www.iea.org/reports/global-ev-outlook-2024/trends-in-electric-vehicle-batteries (accessed on 14 September 2024).
- Chinese Government Network. A Quick Look at the Recent Series of New Energy Vehicle Policies issued by the State Council! Available online: https://www.gov.cn/zhengce/202306/content_6888250.htm (accessed on 12 August 2024).
- Ministry of Ecological Environment of the People’s Republic of China. Pollutant Emission Limits and Measurement Methods for Light Duty Vehicles (China Stage VI). Available online: https://www.mee.gov.cn/ywgz/fgbz/bz/bzwb/dqhjbh/dqydywrwpfbz/201612/t20161223_369476.shtml (accessed on 12 August 2024).
- The Norwegian EV Association. Norwegian EV Policy. Available online: https://elbil.no/english/norwegian-ev-policy/ (accessed on 12 August 2024).
- Government of Austria. General Information on Electric Cars and e-Mobility. Available online: https://www.oesterreich.gv.at/themen/mobilitaet/elektroautos_und_e_mobilitaet/Seite.4320010.html (accessed on 12 August 2024).
- The Danish Ministry of Taxation. New Deal: Cheaper Electric Cars and Tax-Free Charging in the Workplace. Available online: https://skm.dk/aktuelt/presse-nyheder/pressemeddelelser/ny-aftale-billigere-elfirmabiler-og-skattefri-opladning-paa-arbejdspladsen (accessed on 12 August 2024).
- Orlov, A.; Kallbekken, S. The impact of consumer attitudes towards energy efficiency on car choice: Survey results from Norway. J. Clean. Prod. 2019, 214, 816–822. [Google Scholar] [CrossRef]
- Yaveroglu, I.S.; Donthu, N. Cultural influences on the diffusion of new products. J. Int. Consum. Mark. 2002, 14, 49–63. [Google Scholar] [CrossRef]
- Genc, T.S.; De Giovanni, P. Dynamic pricing and green investments under conscious, emotional, and rational consumers. Clean. Responsible Consum. 2021, 2, 100007. [Google Scholar] [CrossRef]
- Timilsina, L.; Badr, P.R.; Hoang, P.H.; Ozkan, G.; Papari, B.; Edrington, C.S. Battery degradation in electric and hybrid electric vehicles: A survey study. IEEE Access 2023, 11, 42431–42462. [Google Scholar] [CrossRef]
- Choi, S.H.; Son, J.W.; Yoon, Y.S.; Kim, J. Particle size effects on temperature-dependent performance of LiCoO2 in lithium batteries. J. Power Sources 2006, 158, 1419–1424. [Google Scholar] [CrossRef]
- Varga, B.O.; Sagaoian, A.; Mariasiu, F. Prediction of electric vehicle range: A comprehensive review of current issues and challenges. Energies 2019, 12, 946. [Google Scholar] [CrossRef]
- Ou, S. Estimate long-term impact on battery degradation by considering electric vehicle real-world end-use factors. J. Power Sources 2023, 573, 233133. [Google Scholar] [CrossRef]
- Yang, F.; Xie, Y.; Deng, Y.; Yuan, C. Impacts of battery degradation on state-level energy consumption and GHG emissions from electric vehicle operation in the United States. Procedia CIRP 2019, 80, 530–535. [Google Scholar] [CrossRef]
- Etxandi Santolaya, M.; Mora-Pous, A.; Canals Casals, L.; Corchero, C.; Eichman, J. Quantifying the impact of battery degradation in electric vehicle driving through key performance indicators. Batteries 2024, 10, 103. [Google Scholar] [CrossRef]
- Sarker, M.R.; Pandžić, H.; Ortega-Vazquez, M.A. Electric vehicle battery swapping station: Business case and optimization model. In Proceedings of the 2013 International Conference on Connected Vehicles and Expo (ICCVE), Las Vegas, NV, USA, 2–6 December 2013; IEEE: Piscataway, NJ, USA, 2013; pp. 289–294. [Google Scholar]
- Kostopoulos, E.D.; Spyropoulos, G.C.; Kaldellis, J.K. Real-world study for the optimal charging of electric vehicles. Energy Rep. 2020, 6, 418–426. [Google Scholar] [CrossRef]
- Berjoza, D.; Jurgena, I. Influence of batteries weight on electric automobile performance. Eng. Rural. Dev. 2017, 16, 1388–1394. [Google Scholar]
- Wiedemann, E.; Meurle, J.; Lienkamp, M. Optimization of electric vehicle concepts based on customer-relevant characteristics. In Proceedings of the SAE 2012 World Congress & Exhibition, Detroit, MI, USA, 24–26 April 2012. Technical Report, SAE Technical Paper. [Google Scholar] [CrossRef]
- Hollweck, B.; Moullion, M.; Christ, M.; Kolls, G.; Wind, J. Energy analysis of fuel cell electric vehicles (fcevs) under european weather conditions and various driving behaviors. Fuel Cells 2018, 18, 669–679. [Google Scholar] [CrossRef]
- Reyes, J.R.M.D.; Parsons, R.V.; Hoemsen, R. Winter happens: The effect of ambient temperature on the travel range of electric vehicles. IEEE Trans. Veh. Technol. 2016, 65, 4016–4022. [Google Scholar] [CrossRef]
- Kambly, K.; Bradley, T.H. Geographical and temporal differences in electric vehicle range due to cabin conditioning energy consumption. J. Power Sources 2015, 275, 468–475. [Google Scholar]
- Xu, H.; Liu, Y.; Li, J.; Yu, H.; An, X.; Ma, K.; Liang, Y.; Hu, X.; Zhang, H. Study on the influence of high and low temperature environment on the energy consumption of battery electric vehicles. Energy Rep. 2023, 9, 835–842. [Google Scholar] [CrossRef]
- Lindgren, J.; Lund, P.D. Effect of extreme temperatures on battery charging and performance of electric vehicles. J. Power Sources 2016, 328, 37–45. [Google Scholar] [CrossRef]
- Fetene, G.M.; Kaplan, S.; Mabit, S.L.; Jensen, A.F.; Prato, C.G. Harnessing big data for estimating the energy consumption and driving range of electric vehicles. Transp. Res. Part Transp. Environ. 2017, 54, 1–11. [Google Scholar] [CrossRef]
- Liu, K.; Wang, J.; Yamamoto, T.; Morikawa, T. Exploring the interactive effects of ambient temperature and vehicle auxiliary loads on electric vehicle energy consumption. Appl. Energy 2018, 227, 324–331. [Google Scholar] [CrossRef]
- Cicero-Fernandez, P.; Long, J.R.; Winer, A.M. Effects of grades and other loads on on-road emissions of hydrocarbons and carbon monoxide. J. Air Waste Manag. Assoc. 1997, 47, 898–904. [Google Scholar] [CrossRef]
- Long, H.; Yin, X.; Liu, C.; Xu, Y.; Tian, T.; Ye, F. Electric Vehicle Load Forecasting in Mountainous Cities Considering Traffic Behavior. In Proceedings of the 2023 China Automation Congress (CAC), Chongqing, China, 17–19 November 2023; IEEE: Piscataway, NJ, USA, 2023; pp. 3537–3542. [Google Scholar]
- Travesset-Baro, O.; Rosas-Casals, M.; Jover, E. Transport energy consumption in mountainous roads. A comparative case study for internal combustion engines and electric vehicles in Andorra. Transp. Res. Part Transp. Environ. 2015, 34, 16–26. [Google Scholar] [CrossRef]
- Liu, K.; Yamamoto, T.; Morikawa, T. Impact of road gradient on energy consumption of electric vehicles. Transp. Res. Part Transp. Environ. 2017, 54, 74–81. [Google Scholar] [CrossRef]
- Wager, G.; Whale, J.; Braunl, T. Driving electric vehicles at highway speeds: The effect of higher driving speeds on energy consumption and driving range for electric vehicles in Australia. Renew. Sustain. Energy Rev. 2016, 63, 158–165. [Google Scholar] [CrossRef]
- Yang, X.; Zhuge, C.; Shao, C.; Huang, Y.; Tang, J.H.C.G.; Sun, M.; Wang, P.; Wang, S. Characterizing mobility patterns of private electric vehicle users with trajectory data. Appl. Energy 2022, 321, 119417. [Google Scholar] [CrossRef]
- Wei, L.; Wang, Y.; Chen, P. A particle filter-based approach for vehicle trajectory reconstruction using sparse probe data. IEEE Trans. Intell. Transp. Syst. 2020, 22, 2878–2890. [Google Scholar] [CrossRef]
- Ma, J.; Roncoli, C.; Ren, G.; Yang, Y.; Wang, S.; Yu, J.; Wang, B. An integrated framework for fully sampled vehicle trajectory reconstruction using a fused dataset. Transp. A Transp. Sci. 2024, 1–30. [Google Scholar] [CrossRef]
- Pan, C.; Li, Y.; Wang, J.; Liang, J.; Jinyama, H. Research on multi-lane energy-saving driving strategy of connected electric vehicle based on vehicle speed prediction. Green Energy Intell. Transp. 2023, 2, 100127. [Google Scholar] [CrossRef]
- López-Lambas, M.E.; Monzón, A.; Pieren, G. Analysis of using electric car for urban mobility, perceived satisfaction among university users. Transp. Res. Procedia 2017, 27, 524–530. [Google Scholar] [CrossRef]
- Calearo, L.; Marinelli, M.; Ziras, C. A review of data sources for electric vehicle integration studies. Renew. Sustain. Energy Rev. 2021, 151, 111518. [Google Scholar]
- Miles, R. Report Reveals Countries with the Quickest Commutes. Available online: https://www.intelligentsme.tech/2024/07/29/report-reveals-countries-with-the-quickest-commutes/ (accessed on 13 August 2024).
- Tong, H.; Chu, L.; Chen, Z.; Liu, Y.; Zhang, Y.; Hu, J. Multi-Objective Autonomous Eco-Driving Strategy: A Pathway to Future Green Mobility. Green Energy Intell. Transp. 2025, 100279. [Google Scholar] [CrossRef]
- Putra, Y.R.P.; Sudiarno, A.; Sholihah, M.; Wikarta, A.; Pranaditya, I.M.I.S.; Saputra, Y.A. Comparative Economic Study of Electric Cars in Indonesia. In Proceedings of the E3S Web of Conferences, Rostov-on-Don, Russia, 30 September–3 October 2024; EDP Sciences: Les Ulis, France, 2024; Volume 517, p. 05016. [Google Scholar]
- Neubauer, J.; Wood, E. The impact of range anxiety and home, workplace, and public charging infrastructure on simulated battery electric vehicle lifetime utility. J. Power Sources 2014, 257, 12–20. [Google Scholar] [CrossRef]
- Wu, S.; Yang, Z. Availability of public electric vehicle charging pile and development of electric vehicle: Evidence from China. Sustainability 2020, 12, 6369. [Google Scholar] [CrossRef]
- Marklines. Electric Vehicle Charging Infrastructure in the United States. Available online: https://www.marklines.com/en/report/rep2560_202311 (accessed on 19 September 2024).
- Stable. EV Charging Pricing Trends. Available online: https://stable.auto/insights/electric-vehicle-charger-price-by-state (accessed on 27 October 2024).
- UcarPac. What Is the Approximate Charging Fee for an Electric Vehicle (EV)? Explanation of Charging Time and Installation Cost for Home Charging. Available online: https://ucarpac.com/buy/useful/ev-charge-costs/ (accessed on 27 October 2024).
- Shanghai Municipal Government. 2024 Shanghai Municipal Government Work Report. Available online: https://h5.thepaper.cn/html/interactive/2024/01/2024-lianghui/index.html (accessed on 12 August 2024).
- Ministry of Industry and Information Technology. Green Growth Strategy Through Achieving Carbon Neutrality in 2050. Available online: https://www.ndrc.gov.cn/xxgk/zcfb/tz/202401/t20240104_1363096.html?mc_cid=60a8d48e2f&mc_eid=fbdebe8496 (accessed on 12 August 2024).
- Busse, S.; El Khatib, V.; Brandt, T.; Kranz, J.; Kolbe, L. Understanding the role of culture in eco-innovation adoption—An empirical cross-country comparison. In Proceedings of the International Conference on Information Systems (ICIS), Milan, Italy, 15–18 December 2013; Volume 34. [Google Scholar] [CrossRef]
- McLeay, F.; Yoganathan, V.; Osburg, V.S.; Pandit, A. Risks and drivers of hybrid car adoption: A cross-cultural segmentation analysis. J. Clean. Prod. 2018, 189, 519–528. [Google Scholar] [CrossRef]
- Schreiber, J.; Scherrer, A.; Breetz, H.L. Driving discussion: Media framing of electric, hydrogen, and conventional vehicles in German newspapers and Twitter. Energy Res. Soc. Sci. 2023, 103, 103193. [Google Scholar] [CrossRef]


| Factors | Key Data Source |
|---|---|
| Technical factors | Academic papers [16,17,18,19,20,21] |
| Official websites of major EV brands [22,23,24,25,26,27,28,29,30] | |
| Environmental factors | Academic papers and industry reports [31,32,33,34,35] |
| User-related factors | Survey conducted by authors, |
| Academic papers and industry reports [36,37,38,39] | |
| Economic factors | Reports from government and industry [40,41,42] |
| Policy factors | Various government publications and reports [43,44,45,46,47] |
| Cultural factors | Academic and industry studies [48,49,50] |
| Key Aspects | Country | ||||
|---|---|---|---|---|---|
| China | US | Japan | Germany | Norway | |
| EV Sales/Stock | Zero-emission vehicle (ZEV): 20% by 2025 and reach 100% by 2035 | ZEV: 3.3 million by 2025, and 100% sales by 2050 | BEV and PHEV: 20–30% by 2035 and 100% by 2050 | BEV and PHEV: 20–30% by 2035 and 100% by 2050 | ZEV: 100% sales share by 2025 |
| Fuel Economy | 25 km/L | 24.5 km/L | 24.5 km/L | - | - |
| Emission | 117 CO2 g/km | 52.82 CO2 g/km | 122 CO2 g/km | 95 CO2 g/km | 95 CO2 g/km |
| Purchase Subsidy Tax Exemption and Eligibility Criteria | Vehicle purchase tax exemption for 2024–2025, with the exemption amount not exceeding around 4300 CNY per new energy passenger vehicle. Half of the vehicle purchase tax for 2026–2027, with the tax reduction amount not exceeding around CNY 2100 per new energy passenger vehicle. | Provide 1 billion CNY between now and 2031 for heavy-duty vehicle programs. Tax credits of up to 40,000 CNY per vehicle for vehicles with 15 kWh or more of capacity from approved manufacturers. | Subsidy cap amount up to around 5900 CNY from the governors. | 25% VAT will be applied to the purchase price of around 45,500 CNY and above. | |
| Factor | Feature/Influence on EV Range |
|---|---|
| Battery Capacity | Directly increases range with higher capacity, allowing for longer distances between charges. |
| Charging Time | Reduces downtime with fast-charging technology, alleviating range anxiety. |
| Weight | Lighter weight and better aerodynamics improve energy efficiency, extending range. |
| Temperature | Extreme temperatures reduce battery efficiency, leading to shorter range, but are mitigated by thermal management. |
| Terrain | Hilly or rough terrains increase energy consumption, but regenerative braking helps recover energy. |
| Driving Behavior | Eco-friendly driving extends range, while aggressive driving reduces efficiency. |
| Charging Infrastructure | Widespread, high-speed charging infrastructure reduces range anxiety and allows for long-distance travel. |
| Battery Cost | Lower battery costs enable more affordable long-range EVs. |
| Electricity Prices | Lower electricity prices reduce operational costs, promoting frequent charging. |
| Government Incentives | Financial incentives and subsidies reduce the cost burden on consumers, making long-range EVs more accessible. |
| Infrastructure Investment | Investment in charging infrastructure expands network coverage, making long-distance travel more feasible. |
| Social Values | Societal attitudes toward sustainability and modernity can drive demand for EVs with extended range. |
| Environmental Sustainability | Emphasis on reducing carbon footprint increases the preference for EVs. |
| Factor | Feature/Influence on EV Range |
|---|---|
| Solid-State Batteries | Improve energy density, significantly increase the range of EVs, and reduce charging time. |
| Sodium-Ion and Cobalt-Free Batteries | Make long-range EVs more affordable and accessible to a broader market. |
| Vehicle to Grid (V2G) | Reduce reliance on large battery packs and optimize energy use for extended range. |
| Autonomous Driving | Optimize driving patterns for maximum energy efficiency and extend EV range. |
| Wireless Charging | Allow EVs to charge while parked or in motion and reduce the need for large battery capacity. |
| ZEV Policies | Accelerate the development of long-range EVs and promote widespread infrastructure. |
| Recycling and Second-Life Batteries | Lower production costs and improve sustainability. |
| Renewable Energy Integration | Reduce environmental impact and potentially lower operational costs. |
| AI in Energy Management | Optimize energy usage in real time, extending EV range and efficiency. |
Disclaimer/Publisher’s Note: The statements, opinions and data contained in all publications are solely those of the individual author(s) and contributor(s) and not of MDPI and/or the editor(s). MDPI and/or the editor(s) disclaim responsibility for any injury to people or property resulting from any ideas, methods, instructions or products referred to in the content. |
© 2025 by the authors. Licensee MDPI, Basel, Switzerland. This article is an open access article distributed under the terms and conditions of the Creative Commons Attribution (CC BY) license (https://creativecommons.org/licenses/by/4.0/).
Share and Cite
Mao, R.; Xu, W.; Qian, Y.; Li, X.; Li, Y.; Li, G.; Zhang, H. Understanding the Determinants of Electric Vehicle Range: A Multi-Dimensional Survey. Sustainability 2025, 17, 4259. https://doi.org/10.3390/su17104259
Mao R, Xu W, Qian Y, Li X, Li Y, Li G, Zhang H. Understanding the Determinants of Electric Vehicle Range: A Multi-Dimensional Survey. Sustainability. 2025; 17(10):4259. https://doi.org/10.3390/su17104259
Chicago/Turabian StyleMao, Runze, Weiqian Xu, Yutong Qian, Xiaorong Li, Yuanjiang Li, Guoyuan Li, and Houxiang Zhang. 2025. "Understanding the Determinants of Electric Vehicle Range: A Multi-Dimensional Survey" Sustainability 17, no. 10: 4259. https://doi.org/10.3390/su17104259
APA StyleMao, R., Xu, W., Qian, Y., Li, X., Li, Y., Li, G., & Zhang, H. (2025). Understanding the Determinants of Electric Vehicle Range: A Multi-Dimensional Survey. Sustainability, 17(10), 4259. https://doi.org/10.3390/su17104259