Article

Optimization of Coagulation to Remove Turbidity from Surface Water Using Novel Nature-Based Plant Coagulant and Response Surface Methodology

1
Institute of Environmental Engineering & Research (IEER), University of Engineering & Technology (UET), Lahore 54890, Pakistan
2
Department of Civil and Environmental Engineering, Imperial College London, London SW7 2AZ, UK
3
Section of Natural and Applied Sciences, School of Psychology and Life Sciences, Canterbury Christ Church University, Canterbury CT1 1QU, UK
*
Author to whom correspondence should be addressed.
Sustainability 2024, 16(7), 2941; https://doi.org/10.3390/su16072941
Submission received: 4 February 2024 / Revised: 25 March 2024 / Accepted: 27 March 2024 / Published: 1 April 2024

Abstract

:
Plant-based natural coagulants are considered potential alternatives to chemical coagulants. These are eco-friendly, non-toxic, and produce less sludge compared to chemical coagulants. This study aims to evaluate the coagulation potential of a novel plant-based coagulant Sorghum for canal water treatment. In addition, a coagulant aid, i.e., Aloe Vera, was also tested to examine any further increase in turbidity removal through a jar test apparatus. Fourier transform infrared (FTIR) spectroscopy and scanning electron microscopy (SEM) were used to characterize the coagulants. The experiment was designed using response surface methodology (RSM). When used alone, Sorghum resulted in a maximum turbidity removal of 87.73% at pH 2 and a dose of 40 mg/L, while the combination of Sorghum and Aloe Vera resulted in a turbidity removal of 84.2% at pH 2.7, and the doses of Sorghum and Aloe Vera were 17.1 mg/L and 0.9% (v/v), respectively. Thus, the Sorghum dose was significantly reduced when Aloe Vera was used in combination. At a pH of 7, Sorghum achieved 54% turbidity removal at a dose of 55.7 mg/L. Analyses of variance revealed that pH plays a more vital role in the removal of turbidity than the coagulant dose. FTIR and SEM analyses revealed that adsorption is the dominant coagulation mechanism for plant-based coagulants. The Sorghum powder exhibited carboxylic, amine, and carbonyl groups that functioned as active adsorption sites for suspended solids. In a similar vein, the coagulant aid Aloe Vera gel facilitated the adsorption process by fostering intermolecular hydrogen bonding between suspended particles and amine groups present within the gel.

1. Introduction

Water pollution has become one of the major threats to the entire biosphere due to urbanization and the rapid expansion of industries [1]. Surface water, after treatment, is a common source of municipal water supplies. This supply is used for drinking purposes. For instance, in the USA, around 66%, and in Europe around 35–45%, of municipal water supplies are based on surface water sources [2]. In Pakistan, around 16 million people collect and consume water from insecure sources, including surface water and groundwater [3]. The quality of surface water declines due to organic and inorganic constituents from natural and anthropogenic sources [4]. Colloidal particles include organic material such as algae and inorganic material such as sand, silt, and sediments [5]. Many of the environmental problems are associated with the presence of heavy metals, total suspended solids, and turbidity in surface water [6]. Therefore, surface water contamination is a vital concern as it affects municipal, household, and agricultural activities.
The removal of turbidity, along with other impurities, from surface water using chemical coagulants is a vital part of surface water treatment processes. For this, coagulation–flocculation is widely used. It is considered reliable, economical, and efficient among all other physicochemical treatment technologies [7,8]. In general, coagulants are classified as natural and chemical. Chemical coagulants, e.g., alum, ferric chloride, and polyaluminum chloride (PACL), are used in water and wastewater treatment [7,9,10]. There are several drawbacks associated with the use of chemical coagulants in the water treatment process. Firstly, the carbon footprint associated with the use of chemical coagulants is a major concern. The use of alum as a coagulant contributes to an estimated 35% of the carbon footprint of a water treatment facility. Moreover, an excessive use of alum salt may lead to the development of Alzheimer’s disease in humans. Also, chemical coagulants result in a large volume of sludge production, a change in the water pH, and high procurement costs [11]. Another major concern associated with chemical coagulants is the disposal of the sludge produced. For example, in Australia, the cost of the disposal of alum sludge was estimated to be AUD 130 per ton [12].
Moreover, the presence of residual aluminum in drinking water reduces the water disinfection efficiency [13]. Acrylamide (a synthetic organic polymer) is found to be neurotoxic and carcinogenic. If iron (Fe) salts are used excessively for water treatment, these cause blood-colored stains and visible rust [14].
Therefore, considering the shortcomings of chemical coagulants, the trend has been shifted toward the use of natural bio-coagulants (BCs). BCs are low-cost, can be produced abundantly, and do not change the pH of treated water [15]. Moreover, BCs are non-toxic and produce less sludge, which makes them more effective compared to chemical coagulants [16].
Plant-based natural coagulants are produced from non-hazardous, renewable, degradable, and carbon-neutral sources [12]. Plant-based coagulants help to destabilize the colloidal particles and form micro and macro flocs through polymer bridging or charge neutralization. Macro flocs can be easily removed through settling, while micro flocs need the aid of filters or flocculants for their removal [17,18].
Natural coagulants are mostly plant-based. Moringa Oleifera, Tamarindus indica, tannin, Plantago major, Nirmali seeds, and Strychnos potatorum were studied as effective green coagulants for the treatment of textile wastewater [19]. The Moringa Oleifera seed extract is the most widely studied plant-based coagulant, having comparable efficiency to alum. The coagulation mechanisms for the Moringa seed extract are adsorption, charge neutralization, and interparticle bridging [11,20]. The responsible active coagulating agent in most plant-based coagulants is dimeric cationic protein. Moreover, common beans such as red maize, red beans, sugar maize, Phaseolus vulgaris, Opuntia stricta, and walnut shells have also been evaluated as BCs [21].
Chickpeas have been explored as a coagulant in comparison with Dolichols lablab and M. Oleifera. For the coagulant extract of chickpeas, maximum turbidity removal was observed at 85.89% in a clay suspension with an initial turbidity of 95 NTU at a dose of 100 mg/L. Moreover, it was concluded that the removal efficiency of all coagulants was higher for highly turbid water and low for low-turbidity water [22].
Given the drawbacks associated with chemical coagulants, there is a growing need to identify new bio-coagulants that possess good coagulation potential for water purification. Additionally, the availability and abundance of such coagulants must be taken into consideration to ensure their widespread availability. The understanding of the coagulation mechanisms in bio-based coagulants has received insufficient consideration, and there has been little attention given to the effect of pH on their efficacy [23]. Additionally, previous studies have explored the coagulation potential within a narrow or single range of pH, or have focused on fixing a single variable such as the pH or dose. Only a few studies have explored the effect of simultaneous variations in the pH range and coagulant dose to understand their combined effect. Therefore, the objective of this study was to explore the coagulation potential of plant-based natural coagulant Sorghum (seeds), which has not been explored previously. Sorghum coagulants can be used for small water supplies and water treatment at the household level, especially in rural areas that have limited accessibility to chemical coagulants. Aloe Vera was tested as a coagulant aid, to examine its role in enhancing turbidity removal.

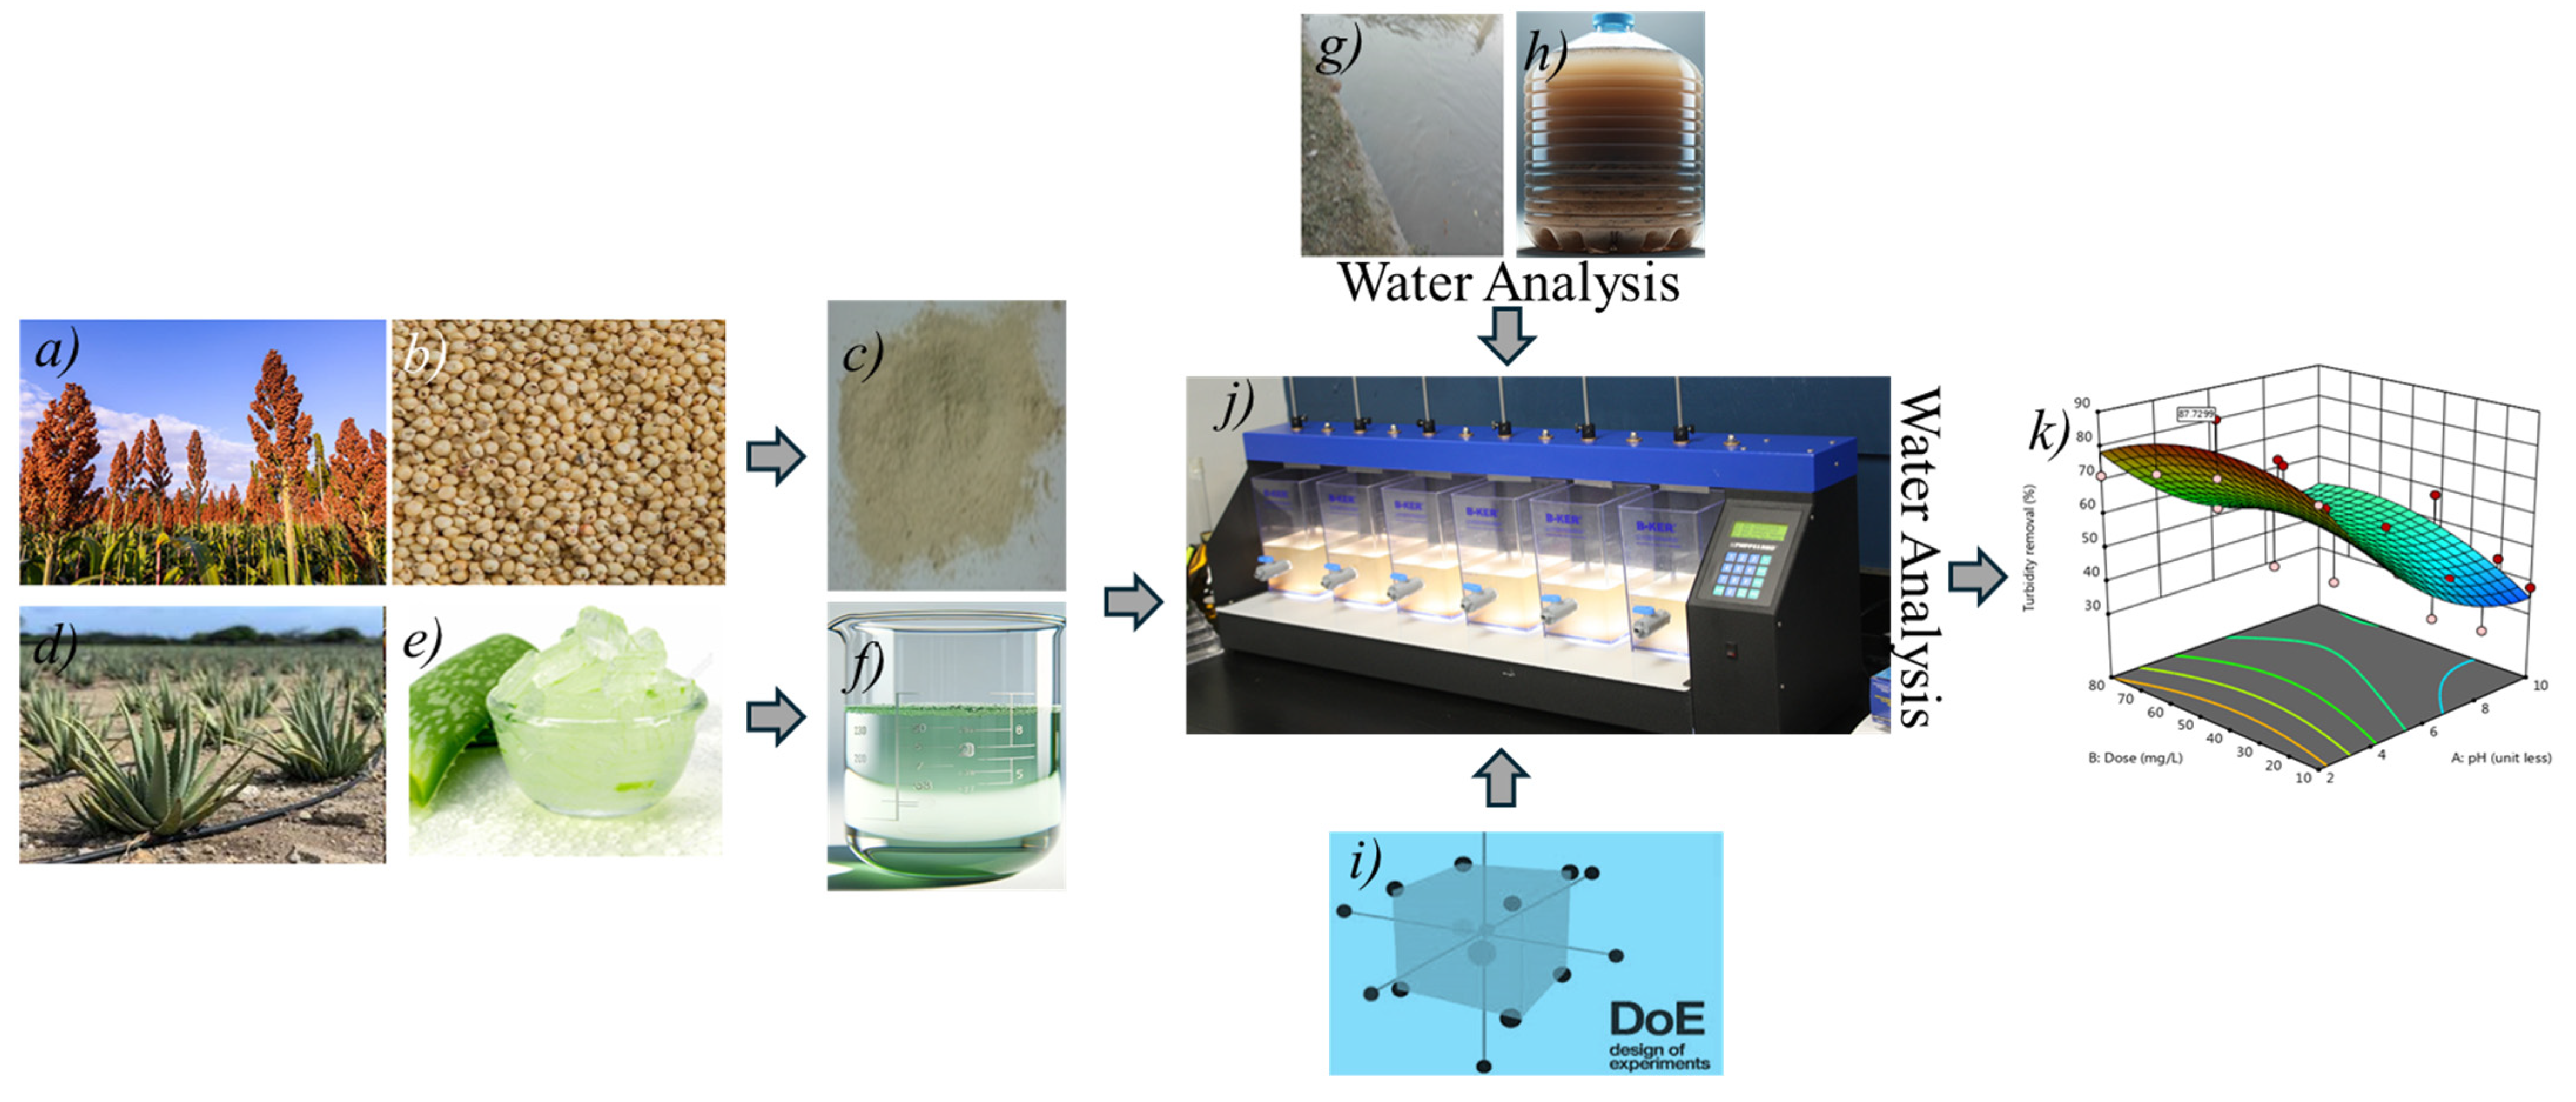
2. Materials and Methods

2.1. Sample Collection and Characterization

Seven grab samples of surface water from the Bambawali–Ravi–Bedian canal, passing through Lahore, were collected at one-hour intervals from 9:00 a.m. to 4:00 p.m. Later, these were mixed well to form a composite sample. Bottles cleaned with distilled water were used to store the samples. The sample bottles were labeled and stored at 4 °C. The samples were characterized for quality parameters using standard methods, and these values are reported in Table 1.

2.2. Preparation of Coagulants

Coagulant solutions were prepared with Sorghum seed powder (great millet) and leaves of Aloe Vera, separately. Methods for preparing the stock solutions for each are defined below.

2.2.1. Preparation of Stock Solution for Sorghum Coagulant

Sorghum seeds were bought from the local market, dried for 48 h in direct sunlight, and then dried in an oven at 103 °C for 24 h. Dried seeds were blended in a mixer (Cambridge GC-5026) to obtain a powdered form of coagulant. The Sorghum powder was then sieved through mesh no. 40 to obtain uniformly sized particles that were smaller than 0.42 mm. Of the sieved powder, 2.5 g was dissolved in 1 L of distilled water and agitated using a magnetic stirrer for 30 min to liberate the active coagulant compounds [24]. The mixture was passed through Whatman filter paper no. 42 and the resultant filtrate was used as a stock solution. The stock solution’s concentration was 2.5 g/L, with a pH of 7.2. The stock solution was added to the canal water in appropriate proportions to obtain the coagulant concentrations of 10, 20, 40, 60, and 80 mg/L.

2.2.2. Preparation of Coagulant Aid

The leaves of Aloe Vera were available locally. These were collected and washed well to remove dust particles. The thick exterior skin was removed, and the pulp (a gel-like material) part was separated carefully. The pulp was blended with a beater to obtain a homogenous liquefied paste. Then, 10 mL of fresh liquefied paste was directly mixed into 990 mL of surface water to obtain a 1% (v/v) Aloe Vera gel concentration solution. Similarly, volumes of 8 mL, 6 mL, 4 mL, and 2 mL of the liquefied paste were directly added to 992 mL, 994 mL, 996 mL, and 998 mL of surface water to obtain concentrations of 0.8%, 0.6%, 0.4%, and 0.2%, respectively.

2.3. Design of Experiment Using Response Surface Methodology (RSM)

The design of the experiment was carried out using Design-Expert software (DOE version 12.0.1.0), and response surface methodology (RSM) was used to optimize the response variables (turbidity removal) against the treatment variables (pH and dose). A detailed design summary is presented in Table 2. RSM involves a combination of mathematical and statistical tools. It is extensively used to optimize output variables and for the design of experiments [7]. Experimental results were analyzed using various models (i.e., linear, quadratic, cubic, etc.). The most appropriate model was selected to evaluate the effects of the treatment variables on the response. Analysis of variance was further used to validate the statistical results of the response and suggested model. The desirability function was used for the optimization of the response variable.
Experiments were conducted in two trials. The first trial refers to the use of Sorghum alone and the second trial refers to the use of Aloe Vera as a coagulant aid with Sorghum. In the first trial, the pH (2–10) and coagulant dose (10–80 mg/L) were selected as treatment variables. For the second trial, the pH (2–10), Sorghum coagulant dose (10–80 mg/L), and Aloe Vera dose (0.2–1%) were selected as treatment variables, while turbidity removal (%) was set as a target (response) variable for both trials. The low values were coded as −1, representing the minimum pH value of 2, and the high values were coded as +1, corresponding to the maximum pH value of 10. Similarly, for the dosage, 10 mg/L was denoted as −1, and 80 mg/L was represented as +1. In total, 25 experimental runs were conducted for each trial.

2.4. Jar Test

A jar test apparatus (PB-900, Phipps and Birds, Richmond, Virginia USA) was used to simulate coagulation–flocculation–sedimentation. The beakers were filled with a sample of 1 L (surface water). The pH of the sample was adjusted to the desired level in each beaker using 1 M NaOH (Sigma Aldrich, St. Louis, MO, USA) and 1 M H2SO4 (Sigma Aldrich, St. Louis, MO, USA). Additionally, the desired coagulant dose was added to each beaker. Rapid mixing (200 rpm for 2 min) followed by slow mixing (30 rpm for 25 min) and settling for 30 min were selected as operational parameters for the jar test apparatus. In the second trial, the required volume of freshly prepared liquefied coagulant aid (Aloe Vera) was added to the beaker at the start of slow mixing. A turbidity meter (Hach 2100 AN Turbidimeter, Loveland, CO, USA) and a pH meter (Hach sensION+ 3 pH meter, Loveland, CO, USA) were used to measure the turbidity and pH of the samples, respectively. The blank samples were run for each pH level, and residual turbidity of each blank was measured at the end of each experiment. Figure 1 shows the experimental workflow diagram.

2.5. Fourier Transform Infrared Spectroscopy (FTIR) of Coagulant, Coagulant Aid, and Suspended Solids

FTIR analysis was performed for the Sorghum coagulant powder, the coagulant aid, i.e., Aloe Vera (before treatment), and the flocs produced after treatment using an Agilent Cary 600 series Fourier transform Infrared Spectrophotometer (Agilent Technologies, CA, USA). For sample processing, the flocs (separated through filtration) were carefully moved to a clean glass slide. Flocs were dried at room temperature for 24 h and shifted to an airtight jar. For analysis, a 1 mg sample was mixed with 150 mg KBr (analytical grade). A pellet was prepared using a 10 T press. The recorded spectral range was 600–4000 cm−1. These spectra were employed to identify the main functional groups present in the coagulants and flocs.

2.6. Scanning Electron Microscopy (SEM) of Coagulant, Coagulant Aid, and Sludge

Scanning electron microscopy (SEM, Hitachi S-37N, Hitachi High-Tech, Tokyo, Japan) images of coagulant powder, coagulant aid, and produced flocs were attained using a high magnification at a voltage of 15.0 kV to examine the surface morphology of the particles. Samples were gold sputter-coated before SEM analysis. The shape and the size of the flocs were studied using SEM images to determine the possible coagulation mechanisms.

2.7. Statistical Analysis

The experimental data were fitted to various statistical models (from linear to complex models) to identify the most appropriate model in terms of coagulant performance. The selected model was used to evaluate the effect of variables on the response. Analysis of variance (ANOVA) was performed on the developed model to determine the statistical significance and to check its suitability by comparing the predicted and actual values. Alpha (0.05) was used as the significant level.

3. Results and Discussion

3.1. Turbidity Removal by Sorghum (Great Millet)

The overall turbidity removal efficiency of Sorghum varied significantly from 30.7% to 89.2%, as presented in Table 3. The maximum turbidity removal from the experimental results was 89.2%, with a residual turbidity of 37.9 NTU, at pH 2 and a dose of 40 mg/L. However, at pH 4 and a dose of 60 mg/L, pH 8 and a dose of 40 mg/L, and pH 6 and a dose of 20 mg/L, the removal efficiencies observed were 88.3%, 53.0%, and 50%, respectively. This shows the effectiveness of the Sorghum as a coagulant around neutral pH.

3.1.1. Fitting of Statistical Models on Experimental Data for Sorghum

Experimental results were fitted into various models, i.e., linear, quadratic, cubic, quartic, and fifth, as summarized in Table 4. The fifth model was aliased, and, therefore, was neglected for further comparison. Although, the cubic model seems more appealing due to its low standard deviation and PRESS value. However, the quadratic model has the lowest difference between the adjusted and predicted R2 (0.08) than the acceptable statistical analysis value, i.e., (<0.2). The difference between adjusted and predicted R2 values for the quadratic model is low (0.080) when compared to the cubic model (0.099). Therefore, the most suitable model to describe the experimental data for the Sorghum coagulant is the quadratic model because it has a reasonable R2 value (0.76), low standard deviation, and a low PRESS value as well.
The quadratic model for the performance of the Sorghum coagulant is presented in Equation (1).
T u b i d i t y   R e m o v a l % = + 57.27 18.52 A + 3.14 B + 5.12 A B + 11.81 A 2 7.24 B 2
In the above equation, A represents the pH and B represents the coagulant dose (mg/L). Equation (1) can be used to predict the turbidity removal for Sorghum (great millet) at any level of pH and dose.

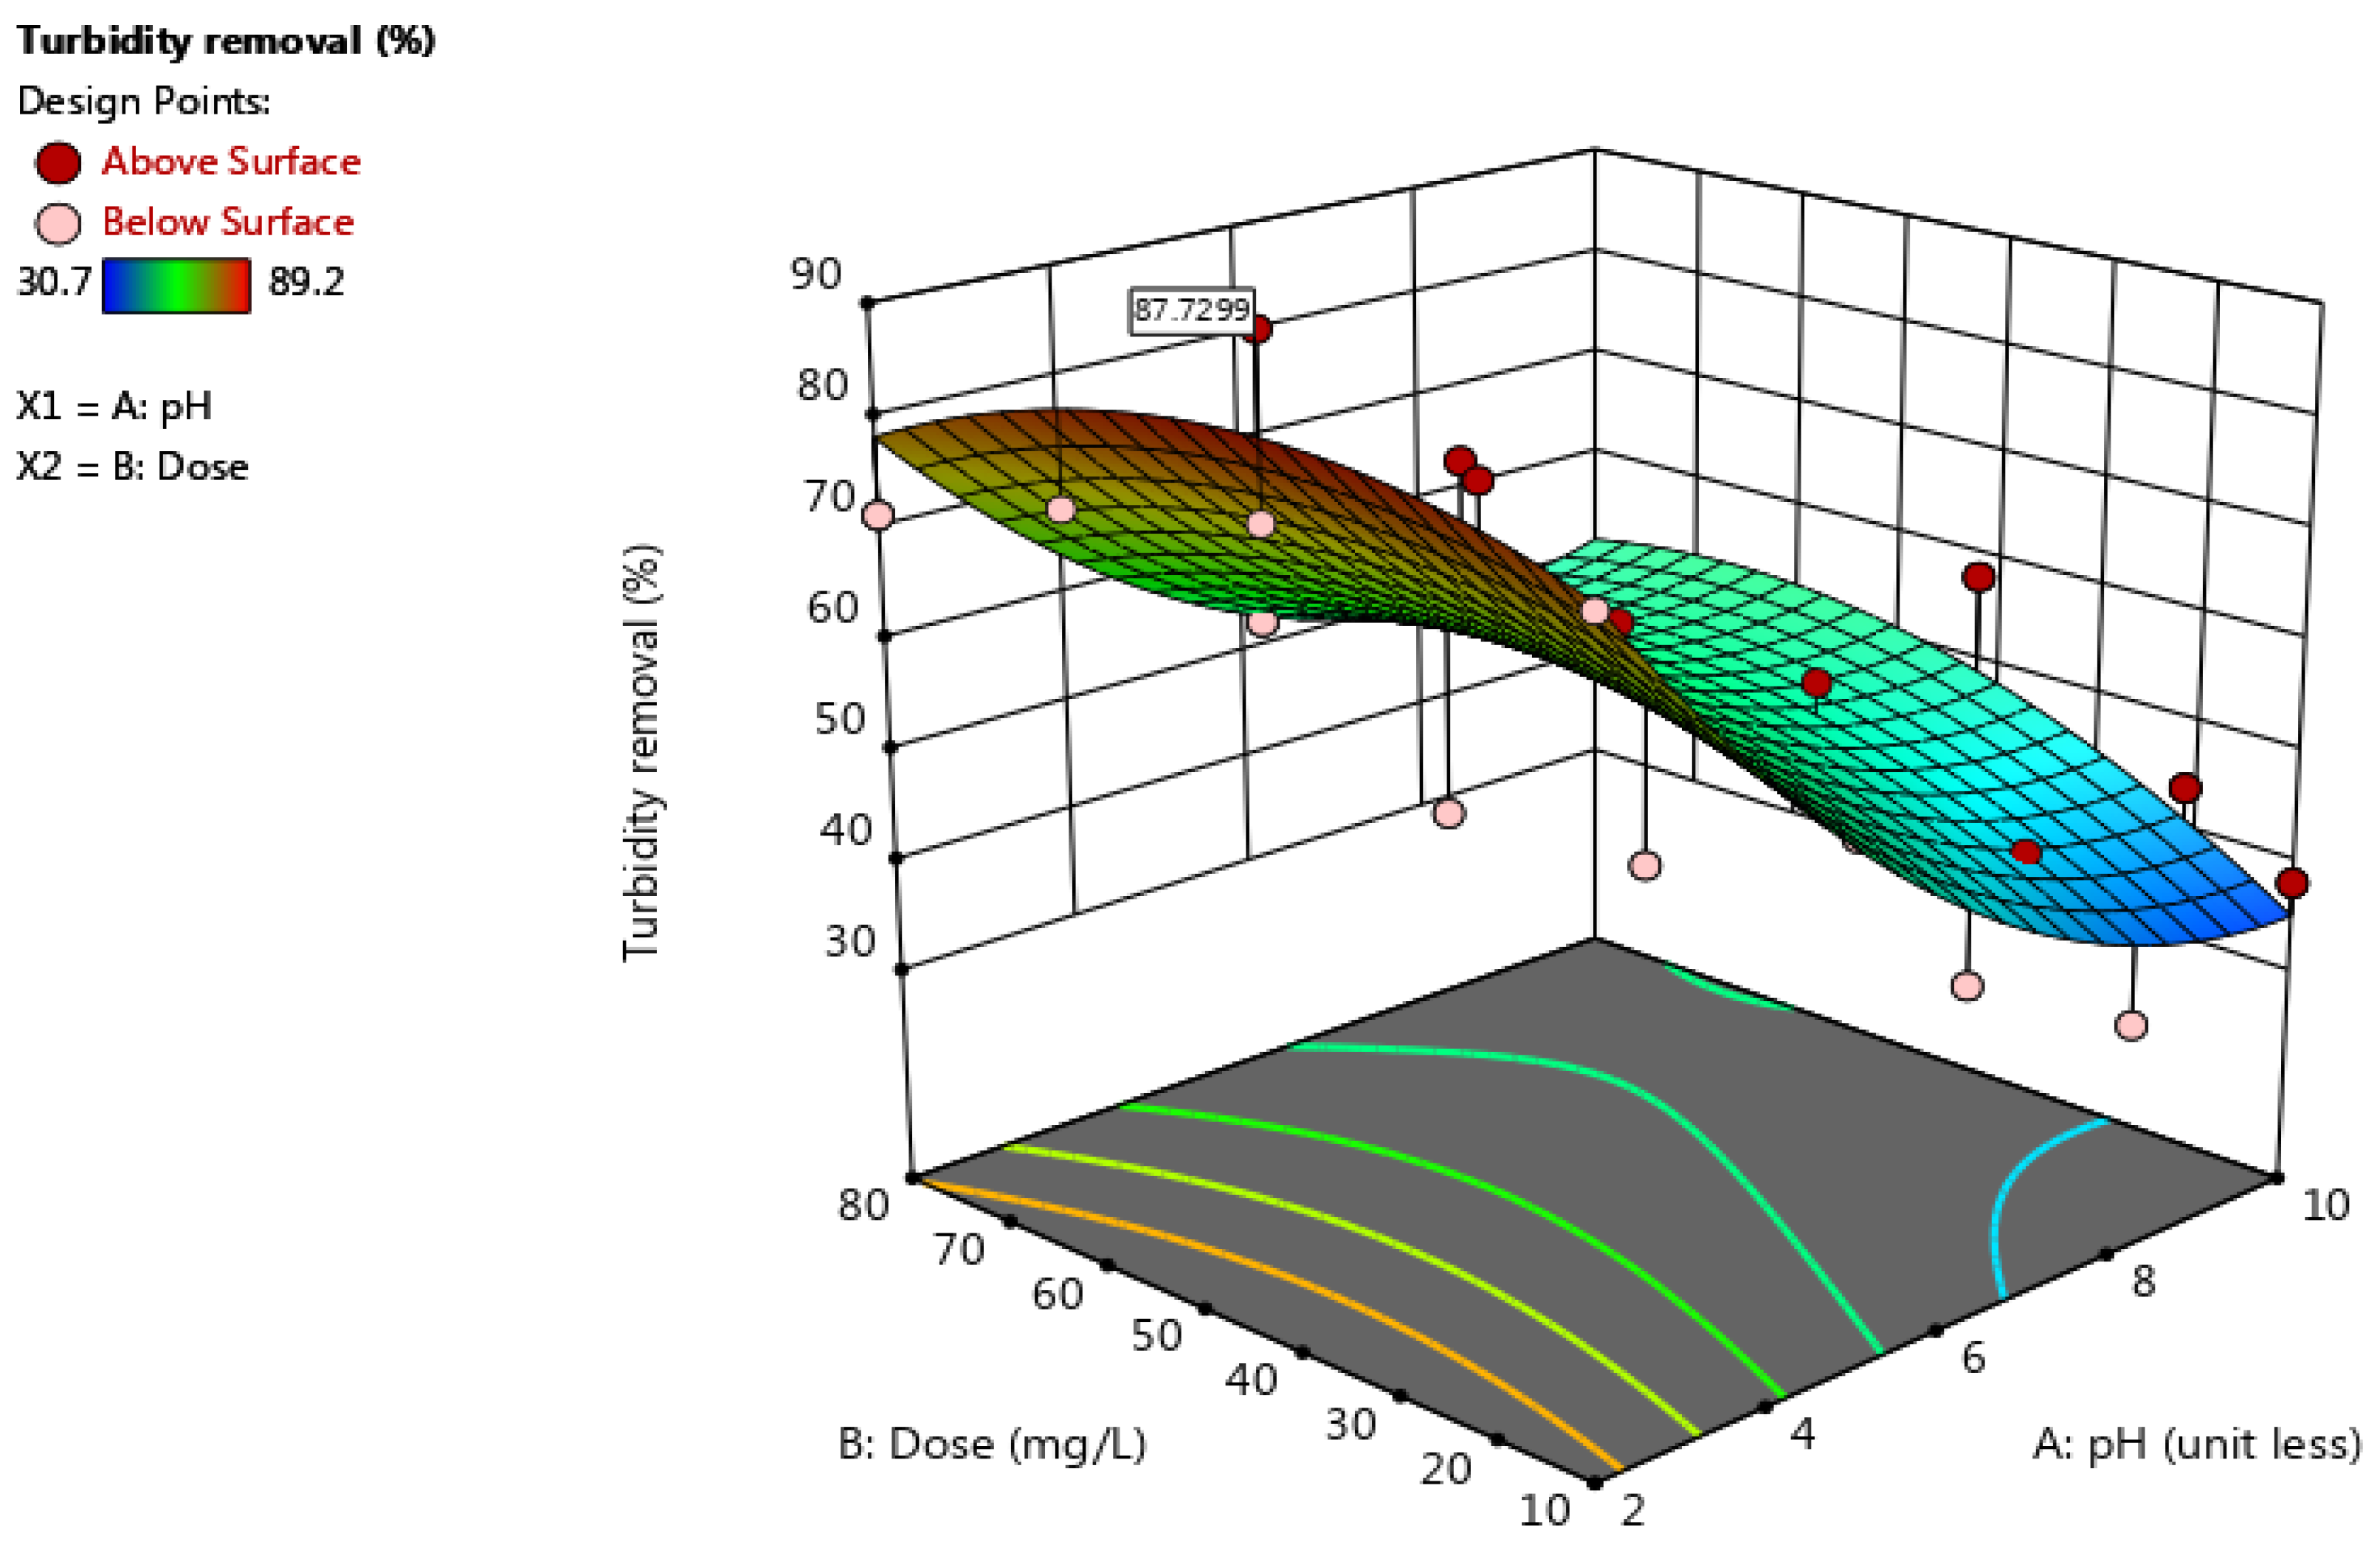
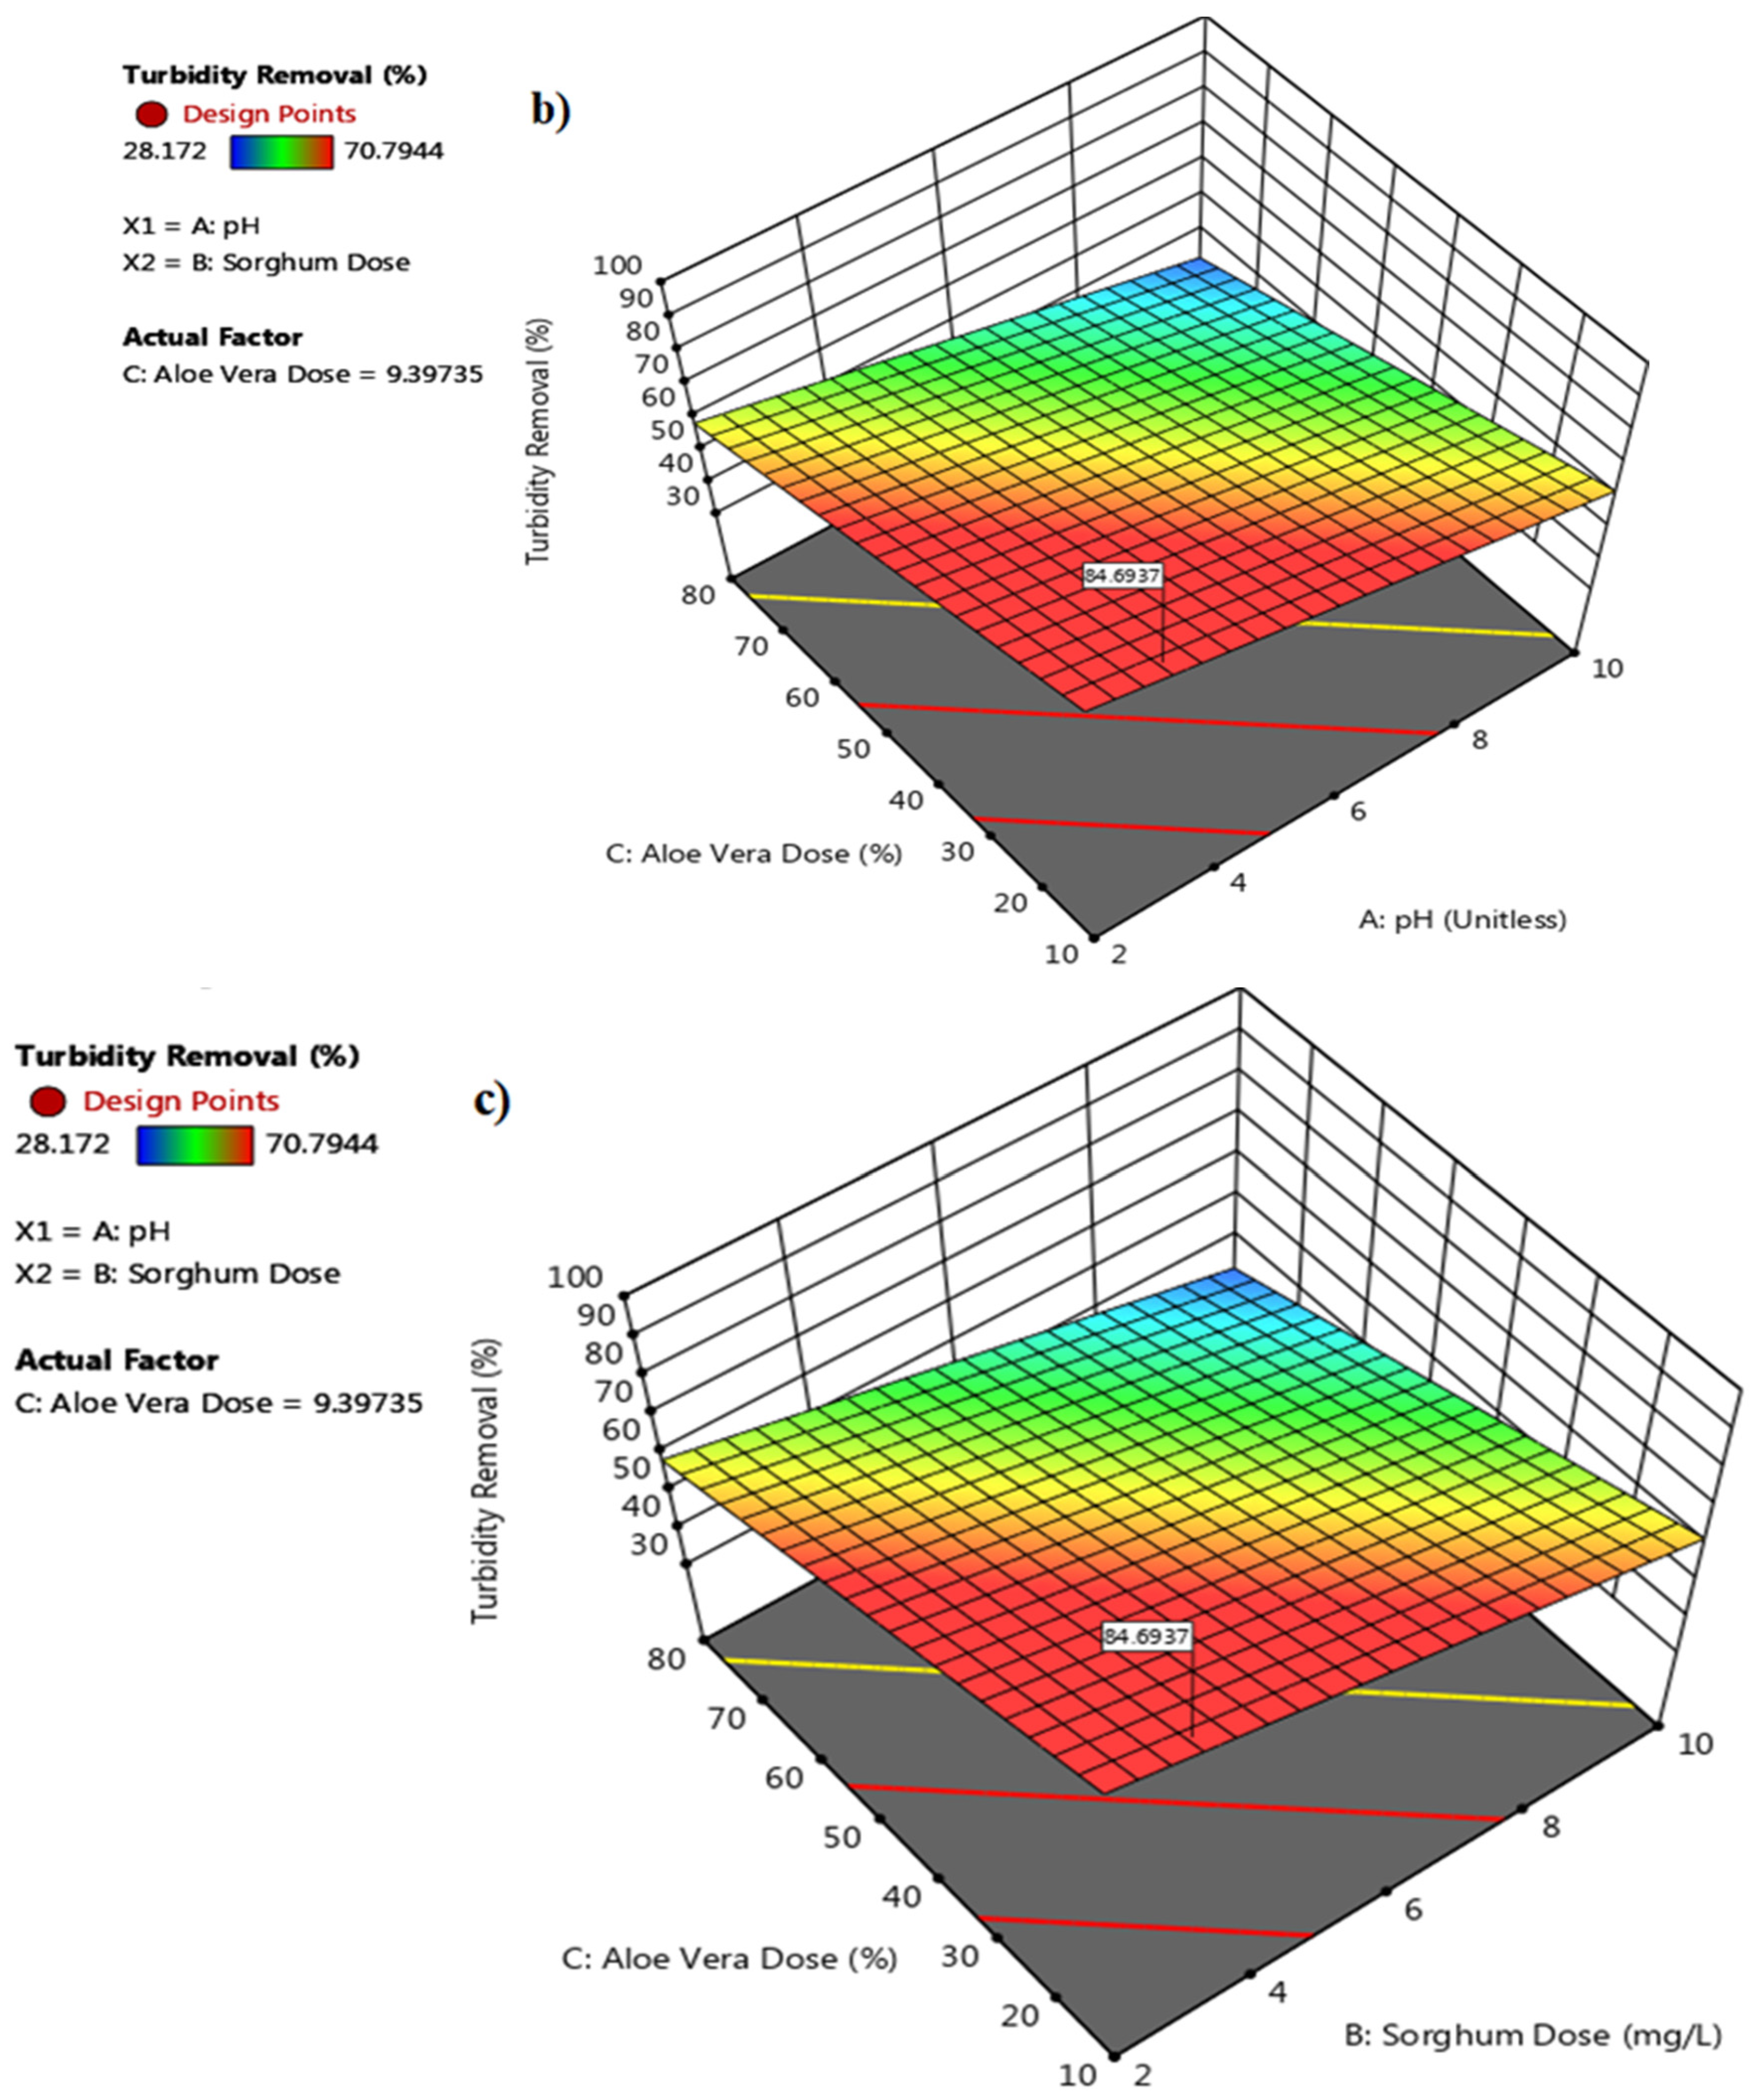
3.1.2. 3D Response Surface Plot for Sorghum Performance

A 3D response surface plot was developed for the selected quadratic model, which represents the turbidity removal (from canal water) for the Sorghum coagulant, as shown in Figure 2. The contour lines at the bottom show the interaction of the treatment variables (pH and dose) and their effects on the response variable (turbidity removal).
The maximum turbidity removal by the Sorghum coagulant was 87.73% at pH 2, and the Sorghum dose was 40 mg/L. A significant decrease in turbidity removal efficiency with the increase in pH was observed. The colloidal particles carry negative charges [11], and the addition of hydrogen ions would likely have neutralized their negative charge (diffuse layer). This helped the particles to coagulate with each other and/or it reduced the valences of the particles to reduce the requirement of binding sites of the coagulant. The second plausible reason could be the neutralization of negatively charged sites of the coagulant due to the addition of hydrogen ions, which resulted in reduced repulsive forces and helped in increasing the adsorption and/or interparticle bridging with the particles. Coagulation activity decreased at higher doses, which is typical due to the charge neutralization process, showing that overdosing could re-stabilize the settled colloidal particles. Hence, lower doses would contribute to low treatment costs. The surface plot showed that turbidity removal was highly dependent upon the pH while having a negligible effect on the coagulant dose.
Mostly, the pH of surface water is in the range of 7–8.5 [25], and for supplying drinking water, it must be between 6.5 and 8.5 for effective disinfection (WHO guidelines). As Sorghum is efficient in an acidic range of pH, it is difficult to adjust the pH, especially in rural areas for the treatment of surface water. However, a substantial removal of turbidity at pH 4, pH 6, and pH 8 has proven its ability to be used as a coagulant at a neutral pH. The removal of 50–60% turbidity would save a lot of chemical coagulants in highly turbid surface water. Moreover, surface water with lower turbidity levels may have higher removal efficiencies for these pH and concentration ranges and must be evaluated in future studies.
However, at lower pH levels, it can also be effectively employed for the treatment of industrial wastewater. Future studies for industrial wastewater treatment using Sorghum are suggested to evaluate its effectiveness against the removal of different pollutants. However, its cost–benefit analysis and availability to be used on an industrial scale need to be assessed. For example, modified chitosan, enhanced with (3-chloro 2-hydroxypropyl) trimethylammonium chloride, was investigated as an eco-friendly coagulant for removing color and turbidity from industrial wastewater. The industrial wastewater had a dye (color) concentration of 1000 mg/L and turbidity of 60 NTU. Optimal conditions identified through RSM included a pH of 3 for color removal, with a 76% removal efficiency, and a pH of 5.66 for turbidity reduction, achieving a 90% efficiency [26]. These findings also demonstrate the bio-coagulant’s effectiveness in wastewater treatment. The optimal coagulant concentration identified was 3000 mg/L, significantly higher than that in the recent study, due to the coagulant’s role in removing other pollutants found in higher concentrations within industrial wastewater.
In addition to the RSM, the use of artificial intelligence (AI) algorithms [27], Artificial Neural Networks (ANNs) [28], and Fuzzy Logic [27] has transformed the optimization process for both bio-based and conventional coagulants in water treatment. GAs optimize coagulant mixes and dosages by handling complex variables [27], while ANNs accurately model and predict the outcomes of the coagulation process, including dosage effects on water quality parameters such as pH and turbidity [28]. FL, on the other hand, is crucial for managing the uncertainties and variability in water treatment, thereby optimizing the coagulation process for industrial wastewater streams. Collectively, these AI techniques advance the development of more sustainable, efficient, and cost-effective water treatment strategies, supporting the global pursuit of enhanced environmental protection and public health [29].

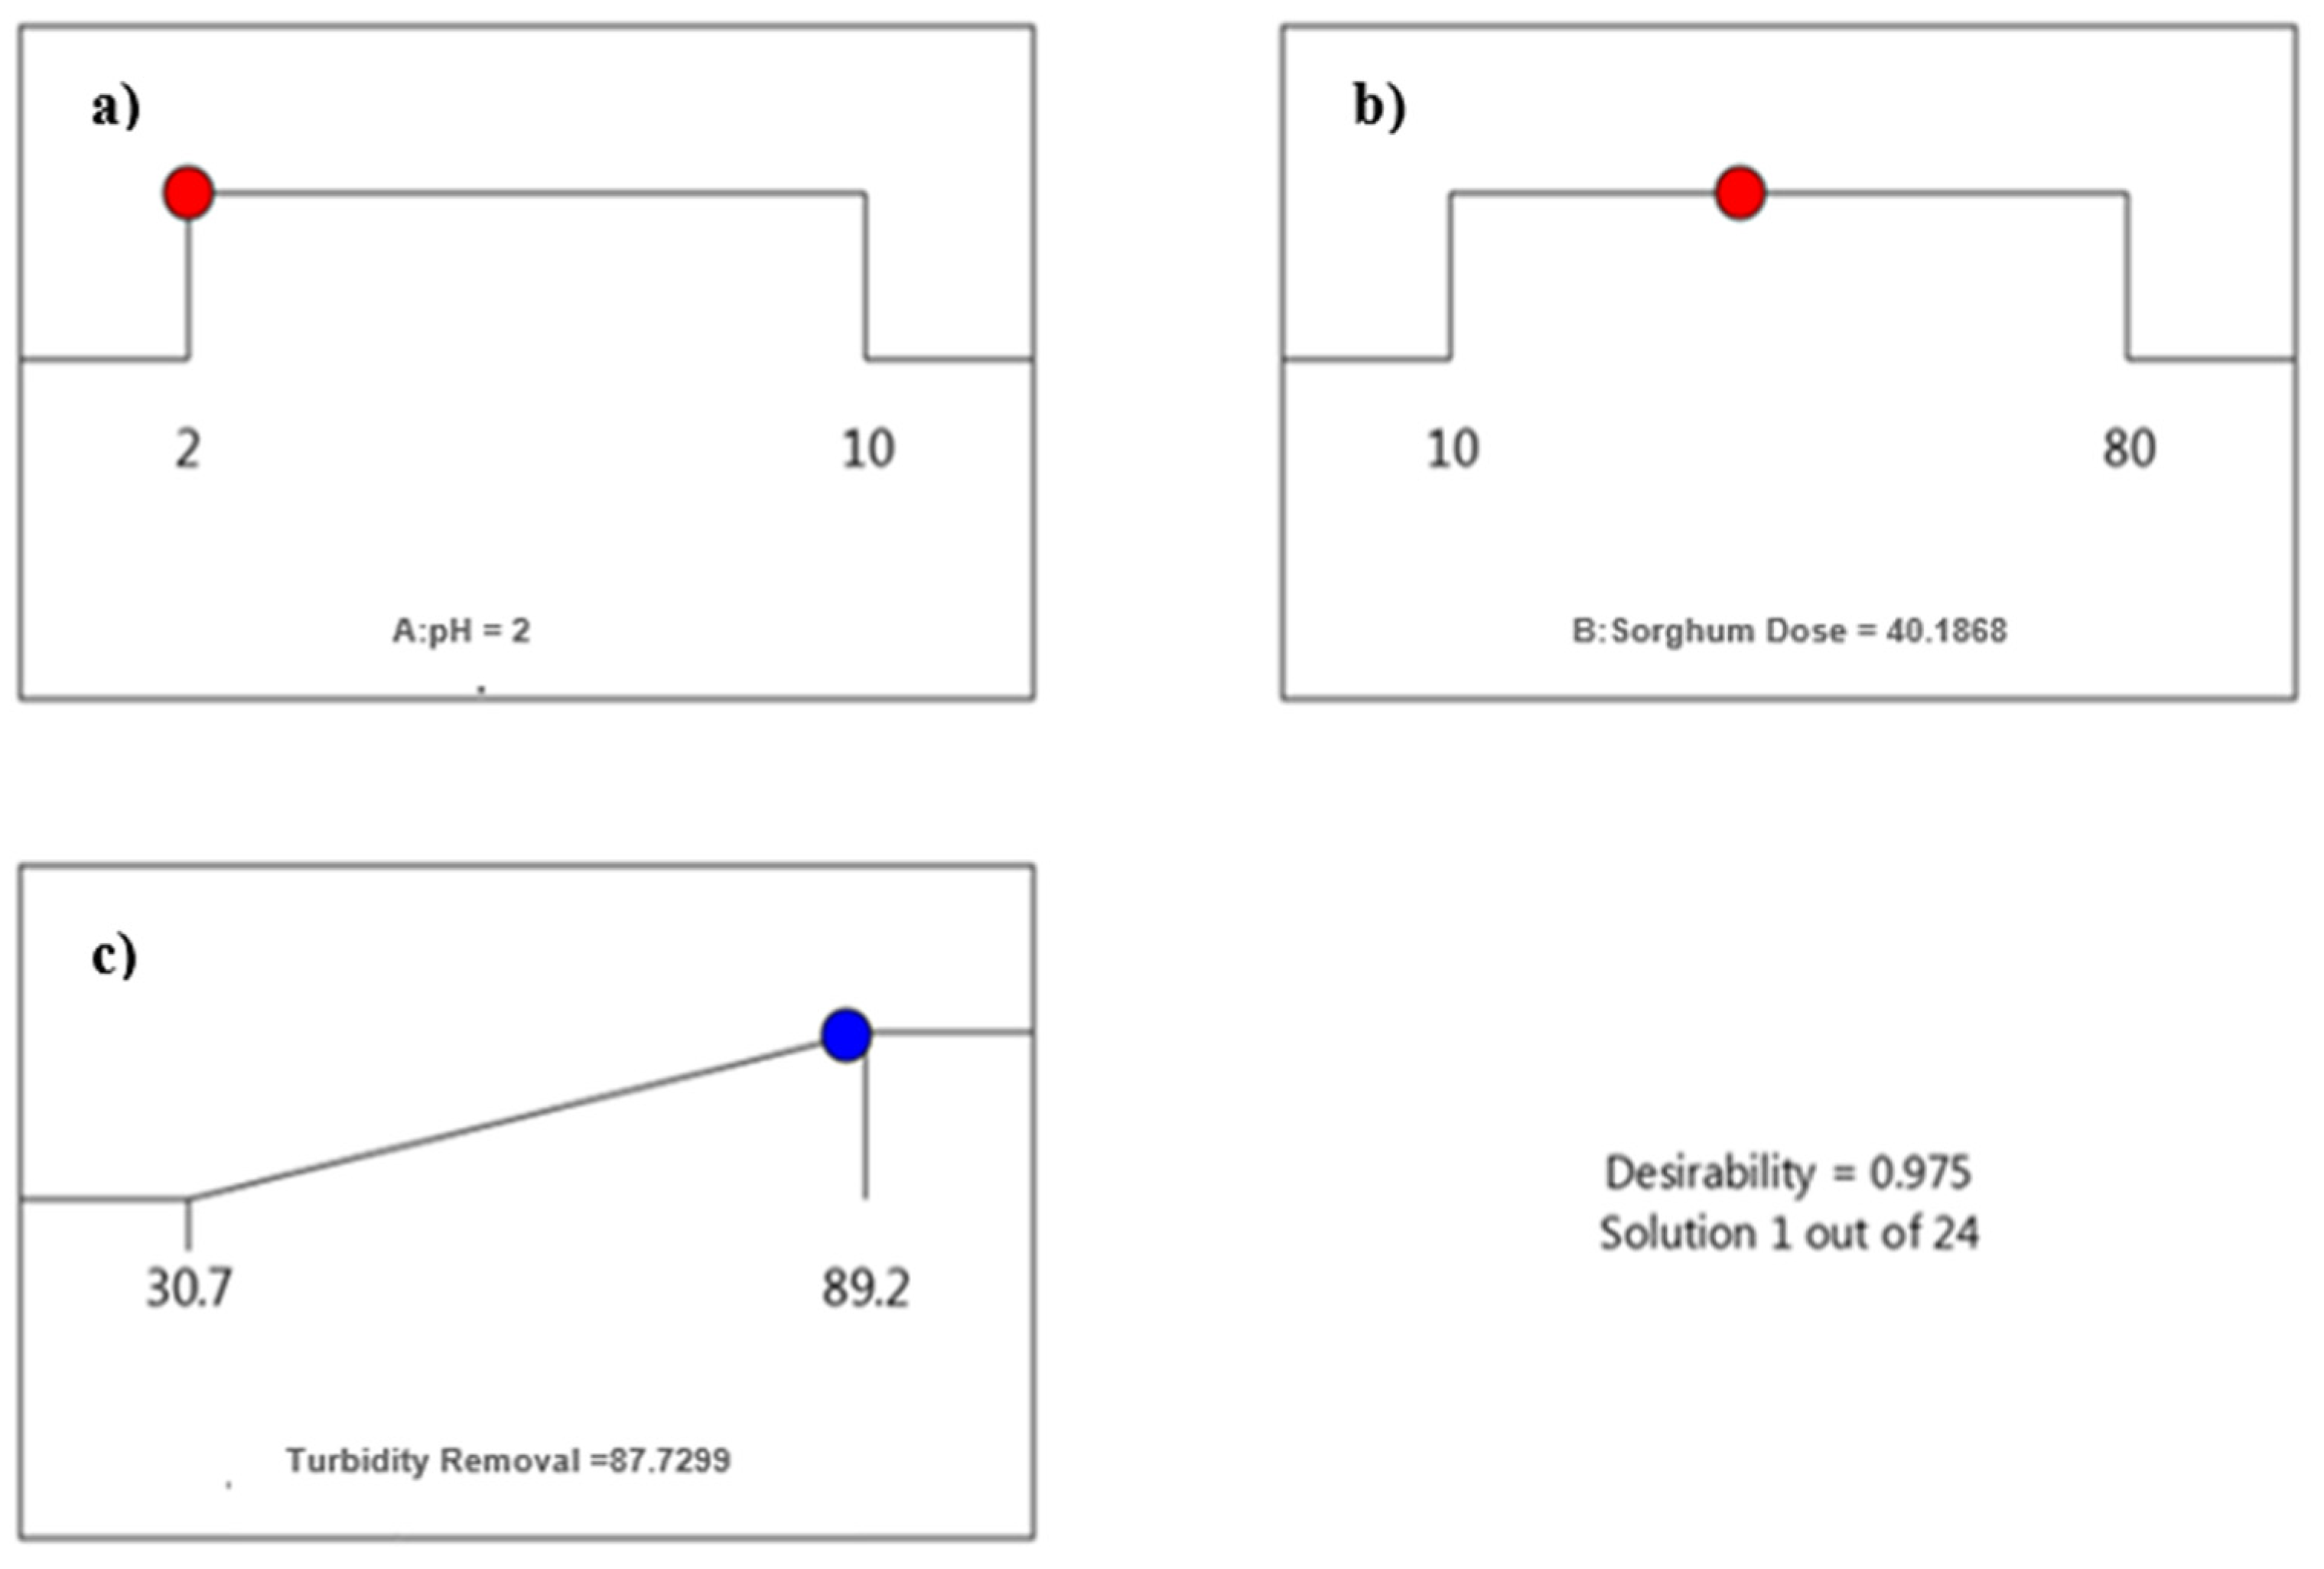
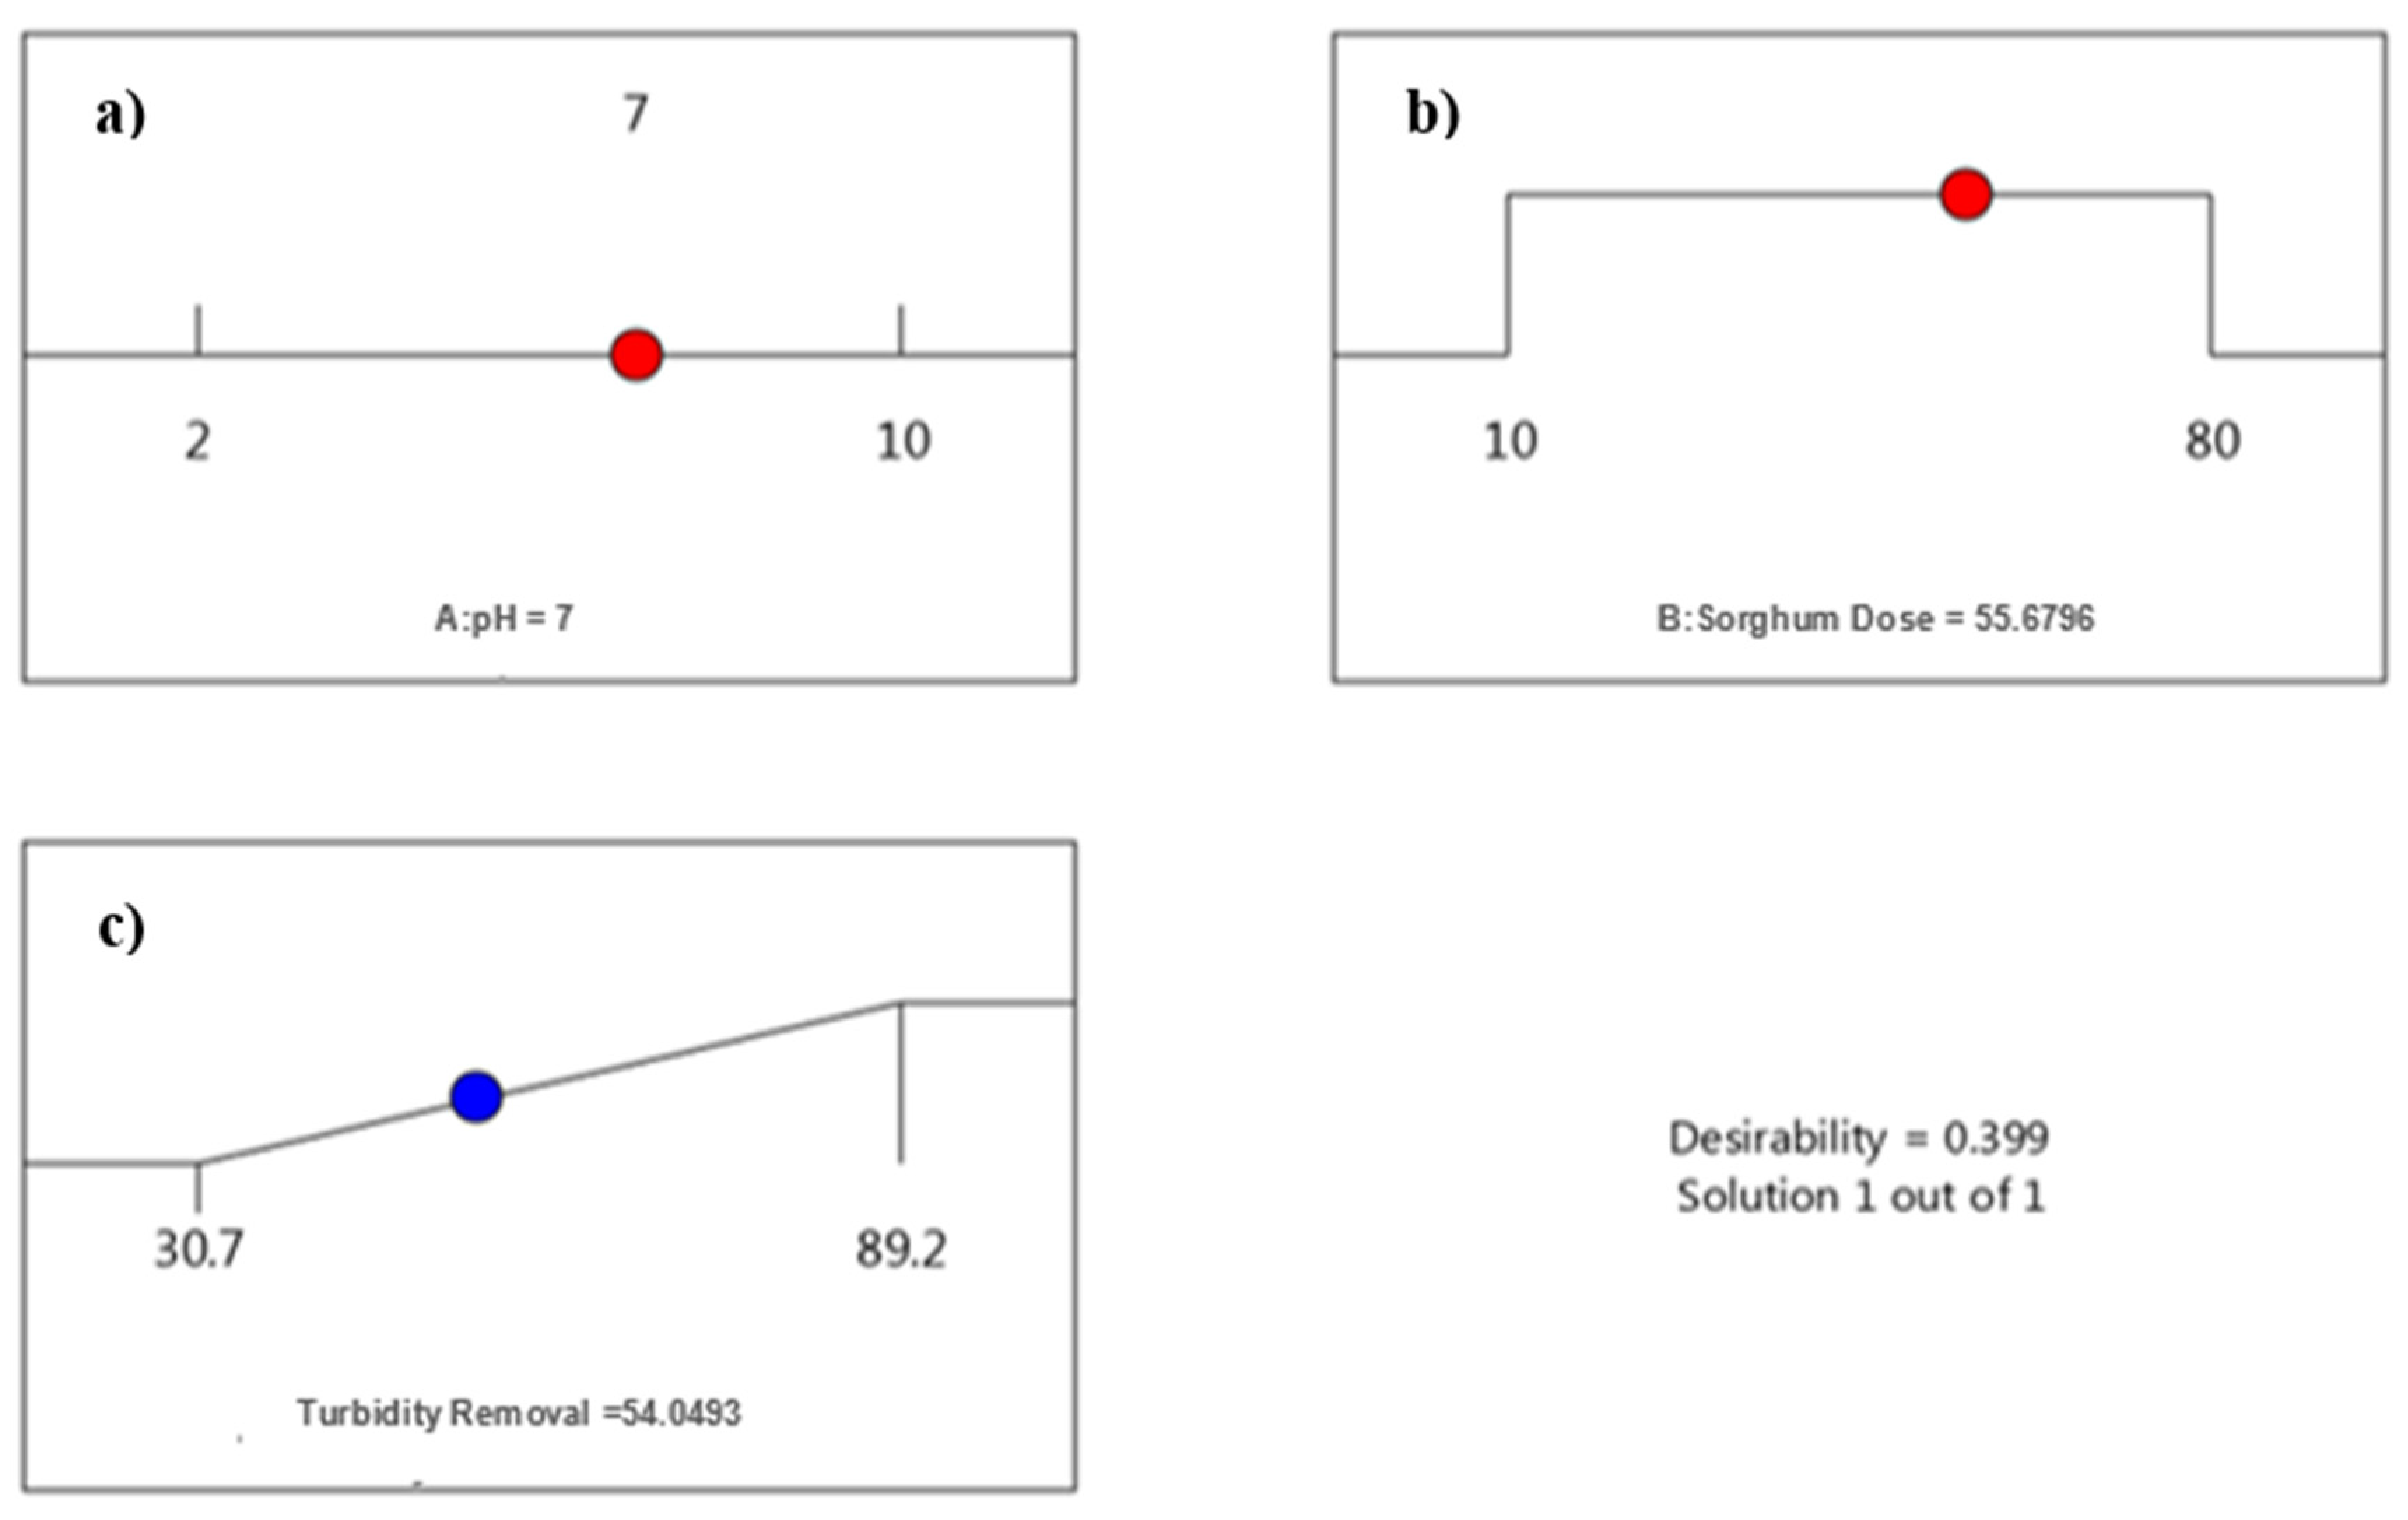
3.1.3. Optimization of pH and Dose for Sorghum

The desirability function of DOE was used for the optimization of the treatment variables (pH and dose). The target variable (turbidity removal) was set as the maximum goal, while the treatment variables (pH and dose) were set as ranges. The optimum obtained results are shown in Figure 3. The maximum turbidity removal was 87.73% at pH 2 and a dose of 40 mg/L for Sorghum.
The maximum turbidity removal was slightly less than the achieved experimental value, i.e., 89.2%. However, this optimization is more reliable than the experimental value because it is based on the statistical model. It was reported that for pearl millet, the maximum removal of turbidity achieved was 99.2% (residual turbidity < 2 NTU) at pH = 2 and dose = 80 mg/L, while the optimum turbidity removal attained with black-eyed peas was 97.6% (residual turbidity < 5 NTU) at pH = 4 and dose = 20 mg/L. The Sorghum coagulant results are quite similar to those of the pearl millet because both coagulants have the best performance in the acidic range of pH [24]. Another study evaluated a bio-coagulant derived from Strychnos potatorum seeds. This coagulant type was experimented on synthetic turbid water samples containing kaolinites. Through experimental optimization of the coagulant dosage, retention time, and water pH using RSM, it was found that these new coagulants effectively reduced kaolinite turbidity by 93% under natural pH conditions (pH = 7) with a 70 min retention period and a dosage of 40.0 mg/L [30]. These results are comparable to the current study in terms of turbidity removal and dosage concentration.
However, the turbidity removal efficiencies achieved by Sorghum coagulants were expressively higher than many plant-based coagulants reported in the literature [11,31].
The optimum removal efficiency was achieved at pH 2, which is not practically suitable for surface water treatment. Therefore, turbidity removal was also investigated within the natural pH range of surface water (7–8.5). The maximum turbidity removal was 54.04% at pH 7 and at a dose of 55.6 mg/L (Figure 4).

3.1.4. Analysis of Variance (ANOVA)

ANOVA results for the Sorghum model and factors are presented in Table 5. The p-value denotes the implication of the model and its terms. The significance level of alpha (α) 0.05 used corresponds to a 95% confidence level. A p-value < 0.05 (significance level) indicates that the model terms are significant. Conversely, if the p-value is >0.05, the model term is considered not significant. The model p-value (0.0001) is less than 0.05 and the model F-value (12.49) is greater than the F-critical value (2.74), which shows that the quadratic model is statistically significant at a 95% confidence level.

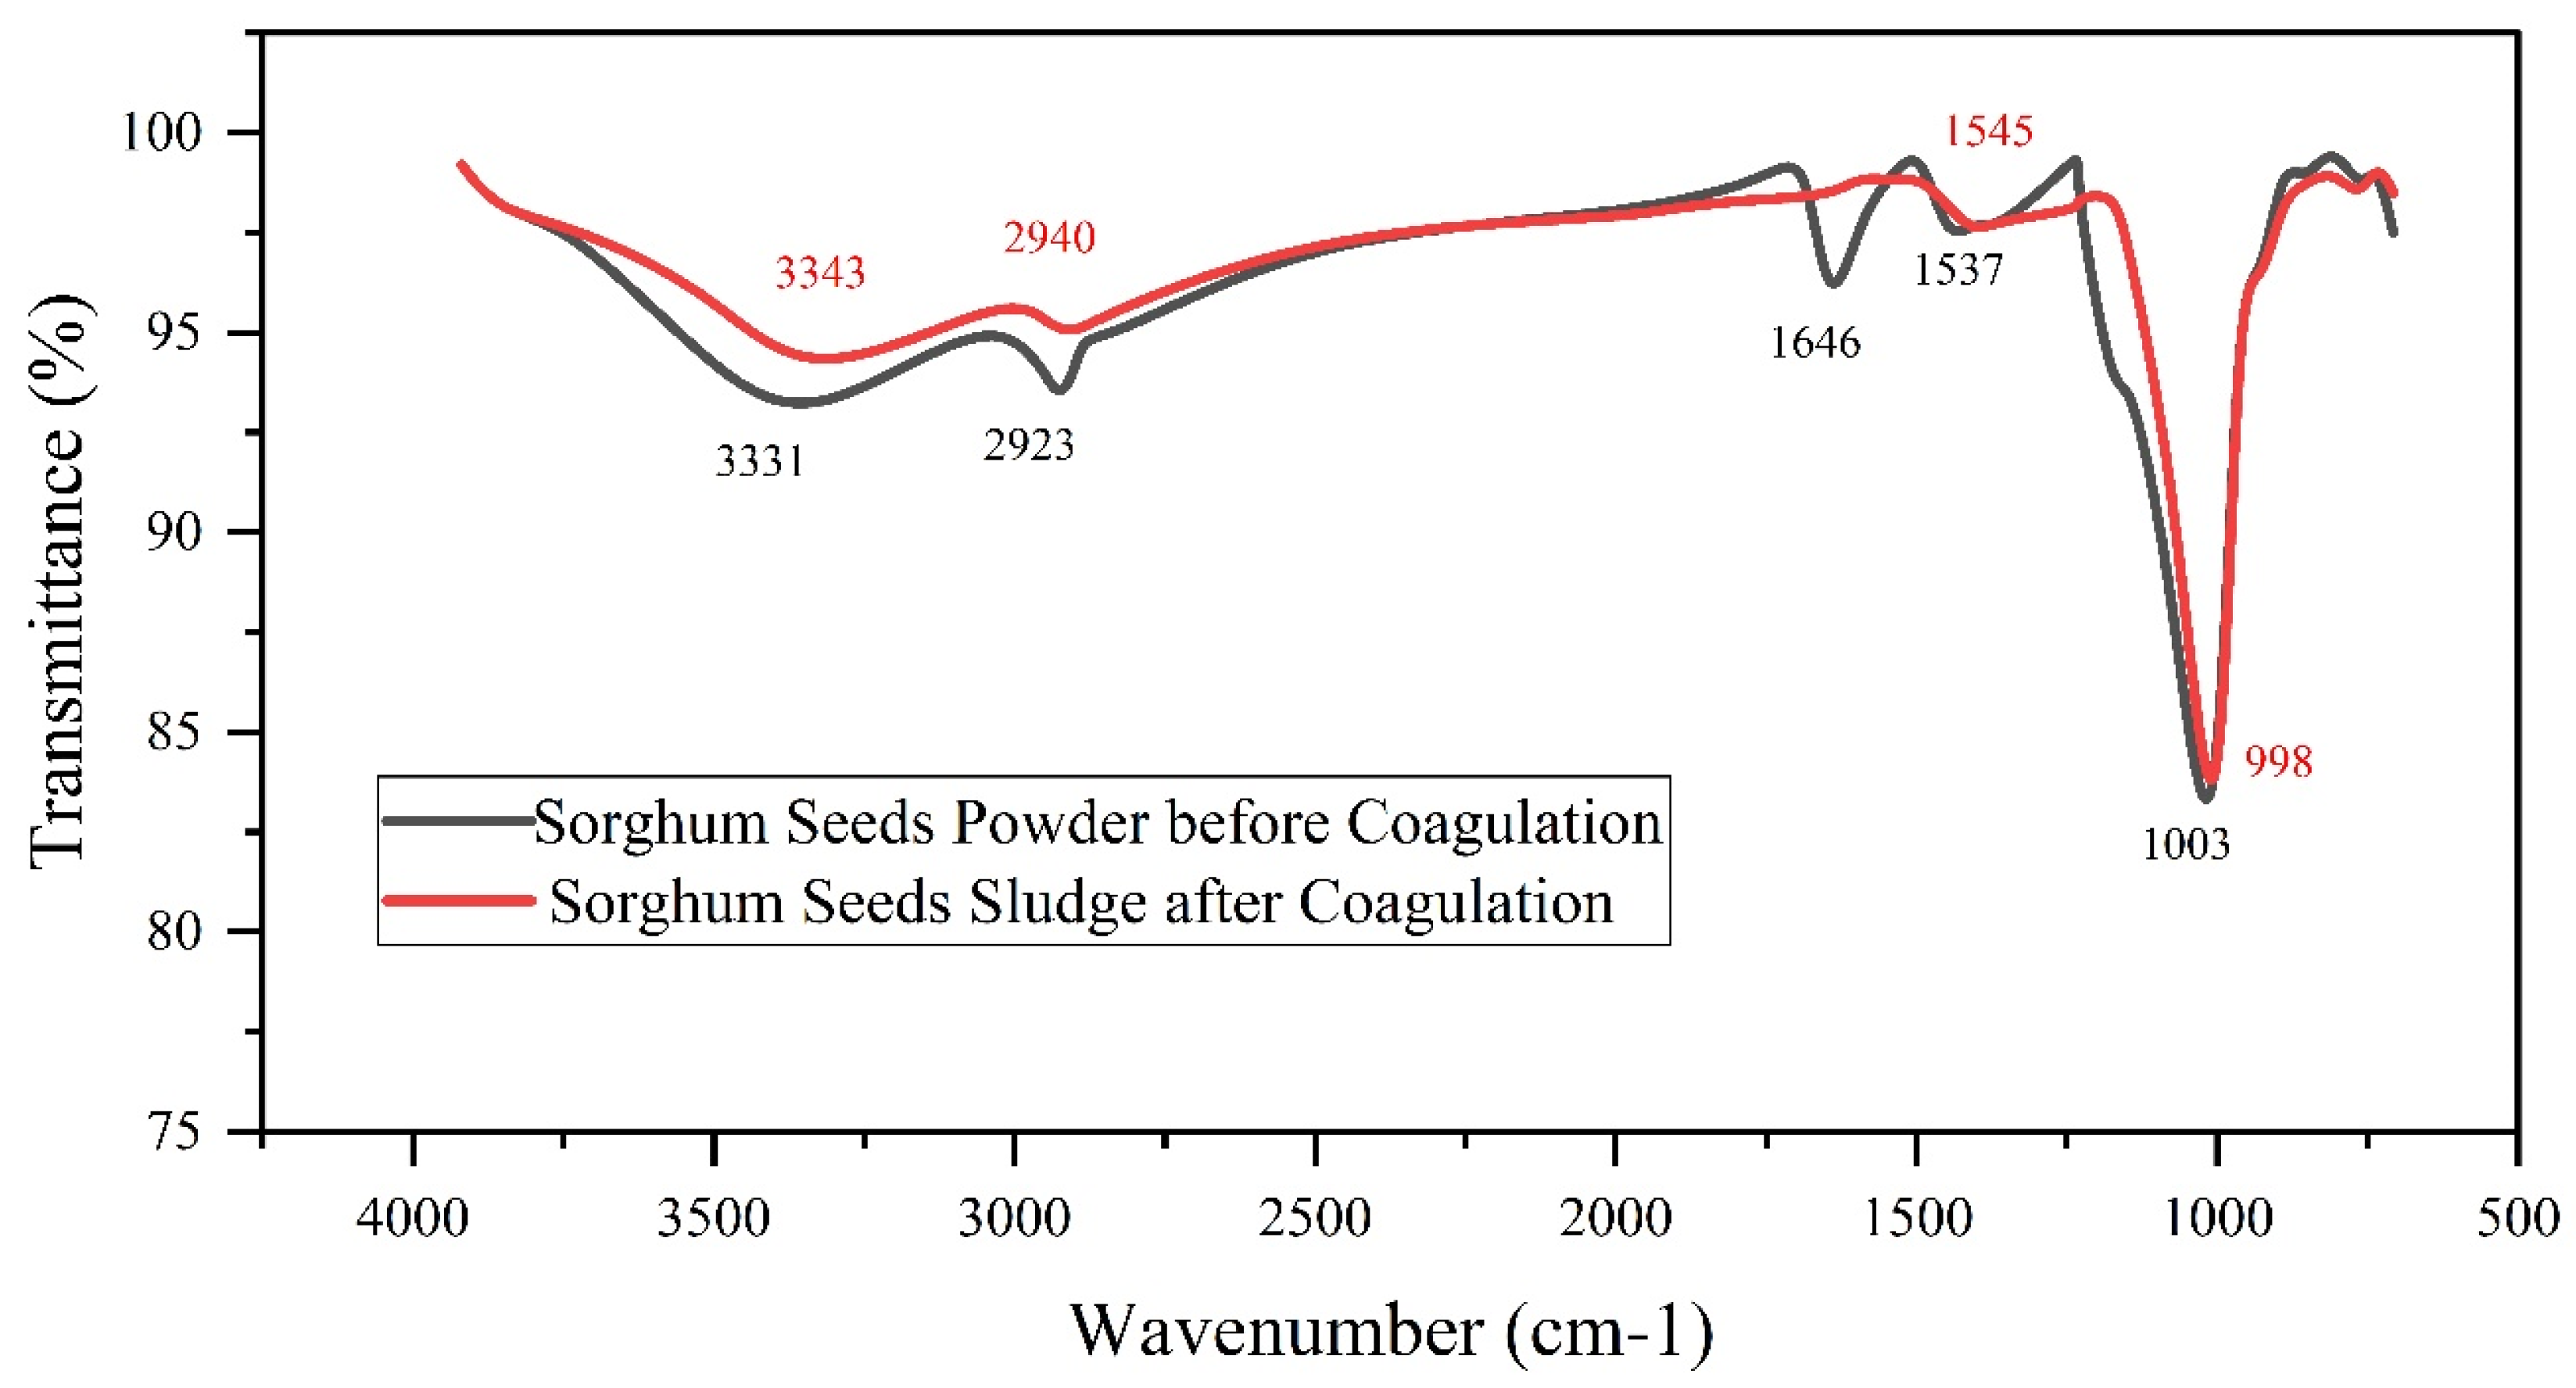
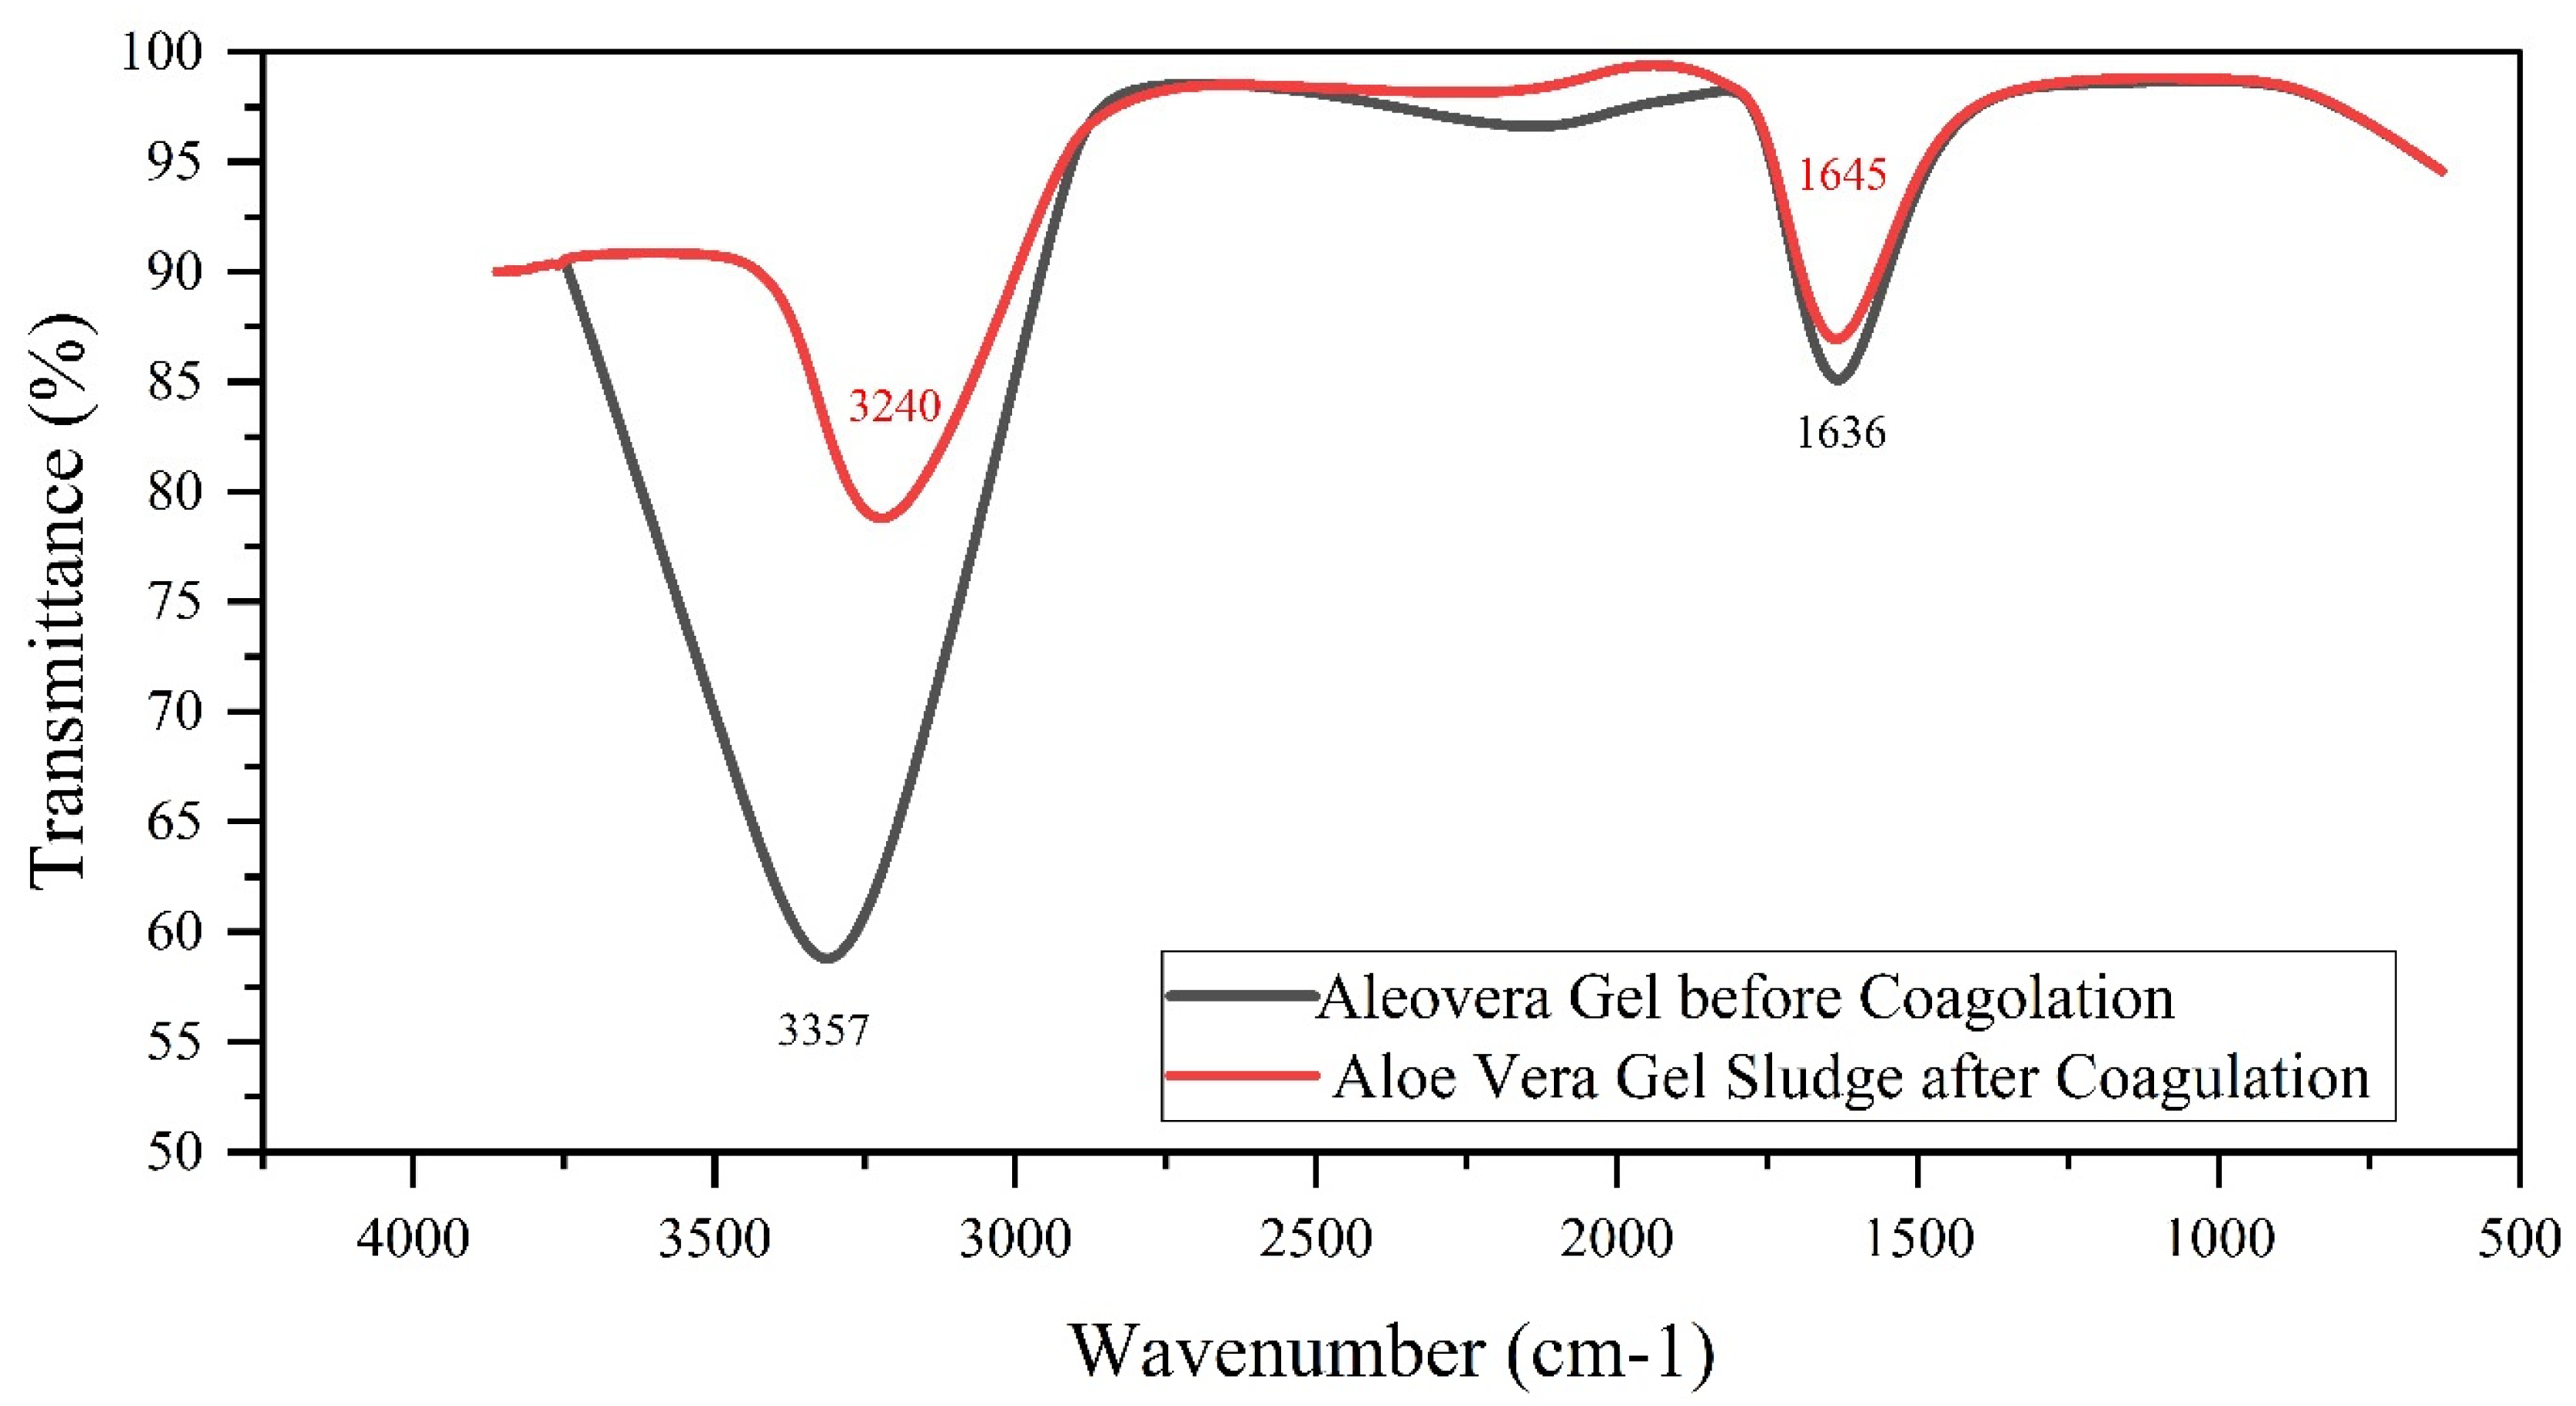
3.2. Identification of Functional Groups through FTIR Analysis

FTIR analysis was performed to determine the functional groups present in both coagulants.

3.2.1. FTIR Analysis of Sorghum Powder

Spectra of the FTIR analysis for Sorghum powder before treatment and Sorghum sludge after treatment are presented in Figure 5. In Figure 5, the peaks at 3331.57 cm−1 are linked with the presence of N-H stretching (characteristic of amines) [32]. The peaks around 2923.6 cm−1 are associated with the presence of carboxylic acid, i.e., C-H stretching, whilst 1646.66 cm−1 is attributed to the amide bond which corresponds to the carbonyl (C=O) group. Similarly, 1537.64 is attributed to the presence of the alkanes group, i.e., C-H bending.
The comparison presented in Figure 5 suggests a notable resemblance between the spectra of Sorghum powder and the sludge after treatment. Shifts in transmittance were evident at the peaks located at 3331 cm−1 and 2923 cm−1 when contrasted with the sludge produced after treatment. This showed that suspended solids interacted with N-H stretching (amines) and C-H stretching (carboxylic acid) [33]. Additionally, the pronounced peak at 1646 cm−1, initially prominent in the Sorghum powder, displayed a reduction in intensity within the sludge produced after the treatment. This phenomenon underscores the interaction between Sorghum powder and the suspended solids following the treatment.
This additional peak also indicated the interaction between Sorghum and the suspended solids. It is supposed that the carboxyl group present in pearl millet provided adsorption sites for the suspended solids during the coagulation process [11]. Therefore, the coagulation mechanism seems to be adsorption.
The interaction suggests that the presence of functional groups, such as carboxylic, amine, and carbonyl groups, within the Sorghum powder potentially functioned as adsorption sites for the suspended solids during the coagulation process. This proposition finds support in the literature, where functional groups on natural coagulants have been identified as effective adsorption sites for impurities in water [34,35]. As a result, it is reasonable to infer that the coagulation mechanism is predominantly governed by the process of adsorption, as documented in previous studies [36].

3.2.2. FTIR Analysis of Aloe Vera Gel
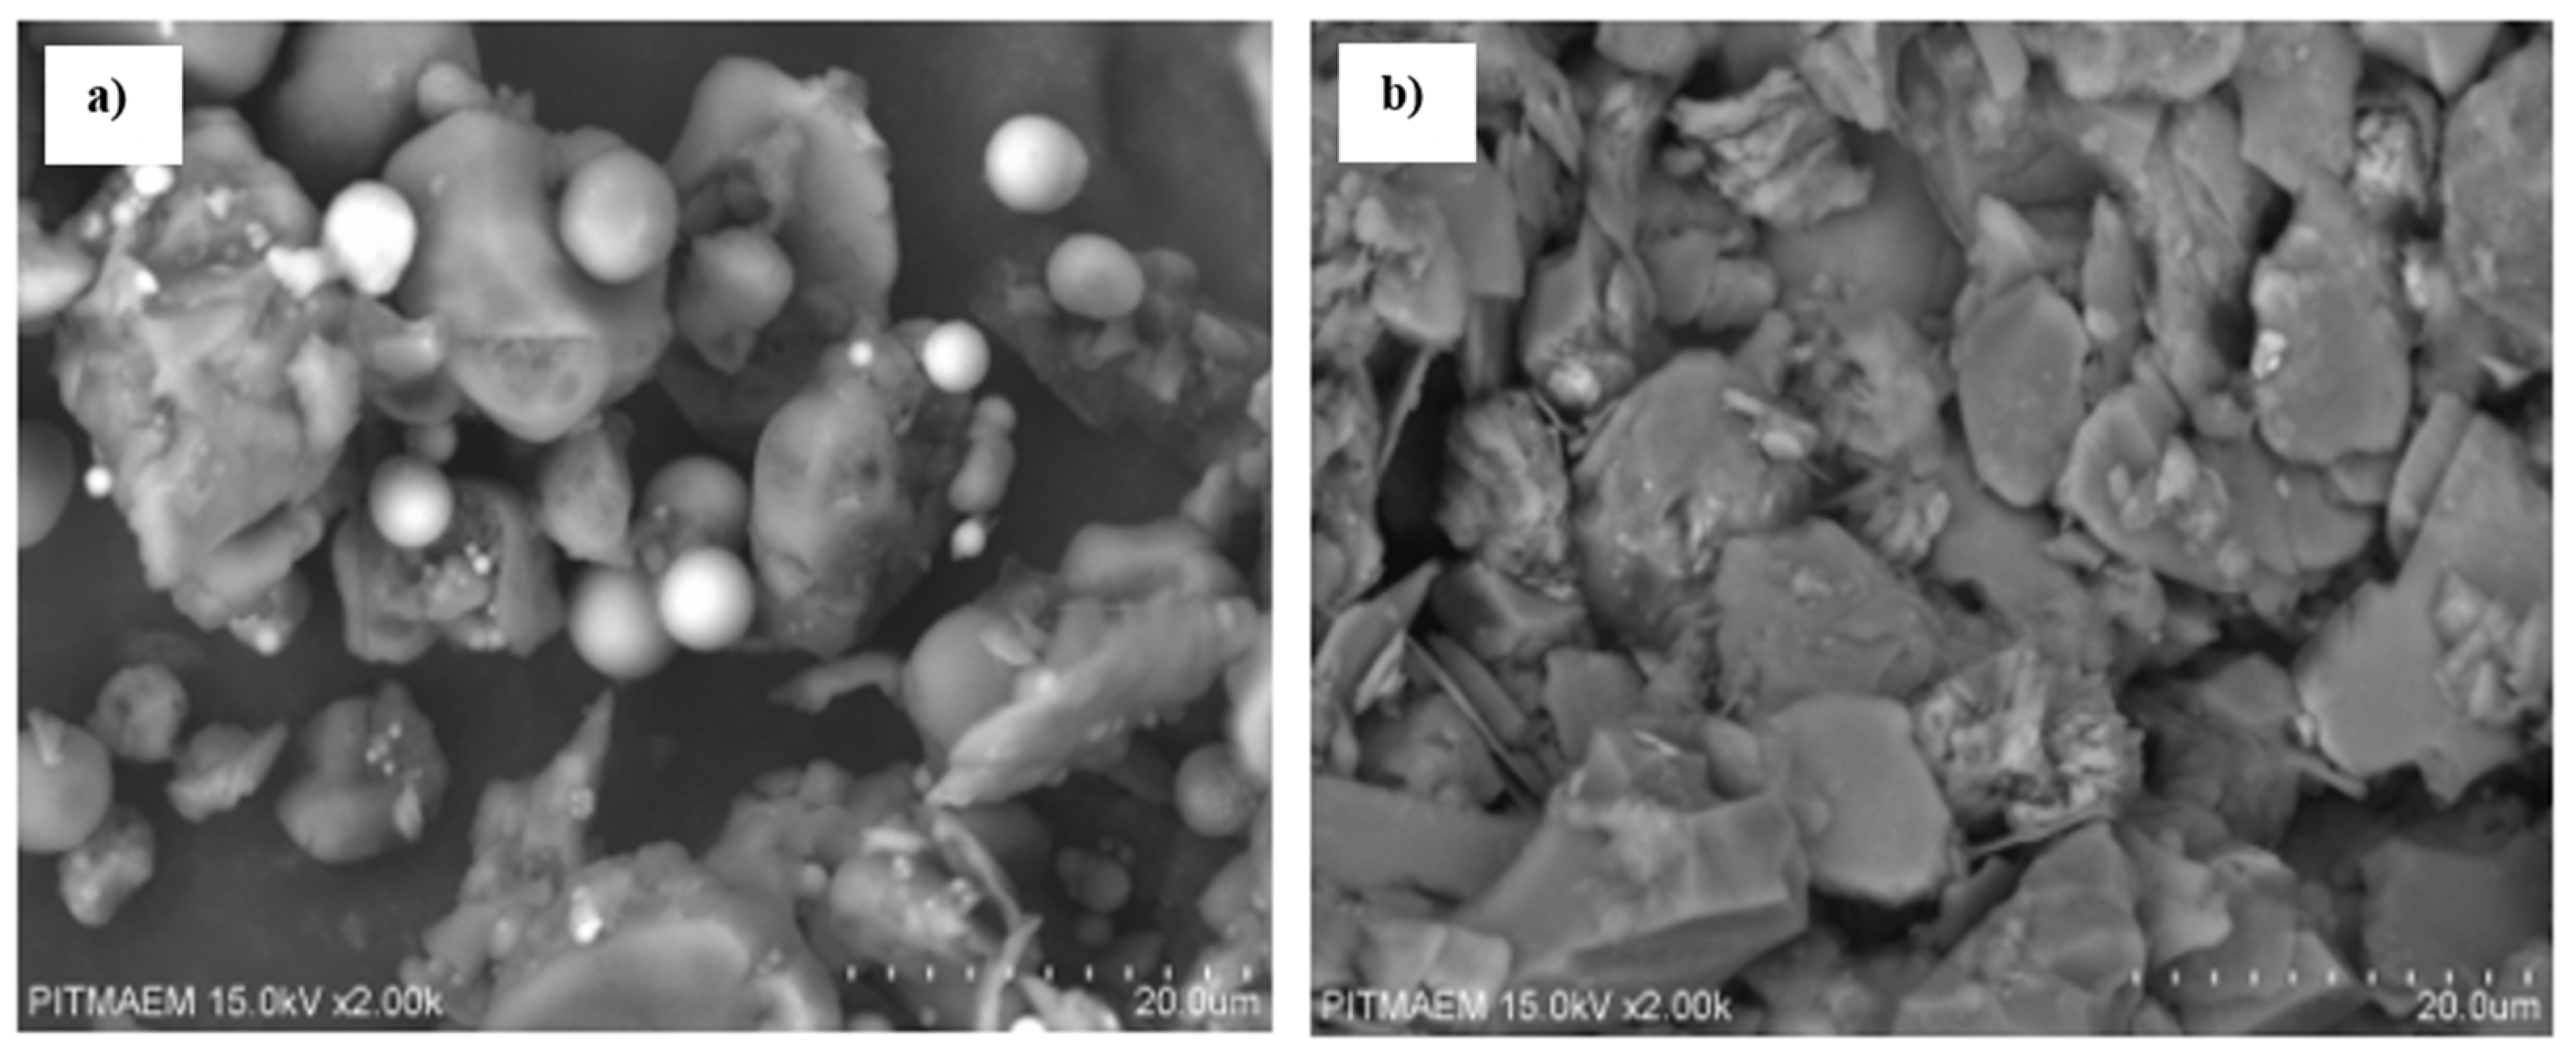
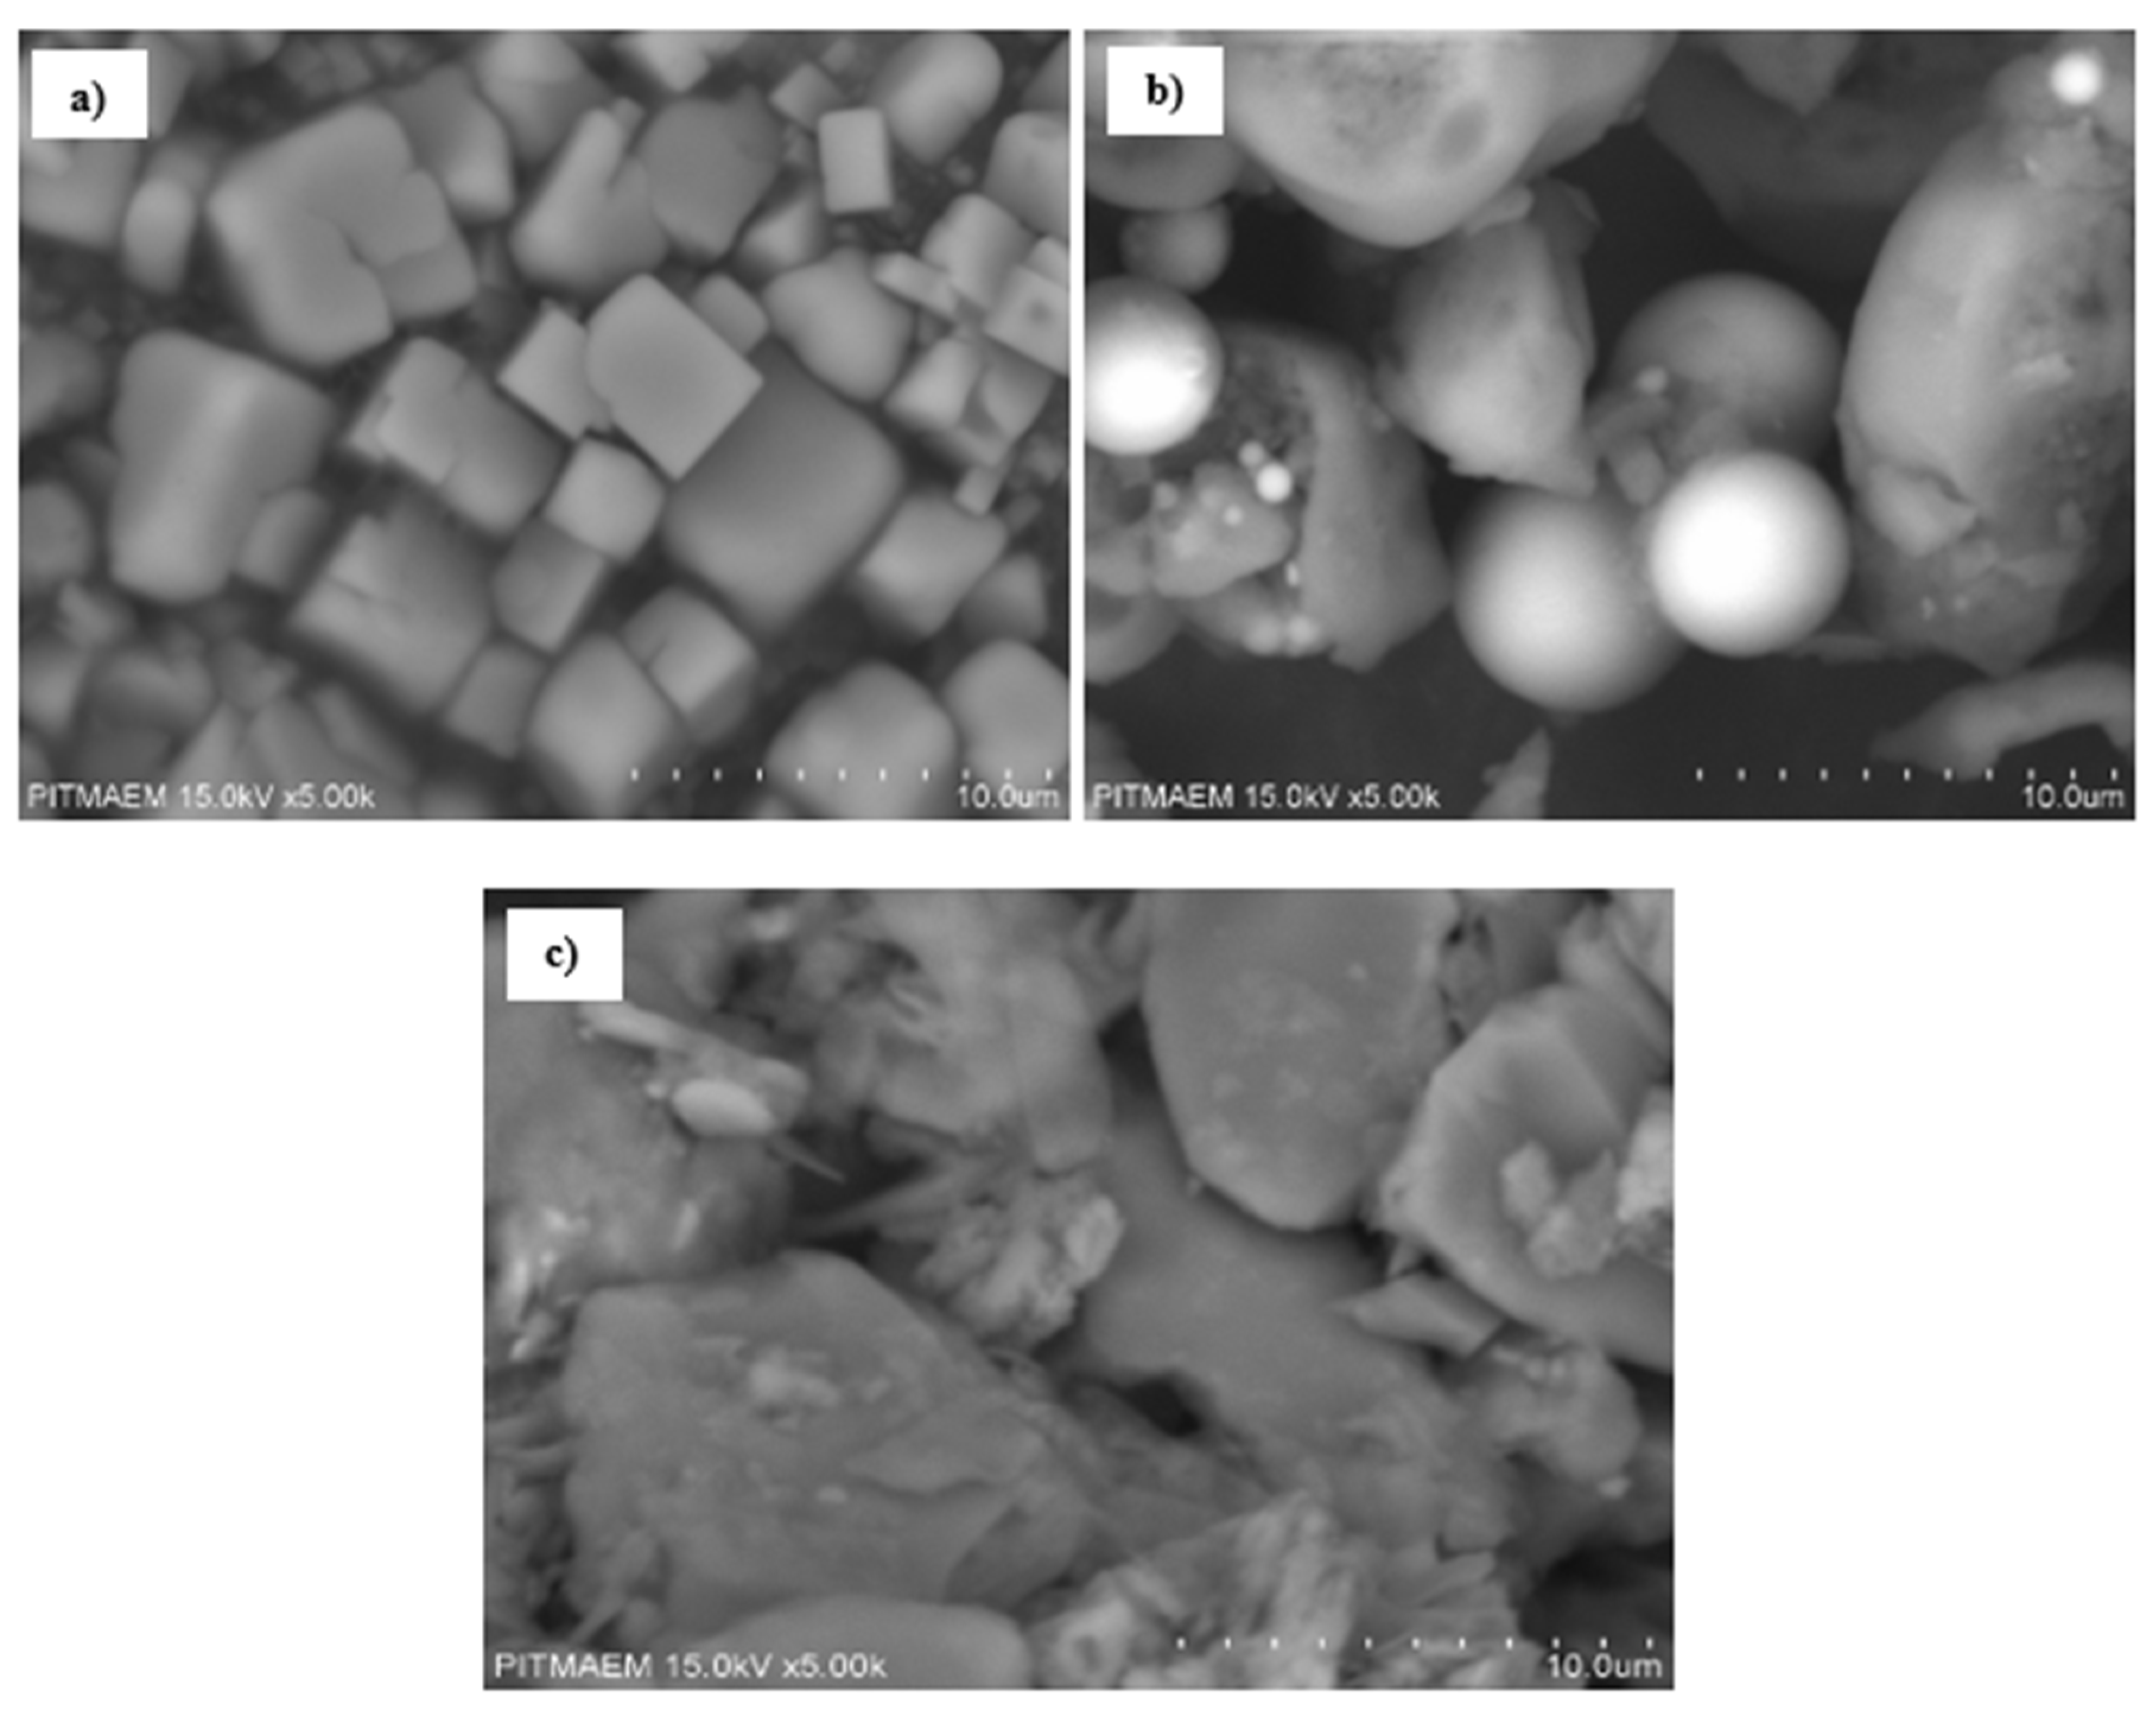
FTIR spectra of the Aloe Vera are shown in Figure 6; the Aloe Vera gel before treatment and the suspension sludge after treatment. The peaks at 3357.36 cm−1 show the presence of the amine group, i.e., N-H stretching (amine characteristic), while 1636.42 cm−1 is linked with the presence of C=O stretching. The spectra of Aloe Vera gel and the sludge produced after treatment (Figure 5) exhibit several similarities with each other. The prominent peak at 3357 cm−1, attributed to N-H stretching, observed before treatment, is notably diminished in the post-treatment sludge. This reduction could potentially arise from the establishment of intermolecular hydrogen bonding between the suspended particles and the coagulant aide (Aloe Vera gel), a phenomenon previously documented [37]. The occurrence of adsorption, facilitated by hydrogen bonding, is a possibility supported by previous studies [24,37,38]. As such, it is reasonable to infer that the coagulation mechanism for Aloe Vera also involves an adsorption process.

3.2.3. SEM Analysis

SEM analysis was performed on the Sorghum powder and the produced flocs to examine their surface morphology. The SEM images are in Figure 7. The image of the Sorghum seed powder (Figure 7a) showed spherical particles. However, the flocs produced after treatment (coagulation–flocculation–settling) were relatively compact and large, with the visible formation of aggregates (Figure 7b). Therefore, the increase in floc size is a sign of the formation of aggregates through the coagulation and flocculation processes.
The denser, more compact flocs that are slightly spherical characterize “sweep flocculation” [23]. The negligible effect of the coagulant dose (ANOVA, Table 5) on the performance of coagulation and visible precipitation of flocs during experimentation supports the sweep flocculation. Therefore, the coagulation mechanism undertaken by the Sorghum coagulant appears to be driven by adsorption and “sweep flocculation”.

3.3. Turbidity Removal by Sorghum with Coagulant Aid (Aloe Vera)

The overall turbidity removal efficiency along with Aloe Vera varied significantly from 28.2% to 70.8%, as shown in Table 6. The maximum turbidity removal was 70.8%, having a residual turbidity of 125 NTU at pH 4.

3.3.1. Statistical Analysis of Experimental Data (Sorghum with Coagulant Aid)

The experimental results were fitted into various models, as shown in Table 7. The quadratic model was aliased; hence, it was neglected for further comparison. The linear model seems more promising due to it having the lowest standard deviation, i.e., 8.98, and the lowest PRESS value (2276.07) when compared to other models. In addition, the linear model has the lowest difference between the adjusted and predicted R2 values, i.e., 0.082, which is less than the acceptable statistical analysis value, i.e., <0.2 [39]. Hence, the most suitable model to describe the experimental data for the Sorghum coagulant along with Aloe Vera (coagulant aid) is the linear model. The linear model equation for the performance of Sorghum along with the coagulant aid is represented in Equation (2).
T u b i d i t y   R e m o v a l % = + 47.25 13.90 A 15.50 B + 15.85 C
where A represents the pH, B is the Sorghum dose (mg/L), and C is the Aloe Vera dose (%). The above equation can be used to predict the turbidity removal for Sorghum (great millet) along with the coagulant aid, i.e., Aloe Vera, at any level of pH and dose.

3.3.2. 3D Response Surface Plot for Sorghum with Aloe Vera

A 3D response surface plot (linear model) was developed for the Sorghum coagulant along with Aloe Vera for the removal of turbidity and is presented in Figure 8a–c. The maximum turbidity removal by Sorghum along with Aloe Vera was almost 84.7% at pH 2.7, which is highly acidic. The turbidity removal efficiency significantly decreased with the increase in pH. A lower Sorghum coagulant dose (17.1 mg/L) and a high Aloe Vera dose of 0.9% produced greater turbidity removal.

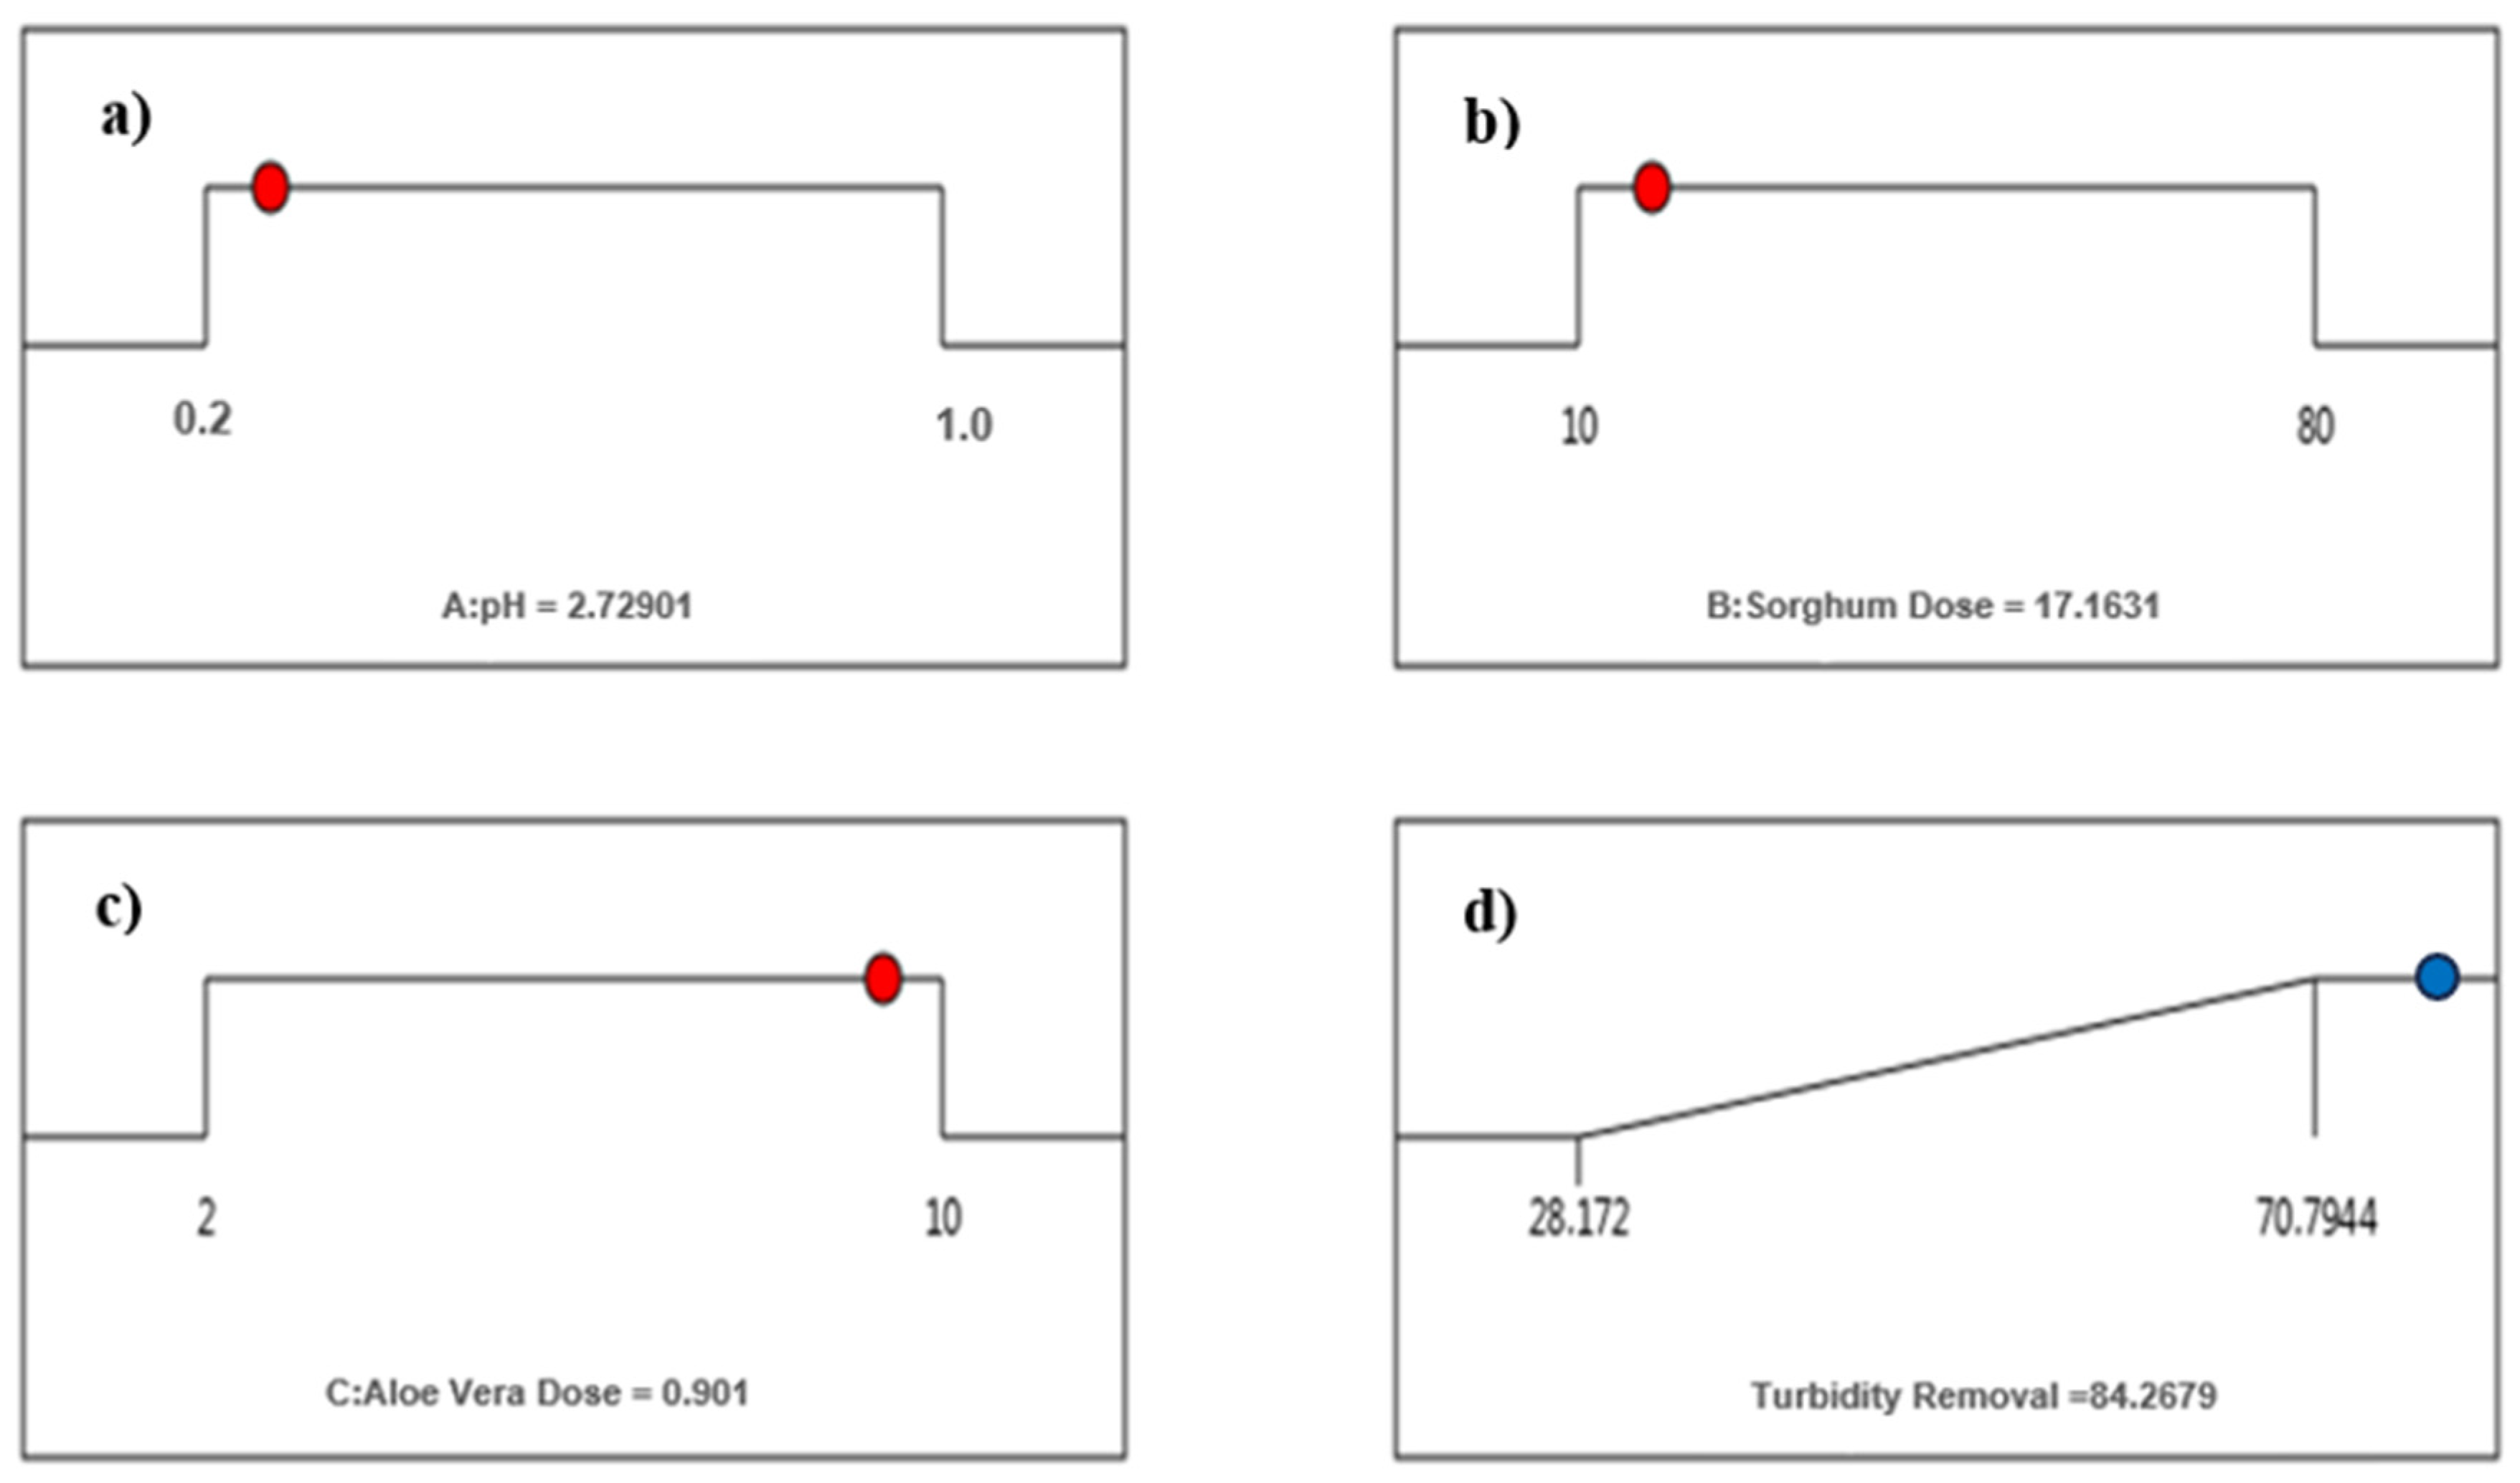
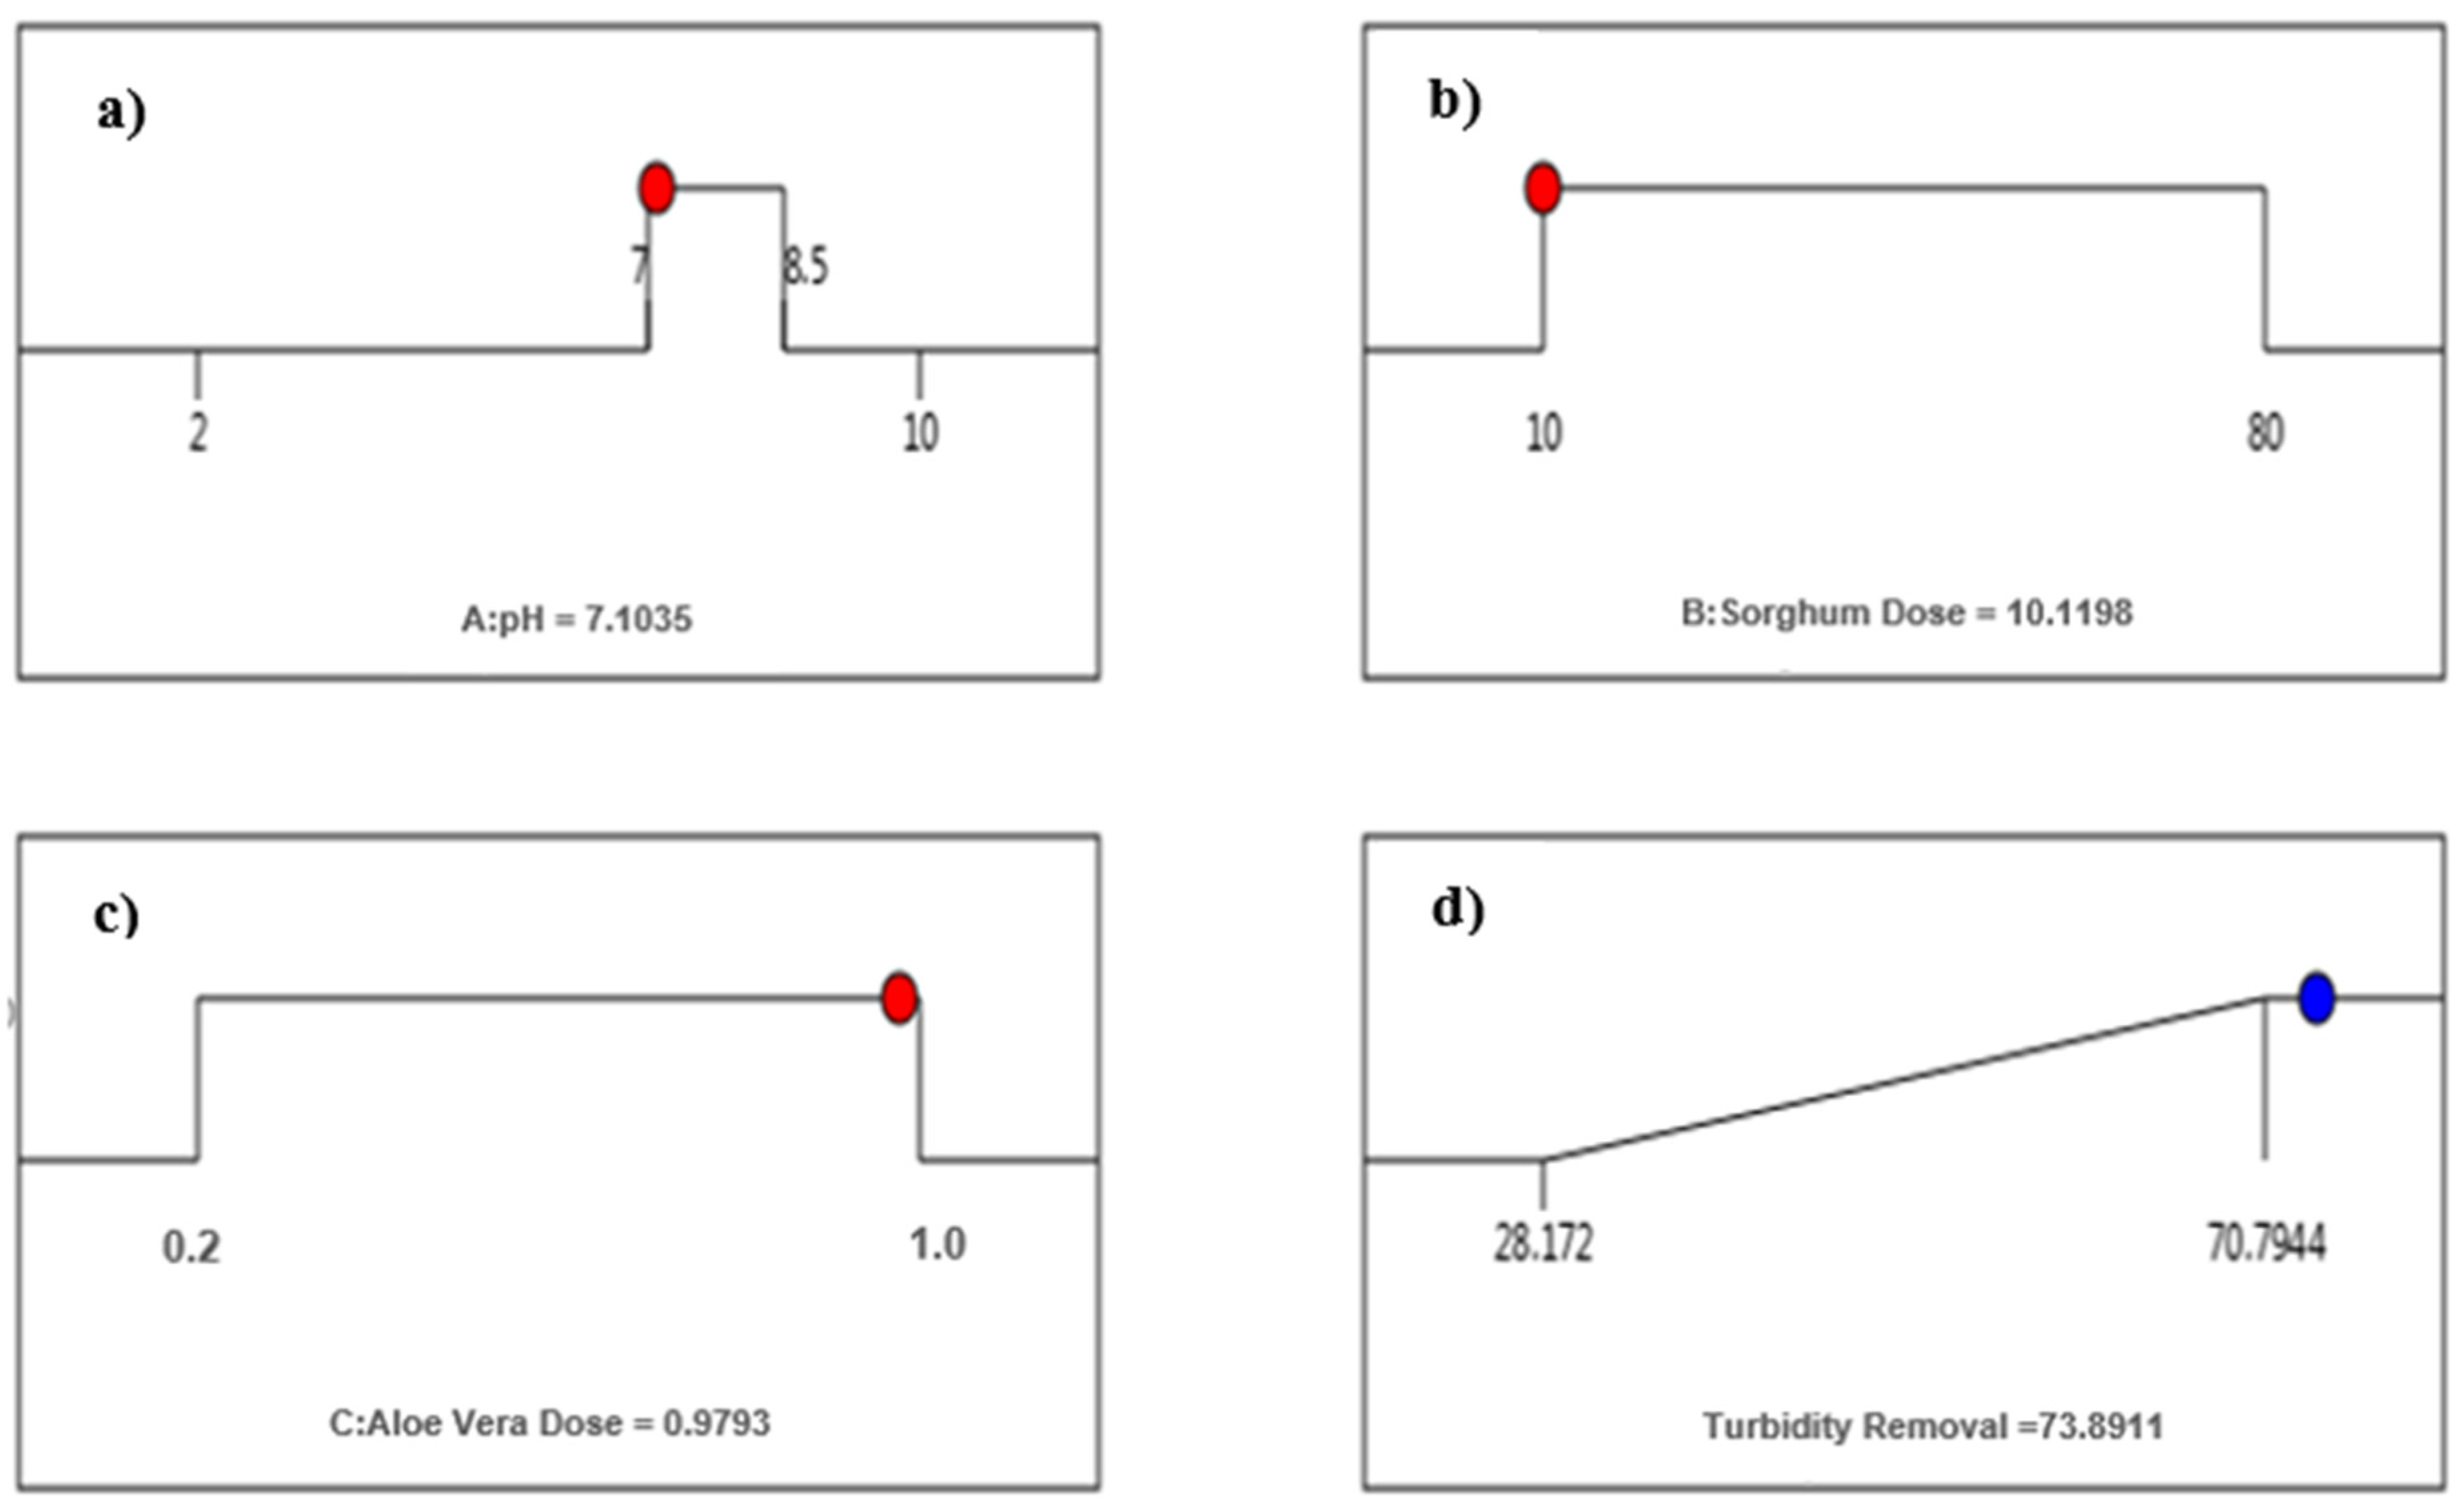
3.3.3. Optimization of pH and Dose for Sorghum with Aloe Vera

The maximum turbidity removal of 84.2% was achieved at pH 2.7, with a Sorghum dose of 17.1 mg/L and an Aloe Vera dose of 0.9% (Figure 9). Optimization at a feasible pH range (7–8.5) is required by considering its practical implications, as presented in Figure 10. The maximum turbidity removal was 73.8% at pH 7.1, a Sorghum dose of 10.1 mg/L, and an Aloe Vera dose of 0.98%.

3.3.4. Analysis of Variance (ANOVA)

The ANOVA results for the Sorghum coagulant along with Aloe Vera are represented in Table 8. The model p-value (0.0002) is less than 0.05 and the model F-value (10.15) is greater than the F-critical value (3.072), which shows that the linear model is statistically significant. Similarly, it can be concluded from the p-values of the model terms that the linear term of pH is a more significant parameter than the coagulant dose.

3.3.5. SEM Analysis

SEM analysis of the Sorghum powder, Aloe Vera gel, and flocs produced during the combination of coagulants (Sorghum with Aloe Vera gel) was performed to examine their surface morphology, as shown in Figure 11. The crystalline structure of the Aloe Vera gel is shown in Figure 11a, whereas spherical particles of the Sorghum seed powder are shown in Figure 11b.
The flocs produced after treatment are shown in Figure 11c; these flocs were relatively compact and bulky in size, and a visible formation of aggregates was observed during the experiment. Therefore, due to the increase in the flocs’ size and higher compaction, it seems to be “sweep flocculation” [23].

3.4. Cost of Treatment

Natural coagulants have the potential to be an alternative to chemical coagulants and can save costs [40]. The cost of treatment is an important consideration, especially for developing countries. The approximated costs of the Sorghum coagulant (Trial 1) and Sorghum along with the Aloe Vera coagulant (Trial 2) were estimated to treat 1000 m3 of canal water in Table 9. Therefore, the coagulant’s optimum dose cost was estimated using the cost of local materials.

4. Conclusions

This study reveals that the Sorghum coagulant was efficient in treating turbid surface water. Sorghum worked better at a lower pH of 2. However, a significant removal was also observed around the pH 7.1 of natural surface water, especially with the addition of the coagulant aid Aloe Vera. The maximum turbidity removal of 87.73% for Sorghum (great millet) was achieved at pH 2 at a dose of 40 mg/L, with a residual turbidity of 38 NTU, while the Sorghum coagulant along with coagulant aid (Aloe Vera) achieved turbidity removal up to 84.2% at pH 2.7 and Sorghum and Aloe Vera doses of 17.1 mg/L and 0.9%, respectively. At a lower pH, Aloe Vera as a coagulant aid is not an effective option as it reduces the turbidity removal efficiency. However, at a neutral pH of 7.1, it increased the turbidity removal efficiency significantly. From the ANOVAs of both trials, it was found that pH had a significant impact on turbidity removal instead of the coagulant dose. The coagulation mechanism was identified as adsorption due to the presence of the carboxylic, amine, and carbonyl groups in the Sorghum coagulant and amine in Aloe Vera. The estimated treatment cost were USD 50.8 (pH 2) and 59.8 (pH 7) for Trial 1, and USD 37.1 (pH 2.7) and 32.9 (pH 7) for Trial 2, to treat 1000 m3 of canal water. Future studies should conduct pilot-scale experiments, and life cycle assessments should also be carried out. Evaluating Sorghum’s effectiveness in treating acidic industrial wastewater is recommended due to its superior performance in acidic pH conditions. Further studies on using locally available natural bio-coagulants (BCs) are recommended.

Author Contributions

F.S.: conceptualization, methodology, experimentation, investigation, data curation, formal analysis, data visualization, writing—original draft preparation. S.H.: supervision, project administration, methodology, writing—review and editing. S.T.: visualization, data analysis, writing—review and editing. All authors have read and agreed to the published version of the manuscript.

Funding

This research did not receive any external funding.

Informed Consent Statement

Not applicable.

Data Availability Statement

Data are contained within the article.

Acknowledgments

The help and support of the laboratory staff at the Institute of Environmental Engineering and Research, University of Engineering and Technology, Lahore, are acknowledged.

Conflicts of Interest

The authors declare that there are no conflicts of interest regarding the submission of this manuscript.

References

  1. Walker, D.; Baumgartner, D.; Gerba, C.; Fitzsimmons, K. Surface water pollution. In Environmental and Pollution Science; Elsevier: Amsterdam, The Netherlands, 2019; pp. 261–292. [Google Scholar]
  2. Al-Weshah, R.A.-M. Jordan’s water resources: Technical perspective. Water Int. 1992, 17, 124–132. [Google Scholar] [CrossRef]
  3. Tabraiz, S.; Nasreen, S.; Qureshi, L.A.; Zeeshan, M.; Ahmad, I.; Ahmed, S.; Hassan, Z. Sewage land disposal and unpaved drains: Threat to groundwater quality. Desalination Water Treat. 2016, 57, 20464–20469. [Google Scholar] [CrossRef]
  4. Zeeshan, M.; Ali, O.; Tabraiz, S.; Ruhl, A.S. Seasonal variations in dissolved organic matter concentration and composition in an outdoor system for bank filtration simulation. J. Environ. Sci. 2024, 135, 252–261. [Google Scholar] [CrossRef]
  5. Asharuddin, S.M.; Othman, N.; Zin, N.S.M.; Tajarudin, H.A.; Din, M.F.M. Flocculation and antibacterial performance of dual coagulant system of modified cassava peel starch and alum. J. Water Process Eng. 2019, 31, 100888. [Google Scholar] [CrossRef]
  6. Kakoi, B.; Kaluli, J.W.; Ndiba, P.; Thiong’o, G. Banana pith as a natural coagulant for polluted river water. Ecol. Eng. 2016, 95, 699–705. [Google Scholar] [CrossRef]
  7. Arulmathi, P.; Jeyaprabha, C.; Sivasankar, P.; Rajkumar, V. Treatment of Textile Wastewater by Coagulation–Flocculation Process Using Gossypium herbaceum and Polyaniline Coagulants. CLEAN Soil Air Water 2019, 47, 1800464. [Google Scholar] [CrossRef]
  8. Liu, Z.; Wei, H.; Li, A.; Yang, H. Enhanced coagulation of low-turbidity micro-polluted surface water: Properties and optimization. J. Environ. Manag. 2019, 233, 739–747. [Google Scholar] [CrossRef]
  9. Asif, M.B.; Majeed, N.; Iftekhar, S.; Habib, R.; Fida, S.; Tabraiz, S. Chemically enhanced primary treatment of textile effluent using alum sludge and chitosan. Desalination Water Treat. 2016, 57, 7280–7286. [Google Scholar] [CrossRef]
  10. Khan, M.D.; Singh, A.; Khan, M.Z.; Tabraiz, S.; Sheikh, J. Current perspectives, recent advancements, and efficiencies of various dye-containing wastewater treatment technologies. J. Water Process Eng. 2023, 53, 103579. [Google Scholar] [CrossRef]
  11. Yin, C.-Y. Emerging usage of plant-based coagulants for water and wastewater treatment. Process Biochem. 2010, 45, 1437–1444. [Google Scholar] [CrossRef]
  12. Saleem, M.; Bachmann, R.T. A contemporary review on plant-based coagulants for applications in water treatment. J. Ind. Eng. Chem. 2019, 72, 281–297. [Google Scholar] [CrossRef]
  13. Driscoll, C.T.; Letterman, R.D. Factors regulating residual aluminium concentrations in treated waters. Environmetrics 1995, 6, 287–305. [Google Scholar] [CrossRef]
  14. Gebbie, P. A dummy’s guide to coagulants. In Proceedings of the 68th Annual Water Industry Engineers and Operators’ Conference, Orlando, FL, USA, 9–13 October 2005; pp. 75–83. [Google Scholar]
  15. Marobhe, N.J. Effectiveness of crude extract and purified protein from Vigna unguiculata seed in purification of charco dam water for drinking in Tanzania. Int. J. Environ. Sci. 2013, 4, 259–273. [Google Scholar]
  16. Narasiah, K.; Vogel, A.; Kramadhati, N. Coagulation of turbid waters using Moringa oleifera seeds from two distinct sources. Water Sci. Technol. Water Supply 2002, 2, 83–88. [Google Scholar] [CrossRef]
  17. Amran, A.H.; Zaidi, N.S.; Muda, K.; Loan, L.W. Effectiveness of natural coagulant in coagulation process: A review. Int. J. Eng. Sci. Technol. 2018, 7, 34–37. [Google Scholar]
  18. Miller, S.M.; Fugate, E.J.; Craver, V.O.; Smith, J.A.; Zimmerman, J.B. Toward understanding the efficacy and mechanism of Opuntia spp. as a natural coagulant for potential application in water treatment. Environ. Sci. Technol. 2008, 42, 4274–4279. [Google Scholar] [CrossRef] [PubMed]
  19. Chaibakhsh, N.; Ahmadi, N.; Zanjanchi, M.A. Use of Plantago major L. as a natural coagulant for optimized decolorization of dye-containing wastewater. Ind. Crops Prod. 2014, 61, 169–175. [Google Scholar] [CrossRef]
  20. Okuda, T.; Baes, A.U.; Nishijima, W.; Okada, M. Isolation and characterization of coagulant extracted from Moringa oleifera seed by salt solution. Water Res. 2001, 35, 405–410. [Google Scholar] [CrossRef]
  21. Siddique, M.; Soomro, S.A.; Aziz, S.; Jatoi, A.S.; Mengal, A.; Mahar, H. Removal of Turbidty from Turbid Water by Bio-cogulant Prepared from Walnut Shell. J. Appl. Emerg. Sci. 2016, 6, 66–68. [Google Scholar]
  22. Asrafuzzaman, M.; Fakhruddin, A.; Hossain, M.A. Reduction of turbidity of water using locally available natural coagulants. ISRN Microbiol. 2011, 2011, 632189. [Google Scholar] [CrossRef]
  23. Choy, S.; Prasad, K.; Wu, T.; Ramanan, R. A review on common vegetables and legumes as promising plant-based natural coagulants in water clarification. Int. J. Environ. Sci. Technol. 2015, 12, 367–390. [Google Scholar] [CrossRef]
  24. Hussain, G.; Haydar, S. Exploring potential of pearl millet (Pennisetum glaucum) and black-eyed pea (Vigna unguiculata subsp. unguiculata) as bio-coagulants for water treatment. Desalination Water Treat. 2019, 143, 184–191. [Google Scholar] [CrossRef]
  25. Imran, S.; Bukhari, L.N.; Ashraf, M. Spatial and Temporal Trends in River Water Quality of Pakistan; Pakistan Council of Research in Water Resources: Lahore, Pakistan, 2018. [Google Scholar]
  26. Momeni, M.M.; Kahforoushan, D.; Abbasi, F.; Ghanbarian, S. Using chitosan/CHPATC as coagulant to remove color and turbidity of industrial wastewater: Optimization through RSM design. J. Environ. Manag. 2018, 211, 347–355. [Google Scholar] [CrossRef] [PubMed]
  27. Zanil, M.F.B.; Ramzan, L.A.B. Optimization of Coagulation Tank Processes through Interval Fuzzy Type 2 Logic System: A Study of Turbidity Reduction. ASEAN J. Process Control 2023, 2, 1–16. [Google Scholar]
  28. Raj, S.; Mahanty, B.; Hait, S. Coagulative removal of polystyrene microplastics from aqueous matrices using FeCl3-chitosan system: Experimental and artificial neural network modeling. J. Hazard. Mater. 2024, 468, 133818. [Google Scholar] [CrossRef] [PubMed]
  29. Singgalen, Y.A. Analysis and Design of Natural Spring Water Preservation and Monitoring System Using Rapid Application Development. J. Inf. Syst. Inform. 2024, 6, 118–135. [Google Scholar]
  30. Alenazi, M.; Hashim, K.S.; Hassan, A.A.; Muradov, M.; Kot, P.; Abdulhadi, B. Turbidity removal using natural coagulants derived from the seeds of strychnos potatorum: Statistical and experimental approach. IOP Conf. Ser. Mater. Sci. Eng. 2020, 888, 012064. [Google Scholar] [CrossRef]
  31. Choy, S.Y.; Prasad, K.M.N.; Wu, T.Y.; Raghunandan, M.E.; Ramanan, R.N. Utilization of plant-based natural coagulants as future alternatives towards sustainable water clarification. J. Environ. Sci. 2014, 26, 2178–2189. [Google Scholar] [CrossRef] [PubMed]
  32. Doko, D. Biophysical Characterization and NMR Analysis of the PDI Fragment B’xa’c; University of Kent: Canterbury, UK, 2012. [Google Scholar]
  33. Ni, F.; Peng, X.; He, J.; Yu, L.; Zhao, J.; Luan, Z. Preparation and characterization of composite bioflocculants in comparison with dual-coagulants for the treatment of kaolin suspension. Chem. Eng. J. 2012, 213, 195–202. [Google Scholar] [CrossRef]
  34. Sellami, M.; Zarai, Z.; Khadhraoui, M.; Jdidi, N.; Leduc, R.; Ben Rebah, F. Cactus juice as bioflocculant in the coagulation–flocculation process for industrial wastewater treatment: A comparative study with polyacrylamide. Water Sci. Technol. 2014, 70, 1175–1181. [Google Scholar] [CrossRef]
  35. Szilagyi, I.; Polomska, A.; Citherlet, D.; Sadeghpour, A.; Borkovec, M. Charging and aggregation of negatively charged colloidal latex particles in the presence of multivalent oligoamine cations. J. Colloid Interface Sci. 2013, 392, 34–41. [Google Scholar] [CrossRef] [PubMed]
  36. Mahmoodi, N.M.; Oveisi, M.; Taghizadeh, A.; Taghizadeh, M. Novel magnetic amine functionalized carbon nanotube/metal-organic framework nanocomposites: From green ultrasound-assisted synthesis to detailed selective pollutant removal modelling from binary systems. J. Hazard. Mater. 2019, 368, 746–759. [Google Scholar] [CrossRef] [PubMed]
  37. Fatombi, J.; Lartiges, B.; Aminou, T.; Barres, O.; Caillet, C. A natural coagulant protein from copra (Cocos nucifera): Isolation, characterization, and potential for water purification. Sep. Purif. Technol. 2013, 116, 35–40. [Google Scholar] [CrossRef]
  38. Crittenden, J.C.; Trussell, R.R.; Hand, D.W.; Howe, K.; Tchobanoglous, G. MWH’s Water Treatment: Principles and Design; John Wiley & Sons: Hoboken, NJ, USA, 2012. [Google Scholar]
  39. Akram, W.; Garud, N. Design expert as a statistical tool for optimization of 5-ASA-loaded biopolymer-based nanoparticles using Box Behnken factorial design. Future J. Pharm. Sci. 2021, 7, 146. [Google Scholar] [CrossRef]
  40. Halder, A. Bio-coagulants, a substitute of chemical coagulants. J. Adv. Sci. Res. 2021, 12, 58–67. [Google Scholar] [CrossRef]
Figure 1. Experimental workflow diagram. Stages: (a) Sorghum plant illustration, (b) display of sorghum seeds, (c) ground sorghum seed sample, (d) Aloe Vera plant illustration, (e) extracted Aloe Vera pulp, (f) Aloe Vera pulp solution preparation, (g) water canal sampling location, (h) composite water sample collection, (i) experimental design, (j) jar test apparatus setup, (k) data analysis and optimization phase.
Sustainability 16 02941 g001
Figure 2. 3D response surface plot (Sorghum dose vs. pH) showing the performance (pH = 2; dose = 40 mg/L; turbidity removal = 87.73%; residual turbidity = 38.5 NTU).
Sustainability 16 02941 g002
Figure 3. Optimization of treatment variables for Sorghum: (a) pH = 2; (b) dose = 40.2 mg/L; (c) turbidity removal = 87.73%. Red balls show the optimal input variables while blue balls show the optimal response (turbidity removal efficiency).
Sustainability 16 02941 g003
Figure 4. Optimization of treatment variables at pH range 7–8.5: (a) pH = 7; (b) dose = 55.7 mg/L; (c) turbidity removal = 54%. Red balls show the input variables while blue balls show the response value (turbidity removal efficiency).
Sustainability 16 02941 g004
Figure 5. FTIR spectra of Sorghum seed powder (black line ) and sludge after treatment (red line ).
Sustainability 16 02941 g005
Figure 6. FTIR spectra of Aloe Vera gel (black line ) and Aloe Vera gel sludge after treatment (red line ).
Sustainability 16 02941 g006
Figure 7. SEM images of (a) Sorghum seed powder and (b) flocs produced after treatment.
Sustainability 16 02941 g007
Figure 8. (a) 3D response surface plot (Sorghum dose vs. pH); (b) 3D response surface plot (Aloe Vera vs. pH); (c) 3D response surface plot (Aloe Vera vs. Sorghum dose).
Sustainability 16 02941 g008aSustainability 16 02941 g008b
Figure 9. Optimization of treatment variables: (a) pH = 2.7; (b) Sorghum dose = 17.1 mg/L; (c) Aloe Vera dose = 0.9%; (d) turbidity removal = 84.2%. Red balls show the optimal input variables while blue balls show the optimal response (turbidity removal efficiency).
Sustainability 16 02941 g009
Figure 10. Optimization at pH range 7–8.5: (a) pH = 7.1; (b) Sorghum dose = 10.1 mg/L; (c) Aloe Vera dose = 0.98%; (d) turbidity removal = 73.9%. Red balls show the input variables while blue balls show the response value (turbidity removal efficiency).
Sustainability 16 02941 g010
Figure 11. SEM images of (a) the Aloe Vera gel, (a) the Sorghum seed powder, (b) the flocs produced after treatment, and (c) Sorghum with Aloe Vera.
Sustainability 16 02941 g011
Table 1. Characteristics of the samples (surface water).
ParametersUnitsValues
pH-7.7 ± 1
TurbidityNTU452 ± 45
ConductivityµS/cm230 ± 2
Total alkalinitymg/L as CaCO357.3 ± 7
Total hardnessmg/L as CaCO3221 ± 10
Calcium (Ca2+)mg/L49 ± 2
Magnesium (Mg2+)mg/L24.3 ± 3
Chlorides (Cl1−)mg/L41.7 ± 1
Sulfates (SO42−)mg/L33.2 ± 4
Phosphates (PO43−)mg/L7.89 ± 1
Nitrates (NO31−)mg/L11.3 ± 6
Table 2. Summary of factors used in DOE.
FactorNameUnitTypeCoded LowCoded HighFactors Level
1st TrialApHunit lessNumeric−1 ↔ 2.00+1 ↔ 10.002, 4, 6, 8, 10
BSorghum Dosemg/LNumeric−1 ↔ 10.00+1 ↔ 80.0010, 20, 40, 60, 80
2nd TrailApHunit lessNumeric−1 ↔ 2.00+1 ↔ 10.002, 4, 6, 8, 10
BSorghum Dosemg/LNumeric−1 ↔ 10.00+1 ↔ 80.0010, 20, 40, 60, 80
CAloe Vera Dose%Numeric−1 ↔ 0.20+1 ↔ 1.000.2, 0.4, 0.6, 0.8, 1.0
Table 3. Turbidity removal results for Sorghum (great millet).
Experimental RunFactorsInitial Turbidity T-1Response
A
pH
B
Dose
Residual Turbidity T-2Turbidity
Removal
Units-mg/LNTUNTUNTU (%)
11040500208.958.2
226035982.577.0
322036870.680.8
41010440272.338.1
561043526040.2
6102048827443.9
746045052.688.3
866042025240.0
9840610286.753.0
10410476164.465.5
1181054037430.7
1264042625041.3
1344042076.881.7
1486047422253.2
1528029884.971.5
1621039572.381.7
1748048513073.2
18680432204.652.6
1962042021050.0
20420470138.770.5
21106054027848.5
22108052328246.1
2324035237.989.2
2488047420955.9
25820434246.443.2
Table 4. Model fitting of experimental data for Sorghum.
ModelStd. Dev.R2Adjusted R2Predicted R2PRESS
Linear11.110.63070.59710.54373355.37
2FI11.000.65460.60520.56183222.62
Quadratic9.500.76670.70530.62442762.56Suggested
Cubic8.930.83720.73950.63992648.56
Quartic7.060.93230.83750.59722962.05
Fifth7.050.95950.8380−1.968621,831.96Aliased
Table 5. ANOVA result for the experimental data of Sorghum.
SourceSum of SquaresdfMean SquareF-Valuep-Value
Model5638.5151127.7012.49<0.0001significant
A: pH4229.8014229.8046.84<0.0001significant
B: dose131.661131.661.460.2421
AB175.611175.611.940.1793
A2609.771609.776.750.0176significant
B2214.741214.742.380.1396
Residual1715.811990.31
Table 6. Turbidity removal results for Sorghum (great millet) with coagulant aid (Aloe Vera).
Experimental RunFactorsInitial Turbidity T-1Response
A
pH
B
Dose
Sorghum
C
Dose
Aloe Vera
Residual Turbidity T-2Turbidity Removal
Units-mg/Lml/100 mLNTUNTUNTU (%)
110400.640025735.8
22600.844024743.9
32400.644020054.5
410100.240024838.0
56100.254428946.9
610200.440025436.5
74600.842413867.5
86600.854023456.7
98400.646830734.4
104100.242416261.8
118100.247030435.3
126400.654422957.9
134400.642812570.8
148600.847032331.3
152801.045018359.3
162100.244421152.5
174801.042415064.6
186801.054024654.4
196200.454027050.0
204200.442414665.6
2110600.840025735.8
2210801.040026234.5
232200.444016861.8
248801.046533428.2
258200.446529536.6
Table 7. Model fitting of experimental data for Sorghum with Aloe Vera.
ModelStd. Dev.R2Adjusted R2Predicted R2PRESS
Linear8.980.59190.53360.45132276.07Suggested
2FI9.620.59800.46400.30722873.76
Quadratic9.240.64980.50570.30402887.11Aliased
Table 8. ANOVA result for the experimental data of Sorghum with Aloe Vera.
SourceSum of SquaresdfMean SquareF-Valuep-Value
Model2455.503818.5010.150.0002Significant
A: pH2416.1812416.1829.97<0.0001Significant
B: Sorghum dose39.22139.220.48650.4931
C: Aloe Vera dose38.31138.310.47530.4981
Residual1692.782180.61
Table 9. Cost analysis for selected bio-coagulants.
Optimum DosesUnit Cost * USD/kgTotal Cost ** USD/1000 m3 of Water
Trial 1 (Sorghum)
pH-240 mg/L0.7050.89
pH-755 mg/L0.7059.89
Trial 1 (Sorghum along with Aloe Vera)
pH-2.717 mg/L, 0.9%0.2737.19
pH-710 mg/L, 1.0%0.2732.99
* Unit cost includes the cost of coagulants and processing (drying, grinding, sieving, filtration). ** Total cost treatment contains the cost of coagulants, processing, and treatment (coagulation, flocculation, cost of chemicals NaOH/H2SO4).
Disclaimer/Publisher’s Note: The statements, opinions and data contained in all publications are solely those of the individual author(s) and contributor(s) and not of MDPI and/or the editor(s). MDPI and/or the editor(s) disclaim responsibility for any injury to people or property resulting from any ideas, methods, instructions or products referred to in the content.

