Abstract
The utilization of remote sensing technology to assess changes in crop net primary productivity (NPP), biomass, and carbon sequestration within the Fen River Basin, a crucial agricultural region in China, is important for achieving agricultural modernization, enhancing ecological environment quality, and obtaining carbon neutrality objectives. This study employed satellite remote sensing and the Carnegie–Ames–Stanford approach (CASA) model as research methods to investigate the temporal and spatial distribution characteristics of corn NPP in the Fen River Basin. Correlation analysis was conducted to examine the response of corn NPP to various environmental factors in the region, while aboveground biomass and carbon sequestration of corn were estimated using a biomass inversion model driven by NPP and principles of photosynthesis in green plants. The findings revealed that, from a temporal perspective, corn NPP in the Fen River Basin exhibited a unimodal variation pattern, with an average value of 368.65 gC/m2. Spatially, the corn NPP displayed a discernible differentiation pattern, with the highest values primarily observed in the middle reaches of the Fen River Basin. Throughout the spatial and temporal variations in corn NPP during 2011–2020, the carbon sequestration capacity of corn exhibited an upward trend, particularly since 2017. The corn NPP displayed a positive correlation with temperature and precipitation. The response to solar radiation was mildly negative and a mildly positive correlation. In 2020, the aboveground biomass and carbon sequestration of corn followed a normal distribution, with the highest values concentrated in the northwestern part of the lower Fen River.
1. Introduction
Food is an essential requirement for human sustenance, and its significance is self-evident. In recent years, factors such as population growth, rapid urbanization, and improved living standards have increased demand for food. However, food production faces significant challenges owing to issues such as soil pollution and a decrease in available agricultural land [1]. China, a major global grain importer and exporter, has a direct impact on the global food supply. Therefore, conducting scientific and precise assessments and monitoring of regional agricultural production is instrumental in effectively managing the grain market, promptly adapting planting strategies, and developing agricultural import and export policies [2].
Rapid advancements in remote sensing technology have contributed to their widespread application in the agricultural sector. Examples of its applications include monitoring and assessing soil nutrient levels in farmlands, tracking agricultural plant development, and evaluating agricultural output [3,4]. The utilization of remote sensing technology in agriculture began with the launch of the Landsat Multispectral Scanning System (MSS) satellite in 1972, followed by a series of successive Landsat satellites (Landsat 2–8). These satellites have consistently provided high-quality images to assist land managers, researchers, and policymakers in the effective management of global natural resources [5]. In recent years, cutting-edge technologies such as remote sensing have emerged. These technologies hold significant promise for increasing crop yields, reducing input costs, and improving overall crop production efficiency [6,7,8]. Studies have demonstrated the potential of remote sensing images to generate high-resolution yield maps and assess yield variability in both field and landscape settings, enhancing the understanding of farmland’s overall production potential [5,9,10,11].
The common method for estimating grain yield, using remote sensing technologies, involves analyzing crop biochemical parameters through a simple statistical model that utilizes data from remote sensing images. This approach aims to extract crop yield information by establishing a transformation model between biochemical parameters and yields [12]. However, remote sensing yield estimation encounters challenges, including its limited applicability. Substantial variations in the study area, duration, and climatic conditions contributed to a significant error in the yield estimation. Furthermore, remote sensing data exclusively capture the dynamic aspects of the crop canopy, failing to comprehensively depict the underlying principles of crop growth or the impact of climatic conditions on its progress [13]. To enhance the precision and applicability of remote sensing yield estimation, a light energy utilization model such as the CASA model has been explored. The CASA model is an ecological model relying on the photosynthetic efficiency of vegetation canopies. Through remote sensing technology, essential input parameters such as absorbed photosynthetically active radiation (APAR) and light use efficiency (LUE) can be obtained, facilitating the estimation of net primary productivity (NPP) and biomass for regional-scale vegetation [14].
Gross primary productivity (GPP) represents the overall organic matter generated through primary production, considering both temporal and spatial dimensions. When deducting the total primary productivity from the material consumed by autotrophic respiration of the plant, the remaining organic matter is referred to as NPP. Vegetation NPP serves as a dependable metric for assessing the productive ability of vegetation communities and plays a pivotal role in evaluating carbon source/sink dynamics within ecosystems, as well as in regulating ecological processes [15]. In terms of crops, NPP is directly correlated with biological yield [16,17]. In particular, in remote sensing yield estimation, different crop types exhibit variations in the NPP formation process, owing to their distinct growth and development characteristics. Therefore, estimating NPP for specific crops such as corn can facilitate crop yield estimation. Bandaru et al. studied the NPP of corn from Iowa and Illinois in the United States in 2006, yielding an estimated result of 384 gC/m2 [18]. In recent decades, numerous models employing remote sensing to estimate NPP have been developed. These models are effective in assessing temporal fluctuations in vegetation productivity affected by climate change and human activity. Examples include the Biome-BGC model, GLO-PEM model [14], MOD-Sim-Cycle model [19], and Carnegie–Ames–Stanford approach (CASA) model [20]. The CASA ecosystem model, often referred to as the light use efficiency (LUE) model, is widely utilized for predicting global NPP. It can successfully integrate spatial and temporal NPP patterns at the regional and global scales. The global success of the model can be attributed to the effective incorporation of remote sensing data at each pixel and its methodological simplicity. Tripathi et al. [21] utilized the CASA model to investigate the spatiotemporal distribution of NPP in India’s artificial forests, confirming the accuracy of the model’s estimations.
Currently, the global carbon cycle has garnered significant attention from governments, scientists, and the public. China, in particular, has taken a pioneering stance to achieve maximum carbon emission reduction by 2030 and ultimately attain zero net carbon emissions by 2060 [22]. Vegetation is a crucial part of the carbon sink in the carbon cycle of terrestrial ecosystems, actively absorbing CO2 from the atmosphere through photosynthesis and effectively sequestering carbon [23]. In recent years, the carbon sequestration capacity of terrestrial vegetation has been extensively explored. Richard et al. [24] focused on a deciduous maple forest in Tennessee and highlighted the role of nitrogen in constraining the impact of CO2 fertilization on vegetation NPP. Luo et al. [25] examined the impacts of land utilization, climate change, and CO2 fertilization on plant primary productivity, carbon storage, and oxygen release capacity in the Tibetan Plateau. Their analysis employed 12 distinct ecosystem models to assess these dynamics comprehensively. Chen and Zhuang utilized an improved CASA model to estimate the NPP of winter wheat and summer maize in the Huanghuaihai region. Their findings indicated a positive correlation between NPP and solar radiation, while demonstrating a negative correlation between temperature and precipitation [26].
The purpose of this study was to use remote sensing and meteorological data by employing the CASA model to estimate corn NPP in the Fen River Basin. Furthermore, a correlation was established between corn NPP, biological yield, and carbon sequestration, validating the model’s accuracy through a comparison with previous research findings. In this study, the parameters of the CASA model were adjusted to account for various factors, including study area, plant species, environment, and climate. This adaptation offers a novel approach for computing crop NPP across diverse geographical regions. Additionally, estimating the biological yield and carbon sequestration of corn in the Fen River Basin offers valuable insights into optimizing agricultural planting strategies, achieving sustainable agricultural development and enhancing the ecological environment.
2. Materials and Methods
2.1. Overview of the Study Area
The Fen River Basin, China’s second-largest tributary of the Yellow River, spans the central and southwestern reaches of Shanxi Province, with co-ordinates ranging from 35°20′–39°00′ N to 110°30′–113°32′ E [27]. Encompassing a total length of 713 km, the watershed area of the basin constitutes 25.5% of the total land area of Shanxi Province. The land use within the basin can be categorized as cropland, woodland, and grassland. Croplands predominantly occupy the central and southern regions, accounting for 39.6% of the area, whereas woodlands are concentrated in the mountainous northwestern and southeastern areas, covering 28.1%. The grassland is in the northern sector, encompassing 23.7% of the basin’s total area [28] (Figure 1a). The Fen River Basin experiences a semi-arid monsoon climate with an average annual precipitation of 507 mm, characterized by variable yearly patterns and seasonal fluctuations, with the bulk of rainfall occurring between July and September. The region’s average annual temperature ranges from 6 °C to 13 °C, with drought being a prevalent weather-related concern. Topographically, the basin displays an elevation gradient with higher elevations in the north and lower elevations in the south. The primary river channel follows a winding path from north to south within the Taiyuan and Linfen Basins. The basin is predominantly characterized by its agricultural production, particularly for the cultivation of wheat, corn, sorghum, and various cereals. Shanxi Province serves as a significant center for commercial grain production, with a notable concentration of corn crops in the central and southern regions (Figure 1b).
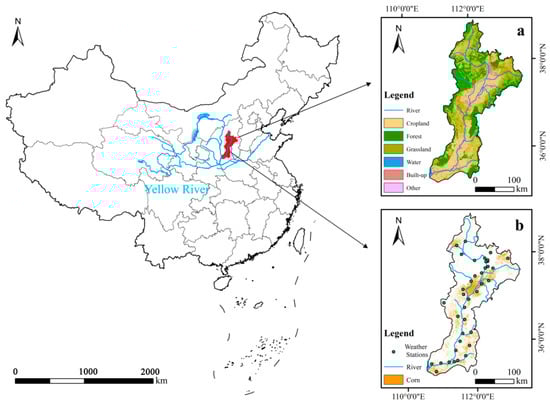
Figure 1.
Overview of the study area: (a) land use types in the Fen River Basin; (b) distribution of corn crops and meteorological stations in the Fen River Basin.
2.2. Data Sources and Preprocessing
This study focused on corn NPP in the Fen River Basin. Corn crops in the Fen River Basin grow from May to October. Consequently, this study calculated the monthly corn NPP for the period from May to October 2020. The auxiliary data used in this analysis aligned with a temporal resolution covering the same period from May to October 2020 [29].
2.3. Remote Sensing Data
The boundary data for the Fen River Basin were sourced from the Center for Resource and Environmental Sciences and Data, Chinese Academy of Sciences (CAS). The data were structured using the GCS_Clarke_1866 geographic co-ordinate system.
The corn distribution data for the Fen River Basin in 2020 encompassed the period 2016–2020. This dataset had a spatial resolution of 30 m and temporal resolution of 1 year.
Normalized Difference Vegetation Index (NDVI) data were generated using the GEE platform, employing Sentinel 2 data for the computation of monthly NDVI values. The NDVI datasets had a spatial resolution of 500 m and were referenced to the WGS84 co-ordinate system.
2.4. Meteorological Data
Monthly mean temperature data were obtained from the National Tibetan Plateau Science Data Center in the NetCDF format. These data featured a spatial resolution of approximately 1 km and covered the period from January 1901 to December 2021. The temperature data were provided in units of 0.1 °C, requiring the use of a raster calculator for unit conversion.
The total precipitation data were sourced from the National Earth System Science Data Center in the NetCDF format. This dataset covered the period from 1901 to 2021 with a spatial resolution of approximately 1 km. The precipitation measurements were presented in units of 0.1 mm, necessitating the use of a raster calculator for unit conversion.
Owing to the challenge of obtaining monthly total solar radiation data, solar radiation can be estimated by converting hours of sunshine. Almorox et al. [30] provides an Excel sheet with a calculation algorithm that yields solar radiation in units of MJ/m2.
2.5. Other Data
Specific static parameters for corn were selected to determine monthly NPP in the Fen River Basin. These parameters included NDVImax (0.634), NDVImin (0.023), maximum value of simple ratio (SRmax) (4.46), SRmin (1.05), and maximum light energy utilization (εmax) set at 0.542 [31].
2.6. CASA Model
The CASA model is a remote sensing model that operates based on the intricate relationship between ecosystem productivity and the dynamics of carbon and nitrogen within the soil [32]. This model comprehensively considers environmental conditions and plant characteristics and integrates remotely sensed data with temperature, precipitation, solar radiation, vegetation type, and soil type information to efficiently harness light energy. In this model, corn NPP is contingent on variables such as absorbed photosynthetically active radiation (APAR) and vegetation light energy utilization (ε) [20]. The formula used to calculate the model is as follows:
where NPP(x,t) denotes the net primary production of image x in month t [33], the variable APAR(x,t) denotes the amount of photosynthetically active radiation absorbed by image x during month t, and the variable ε(x,t) represents the actual use of light energy by image x during month t [34,35,36,37]. The determination of APAR relies on two variables: fractional photosynthetically active radiation by vegetation (FPAR) and total solar radiation (SOL). The calculation formula is as follows:
where FPAR(x,t) denotes the effective photosynthetic radiation ratio of image x in month t and SOL(x,t) denotes the total solar radiation of image x in month t (MJ/m2).
The light energy conversion rate was calculated as follows:
where εmax denotes the maximum light energy conversion rate, Tε(x,t) denotes the temperature factor of image element x in month t, and Wε(x,t) denotes the precipitation factor of image element x in month t [38].
Within a specific range, FPAR exhibits a robust linear correlation with both the normalized vegetation index (NDVI) and the ratio vegetation index. To enhance data precision, this study employed static parameters tailored to the characteristics of corn in the Fen River Basin [31].
2.7. Correlation Analysis
Correlation analysis is a statistical technique used to investigate relationships between multiple random variables of equal significance. In this study, this approach was utilized to examine the correlation between corn NPP and climatic parameters. The analysis focused on establishing time-series relationships between monthly corn NPP and temperature, precipitation, and solar radiation throughout the corn growth season and subsequently computing correlation coefficients [39]. This analysis focused on the spatial distribution characteristics of corn NPP and their correlation with climatic parameters. This correlation was determined by computing the correlation coefficients using the ArcGIS raster cell values. The following equation was applied to calculate correlation coefficients:
where Rxy is the correlation coefficient, which is calculated using the values of variables x and y in the ith period, where xi and yi represent these values. The mean values of variables x and y are denoted by and , respectively. The sample capacity is denoted as n. The correlation coefficient is a numerical value that can vary from −1 to 1. Positive values imply a direct relationship between variables, whereas negative values indicate an inverse relationship. The magnitude of the value indicates the intensity of the correlation between the variables.
Using significance levels α = 0.05 and α = 0.01 and referring to the significance test table of correlation coefficients, the study established threshold values as fα(n − 2) = f0.05(n − 2) = 0.7067, fα(n − 2) = f0.01(n − 2) = 0.8343, facilitating the classification of correlations into six distinct levels: significant negative correlation (R < −0.8343), moderate negative correlation (−0.8343 < R < −0.7067), mild negative correlation (−0.7067 < R < 0), mild positive correlation (0 < R < 0.7067), moderate positive correlation (0.7067 < R < 0.8343), and a significant positive correlation (R > 0.8343).
2.8. Estimation of Aboveground Biomass of Corn
Research has demonstrated that the implementation of NPP in green plants over a specific period primarily signifies a link between organic matter production via photosynthesis in the vegetation and the carbon fixation process. As plant stems and leaves mature, their photosynthetic and carbon fixation capabilities are enhanced [40]. According to this theoretical framework, researchers have proposed a biomass inversion model driven by NPP. This model establishes a distinct linear correlation between the biomass of green plants and cumulative NPP. Additionally, this relationship is affected by the ratio of roots to crowns and the carbon content of plants [41].
where B represents the amount of aboveground biomass in the plant; ∑NPP is the total accumulated net primary productivity during a specific time period; α is the root-to-crown ratio; and β is the carbon content of the plant. This equation reveals a straightforward linear relationship between plant biomass and accumulated NPP, allowing for the translation of NPP into plant biomass once the parameters for the plant root–crown ratio and carbon content were determined [13]. Table 1 illustrates the variations in the carbon content ratio, root–crown ratio, and other relevant metrics between winter wheat and summer corn crops, attributed to their different crop types and growth attributes. When converting NPP to biomass, it is essential to consider these factors. In this study, aboveground biomass was calculated specifically for corn, thus utilizing data pertaining to corn.

Table 1.
Carbon percentage, dry matter percentage, root–crown ratio, and water content of each crop type.
2.9. Estimation of Carbon Sequestration in Corn
Based on the principles of photosynthesis in green plants, vegetation can capture 1.63 kg of carbon dioxide for every 1.00 kg of dry matter produced. It is essential to emphasize that 1 kg of carbon dioxide comprises 0.27 kg of carbon [42]. Furthermore, during the fixation period, the quantity of dry matter generated by photosynthetic crops is approximately 2.2 times greater than their NPP [43]. Therefore, the calculation of carbon sequestration by vegetation can be derived from the corn NPP:
where WCO2 is the amount of CO2 fixed by vegetation per unit area in a certain period (g/m2); NPP is the corn NPP per unit area in a certain period (gC/m2); and WC is the amount of carbon sequestered by corn per unit area in a certain period (g/m2).
3. Results
3.1. Analysis of Inter-Monthly Temporal Variation in Corn NPP
Using the CASA model and the mean value approach, this study simulated the corn NPP in the Fen River Basin from May to October. Subsequently, an analysis was conducted to examine temporal trends (Figure 2) and spatial distribution patterns (Figure 3).
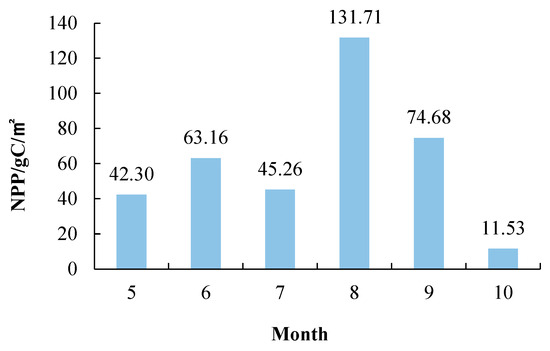
Figure 2.
Temporal trends of corn NPP from May to October in the Fen River Basin.
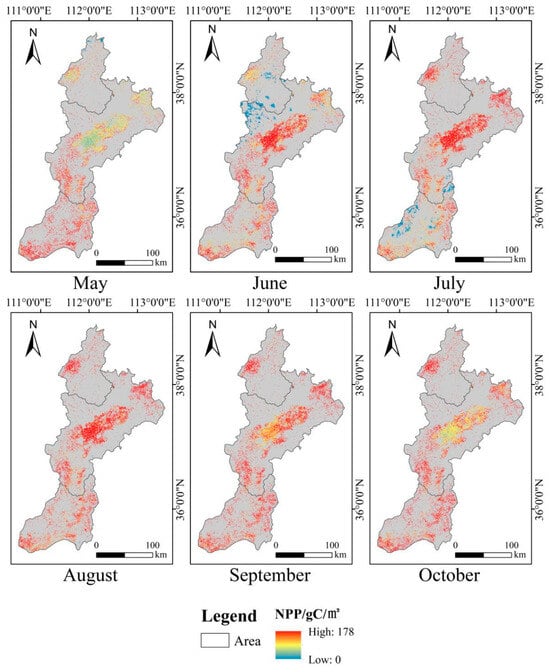
Figure 3.
Geographical distribution characteristics of corn NPP from May to October in the Fen River Basin.
The analysis of temporal changes in corn NPP within the Fen River Basin, spanning May to October, revealed a distinctive single-peak pattern characterized by an initial increase followed by a decline. The average total NPP during this period was 368.65 gC/m2. August exhibited the highest average NPP, reaching a peak of 131.71 gC/m2, while October records the lowest average NPP at 11.53 gC/m2. The descending order of average NPP values was as follows: September (74.68 gC/m2), June (63.16 gC/m2), July (45.26 gC/m2), and May (42.30 gC/m2). Examining the corn growth stages, NPP values demonstrated a gradual increase from May to June during the seedling stage, followed by a decline from June to July during the modulation stage. Subsequently, NPP experienced a rapid increase, peaking from July to August during the tasseling stage and gradually decreasing from August to September during the silking stage. Finally, NPP decreased to its minimum level from September to October, corresponding to the maturity stage.
The spatial distribution of corn NPP in the Fen River Basin exhibited variations ranging from 0.34 gC/m2 to 177.99 gC/m2 during the period of May to October in 2020. Notably, the central section of the Fen River Basin displayed the highest ability for carbon capture and yielded the largest NPP compared to the upper and lower sections. Specifically, in May, corn NPP ranged from 5.24 gC/m2 to 148.34 gC/m2, with the lower reaches surpassing the middle section and the middle section exceeding the upper section. June witnessed corn NPP ranging from 6.88 gC/m2 to 159.43 gC/m2, with the middle section surpassing the lower reaches. In July, NPP ranged from 1.65 gC/m2 to 84.26 gC/m2, where the middle section outperformed the upper section and the upper section exceeded the lower section. August showed the peak of corn growth and NPP, with the middle section recording the highest values, followed by the upper section and then the lower section. In September, corn NPP exhibited a gradient, with higher values in the upper section, followed by the middle section, and the lowest in the lower section. The range of corn NPP in September spanned from 2.32 gC/m2 to 118.11 gC/m2. The autumn harvest occurred in October, representing the lowest NPP, ranging from 0.34 gC/m2 to 43.11 gC/m2. The upper section displayed a higher NPP than the lower section, which surpassed the middle section. Several observations can be made based on an analysis of the environment, topography, and human activities in the Fen River Basin. In the middle reaches of the Fen River, predominant land-use types included woodland, grassland, and cropland, characterized by high vegetation cover and elevated corn NPP. Conversely, the upper reaches had less cropland, which was affected by significant human activities, resulting in lower corn NPP values. In the lower reaches, the cropland area was more extensive, albeit with reduced woodland and grassland coverage, resulting in corn NPP values falling between those observed in the middle and upper reaches.
3.2. Analysis of Temporal and Spatial Changes in August Corn NPP from 2011 to 2020
A previous study revealed that corn NPP reaches its peak in August, providing a more representative insight into annual corn NPP development. Consequently, this study investigated the temporal and spatial fluctuations in August corn NPP in the Fen River Basin between 2011 and 2020. The aim was to gain a comprehensive understanding of the long-term trends in corn NPP variation.
In Figure 4, the temporal changes were analyzed, revealing that the mean August corn NPP in the Fen River Basin fluctuated between 94.23 gC/m2 and 154.12 gC/m2 during the period from 2011 to 2020. Overall, there was an upward trend in NPP, marked by more significant fluctuations between 2011 and 2016 and, particularly, a pronounced decline from 2015 to 2016. Conversely, a relatively smooth upward trend was observed from 2016 to 2020. This observed pattern could be attributed to factors such as the arid climate and abundant precipitation in the Fen River Basin. Furthermore, when considering the maximum and minimum NPP values, fluctuations in corn NPP during August were similar from 2011 to 2017. However, after 2017, the maximum NPP value steadily increased, whereas the minimum NPP value showed a consistent decline. In conclusion, the carbon sequestration capacity of corn crops in the Fen River Basin demonstrated a continuously increasing trend from 2011 to 2020, particularly after 2017. This was evident in the rising mean and maximum NPP values and the declining minimum NPP value, indicating a clear improvement in carbon sequestration capacity.
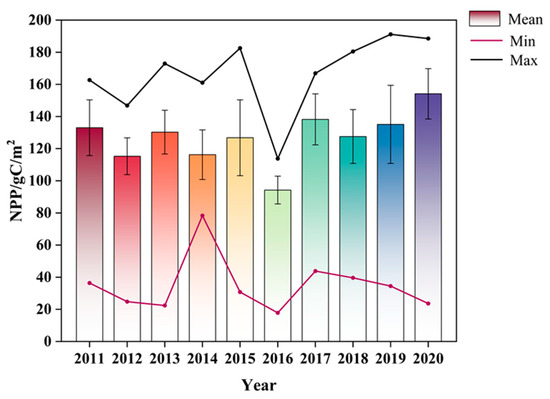
Figure 4.
Time response of August corn NPP in the Fen River Basin.
In Figure 5, the spatial distribution of August corn NPP in the Fen River Basin between 2011 and 2020 ranged from 14.40 gC/m2 to 181.59 gC/m2. Notably, the lowest value of 14.40 gC/m2 was recorded in the middle section of the Fen River Basin in 2014, whereas the highest value of 181.60 gC/m2 was observed in the upper reaches of the Fen River Basin in 2019. Specifically, the August NPP in 2016 generally displayed lower figures, ranging from 16.96 gC/m2 to 108.10 gC/m2, while, in 2011, the August NPP was consistently higher, ranging from 34.54 gC/m2 to 154.54 gC/m2. Overall, the spatial distribution patterns of NPP remained consistent across the years from 2011 to 2020, with the middle section of the Fen River showing the highest corn NPP, followed by the upper and lower reaches. These observations suggested that the spatial distribution of corn NPP in other months of different years may exhibit a similar pattern.
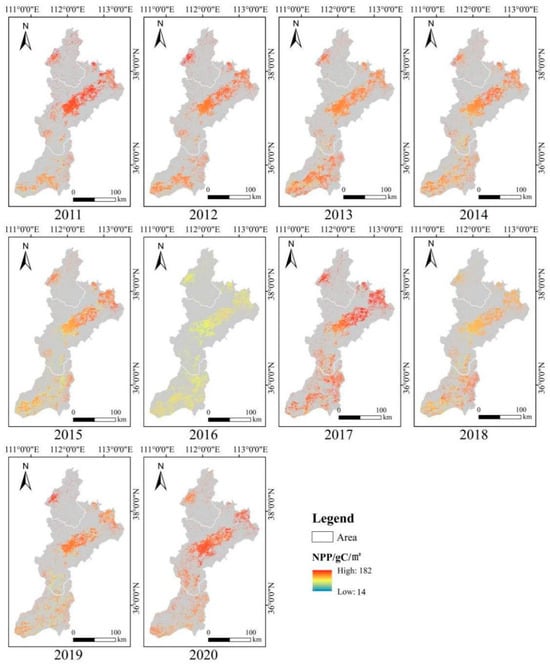
Figure 5.
Spatial distribution of August corn NPP in the Fen River Basin.
3.3. Response of Corn NPP to Climatic Factors
3.3.1. Characterization of Temporal Changes in Climate Factors
The Fen River Basin has a typical semi-arid continental monsoon climate. Figure 6 shows the temperature and precipitation patterns from May to October 2020. Both temperature and precipitation display distinct seasonal variations, forming a single-peaked curve characterized by an initial rise and subsequent decline. Precipitation demonstrated an ascending trend from May to August, with a notable surge in average precipitation during August, reaching its peak before a significant decline. The average monthly precipitation was as follows: May (48.48 mm), June (61.35 mm), July (116.31 mm), August (236.48 mm), September (51.52 mm), and October (14.21 mm). Regarding temperature, the average temperature increased from 17.74 °C in May to 21.60 °C in June and remained relatively stable around 21.50 °C from June to August. However, there was a notable decrease in the average temperature from 16.35 °C in September to 9.04 °C in October.
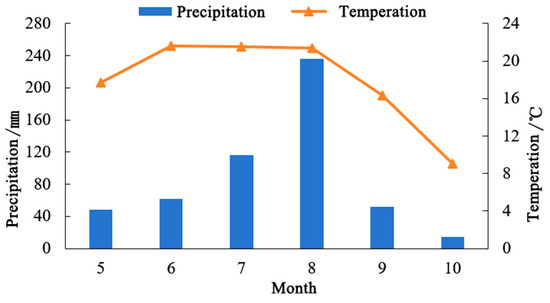
Figure 6.
Trends in temperature and precipitation timing from May to October in Fen River Basin.
The temporal variation in solar radiation within the Fen River Basin from May to October 2020 exhibited a discernible stepwise decline (Figure 7). Solar radiation reached its peak in May at 802.69 MJ/m2. In June and July, there was minimal variation, with solar radiation levels consistently hovering at around 710 MJ/m2. August and September also displayed relatively stable values, although notably lower than those of the preceding months, maintaining an approximate value of 619 MJ/m2. Finally, the solar radiation reached its nadir in October, registering a mere 554.14 MJ/m2.
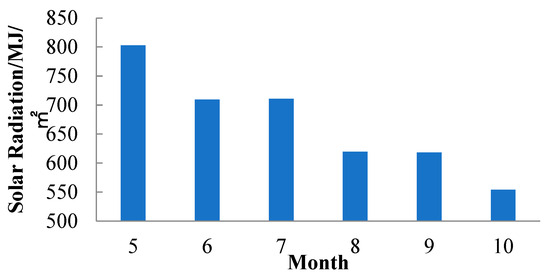
Figure 7.
Temporal trend of solar radiation from May to October in the Fen River Basin.
3.3.2. Response of Corn NPP to Climatic Parameters
Geographical correlation coefficients were computed by analyzing the relationship between corn NPP and climatic parameters, including temperature, precipitation, and solar radiation. This analysis was conducted for each month from May to October 2020 within the Fen River Basin. The resulting correlation coefficients were categorized into six distinct classes and their spatial distributions are shown in Figure 8. Table 2 provides detailed information on the pixel counts and the corresponding proportions within each correlation class.
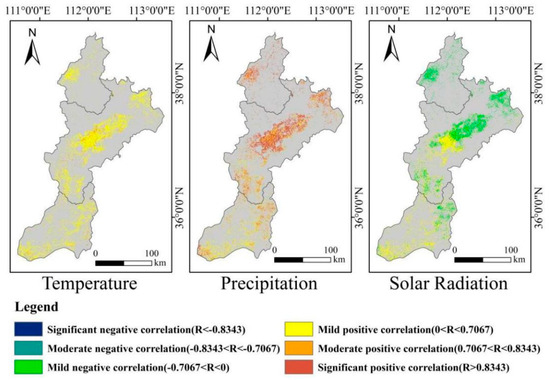
Figure 8.
Geographical response of corn NPP to climatic parameters.
Table 2.
Statistics on the geographical response of corn NPP to climatic parameters.
The geographical correlation coefficients between corn NPP and air temperature ranged from 0.1264 to 0.9344. The response of corn NPP to air temperature within the Fen River Basin demonstrated a predominantly positive correlation, with mild correlations comprising 92.07% of the overall relationship. These mild correlations were primarily observed in the western upper region, northeastern, central, and southern areas of the middle section and in the eastern and southwestern portions of the lower section. Moderate positive correlations accounted for 7.78% and were concentrated in the central area of the middle section, with scattered occurrences in the southern region of the middle section, as well as in the eastern and southwestern regions of the lower section. The category of significant positive correlation was the least prevalent, constituting only 0.15% of the total, with only a few isolated pixels displaying significant positive associations. These significant positive associations were limited to specific locations within the middle and southern areas of the middle section and the southern part of the lower section of the Fen River Basin.
The geographical correlation coefficients between corn NPP and precipitation ranged from −0.2344 to 0.9942. In general, the spatial relationship between corn NPP and precipitation within the Fen River Basin was predominantly positive, accounting for 99.92% of the total. Furthermore, the upper region displayed higher positive correlations than the downstream region, with the midstream region registering higher values than the upper region. Specifically, there were only 16 instances of mild negative correlation, constituting a mere 0.08%. The largest proportion (38.22%) was characterized by significant positive correlations, primarily found in the western and northern areas of the upper section and the central and northeastern regions of the middle section, with relatively sparse occurrences in the lower section of the Fen River Basin, particularly in the southwestern region. Moderate positive correlations constituted the next highest proportion at 37.88%, with prevalent distribution in the western region of the upper section, the northeastern, central, and southern regions of the middle section and the southwest and eastern regions of the lower section. Mild positive correlations accounted for 23.82% and were mainly distributed in the central region of the lower section and the southern region of the middle section, with scattered occurrences in the central and northeastern regions of the middle section.
The geographical correlation coefficients between corn NPP and solar radiation ranged from −0.7860 to 0.8695. Overall, the spatial relationship between corn NPP and solar radiation in the Fen River Basin was primarily characterized by mild negative and mild positive correlations. Specifically, the most prevalent correlation was mildly negative, accounting for 50.80% of the data. This mild negative correlation was predominantly observed in the western and northeastern areas of the upper section, upper and middle regions of the middle section, southern and northeastern regions of the middle section, and eastern portion of the lower section of the Fen River Basin. Conversely, mild positive correlations accounted for 48.29% and were mainly concentrated in the middle and lower sections of the Fen River Basin, with the exception of certain areas in the eastern region. Moderate negative, moderate positive, and significant positive correlations were rare, comprising 0.54%, 0.34%, and 0.03%, respectively. These correlations were sporadically scattered across the western upper, central middle, and southern lower sections of the Fen River Basin.
3.4. Spatial Distribution Characteristics of Aboveground Biomass and Carbon Sequestration in Corn
Equation (5) facilitates the conversion of cumulative corn NPP into aboveground biomass, provided that the root–crown ratio and carbon content parameters are available. The coefficient for converting NPP into carbon sequestration was derived from the chemical equation governing photosynthesis in the green plants. Consequently, corn carbon sequestration was estimated by applying Equations (6) and (7). The geographical distribution of the aboveground biomass of corn is depicted in Figure 9a,b and illustrates the patterns of carbon sequestration in the Fen River Basin for 2020.
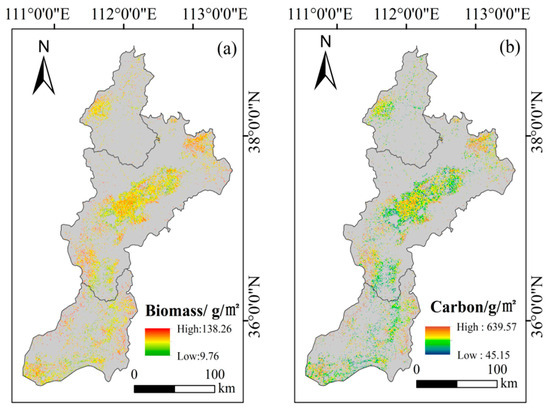
Figure 9.
Spatial distribution of aboveground biomass (a) and carbon sequestration (b) in corn.
In 2020, the aboveground biomass of corn in the Fen River Basin exhibited a range from 9.76 to 138.26 g/m2, following a normal distribution. Notably, a significant majority (97.37%) of the data points were in the range of 40.00–110.00 g/m2. Spatially, the highest aboveground biomass of corn was primarily concentrated in the northwestern region of the lower section and southwestern region of the middle section. Conversely, the lowest values were observed in the central and southwestern regions of the middle and lower sections, respectively. Additionally, scattered occurrences were observed in the western upper section of the Fen River Basin.
In 2020, the total carbon sequestration resulting from corn cultivation in the Fen River Basin ranged from 45.15 to 639.57 g/m2. Notably, there was a linear relationship between total corn carbon sequestration and aboveground biomass, owing to their dependence on corn primary productivity accumulation. Consequently, the geographical distribution patterns of both the total carbon sequestration and aboveground biomass presented similarities. The numerical distribution of total corn carbon sequestration followed a normal distribution, with a substantial proportion (98.24%) falling within the range of 150.00–500.00 g/m2. In addition, the relationship between total carbon sequestration and aboveground biomass with respect to climatic factors mirrored that between NPP and climatic factors without accounting for the influence of other factors.
4. Discussion
The measurement of crop NPP relies on well-established principles and methods, primarily utilizing model estimations based on remote sensing data. However, these estimates can be affected by weather conditions. The accuracy of these measurements can introduce inaccuracies in crop NPP estimation, and variations in meteorological data interpolation methods can lead to errors. Consequently, the results revealed that the cumulative corn NPP in the Fen River Basin from May to October 2020 reached a total of 368.65 gC/m2. Notably, corn NPP exhibited a positive association with air temperature and precipitation but displayed a negative correlation with solar radiation. Fang et al. [44] highlighted precipitation as the primary factor controlling NPP variations in semi-arid and arid regions, while temperature exerted greater influence in semi-humid and humid regions. Additionally, Wei et al. [45] reported precipitation as the key driver of NPP variability in Shaanxi Province. Given the similar climates of Shanxi and Shaanxi provinces, these findings resonate with the results of this study. The inter-annual fluctuations in corn NPP observed in this study may stem from the combined influence of natural environmental factors and human activities. Fan et al. [46] observed an increase in mean annual precipitation and mean annual temperature in Shanxi Province by 99.20 mm and 1.2 °C, respectively, between 1959 and 2008, indicating an improved natural environment and enhanced crop growth. Moreover, Shanxi Province has implemented various ecological conservation and construction projects in recent years, such as land-to-forest conversion and watershed management, thereby fostering NPP growth. A similar investigation conducted by Chen et al. [26] on winter wheat and summer corn in the Huang-Huai-Hai Plain indicated that the lowest average NPP for summer corn was observed in the plains of the northern Jiangsu Province, measuring at 482.10 gC/m2. NPP was positively linked to solar radiation and inversely related to temperature and precipitation. Comparing these findings, the NPP values of summer corn in the Fen River Basin were notably lower than those in the Huang-Huai-Hai Plain. This discrepancy can be attributed to various factors such as climate, soil, and topography, affecting corn growth. The Huang-Huai-Hai Plain, located in the southern region of China, benefits from relatively flat terrain and more favorable climatic conditions conducive to crop growth. However, the Fen River Basin has a more intricate topography and encounters a greater variety of climatic conditions, which may impede the growth of corn. When examining the relationship between NPP and climatic factors, distinctions emerged between the Fen River Basin and Huang-Huai-Hai Plain. This distinction resulted from the fact that the corn growing season is in summer, a period characterized by solar radiation as the limiting factor. In the southern region, there were more rainy days, necessitating higher levels of solar radiation for crop growth, whereas, in the northern region, rainfall decreased, constraining the crop growth. Consequently, in the northern area, NPP was negatively correlated with solar radiation and positively correlated with rainfall and temperature. Conversely, this relationship was reversed in the southern region. Bandaru et al. [18] investigated corn NPP in Iowa and Illinois, USA, reporting an estimated value of 384.00 gC/m2. The key reason for this is the similarity between the climate conditions, topography, and landscape of the Fen River Basin and those of Iowa and Illinois in the USA. These results are consistent with the findings presented in this study, establishing a scientific reference value for the simulation results. Given the linear relationship between aboveground biomass and carbon sequestration in corn and NPP, the results and distribution were similar to those for NPP. Consequently, examining how corn absorbs and stores carbon during its growth has the potential to assess its contribution to mitigating climate change and achieving the goal of “carbon neutrality”. This study contributes to the establishment of a scientific foundation for agricultural practices and ecological conservation. This study primarily focused on examining the spatial and temporal variations in NPP during the corn growing season in the Fenhe River Basin, along with its response to climatic factors. However, this study has certain limitations. First, owing to data limitations, the spatial resolution of the corn distribution data used in this study for the Fen River Basin was set to 30 m. To enhance the precision of corn distribution data extraction, it is imperative to access higher-resolution data for more precise examination of the spatial distribution of corn NPP. Additionally, this study exclusively assessed the impact of environmental variables, such as temperature, precipitation, and solar radiation, on corn NPP changes. In future investigations, it is advisable to include anthropogenic factors such as population density, nighttime lighting, and GDP to conduct a more comprehensive analysis of the underlying factors influencing corn NPP variations.
5. Conclusions
Using remote sensing image data, meteorological observations, digital elevation models, and land use data, this study employed the CASA model and mean value method to simulate corn NPP in the Fen River Basin throughout the corn growing season, spanning from May to October 2020. Subsequently, an analysis was conducted to determine the spatiotemporal variations inherent in NPP. This analysis encompassed an assessment of spatiotemporal variation characteristics. Additionally, correlation analysis was employed to investigate the impact of various environmental conditions on corn NPP in the Fen River Basin. Furthermore, this study applied a biomass inversion model driven by NPP, considering the principles of photosynthesis in green plants, to determine the coefficients of the relationships between aboveground biomass, carbon sequestration, and NPP. As a result, estimates for aboveground biomass and carbon sequestration of corn in the Fen River Basin were generated, with subsequent analysis of their spatial distribution patterns. The primary findings and outcomes of this study are summarized as follows:
- (1)
- In terms of the temporal aspect, the variation in corn NPP in the Fen River Basin from May to October 2020 exhibited a clear and consistent pattern. This pattern follows a unimodal trend characterized by an initial increase, followed by a subsequent decrease. The average NPP value over this period amounted to 368.65 gC/m2, with the highest peak observed in August at 131.71 gC/m2 and the lowest point recorded in October at 11.53 gC/m2. Regarding the spatial distribution, the distribution pattern of corn NPP demonstrated notable features. Overall, the NPP of corn across the Fen River Basin during May to October 2020 ranged from 0.34 gC/m2 to 177.99 gC/m2. The middle section of the basin exhibited the most significant carbon sequestration capability and NPP, followed by the lower and upper sections of the Fen River Basin.
- (2)
- Examining the spatial distribution of August corn NPP within the Fen River Basin from 2011 to 2020 revealed values spanning from 14.40 gC/m2 to 181.59 gC/m2. Notably, the NPP for August in the Fen River Basin in 2016 was generally lower than that in other years, whereas the NPP for August in the Fen River Basin in 2011 was generally higher than that in other years. In terms of temporal analysis, mean NPP values fluctuated within the range from 94.23 gC/m2 to 154.12 gC/m2, displaying an overall upward trend. Notably, the carbon sequestration capacity of corn crops in the Fen River Basin exhibited a positive development, particularly after 2017. During this period, both the mean and maximum values increased, whereas the minimum value decreased, indicating a pronounced enhancement in the carbon sequestration capacity.
- (3)
- Distinct reactions of corn NPP to climatic parameters were evident within the Fen River Basin. Spatially, there was a consistent positive correlation with air temperature, with a slight positive correlation being the dominant factor comprising 92.07% of the correlation. For precipitation, the predominant response was a positive correlation, with a significant positive correlation accounting for 38.22% of the total. Conversely, solar radiation exhibited a negative correlation (50.80%) and a positive correlation (48.29%).
- (4)
- In the Fen River Basin in 2020, the numerical distributions of corn biomass and total carbon sequestration were normally distributed and their spatial distributions were similar to each other. Specifically, the aboveground corn biomass ranged from 9.76 to 138.26 g/m2, with 97.37% of the pixels falling within the range of 40.00 to 110.00 g/m2. Similarly, the total carbon sequestration by corn ranged from 45.15 to 639.57 g/m2, with 98.24% of the pixels having values between 150 and 500 g/m2.
Author Contributions
Conceptualization, G.Y.; methodology, G.Y. and Z.Z.; validation, H.S.; formal analysis, L.H.; investigation, Z.Z., Y.S. and L.H.; data curation, Y.S. and L.H.; writing—original draft preparation, Z.Z.; writing—review and editing, H.S. and G.Y.; visualization, Z.Z.; supervision, G.Y.; funding acquisition, G.Y. All authors have read and agreed to the published version of the manuscript.
Funding
This research was funded by the National Natural Science Foundation of China (51709195, 41807130, and U21A20524), Special Fund for Science and Technology Innovation Teams of Shanxi Province (202304051001016 and 202204051002026), Scientific and Technological Cooperation and Exchange Project of Shanxi Province (202204041101018), and the Fundamental Research Program of Shanxi Province (20210302123213).
Data Availability Statement
The data are available on request from the authors. The data are not publicly available due to confidentiality agreements.
Conflicts of Interest
The authors declare that the research was conducted in the absence of any commercial or financial relationships that could be construed as potential conflict of interest.
References
- Fei, L.; Meijun, Z.; Jiaqi, S.; Zehui, C.; Xiaoli, W.; Jiuchun, Y. Maize, wheat and rice production potential changes in China under the background of climate change. Agric. Syst. 2020, 182, 102853. [Google Scholar] [CrossRef]
- Li, W.; Ruiz-Menjivar, J.; Zhang, L.; Zhang, J. Climate change perceptions and the adoption of low-carbon agricultural technologies: Evidence from rice production systems in the Yangtze River Basin. Sci. Total Environ. 2020, 759, 143554. [Google Scholar] [CrossRef] [PubMed]
- Ullah, F.; Liu, J.; Shafique, M.; Ullah, S.; Rajpar, M.N.; Ahmad, A.; Shahzad, M. Quantifying the influence of Chashma Right Bank Canal on land-use/land-cover and cropping pattern using remote sensing. Ecol. Indic. 2022, 143, 109341. [Google Scholar] [CrossRef]
- Wan, W.; Liu, Z.; Li, K.; Wang, G.; Wu, H.; Wang, Q. Drought monitoring of the maize planting areas in Northeast and North China Plain. Agric. Water Manag. 2021, 245, 106636. [Google Scholar] [CrossRef]
- Khanal, S.; Fulton, J.; Klopfenstein, A.; Douridas, N.; Shearer, S. Integration of high resolution remotely sensed data and machine learning techniques for spatial prediction of soil properties and corn yield. Comput. Electron. Agric. 2018, 153, 213–225. [Google Scholar] [CrossRef]
- Delgado, J.A.; Short, N.M.; Roberts, D.P.; Vandenberg, B. Big Data Analysis for Sustainable Agriculture on a Geospatial Cloud Framework. Front. Sustain. Food Syst. 2019, 3, 54. [Google Scholar] [CrossRef]
- Elijah, O.; Rahman, T.A.; Orikumhi, I.; Leow, C.Y.; Hindia, M.N. An Overview of Internet of Things (IoT) and Data Analytics in Agriculture: Benefits and Challenges. IEEE Internet Things J. 2018, 5, 3758–3773. [Google Scholar] [CrossRef]
- Jha, K.; Doshi, A.; Patel, P.; Shah, M. A comprehensive review on automation in agriculture using artificial intelligence. Artif. Intell. Agric. 2019, 2, 1–12. [Google Scholar] [CrossRef]
- Du, M.; Noguchi, N. Monitoring of Wheat Growth Status and Mapping of Wheat Yield’s within-Field Spatial Variations Using Color Images Acquired from UAV-camera System. Remote Sens. 2017, 9, 289. [Google Scholar] [CrossRef]
- Geipel, J.; Link, J.; Claupein, W. Combined Spectral and Spatial Modeling of Corn Yield Based on Aerial Images and Crop Surface Models Acquired with an Unmanned Aircraft System. Remote Sens. 2014, 6, 10335–10355. [Google Scholar] [CrossRef]
- Lobell, D.B.; Thau, D.; Seifert, C.; Engle, E.; Little, B. A scalable satellite-based crop yield mapper. Remote Sens. Environ. 2015, 164, 324–333. [Google Scholar] [CrossRef]
- Levin, N.; Kyba, C.C.; Zhang, Q.; de Miguel, A.S.; Román, M.O.; Li, X.; Portnov, B.A.; Molthan, A.L.; Jechow, A.; Miller, S.D.; et al. Remote sensing of night lights: A review and an outlook for the future. Remote Sens. Environ. 2020, 237, 111443. [Google Scholar] [CrossRef]
- Meraj, G.; Kanga, S.; Ambadkar, A.; Kumar, P.; Singh, S.K.; Farooq, M.; Johnson, B.A.; Rai, A.; Sahu, N. Assessing the Yield of Wheat Using Satellite Remote Sensing-Based Machine Learning Algorithms and Simulation Modeling. Remote Sens. 2022, 14, 3005. [Google Scholar] [CrossRef]
- Prince, S.D. A model of regional primary production for use with coarse resolution satellite data. Int. J. Remote Sens. 2007, 12, 1313–1330. [Google Scholar] [CrossRef]
- Chen, F.; Wang, S.; Bai, X.; Liu, F.; Zhou, D.; Tian, Y.; Luo, G.; Li, Q.; Wu, L.; Zheng, C.; et al. Assessing spatial-temporal evolution processes and driving forces of karst rocky desertification. Geocarto Int. 2019, 36, 262–280. [Google Scholar] [CrossRef]
- Karthikeyan, L.; Chawla, I.; Mishra, A.K. A review of remote sensing applications in agriculture for food security: Crop growth and yield, irrigation, and crop losses. J. Hydrol. 2020, 586, 124905. [Google Scholar] [CrossRef]
- Servia, H.; Pareeth, S.; Michailovsky, C.I.; de Fraiture, C.; Karimi, P. Operational framework to predict field level crop biomass using remote sensing and data driven models. Int. J. Appl. Earth Obs. Geoinf. 2022, 108, 102725. [Google Scholar] [CrossRef]
- Bandaru, V.; West, T.O.; Ricciuto, D.M.; Izaurralde, R.C. Estimating crop net primary production using national inventory data and MODIS-derived parameters. ISPRS J. Photogramm. Remote Sens. 2013, 80, 61–71. [Google Scholar] [CrossRef]
- Hazarika, M.K.; Yasuoka, Y.; Ito, A.; Dye, D. Estimation of net primary productivity by integrating remote sensing data with an ecosystem model. Remote Sens. Environ. 2005, 94, 298–310. [Google Scholar] [CrossRef]
- Potter, C.S.; Randerson, J.T.; Field, C.B.; Matson, P.A.; Vitousek, P.M.; Mooney, H.A.; Klooster, S.A. Terrestrial ecosystem production: A process model based on global satellite and surface data. Glob. Biogeochem. Cycles 1993, 7, 811–841. [Google Scholar] [CrossRef]
- Tripathi, P.; Patel, N.R.; Kushwaha, S.P.S. Estimating net primary productivity in tropical forest plantations in India using satellite-driven ecosystem model. Geocarto Int. 2017, 33, 988–999. [Google Scholar] [CrossRef]
- Cox, P.M.; Betts, R.A.; Jones, C.D.; Spall, S.A.; Totterdell, I.J. Acceleration of global warming due to carbon-cycle feedbacks in a coupled climate model. Nature 2000, 408, 184–187. [Google Scholar] [CrossRef]
- Robinson, D.; Brown, D.; Currie, W. Modelling carbon storage in highly fragmented and human-dominated landscapes: Linking land-cover patterns and ecosystem models. Ecol. Model. 2009, 220, 1325–1338. [Google Scholar] [CrossRef]
- Norby, R.J.; Warren, J.M.; Iversen, C.M.; Medlyn, B.E.; McMurtrie, R.E. CO2 enhancement of forest productivity constrained by limited nitrogen availability. Proc. Natl. Acad. Sci. USA 2010, 107, 19368–19373. [Google Scholar] [CrossRef] [PubMed]
- Luo, X.; Jia, B.; Lai, X. Contributions of climate change, land use change and CO2 to changes in the gross primary productivity of the Tibetan Plateau. Atmos. Ocean. Sci. Lett. 2019, 13, 8–15. [Google Scholar] [CrossRef]
- Chen, H.; Zhuang, D. Estimation of cropland net primary production using remote sensing methods. In Proceedings of the 2012 First International Conference on Agro-Geoinformatics, Shanghai, China, 2–4 August 2012; pp. 1–5. [Google Scholar]
- Su, Y.; Ma, X.; Feng, Q.; Liu, W.; Zhu, M.; Niu, J.; Liu, G.; Shi, L. Patterns and controls of ecosystem service values under different land-use change scenarios in a mining-dominated basin of northern China. Ecol. Indic. 2023, 151, 110321. [Google Scholar] [CrossRef]
- Zhao, Y.; Wang, F. Dynamic changes of land use/cover and landscape pattern in the upper and middle reaches of the Fen River Basin in Shanxi Province, China. Preprints 2023. [Google Scholar] [CrossRef]
- Zhu, H.; Bi, R.; Duan, Y.; Xu, Z. Scale-location specific relations between soil nutrients and topographic factors in the Fen River Basin, Chinese Loess Plateau. Front. Earth Sci. 2016, 11, 397–406. [Google Scholar] [CrossRef]
- Almorox, J.; Hontoria, C. Global solar radiation estimation using sunshine duration in Spain. Energy Convers. Manag. 2004, 45, 1529–1535. [Google Scholar] [CrossRef]
- Zhu, W.Q.; Pan, Y.Z.; Zhang, J.S. Remote sensing estimation of net primary productivity of terrestrial vegetation in China. J. Plant Ecol. 2007, 31, 413. [Google Scholar] [CrossRef]
- Bao, G.; Bao, Y.; Qin, Z.; Xin, X.; Bao, Y.; Bayarsaikan, S.; Zhou, Y.; Chuntai, B. Modeling net primary productivity of terrestrial ecosystems in the semi-arid climate of the Mongolian Plateau using LSWI-based CASA ecosystem model. Int. J. Appl. Earth Obs. Geoinf. 2016, 46, 84–93. [Google Scholar] [CrossRef]
- Monteith, J.L. Solar Radiation and Productivity in Tropical Ecosystems. J. Appl. Ecol. 1972, 9, 747–766. [Google Scholar] [CrossRef]
- Field, C.B.; Behrenfeld, M.J.; Randerson, J.T.; Falkowski, P. Primary Production of the Biosphere: Integrating Terrestrial and Oceanic Components. Science 1998, 281, 237–240. [Google Scholar] [CrossRef] [PubMed]
- Hicke, J.A.; Asner, G.P.; Randerson, J.T.; Tucker, C.; Los, S.; Birdsey, R.; Jenkins, J.C.; Field, C. Trends in North American net primary productivity derived from satellite observations, 1982–1998. Glob. Biogeochem. Cycles 2002, 16, 1–14. [Google Scholar] [CrossRef]
- Nayak, R.K.; Patel, N.R.; Dadhwal, V.K. Estimation and analysis of terrestrial net primary productivity over India by remote-sensing-driven terrestrial biosphere model. Environ. Monit. Assess. 2009, 170, 195–213. [Google Scholar] [CrossRef] [PubMed]
- Xing, X.; Xu, X.; Zhang, X.; Zhou, C.; Song, M.; Shao, B.; Ouyang, H. Simulating net primary production of grasslands in northeastern Asia using MODIS data from 2000 to 2005. J. Geogr. Sci. 2010, 20, 193–204. [Google Scholar] [CrossRef]
- Field, C.B.; Randerson, J.T.; Malmström, C.M. Global net primary production: Combining ecology and remote sensing. Remote Sens. Environ. 1995, 51, 74–88. [Google Scholar] [CrossRef]
- Zhang, G.; Xu, X.; Zhou, C.; Zhang, H.; Ouyang, H. Responses of grassland vegetation to climatic variations on different temporal scales in Hulun Buir Grassland in the past 30 years. J. Geogr. Sci. 2011, 21, 634–650. [Google Scholar] [CrossRef]
- Wang, Y.; Xu, X.; Huang, L.; Yang, G.; Fan, L.; Wei, P.; Chen, G. An Improved CASA Model for Estimating Winter Wheat Yield from Remote Sensing Images. Remote Sens. 2019, 11, 1088. [Google Scholar] [CrossRef]
- Bolinder, M.; Janzen, H.; Gregorich, E.; Angers, D.; VandenBygaart, A. An approach for estimating net primary productivity and annual carbon inputs to soil for common agricultural crops in Canada. Agric. Ecosyst. Environ. 2007, 118, 29–42. [Google Scholar] [CrossRef]
- Cheng, W.; Sims, D.A.; Luo, Y.; Coleman, J.S.; Johnson, D.W. Photosynthesis, respiration, and net primary production of sunflower stands in ambient and elevated atmospheric CO2 concentrations: An invariant NPP:GPP ratio? Glob. Chang. Biol. 2000, 6, 931–941. [Google Scholar] [CrossRef]
- Cramer, W.; Kicklighter, D.W.; Bondeau, A.; Iii, B.M.; Churkina, G.; Nemry, B.; Ruimy, A.; Schloss, A.L.; The Participants of the Potsdam NPP Model Intercomparison. Comparing global models of terrestrial net primary productivity (NPP): Overview and key results. Glob. Chang. Biol. 2001, 5, 1–15. [Google Scholar] [CrossRef]
- Fang, X.; Zhang, C.; Wang, Q.; Chen, X.; Ding, J.; Karamage, F. Isolating and Quantifying the Effects of Climate and CO2 Changes (1980–2014) on the Net Primary Productivity in Arid and Semiarid China. Forests 2017, 8, 60. [Google Scholar] [CrossRef]
- Wei, X.; Yang, J.; Luo, P.; Lin, L.; Lin, K.; Guan, J. Assessment of the variation and influencing factors of vegetation NPP and carbon sink capacity under different natural conditions. Ecol. Indic. 2022, 138, 108834. [Google Scholar] [CrossRef]
- Fan, X.-H.; Wang, M.-B. Change trends of air temperature and precipitation over Shanxi Province, China. Theor. Appl. Clim. 2010, 103, 519–531. [Google Scholar] [CrossRef]
Disclaimer/Publisher’s Note: The statements, opinions and data contained in all publications are solely those of the individual author(s) and contributor(s) and not of MDPI and/or the editor(s). MDPI and/or the editor(s) disclaim responsibility for any injury to people or property resulting from any ideas, methods, instructions or products referred to in the content. |
© 2024 by the authors. Licensee MDPI, Basel, Switzerland. This article is an open access article distributed under the terms and conditions of the Creative Commons Attribution (CC BY) license (https://creativecommons.org/licenses/by/4.0/).