Article

Influence of the Long-Term Application of Management Practices (Tillage, Cover Crop and Glyphosate) on Greenhouse Gas Emissions and Soil Physical Properties

by
Modupe Olufemi Doyeni
*,
Skaidre Suproniene
,
Agne Versuliene
,
Loreta Meskauskiene
and
Grazina Kadziene
*
Lithuanian Research Centre for Agriculture and Forestry, Institute of Agriculture, Instituto al. 1, Kedainiai Distr., LT-58344 Akademija, Lithuania
*
Authors to whom correspondence should be addressed.
Sustainability 2024, 16(7), 2859; https://doi.org/10.3390/su16072859
Submission received: 19 February 2024 / Revised: 20 March 2024 / Accepted: 27 March 2024 / Published: 29 March 2024

Abstract

:
Soil treatments have a significant influence on the agricultural and environmental productivity of agricultural practices. Arable lands are one of the sources of greenhouse gas emissions (GHG) that are influenced by the chemical and physical properties of the soil and are an essential contributor to climate change. We aim to evaluate the long-term management of agricultural practices, such as different tillage systems, cover crops, and glyphosate, on GHG emissions and soil physical properties. The field trial involved three tillage systems (conventional tillage (CT), reduced tillage (RT), and no-tillage (NT)), along with variations in cover cropping (with and without cover crops) and glyphosate application (with and without glyphosate). These treatments were implemented during the cultivation of oilseed rape in 2022 as part of a cropping sequence consisting of five crops: winter wheat; winter oilseed rape; spring wheat; spring barley; and field pea. Greenhouse gas emissions (carbon dioxide (CO2), methane (CH4), and nitrous oxide (N2O)) were directly measured using a closed static chamber system. Through the examination of these management techniques, the soil’s physical properties over the studied period were assessed for their impact on GHG fluxes. The findings of the study reveal that N2O emissions were relatively low during the first month of measurement, with significant differences (p < 0.05) observed in the interaction between cover crop and glyphosate treatments. Additionally, N2O emissions were notably elevated in the reduced (0.079 µg m−2 h−1) and conventional tillage (0.097 µg m−2 h−1) treatments at the second month of measurement. Regarding CH4, increased emissions were observed in the reduced tillage and cover crop treatments. CO2 emissions exhibited variability across all of the investigated treatments. Notably, GHG fluxes spiked at the second measurement, signifying the maximum uptake of nutrients by the main plants during the growth phase. Greenhouse gas emissions leveled off across all of the treatments following the harvest, marking the end of the cultivation period. The influence of the deployed techniques varied across the determined physical parameters of the soil. The incorporation of cover crops contributed to improved water content and, further, to electrical conductivity. Glyphosate use showed no direct impact on physical properties of the soil while the different tillage treatments had varying effects on the distribution of the physical properties of the soil with respect to the degree of disturbance or tillage-induced changes. Additionally, GHG emissions were strongly correlated with precipitation at one week and two weeks before sampling, except for CO2, which showed a weaker correlation at two weeks before GHG sampling. The findings indicate that reduced and conventional tillage methods might adversely affect greenhouse gas emissions and plant functionality, particularly concerning nutrient release and uptake, especially in temperate climate conditions.

1. Introduction

Sustainable agriculture is becoming more integrated to meet the growing needs of food production amidst a rapid demand for self-reliance and sustainability, higher crop productivity, and growing climate change impacts. Improving agricultural management techniques and sustainable agricultural practices has thus become the main objective to enhance soil health and mitigate climate change. Essential aspects in this context are management practices, such as conservation and regenerative techniques, that aim to reduce degradation/loss while preserving the soil ecosystem’s biodiversity, nutrients, and physical attributes.
Conservation practices, such as reduced tillage and organic material inputs, as management practices have a range of benefits, including improved soil structure, nutrient enrichment, increased soil carbon stock, enhanced biodiversity, reduced loss of nutrients through run-off and/or leaching and environmental stability [1]. Europe’s common agricultural policy (CAP) has sought to ensure farmers utilize these sustainable techniques to manage soils and maintain ecosystem services [2,3]. However, farmers and agricultural practitioners often face complex decisions from the different range of solutions proposed across the farming system, each with its benefits and limitations. Furthermore, farmers’ dwindling economic gains and the potentially longer period needed to achieve positive results have discouraged conservative practices such as no till (NT) and regenerative or organic agriculture (lesser chemical inputs). Nevertheless, other sustainable practices, such as cover crops and reduced tillage (RT), biofertilizers, and crop residues, are being proposed to compensate for and utilize their multiple benefits on soil and crop yield. Opinions from scientists and practitioners continue to be aired on the different tillage systems (conventional and conservation) due to the changes imposed on soil health. Conservation tillage is one of the techniques applied without intensive cultivation that involves directly sowing crops on the soil, hence offering minimal soil disturbance [2,3,4]. Reduced tillage (RT), on the other hand, is also a form of conservation tillage, as it retains crop residues on the soil surface and preserves soil structure. RT loosens the soil with reduced levels of manipulation to various depths [5,6]. NT typically leaves the soil covered with 30–100% crop residue. Intensive or conventional tillage offers multiple benefits as well as negative benefits. Chief among the negatives are the loss of vital nutrients, increased greenhouse gas (GHG) emissions, and soil degradation. Other management practices involve farmers aiming to control weeds and other invasive plant species with glyphosate. Glyphosate is a non-selective, broad-spectrum herbicide that is effective for controlling plants (annual and perennial) used in agricultural fields and in orchards, forests, parks, squares, and railways [7]. Although widely acceptable for use worldwide due to its relative safety and efficacy in weed control [8], the extensive use of glyphosate and its toxicity, persistence, and the residues it leaves in the soil are serious environmental and food safety concerns, particularly in conventional agriculture [8,9]. The function of glyphosate use in soil is multidimensional as it impacts different soil partakers. Although it has been regarded as environmentally safe due to its vulnerability to microbial degradation, its active ingredient, aminomethylphosphonic acid, exhibits a high affinity for binding to soil particles [10]. The extent and long-term consequences of glyphosate use on the soil microbial community are still debated. Their influence may alter microbial diversity and activity along the line of targeted and non-targeted microorganisms. Duke and Powles, 2008 [11] have reported that glyphosate has no impact on soil microorganism diversity and activity. In other studies, it has been reported that soil microbial biomass decreases with higher doses of glyphosate [12]. Studies have also highlighted the disruptive effects of glyphosate on soil fauna (earthworms) and their interactions with symbiotic mycorrhizal fungi [10,13].
Cover crops, whether annual, biennial, or perennial herbaceous plants, are cultivated throughout all or a portion of the year. Generally, incorporating cover crops can reduce soil bulk density, increase pore volume and hydraulic conductivity, and enhance soil aeration and root growth, primarily attributed to the rise in soil organic carbon content [14]. Legume cover crops, such as Persian clover, have the potential to reduce fertilizer N requirements for subsequent crops through their ability to fix N biologically, increase soil organic matter, and suppress weeds [15,16]. Similarly, non-legume cover crops could further boost the absorption of excess nutrients in the soil, increasing plant biomass and improving soil texture [16,17]. Thus, integrating the multiple benefits of cover crops as part of agricultural management practices could lead to soil health improvement and environmental sustainability.
Soil health is an essential concept in sustainable agriculture practices, with the goals of promoting resource conservation, environmental protection, and global food production. Environmental protection (mitigating GHG and contamination) and soil ecosystem (soil structure, fertility, and biodiversity) are paramount in agriculture. Some studies have focused on using different tillage techniques to protect the soil [18,19], while some have researched glyphosate useability to enhance environmental protection [20,21,22]. However, few studies have integrated multiple management techniques over a long-term period, especially regarding the influence of soil tillage systems, application of glyphosate, and cover crop cultivation on GHG emissions and other soil parameters.
Hence, this study expands on existing long-term research on multiple agricultural practices involving different tillage systems, integration of cover crops and glyphosate application. It was hypothesized that the study would give a better insight into which of these systems or their combinations would positively impact soil health (physical properties) and mitigate GHG emissions across these integrated systems. This study aimed to examine the influence of long-lasting agricultural practices, such as different tillage systems, cover crops, and glyphosate, on GHG emissions and soil physical properties.

2. Materials and Methods

2.1. Site and Soil Description

The field experiment was carried out at the Institute of Agriculture, Lithuanian Research Centre for Agriculture and Forestry in Central Lithuania (55°23′50″ N and 23°51′40″ E). The soil of the experimental site was classified as Endocalcari-Epihypogleyic Cambisol [23]. The loam soil of neutral reaction (pH KCl 7.0, measured potentiometrically) includes 1.4% of organic carbon (dry combustion method), 229 mg kg−1 of available phosphorus, and 250 mg kg−1 of available potassium (A-L method) [24,25]. This experiment has long-lasting practices of different tillage, such as conventional tillage (ploughing 22–24 cm), reduced tillage (harrowing 8–10 cm), and no tillage (direct drilling), that were established in 2003. Cropping sequences consisted of five-member crop rotation: winter wheat, winter oilseed rape, spring wheat, spring barley, and field pea. The crop maintenance was undertaken according to common agricultural practices and crop needs. Cover crop management (with and without cover crop) was included from 2013 (with spring wheat growth) by dividing the experimental field into two parts across tillage treatments. Cover crops were grown three times per cropping sequence, as follows: after spring wheat, spring barley, and winter oilseed rape. White mustard seeds were sown 2–3 weeks before the spring wheat and spring barley harvest, and white (or Persian) clover at the renewal of winter oilseed rape (WOSR) vegetation (early spring). Cover crop seeds were spread out on the top of the ground with a fertilizer spreader. Glyphosate usage (with and without glyphosate) was included from 2017, splitting each tillage–cover crop plot lengthwise. Glyphosate was used yearly, a small number of days before the autumn tillage.
Finally, since 2017 the experiment was organized as a three-factorial split-plot design in three replications (total of 36 plots), with the tillage treatment (main plots—10 × 20 m) considered as factor A: Conventional tillage (CT), Reduced tillage (RT), and No-till (NT). Cover crops (CC) (sub-plots—10 × 10 m) were considered together as Factor B: with cover crops (CC (+)), and without cover crops (CC (−)); and glyphosate (sub-sub-plots—5 × 10 m) was considered as Factor C: with glyphosate (G (+)), and without glyphosate (G (−)).
GHG emissions and soil physical properties were evaluated during the WOSR growing season in 2021–2022. WOSR was sown in autumn 2021, and cover crop (Persian clover) was seeded in CC sub-plots in spring 2022. NPK fertilizers (NPK 6:18:34+S2 at the rate of 400 kg ha−1) were applied in autumn before the sowing of WOSR. Additionally, ammonium sulphate fertilizers (at the rate of 110 kg ha−1 of nitrogen) were applied in early spring, followed by ammonium nitrate (at an amount of 80 kg ha−1 of N) after the renewal of WOSR vegetation, approximately one month prior to first greenhouse gas measurement.

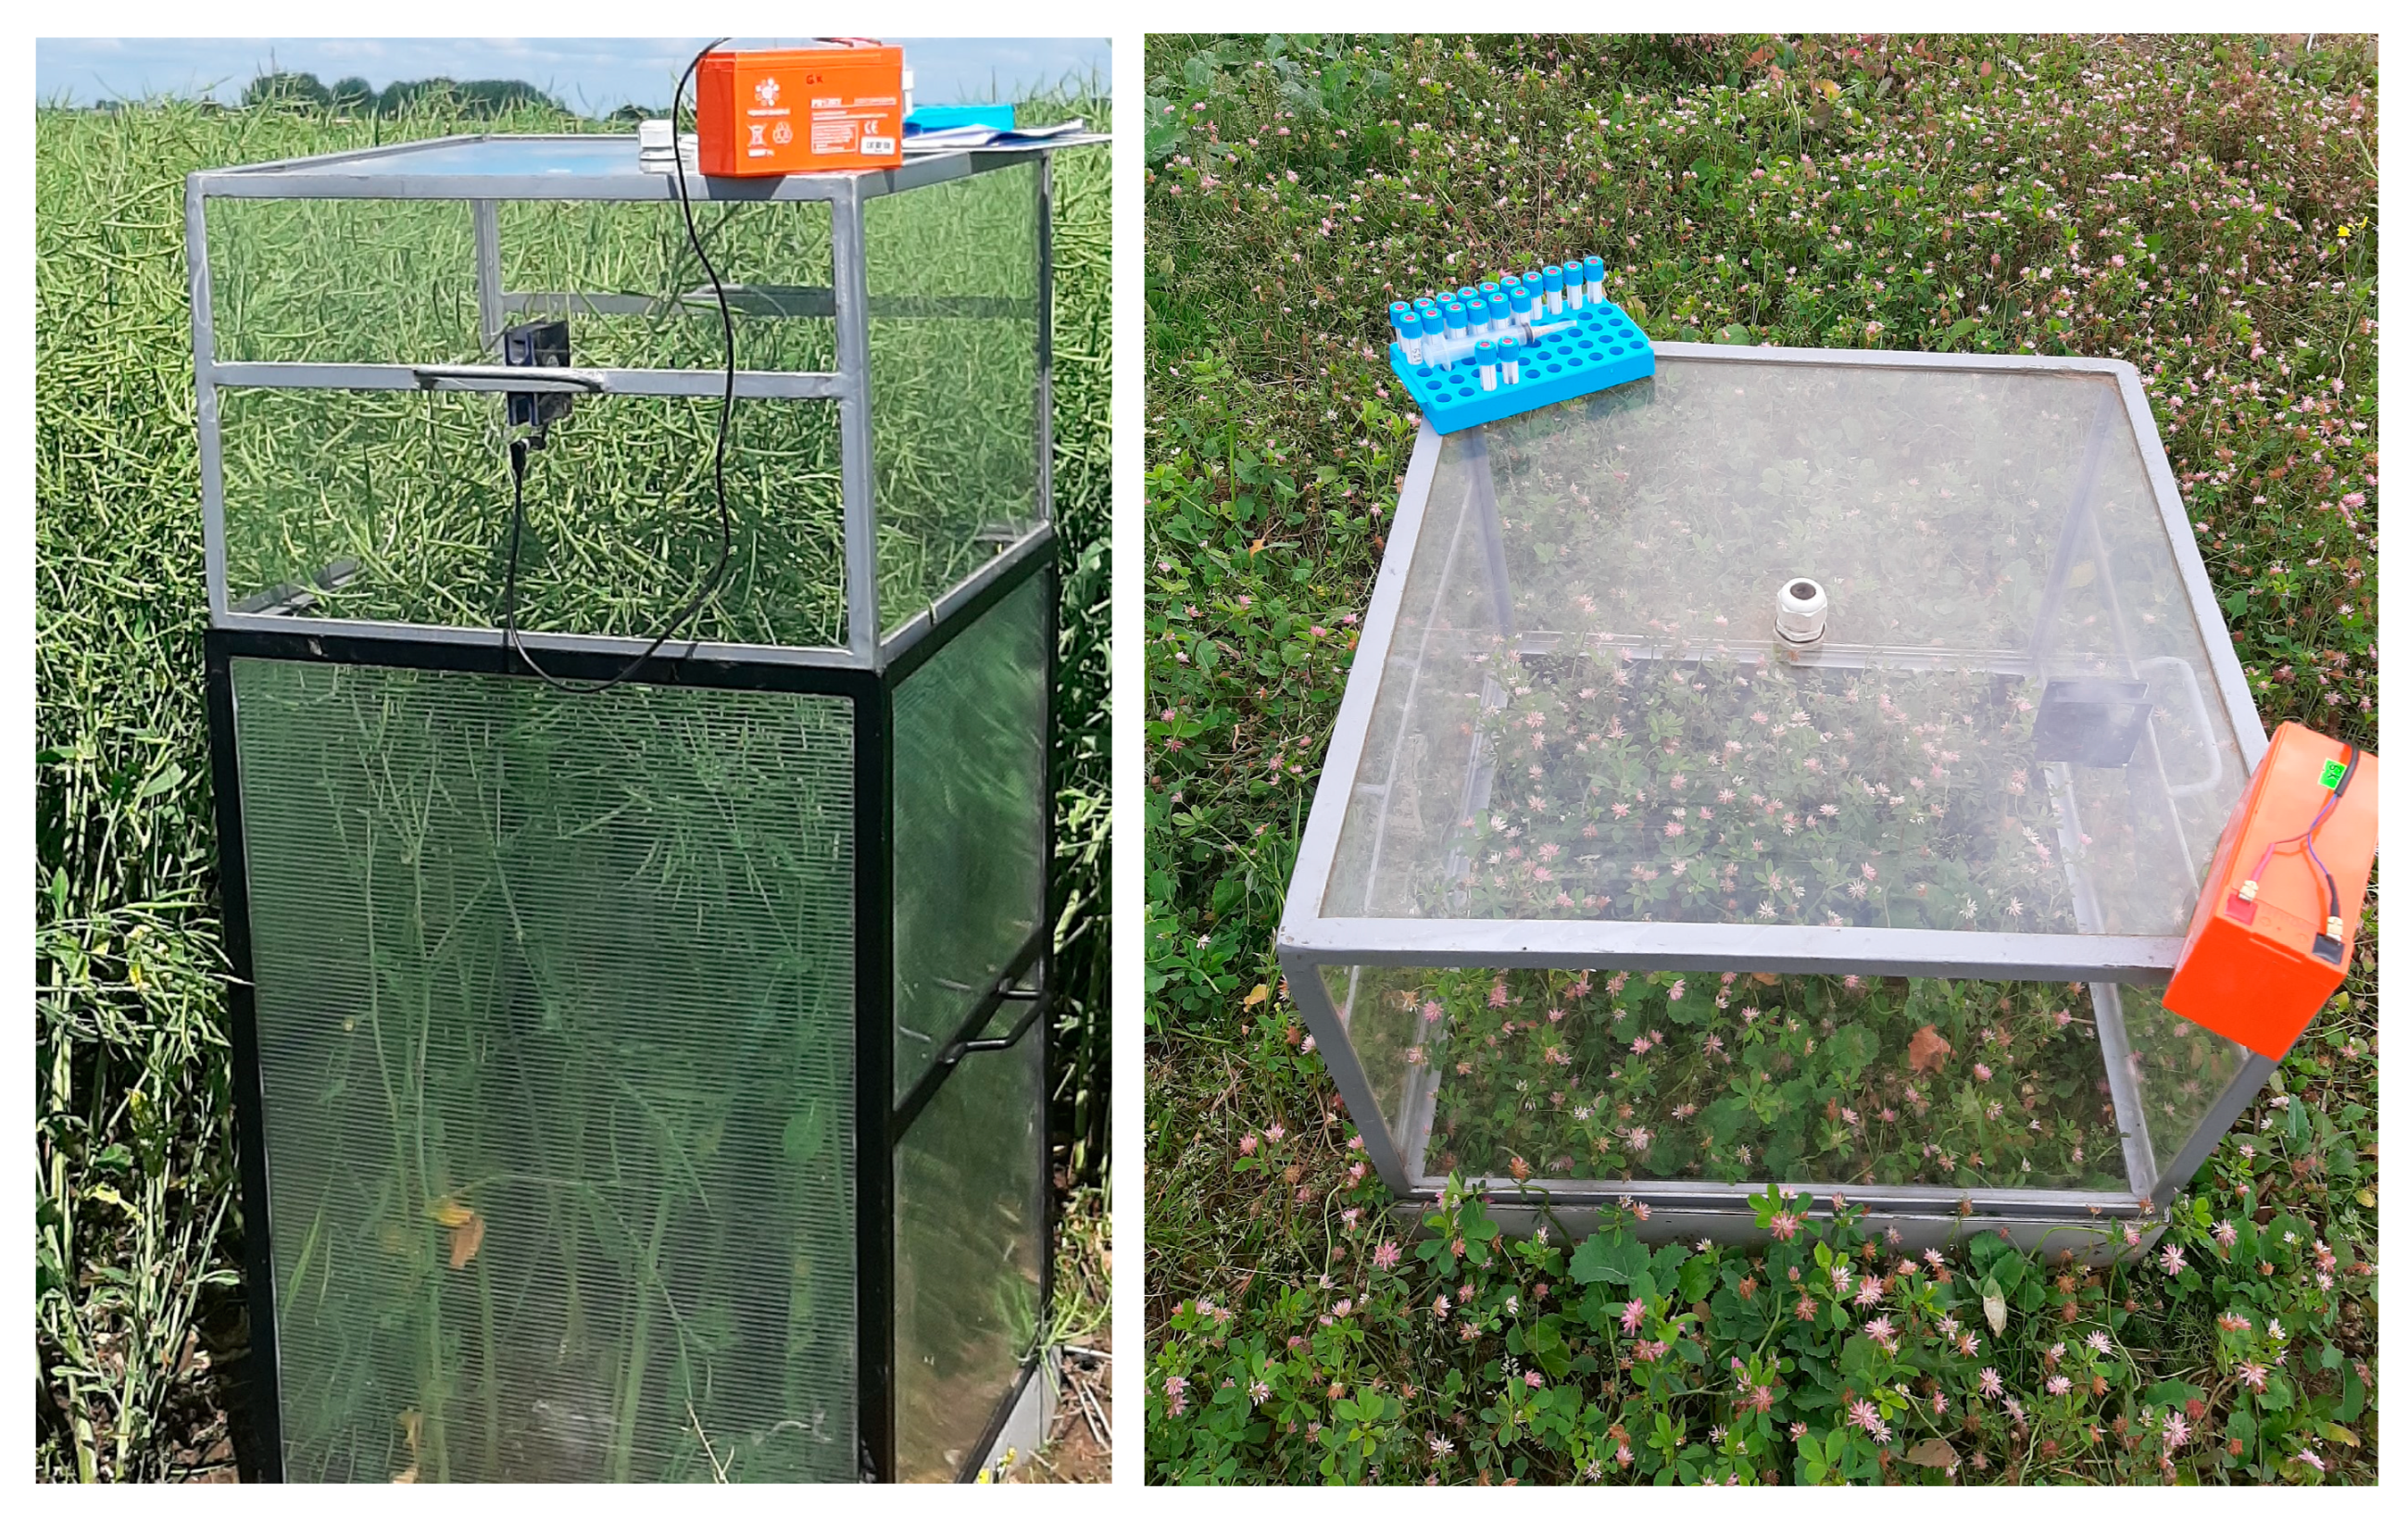
2.2. Gas Sampling and Flux Calculation

The static chamber was used to measure the fluxes with the chamber base box (frame) having a U-shaped groove at the top edge to hold a removable chamber box. Two chamber boxes, measuring 0.306 m3 (open head) and 0.136 m3 (closed head), were used. In the first and second months, the big box along with the small box were used as oil seed rape growth was at its peak, while only the small box was used in the third, fourth, and fifth measurements after the harvest of WOSR (Figure 1). The measuring times for the gas samplings were approximately 5 min and 3 min. The stainless-steel frames used to measure the GHG were permanently embedded in the soil, reaching a depth of 10 cm. The enclosed area within the frame measured 0.36 m2. The big box (chamber) measured 60 × 60 × 85 cm in height, while the small box (chamber) measured 59 × 59 × 39 cm in height. The chamber was closed for approximately 5 and 3 min for the gas samplings. Sampling was conducted between 9 a.m. and 12 a.m. to enhance the accuracy and consistency of gaseous flux estimations. Gas samples were extracted in 10 mL vials using a tightly sealed 10 cc syringe. Glass vials with rubber tubing were utilized as lids for collecting the gas samples. The CO2, N2O, and CH4 fluxes were measured at monthly intervals between the instances of maximum nutrient uptake and of lowest nutrient uptake by the plants. The samples were taken from each plot at intervals of approximately 1 month to cover the period of cover crops establishment for 2022, and each treatment had three replicates. The collected gas samples were analyzed using the gas chromatography technique with slight modifications [26,27]. By using the base area of the static chamber, within-chamber air temperature (T), air pressure (P), the constant R (0.0821 L·atm/mol·K), and chamber volume (V), the flux calculations of CO2, N2O and CH4 were calculated according to the subsequent ideal gas law [27,28]. The flux rate of each greenhouse gas (GHG) was calculated by assessing the rate of GHG concentration change within the chamber. This was determined by calculating the slope of the linear regression between GHG concentration and gas sampling time. The cumulative CO2, N2O, and CH4 flux rates over the studied growing season (May to October) were calculated by linear interpolation between the daily fluxes.

2.3. Measurement of Soil Physical Properties

Soil samples were collected in the spring of 2020 and 2021, when soil moisture was close to field capacity. Undisturbed soil cores were taken with steel cylinders (height (5 cm), diameter (5 cm), volume (100 cm3) from 5–10 and 15–20 cm layers (to represent the arable layer 0–20 cm) in 3 replications × 3 sub-replications per each tillage and cover crop treatment (in total 108 samples each year)). Soil cores were oven-dried at 105 °C for 24 h. Samples were weighed before and after oven-drying to calculate the soil water content and bulk density (BD). The TP was calculated from the ratio between BD and particle density (PD) 2.65 (g cm−3), as shown in the following equation:
TP = 1 (BD/PD)
Soil water stable aggregates (WSA) distribution was determined by the N. Savinov method in 0–20 cm soil layer. The samples were taken at the same time as undisturbed soil cores. Soil volumetric water content (VWC) and pore electrical conductivity (EC) were measured by the FDR method in a 0–10 cm layer with an HH2 probe + WET sensor at the same time as the measurement of GHG during winter oil seed rape (WOSR) growth and after harvest (first three measurements). In the fourth and fifth GHG measurements, soil moisture, and temperature data were obtained at the closest weather station (distance < 0.5 km). Water field pore space (WFPS) was calculated from the ratio between VWC and TP:
WFPS = 100 × VWC/TP
The soil temperature was measured at a depth of 0–10 cm in each plot, and, at the same time, VWC and EC measurements were taken using a digital long-stem thermometer (Spectrum Technologies, Aurora, IL, USA).

2.4. Statistical Analysis

Averages of two soil depths (5−10 and 15−20 cm) and 3 sub-replicates were calculated for TP and BD and used for the statistical analysis. The measurements were tested using a three-way analysis of variance (ANOVA), considering tillage, cover crops, and glyphosate. Significant differences were determined using the Tukey test for repeated measures, with a significance level set at p < 0.05. The Pearson correlation coefficient was used to examine relationships between precipitation and CO2, N2O, and CH4. Pearson’s correlations among different soil physical parameters and GHG were calculated in “R” using the package Hmisc [29]. GHG flux distributions were assessed for normality using the Shapiro–Wilk test at a significance level of α = 0.05. All statistical analyses were performed using “R” version 4.0.3 [29].

3. Results

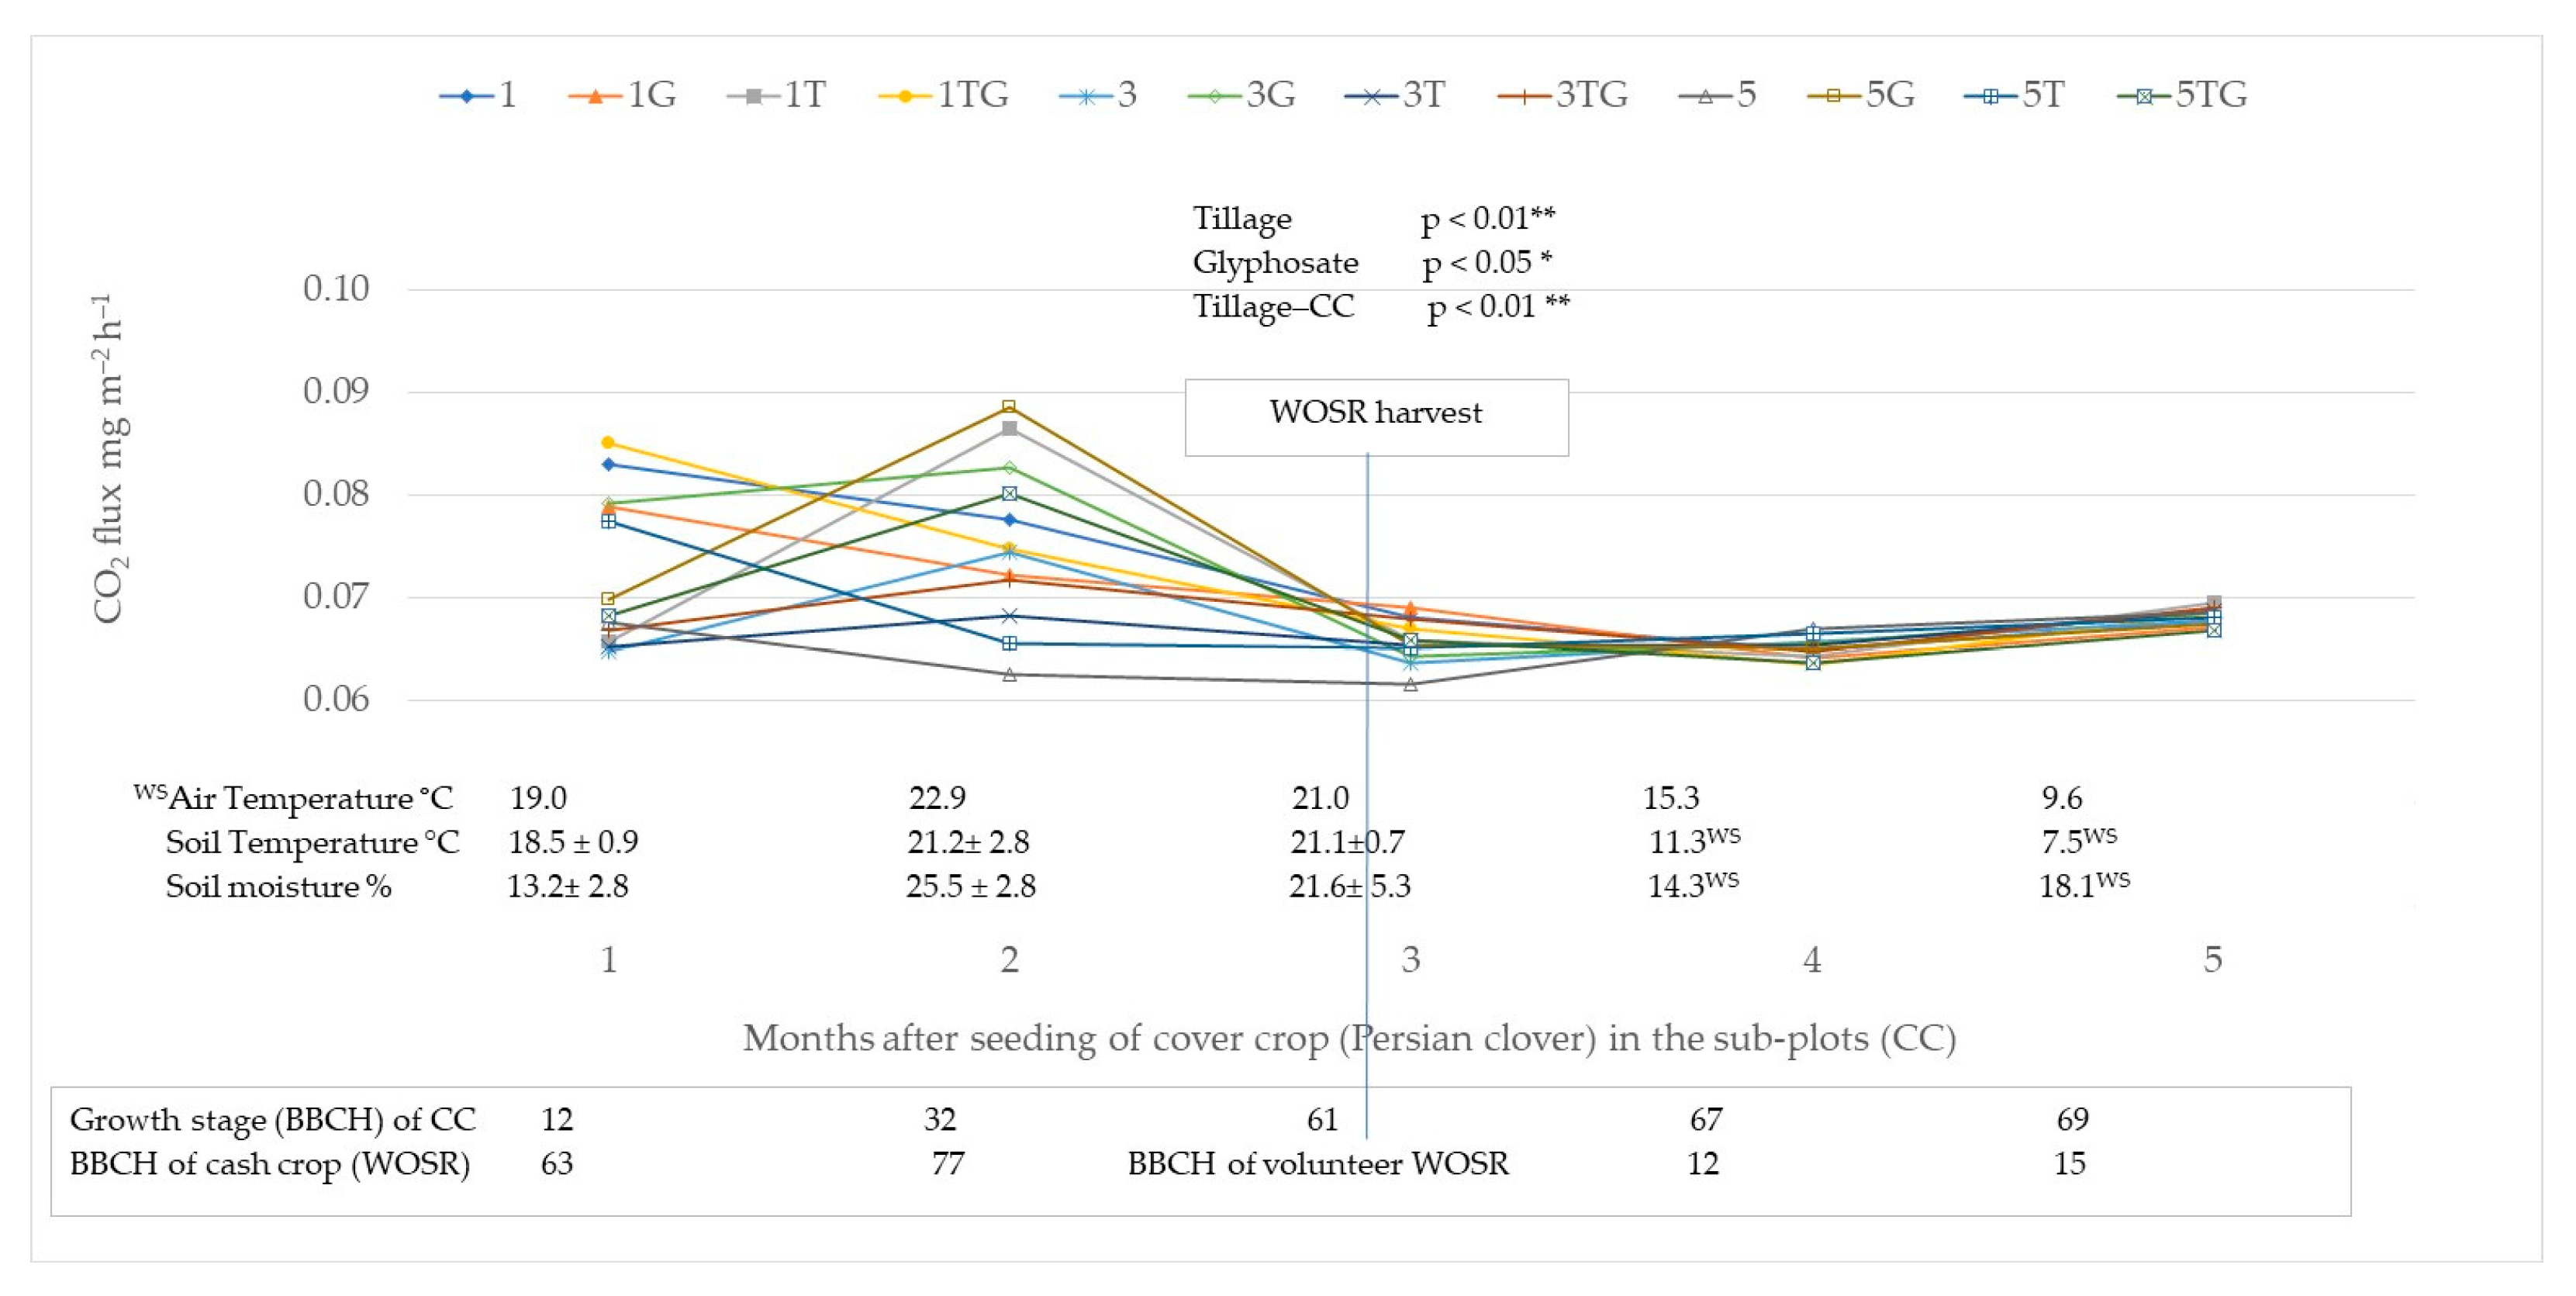
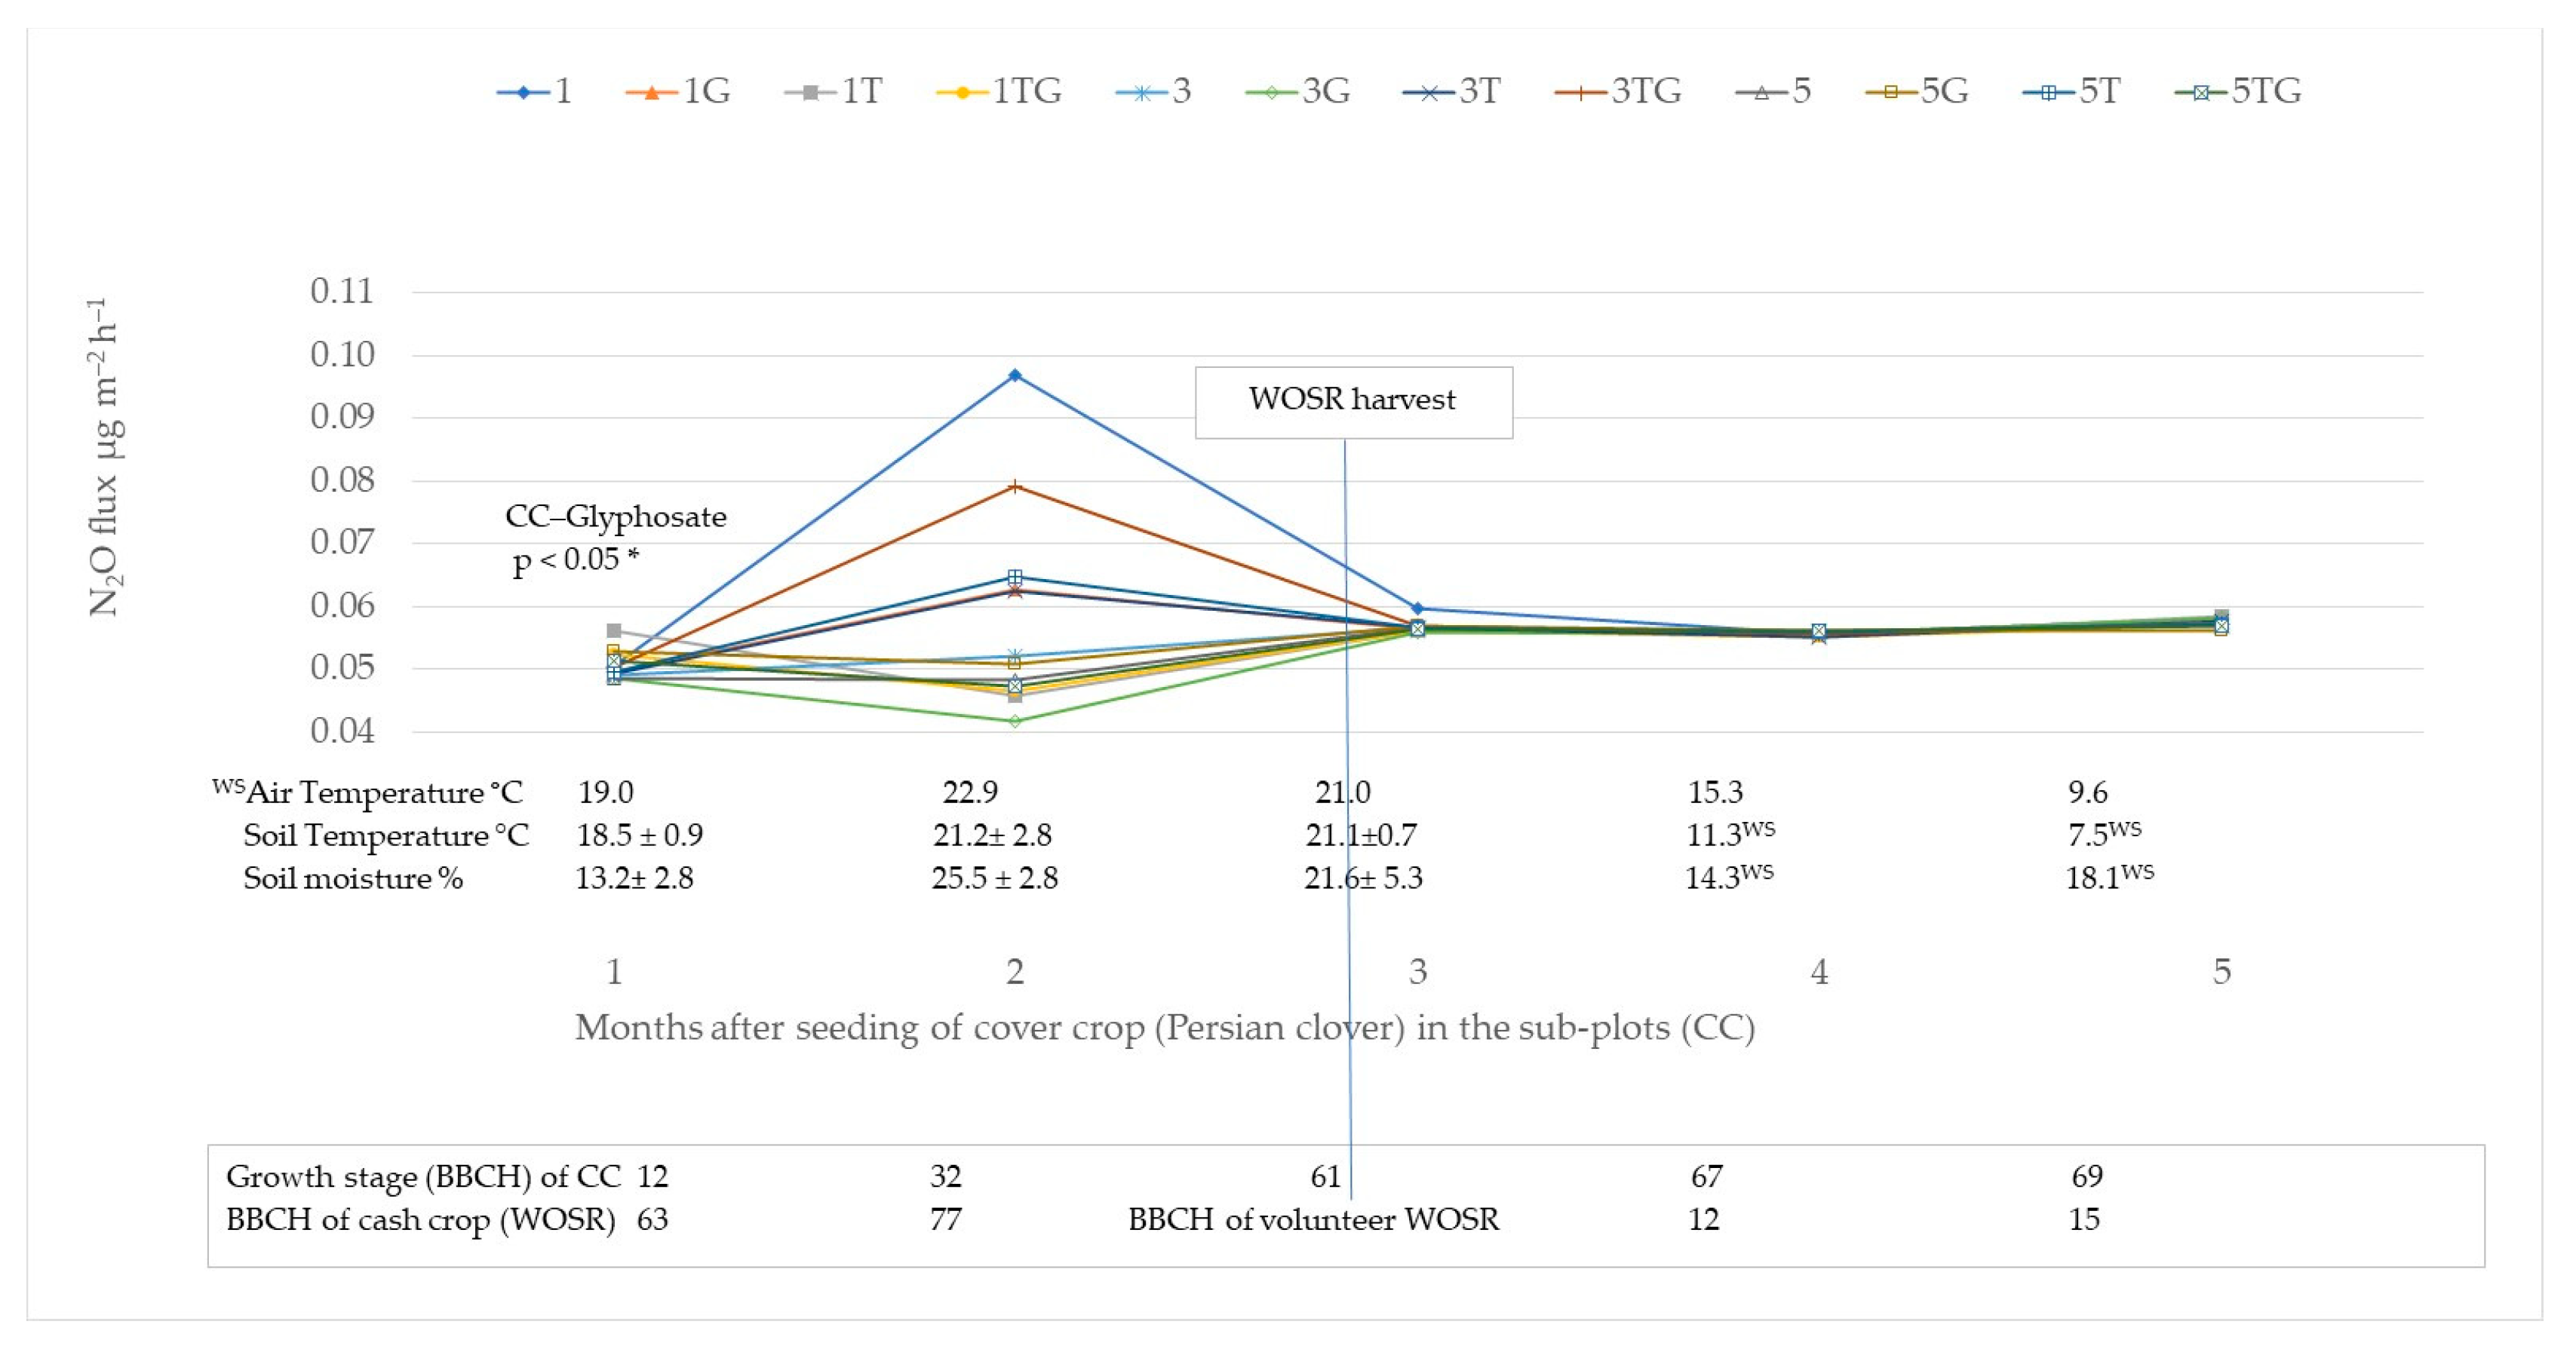
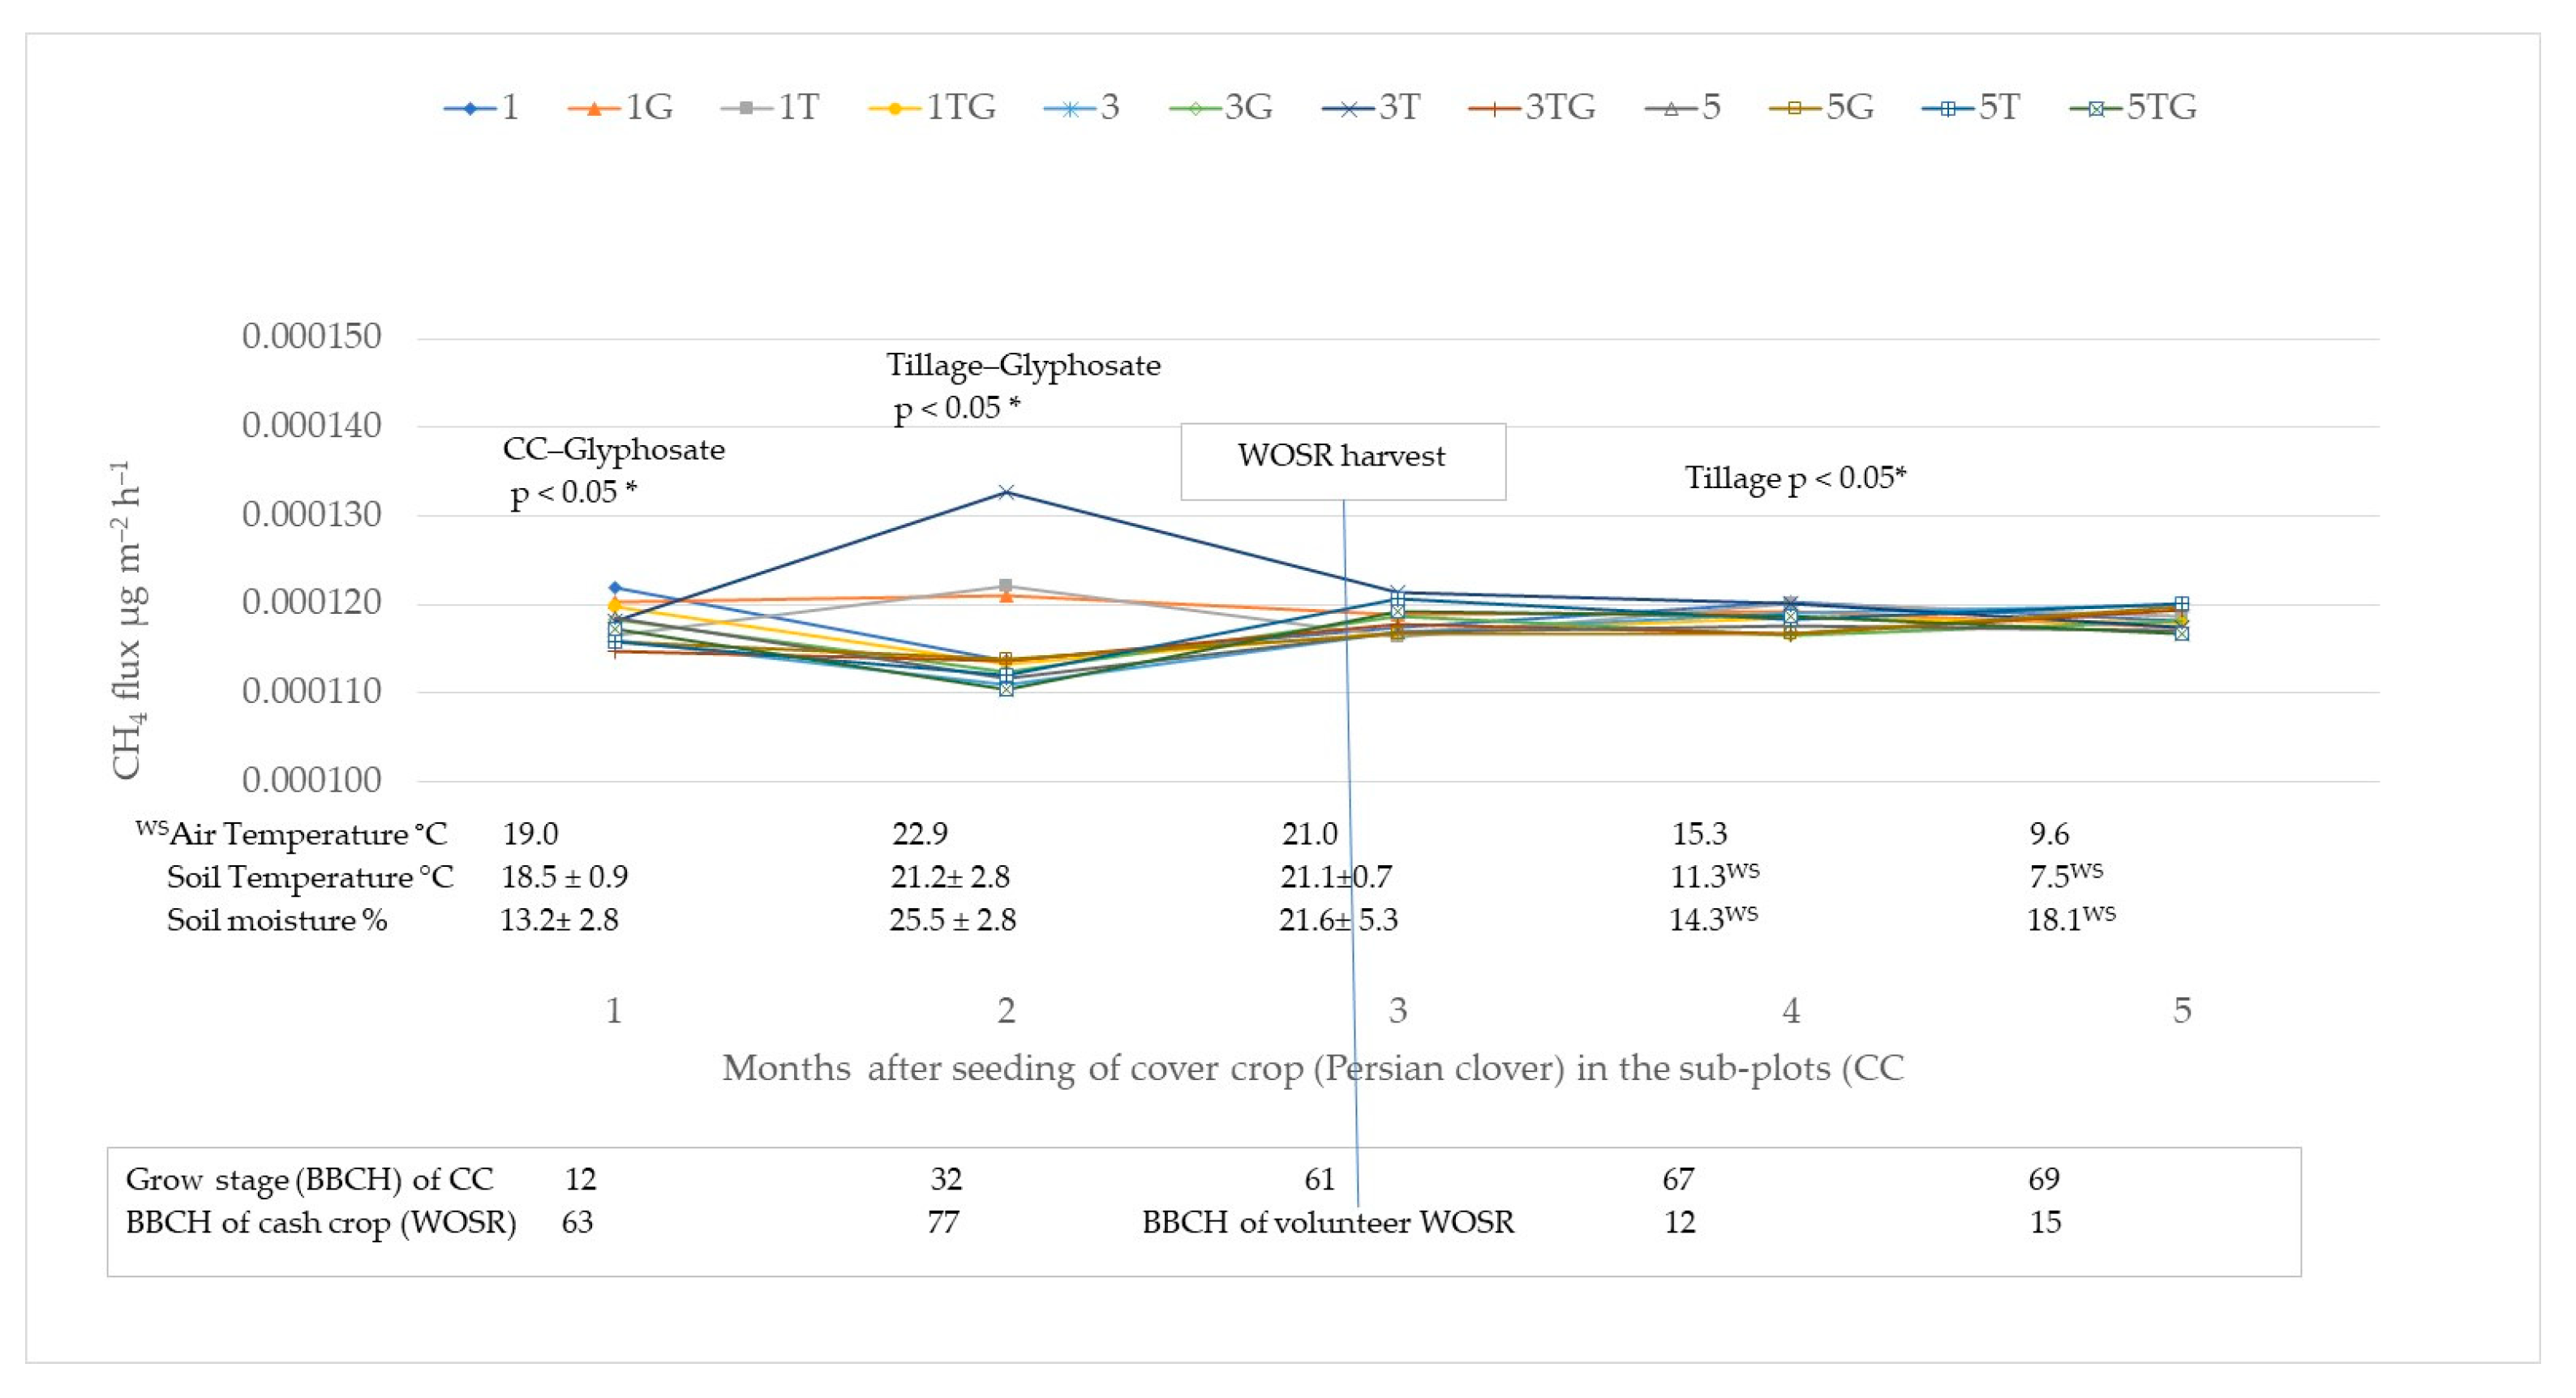
3.1. Greenhouse Gas Emissions

CO2 emissions in all of the treatments ranged from 0.061–0.089 µg ha−1 h−1 (Figure 2). The highest peaks for 5G and 1TG were found at 0.089 mg m−2 h−1 and 0.089 mg m−2 h−1, respectively. These peak emissions and other increased CO2 fluxes coincided with plant nutrient demand as the plants optimized the use of mineralized N fertilizer from the soil during the period. The emissions dropped in the third month and flattened out, indicating lesser nutrient uptake and soil–plant interaction. CO2 emissions were insignificant in all of the treatments from the fourth measurement to the end of the experiment. In considering the three factors, emissions peaks were significantly different (p < 0.05) in tillage, glyphosate, and the interaction between tillage and cover crops at the third measurement.
The N2O emissions ranged from 0.042 to 0.097 µg m−2 h−1, with the highest peak observed in treatment 3 (Figure 3). Although N2O emissions were relatively low during the first month of measurement, significant differences were observed in the interaction between cover crop and glyphosate treatments. The second measurement of N2O fluxes witnessed observable peaks in 1, 3TG, 5T, 1G, and 3T treatments. There was variability in N2O fluxes in the different treatments, with marked peaks obtained in CT and RT. N2O emissions were typically low in 5TG treatments in all observation periods. There was a significant difference (p < 0.05) between the interaction between cover crops and glyphosate at the first GHG measurement.
CH4 emissions showed relatively low values throughout the observation period, except for treatments 3T, 1T and 1G, which, in contrast with other treatments, increased at the second measurement GHG flux (Figure 4). CH4 fluxes varied from 0.000110 to 0.000130 µg m−2 h−1, with treatment 3T reaching the highest peak at the second measurement. In contrast with the decreased fluxes in other treatments, a distinct behavior was observed in CT and RT that were incorporated with cover crops at the second measurement. All of the treatments leveled out after the third GHG flux measurement to the end of the experiment. The interaction between tillage and glyphosate was significantly different (p < 0.05) in the first and second measurements. On further analysis, tillage significantly differed from other treatments at the fourth measurement.

3.2. Global Warming Potential (GWP)

The GWP showed significant differences (p < 0.05) between the reduced tillage and all of the no-tillage treatment combinations, as shown in Supplemental Table S1. In assessing the impact of GHG-related emissions in the employed management practices on global climate change, the GWP from soil CO2, CH4, and N2O emissions were estimated as CO2-equivalent emissions (kg/ha/y) in a 100-year time frame by multiplying emissions by their respective global warming potentials: 298 for N2O and 25 for CH4 [30]. The global warming potential (GWP) of N2O and CH4 emitted during the period is shown in Supplemental Table S1. The emission of N2O was a major contributor to GHG emissions in this study, with NT treatments showing lower GWP values than CT and RT treatments. Additionally, CH4 emissions across all treatments had a low impact in this experiment, posing lesser risks as an environmental problem.

3.3. Meteorological Influence on GHG Fluxes

Consideration was made for the influence of weather conditions (precipitation) on GHG for the study period. Average precipitation for the study period was higher in June and July (Supplemental Figure S1). Precipitation was higher at 53.2 mm, 3.3 times and 16.6 times higher at 1 week before GHG sampling (1WBS), 2 weeks before sampling (2WBS), respectively, and 16.6 times higher than precipitation before the 3rd sampling. A strong correlation was observed at 1WBS in all of the GHG, with CO2 at 0.73, N2O at 0.54, and CH4 at 0.67. However, CO2 is weakly correlated with precipitation at 2WBS compared with the stronger correlation observed with N2O and CH4 (Supplemental Figure S2).

3.4. Soil Physical Properties

The results of the influence of the multiple management practices on different soil physical properties are shown in Table 1 and Supplemental Table S2. The bulk density of the different treatments ranged from 1.48 ± 0.02 g cm3 to 1.59 ± 0.01 g cm3. As expected, the treatment with intensive ploughing (1, 1T, 1G, and 1TG) showed lower BD than other treatments with lesser soil disturbance. In contrast, a progressive increase was observed in RT and NT treatments, with higher BDs observed in NT treatments (5, 5T, 5G, and 5TG).
As presented in Table 1, results showed a lower soil VWC in tillage treatments (1, 3, and 5) with no cover crops and glyphosate. The added benefits of growing cover crops in addition to soil tillage system were observed, as all of the treatments with cover crops showed higher soil water content. The highest soil water content was observed in 1T with a value of 23.57%, while the lowest VWC value was observed in 3G treatment at 17.48%.
The soil electrical conductivity (EC) varied across the treatments, ranging from 9.43 mS m−1 to 16.16 mS m−1. The different tillage systems, in combination with cover crops (1T, 3T, and 5T), exhibited a relatively higher range of EC compared with other treatments.
The 1T and 5T treatments had WFPS values of 55.35 and 51.33%, respectively, with the lowest WFPS values found at 41.05 in 3G (Table 1). Furthermore, our study showed that all integrated treatments involving cover crops and glyphosate had higher WFPS than the single tillage treatments.

3.5. Relationships between Soil Physical Parameters and GHG Emissions

Correlation analyses for soil physical parameters and GHG emissions showed that CH4 fluxes negatively correlated with soil BD and positively with TP (Table 2). The CO2 and N2O fluxes did not have significant correlations with soil parameters. Soil temperature depended on BD and TP. The higher the BD, the lower the temperature and lower the TP. A strong relationship was also observed between TP, BD and WSA. The WSA increased with increasing BD and with a corresponding decrease in TP. The EC was significantly correlated with the soil VWC and WFPS.

4. Discussion

4.1. Soil GHG Emissions

The combination of multiple agricultural management practices can improve soil health and reduce GHG emissions. This study demonstrated that well-sustained and managed tillage practices, along with other conservation practices, such as cover cropping, can positively influence soil biophysical properties, impacting the release of CO2, CH4, and N2O. However, it must be noted that the extent and patterns of the three measured GHGs varied due to multiple factors across the soil physical attributes. For instance, higher CO2 was observed in reduced and ploughed treatments, resulting in higher CO2 treatments. This directly stems from ploughing, which disrupts soil aggregates and exposes organic matter to microbial decomposition. [31]. Soil moisture and temperature typically correlate with soil CO2 emissions [32,33]. The disturbance of soil aggregates potentially leads to elevated soil aeration, greater soil temperatures, and reduced soil moisture, resulting in increased CO2 fluxes. Other studies have also confirmed that, aside from tillage depth, soil temperature, and moisture, the incorporation of crop residues could potentially be decisive for increased CO2 emissions from soil [34]. The lower bulk density witnessed in the ploughed treatments enhanced the CO2 emissions in the soil, contrary to the suppression of CO2 in higher bulk density, which is synonymous with no tillage. In line with our findings, the observed reduction in VWC and WFPS, along with the total porosity in the ploughed treatments without other management practices, supported previous research. This suggests that a fewer number of pore spaces is indicative of greater soil compaction, ensuring the proliferation of GHG [35]. With NT contributing to reduced GHG emissions for the period under observation, glyphosate application (over 6 years, with an annual application during tillage in autumn) contributed subtly to CO2 emissions. It has been reported that long-term usage of glyphosate contributes to the development of glyphosate-resistant weeds and photosynthesis hindrance, which could impact the amount of carbon that plants can absorb from the atmosphere [36,37]. However, applying glyphosate as a management technique in this study did not cause any hindrance to the crop due to the autumn application of glyphosate during tillage. Hence, glyphosate application had no significant influence on CO2 emissions except when plant nutrient demand peaked.
N2O emissions presented an interesting result, with significant peaks in treatments subjected to conventional and reduced tillage. While there have been contrasting reports on the impacts of different tillage practices on N2O emissions, this study aligned with the effects of CT and RT on increased N2O emissions [38,39,40,41], particularly with the impact of cover crops and residue incorporation. The mechanisms driving these emissions and peaks can be ascribed to mineralizing organic materials in the soils (decaying grass materials/plant residues). Additionally, ploughed soils to a depth of 20–24 cm (CT treatment) can increase the risk of oxygen depletion (aerobic condition limitation) due to the incorporation of crop residues relative to NT treatments [38]. Crop residue can stimulate N2O emissions. This can increase the gradual release of labile nitrogen and carbon into the soil, providing substrates for the microbial processes of nitrification and denitrification [42]. Although the GHG fluxes during fertilization with NPK fertilizers were not measured, the influence of the inorganic fertilizers on plant functionalities and maximum nutrient uptake on GHG emissions in subsequent cultivation periods cannot be ruled out. GHG peaks coincided with periods when mineralization peaked, in turn coinciding with moments when precipitation was high, especially one to two weeks before the second greenhouse gas measurement.
Incorporating cover crops into the management techniques underscored the lower susceptibility to N losses through nitrate leaching [43], maximizing nitrogen use by plants and N release when soil is subjected to disturbance. Furthermore, the lower N2O emissions are often facilitated by the ability of the incorporated cover crops to utilize the residual soil N in the late fall, which would reduce N2O emissions, as shown in the fluxes that flattened out. Aside from the outliers observed in CH4 emissions, legume cover crop incorporation reduced CH4 emissions due to the displacement and inhibition of the CH4 oxidation process by the similar and more aggressive NH4+ [44]. This was demonstrated most particularly by the way in which sustained cover crop incorporation resulted in residues with a higher C:N ratio. Such residues demand a higher concentration of available nitrogen from the soil for decomposition. This process tends to mineralize slowly, potentially leading to a relatively lower release of NH4+ into the soil solution, thereby diminishing the impact of conventional tillage (CT).
Additionally, incorporating cover crops increases soil organic matter, especially in long-term considerations [45]. This is beyond the increase in soil organic carbon achieved by removing carbon from the air and storing it in roots, soil, above-ground stems, and leaves and provides a verifiable way to mitigate GHG. Generally, with GHG emissions dependent on soil treatments and climatic conditions, cover cropping is a more specific management technique that can mitigate GHG emissions. We opine that the long-term incorporation of cover crops into crop systems is a good climate change mitigation strategy, as cover crops increase soil organic matter [46].
Climatic influence on GHG remains a factor in GHG flux, as observed in the spikes at the second measurement. Precipitation was 53.2 mm and 120.6 mm one week before and two weeks before GHG sampling, respectively. In the 1WBS, precipitation amounts were 3.3 times and 16.6 times higher before the 1st and 3rd samplings, respectively. A strong correlation was observed at 1WBS in all of the GHGs, with CO2 at 0.73, N2O at 0.54, and CH4 at 0.67. Similarly, 2WBS’s precipitation amounts were about 5 and 2 times higher than the first and third samplings, respectively. Another critical point is the large variability noted at the second GHG sampling time in the GHG measured. This could be tied to crop conditions aside from climatic factors. The first GHG sampling was at the beginning of flowering, and the second GHG sampling was at the mid-end of pod formation for winter oilseed rape (WOSR). The crop biomass peaked at the second measuring time, resulting in large GHG spikes.
Further measurements were taken after the second measurements and after the winter oilseed rape harvest, with the GHG fluxes flattening out. At the third GHG sampling, only cover crops (Persian clover) and some weeds were in the field. Additionally, at the fourth and fifth GHG samplings, there was also some volunteer oilseed rape. However, the biomass was relatively low because the weather was quite dry after the winter oilseed rape harvest.

4.2. Soil Physical Parameters

Soil management is important in agricultural practices as it can impair or enhance soil protection, particularly soil structure. Soil physical properties are directly related to soil structural stability, which can be significantly impacted by disturbance or tillage-induced changes. The different tillage treatments have varying effects on the distribution of soil physical properties. The bulk density is typically assessed to characterize the state of soil compactness in response to land use and soil management practices. Hence, different particle-size aggregates can be formed due to soil disturbance [47,48]. Total porosity (TP), water-stable aggregates (WSA), and water-filled pore space (WFPS) are important indicators by which to evaluate soil stability when quantifying the influence of soil management practices. Higher TP, WSA, and WFPS values indicate higher soil particle aggregation and better soil structural stability. NT, with little or no disturbance compared with CT and RT and, and when combined with 7 years of cover cropping, exhibited better soil physical properties such as water retention capacity. This result aligns with the previous report of soil agglomeration enhancement from the accumulation of soil particles and structural stability due to the minimum disturbance of soil aggregates in NT [49] and cover crop incorporation [16].
Additionally, the conventional tillage showed reduced soil bulk density, a result similar to previous studies [50,51]. Incorporating cover crops into the conventional tillage treatments significantly impacted soil bulk density compared with no-till treatments. The benefits of enhanced soil physical properties often depend on soil texture, with some soil types being more responsive to cover crop management than others [16,52]. Hence, the influence of the soil texture (loam) used is opined to have a corresponding reaction to cover crop management, as evidenced in this study.
Aside from the soil aggregate stability, soil water is another physical attribute. The soil volumetric water content (VWC) has a dominant influence on soil functioning as it affects the moisture and the amount of nutrients available to plants and soil aeration status. Soil moisture profoundly impacts soil formation and development, the transport of substances and energy within the soil, and crop growth [49]. Incorporating cover crops into the three tillage treatments improved the soil water storage. However, there have been contrasting views on the impact of tillage on soil water content [53]. Several factors, such as climatic conditions, growing crops, tillage treatments, and soil layer, can influence soil water content due to tillage. Our results align with previous studies of soil water content reduction from CT treatments compared with other tillage treatments. However, the long-term incorporation of cover cropping with CT facilitated a better soil water storage capacity. There was no direct impact of glyphosate on the soil water concentration.
Soil electrical conductivity (EC) is an indicator linked to various soil attributes, such as soil texture, cation exchange capacity, drainage conditions, organic matter level, salinity, and subsoil characteristics, impacting crop productivity. The moisture from soil particles directly affects the EC, which correlates strongly to soil particle size and texture. In agreement with previous studies, higher organic matter contents in NT increased electrolyte concentrations [54] compared with other tillage treatments. The breakdown and utilization of the nutrients from the organic matter by the Persian cloves (cover crops) caused an increase in the EC from the CT and RT. A lower EC is also attributed to low soil water content from seasonal changes, which impacts mineralization and the release of soil available N [55]. Hence, the inputs of the cover crops in the three employed tillage techniques contributed to the improved water content and, further, to the EC. It is important to note that the EC in all treatments was well below the values that could cause negative yield responses [55,56].
The study results show that the effect of glyphosate on soil physical properties was mainly occasional, with none of the inconsistent effects on any of the soil properties having a noticeable or direct impact. This aligns with previous studies in which more indirect effects of the autumn application of glyphosate on soil properties were observed [20]. These effects caused cidal actions on Persian clover (cover crops), resulting in enhanced organic matter formation (decomposed biomass). Consequently, there seems to be an organic matter differential between the glyphosate and non-glyphosate treatment formed over time, which could account for the relative differences in soil structure and other critical soil functions.

5. Conclusions

Integrating multiple agricultural management practices holds numerous benefits to the soil, plants, and the environment. Our main findings indicate that the incorporated cover crop reduced bulk density in conventional tillage. Additionally, tillage treatments incorporated with cover crops improved water-filled pore space and increased soil volumetric water content. Across all of the measured soil physical parameters, conventional tillage without other complementary management practices had lower indices in the soil physical properties (soil volumetric water content, electrical conductivity, and bulk density) over a long-term period. The significance of the fibrous root systems of Persian cover crops in influencing soil physical attributes cannot be underestimated, as they interact with larger soil volumes, potentially leading to improved soil aggregates and water infiltration. At the same time, glyphosate use did not influence soil physical properties significantly. GHG emissions vary across agricultural management practices and are of special interest in soil health discussions. Tillage and the incorporation of cover crops positively impacted GHG reduction, especially with no till having lower fluxes across all of the considered GHGs. However, despite integrating multiple management practices, climatic conditions, nutrient demand, and plant uptake played critical roles in GHG fluxes. Soil moisture, influenced by high precipitation, strongly correlated with the GHG peaks. It is notable that the pre-existing soil physical characteristics derived from long-term tillage practices and other management variants presented the initial conditions for the presented study.

Supplementary Materials

The following supporting information can be downloaded at: https://www.mdpi.com/article/10.3390/su16072859/s1, Figure S1: Meteorological conditions for the year 2023; Figure S2. Correlation coefficients to investigate relationships between precipitation with (a) CO2, (b) N2O and (c) CH4. 1WBS (1 week before sampling), 2WBS (2 week before sampling) Table S1: The cumulative fluxes of CO2, CH4 and N2O fluxes and the total global warming potential (GWP) expressed as 100-year time frame assessed as CO2-equivalent emissions; Table S2: The anova table for the soil physical parameters.

Author Contributions

Conceptualization, G.K.; methodology, M.O.D., G.K., A.V. and S.S.; software, M.O.D. and G.K.; validation, M.O.D., G.K. and S.S.; formal analysis, M.O.D., G.K., A.V., L.M. and S.S.; investigation, M.O.D., G.K., A.V., L.M. and S.S.; data curation, M.O.D.; writing—original draft preparation, M.O.D.; writing—review and editing, S.S. and G.K.; visualization, M.O.D. and G.K.; supervision, S.S. and G.K.; project administration, S.S. and G.K.; funding acquisition, S.S., L.M. and G.K. All authors have read and agreed to the published version of the manuscript.

Funding

This research was funded by the European Union’s Horizon 2020 research and innovation program via the AGROECOseqC project, grant number 862695.

Institutional Review Board Statement

Not applicable.

Informed Consent Statement

Not applicable.

Data Availability Statement

Data are contained within the article and Supplementary Materials.

Acknowledgments

We gratefully acknowledge the support we received from the technical staff of the Department of Soil and Crop Management as well as the Department of Field Trial Services.

Conflicts of Interest

The authors declare no conflict of interest.

References

  1. Mandal, A.; Dhaliwal, S.S.; Mani, P.K.; Toor, A.S. Conservation agricultural practices under organic farming. In Advances in Organic Farming Agronomic Soil Management Practices; Woodhead Publishing: Oxford, UK, 2021; pp. 17–37. [Google Scholar] [CrossRef]
  2. Busari, M.A.; Kukal, S.S.; Kaur, A.; Bhatt, R.; Dulazi, A.A. Conservation tillage impacts on soil, crop and the environment. Int. Soil Water Conserv. Res. 2015, 3, 119–129. [Google Scholar] [CrossRef]
  3. Derpsch, R. Conservation Tillage, No-Tillage and Related Technologies. In Conservation Agriculture; Springer: Dordrecht, The Netherlands, 2003; pp. 181–190. Available online: https://link.springer.com/chapter/10.1007/978-94-017-1143-2_23 (accessed on 8 November 2023).
  4. Soane, B.D.; Ball, B.C.; Arvidsson, J.; Basch, G.; Moreno, F.; Roger-Estrade, J. No-till in northern, western and south-western Europe: A review of problems and opportunities for crop production and the environment. Soil Tillage Res. 2012, 118, 66–87. [Google Scholar] [CrossRef]
  5. Janusauskaite, D.; Kadziene, G. Influence of Different Intensities of Tillage on Physiological Characteristics and Productivity of Crop-Rotation Plants. Plants 2022, 11, 3107. [Google Scholar] [CrossRef] [PubMed]
  6. Lv, L.; Gao, Z.; Liao, K.; Zhu, Q.; Zhu, J. Impact of conservation tillage on the distribution of soil nutrients with depth. Soil Tillage Res. 2023, 225, 105527. [Google Scholar] [CrossRef]
  7. Kadžienė, G.; Pranaitienė, S.; Auškalnienė, O.; Veršulienė, A.; Supronienė, S.; Žvirdauskienė, R.; Gecaitė, V.; Cesevičienė, J.; Semaškienė, R. Oilseed Rape, Wheat, and Barley Grain Contamination as Affected by Different Glyphosate Usage. Plants 2023, 12, 1335. [Google Scholar] [CrossRef] [PubMed]
  8. Kanissery, R.; Gairhe, B.; Kadyampakeni, D.; Batuman, O.; Alferez, F. Glyphosate: Its environmental persistence and impact on crop health and nutrition. Plants 2019, 8, 499. [Google Scholar] [CrossRef] [PubMed]
  9. Gandhi, K.; Khan, S.; Patrikar, M.; Markad, A.; Kumar, N.; Choudhari, A.; Sagar, P.; Indurkar, S. Exposure risk and environmental impacts of glyphosate: Highlights on the toxicity of herbicide co-formulants. Environ. Chall. 2021, 4, 100149. [Google Scholar] [CrossRef]
  10. Hagner, M.; Mikola, J.; Saloniemi, I.; Saikkonen, K.; Helander, M. Effects of a glyphosate-based herbicide on soil animal trophic groups and associated ecosystem functioning in a northern agricultural field. Sci. Rep. 2019, 9, 8540. [Google Scholar] [CrossRef] [PubMed]
  11. Duke, S.O.; Powles, S.B. Glyphosate: A once-in-a-century herbicide. Pest Manag. Sci. 2008, 63, 1100–1106. [Google Scholar] [CrossRef]
  12. Nguyen, D.B.; Rose, M.T.; Rose, T.J.; Morris, S.G.; van Zwieten, L. Impact of glyphosate on soil microbial biomass and respiration: A meta-analysis. Soil Biol. Biochem. 2016, 92, 50–57. [Google Scholar] [CrossRef]
  13. Zaller, J.G.; Heigl, F.; Ruess, L.; Grabmaier, A. Glyphosate herbicide affects belowground interactions between earthworms and symbiotic mycorrhizal fungi in a model ecosystem. Sci. Rep. 2014, 4, 5634. Available online: https://www.nature.com/articles/srep05634 (accessed on 17 March 2024). [CrossRef]
  14. Farmaha, B.S.; Sekaran, U.; Franzluebbers, A.J. Cover cropping and conservation tillage improve soil health in the southeastern United States. Agron. J. 2022, 114, 296–316. [Google Scholar] [CrossRef]
  15. Quintarelli, V.; Radicetti, E.; Allevato, E.; Stazi, S.R.; Haider, G.; Abideen, Z.; Bibi, S.; Jamal, A.; Mancinelli, R. Cover Crops for Sustainable Cropping Systems: A Review. Agriculture 2022, 12, 2076. [Google Scholar] [CrossRef]
  16. Koudahe, K.; Allen, S.C.; Djaman, K. Critical review of the impact of cover crops on soil properties. Int. Soil Water Conserv. Res. 2022, 10, 343–354. [Google Scholar] [CrossRef]
  17. Rühlemann, L.; Schmidtke, K. The suitability of non-legume cover crops for inorganic soil nitrogen immobilisation in the transition period to an organic no-till system. Plant Prod. Sci. 2016, 19, 105–124. Available online: https://www.tandfonline.com/action/journalInformation?journalCode=tpps20 (accessed on 26 November 2023). [CrossRef]
  18. Ali, S.; Zahid, A.; Fatima, A.; Ahmad, M.; Manzoor, M.T.; Ayub, A.; Raza, A.; Shafqat, N.; Ali, S.; Zahid, A.; et al. Harnessing Soil Potential: Innovation in Strategic Tillage and Management—New Perspectives. Strateg Tillage Soil Manag—New Perspect 27 September 2023. Available online: https://www.intechopen.com/online-first/88226 (accessed on 8 November 2023).
  19. Seitz, S.; Goebes, P.; Puerta, V.L.; Pereira, E.I.P.; Wittwer, R.; Six, J.; van der Heijden, M.G.A.; Scholten, T. Conservation tillage and organic farming reduce soil erosion. Agron. Sustain. Dev. 2019, 39, 4. [Google Scholar] [CrossRef]
  20. Carter, M.R.; Sanderson, J.B.; Holmstrom, D.A.; Ivany, J.A.; DeHaan, K.R. Influence of conservation tillage and glyphosate on soil structure and organic carbon fractions through the cycle of a 3-year potato rotation in Atlantic Canada. Soil Tillage Res. 2007, 93, 206–221. [Google Scholar] [CrossRef]
  21. Soil Association. The impact of glyphosate on soil health Glyphosate and Soil. Soil Assoc. 2016, 1, 1–8. Available online: https://www.soilassociation.org/media/7202/glyphosate-and-soil-health-full-report.pdf (accessed on 17 March 2024).
  22. Wynn, S.; Webb, E. Impact assessment of the loss of glyphosate within the EU: A literature review. Environ. Sci. Eur. 2022, 34, 91. [Google Scholar] [CrossRef]
  23. Schad, P. The International Soil Classification System WRB, 2014, 3rd ed.; Springer Water; Springer: Berlin/Heidelberg, Germany, 2016; pp. 563–571. ISBN 9789251083697. [Google Scholar]
  24. ISO 10694:1995; Soil Quality—Determination of Organic and Total Carbon after Dry Combustion (Elementary Analysis). ISO: Geneva, Switzerland, 1995.
  25. Egner, H.; Riehm, H.; Domingo, W.R. Untersuchungen über die chemische Bodenanalyse als Grundlage für die Beurteilung des Nährstoffzustandes der Böden II. Chemische Extraktionsmethoden zur Phosphor-und Kaliumbestimmung. K. Landbr. 1960, 26, 199–215. [Google Scholar]
  26. Kanerva, T.; Regina, K.; Rämö, K.; Ojanperä, K.; Manninen, S. Fluxes of N2O, CH4 and CO2 in a meadow ecosystem exposed to elevated ozone and carbon dioxide for three years. Environ. Pollut. 2007, 145, 818–828. Available online: https://linkinghub.elsevier.com/retrieve/pii/S0269749106003307 (accessed on 22 November 2023). [CrossRef]
  27. Doyeni, M.O.; Stulpinaite, U.; Baksinskaite, A.; Suproniene, S.; Tilvikiene, V. Greenhouse gas emissions in agricultural cultivated soils using animal waste-based digestates for crop fertilization. J. Agric. Sci. 2021, 159, 23–30. [Google Scholar] [CrossRef]
  28. Hoffmann, M.; Wirth, S.J.; Beßler, H.; Engels, C.; Jochheim, H.; Sommer, M.; Augustin, J. Combining a root exclusion technique with continuous chamber and porous tube measurements for a pin-point separation of ecosystem respiration in croplands. J. Plant Nutr. Soil Sci. 2018, 181, 41–50. [Google Scholar] [CrossRef]
  29. R Core Team. R: A Language and Environment for Statistical Computing; R Foundation for Statistical Computing: Vienna, Austria, 2023; Available online: https://www.R-project.org/ (accessed on 17 March 2024).
  30. Lewis, E.; Chamel, O.; Mohsenin, M.; Ots, E.; White, E.T. Intergovernmental Panel on Climate Change. In Sustainaspeak; Routledge: New York, NY, USA, 2018; pp. 153–154. Available online: https://www.taylorfrancis.com/books/9781351981736/chapters/10.4324/9781315270326-109 (accessed on 20 December 2023).
  31. Mangalassery, S.; Sjögersten, S.; Sparkes, D.L.; Sturrock, C.J.; Craigon, J.; Mooney, S.J. To what extent can zero tillage lead to a reduction in greenhouse gas emissions from temperate soils? Sci. Rep. 2014, 4, 4586. [Google Scholar] [CrossRef] [PubMed]
  32. Oertel, C.; Matschullat, J.; Zurba, K.; Zimmermann, F.; Erasmi, S. Greenhouse gas emissions from soils—A review. Chem. Erde Geochem. 2016, 76, 327–352. [Google Scholar] [CrossRef]
  33. Dong, W.; Liu, E.; Wang, J.; Yan, C.; Li, J.; Zhang, Y. Impact of tillage management on the short- and long-term soil carbon dioxide emissions in the dryland of Loess Plateau in China. Geoderma 2017, 307, 38–45. [Google Scholar] [CrossRef]
  34. Mühlbachová, G.; Kusá, H.; Růžek, P.; Vavera, R. CO2 emissions in a soil under different tillage practices. Plant Soil Environ. 2022, 68, 253–261. [Google Scholar] [CrossRef]
  35. Gui, W.; You, Y.; Yang, F.; Zhang, M. Soil Bulk Density and Matric Potential Regulate Soil CO2 Emissions by Altering Pore Characteristics and Water Content. Land 2023, 12, 1646. [Google Scholar] [CrossRef]
  36. Matzrafi, M.; Brunharo, C.; Tehranchian, P.; Hanson, B.D.; Jasieniuk, M. Increased temperatures and elevated CO2 levels reduce the sensitivity of Conyza canadensis and Chenopodium album to glyphosate. Sci. Rep. 2019, 9, 2228. Available online: www.nature.com/scientificreports (accessed on 26 November 2023). [CrossRef]
  37. Zobiole, L.H.S.; Kremer, R.J.; de Oliveira, R.S., Jr.; Constantin, J. Glyphosate effects on photosynthesis, nutrient accumulation, and nodulation in glyphosate-resistant soybean. J. Plant Nutr. Soil Sci. 2012, 175, 319–330. [Google Scholar] [CrossRef]
  38. Petersen, S.O.; Mutegi, J.K.; Hansen, E.M.; Munkholm, L.J. Tillage effects on N2O emissions as influenced by a winter cover crop. Soil Biol. Biochem. 2011, 43, 1509–1517. [Google Scholar] [CrossRef]
  39. Rutkowska, B.; Szulc, W.; Szara, E.; Skowrońska, M.; Jadczyszyn, T. Soil N2O emissions under conventional and reduced tillage methods and maize cultivation. Plant Soil Environ. 2017, 63, 342–347. [Google Scholar] [CrossRef]
  40. Sosulski, T.; Szara, E.; Szymańska, M.; Stępień, W.; Rutkowska, B.; Szulc, W. Soil N2O emissions under conventional tillage conditions and from forest soil. Soil Tillage Res. 2019, 190, 86–91. [Google Scholar] [CrossRef]
  41. Lognoul, M.; Theodorakopoulos, N.; Hiel, M.P.; Regaert, D.; Broux, F.; Heinesch, B.; Bodson, B.; Vandenbol, M.; Aubinet, M. Impact of tillage on greenhouse gas emissions by an agricultural crop and dynamics of N2O fluxes: Insights from automated closed chamber measurements. Soil Tillage Res. 2017, 167, 80–89. [Google Scholar] [CrossRef]
  42. Azam, F.; Müller, C.; Weiske, A.; Benckiser, G.; Ottow, J.C.G. Nitrification and denitrification as sources of atmospheric nitrous oxide—Role of oxidizable carbon and applied nitrogen. Biol. Fertil. Soils 2002, 35, 54–61. [Google Scholar] [CrossRef]
  43. Tribouillois, H.; Constantin, J.; Justes, E. Cover crops mitigate direct greenhouse gases balance but reduce drainage under climate change scenarios in temperate climate with dry summers. Glob. Chang. Biol. 2018, 24, 2513–2529. [Google Scholar] [CrossRef] [PubMed]
  44. Wang, Y.; Saikawa, E.; Avramov, A.; Hill, N.S. Agricultural Greenhouse Gas Fluxes Under Different Cover Crop Systems. Front. Clim. 2022, 3, 742320. [Google Scholar] [CrossRef]
  45. Anuo, C.O.; Cooper, J.A.; Koehler-Cole, K.; Ramirez, S.; Kaiser, M. Effect of cover cropping on soil organic matter characteristics: Insights from a five-year field experiment in Nebraska. Agric. Ecosyst. Environ. 2023, 347, 108393. [Google Scholar] [CrossRef]
  46. Slepetiene, A.; Kadziene, G.; Suproniene, S.; Skersiene, A. The Content and Stratification of SOC and Its Humified Fractions Using Different Soil Tillage and Inter-Cropping. Sustainability 2024, 16, 953. [Google Scholar] [CrossRef]
  47. Horn, R.; Taubner, H.; Wuttke, M.; Baumgartl, T. Soil physical properties related to soil structure. Soil Tillage Res. 1994, 30, 187–216. [Google Scholar] [CrossRef]
  48. Totsche, K.U.; Amelung, W.; Gerzabek, M.H.; Guggenberger, G.; Klumpp, E.; Knief, C.; Lehndorff, E.; Mikutta, R.; Peth, S.; Prechtel, A.; et al. Microaggregates in soils. J. Plant Nutr. Soil Sci. 2018, 181, 104–136. [Google Scholar] [CrossRef]
  49. Liu, Z.; Cao, S.; Sun, Z.; Wang, H.; Qu, S.; Lei, N.; He, J.; Dong, Q. Tillage effects on soil properties and crop yield after land reclamation. Sci. Rep. 2021, 11, 4611. [Google Scholar] [CrossRef] [PubMed]
  50. Mahboubi, A.A.; Lal, R.; Faussey, N.R. Twenty-Eight Years of Tillage Effects on Two Soils in Ohio. Soil Sci. Soc. Am. J. 1993, 57, 506–512. Available online: https://onlinelibrary.wiley.com/doi/full/10.2136/sssaj1993.03615995005700020034x (accessed on 17 March 2024). [CrossRef]
  51. Strudley, M.W.; Green, T.R.; Ascough, J.C. Tillage effects on soil hydraulic properties in space and time: State of the science. Soil Tillage Res. 2008, 99, 4–48. [Google Scholar] [CrossRef]
  52. Blanco-Canqui, H.; Shaver, T.M.; Lindquist, J.L.; Shapiro, C.A.; Elmore, R.W.; Francis, C.A.; Hergert, G.W. Cover crops and ecosystem services: Insights from studies in temperate soils. Agron. J. 2015, 107, 2449–2474. [Google Scholar] [CrossRef]
  53. Gozubuyuk, Z.; Sahin, U.; Adiguzel, M.C.; Ozturk, I.; Celik, A. The influence of different tillage practices on water content of soil and crop yield in vetch–winter wheat rotation compared to fallow–winter wheat rotation in a high altitude and cool climate. Agric. Water Manag. 2015, 160, 84–97. [Google Scholar] [CrossRef]
  54. Rahman, M.H.; Okubo, A.; Sugiyama, S.; Mayland, H.F. Physical, chemical and microbiological properties of an Andisol as related to land use and tillage practice. Soil Tillage Res. 2008, 101, 10–19. [Google Scholar] [CrossRef]
  55. Eigenberg, R.A.; Doran, J.W.; Nienaber, J.A.; Ferguson, R.B.; Woodbury, B.L. Electrical conductivity monitoring of soil condition and available N with animal manure and a cover crop. Agric. Ecosyst. Environ. 2002, 88, 183–193. [Google Scholar] [CrossRef]
  56. Visconti, F.; de Paz, J.M. Electrical Conductivity Measurements in Agriculture: The Assessment of Soil Salinity. New Trends Dev. Metrol. 2016, 1, 99–126. [Google Scholar] [CrossRef]
Figure 1. The static chamber boxes at the 2nd and the 5th GHG samplings.
Sustainability 16 02859 g001
Figure 2. CO2 fluxes under different management practices during the crop growing season. 1—(ploughing, −CC, −G), 1G—(ploughing, −CC, +G), 1T—(ploughing, +CC, −G), 1TG—(ploughing, +CC, +G), 3—(harrowing, −CC, −G), 3G—(harrowing, −CC, +G), 3T—(harrowing, +CC, −G), 3TG—(harrowing, +CC, +G), 5—(no till, −CC, −G), 5G—(no till, −CC, +G), 5T—(no till, +CC, −G), and 5TG—(no till, +CC, +G). Note: CC—cover crops, G—glyphosate, − negative, + positive. ** indicates significant differences at p < 0.01; * indicates significant differences at p < 0.05; WS indicates the data obtained from the closest weather station (distance < 0.5 km).
Sustainability 16 02859 g002
Figure 3. N2O fluxes under different management practices during the crop growing season. 1—(ploughing, −CC, −G), 1G—(ploughing, −CC, +G), 1T—(ploughing, +CC, −G), 1TG—(ploughing, +CC, +G), 3—(harrowing, −CC, −G), 3G—(harrowing, −CC, +G), 3T—(harrowing, +CC, −G), 3TG—(harrowing, +CC, +G), 5—(no till, −CC, −G), 5G—(no till,−CC, +G), 5T—(no till, +CC, −G), 5TG—(no till, +CC, +G). Note: CC—cover crops, G—glyphosate, − negative, + positive. * indicates significant differences at p < 0.05; WS indicates the data obtained from the closest weather station (distance < 0.5 km).
Sustainability 16 02859 g003
Figure 4. CH4 fluxes under different management practices during the crop growing season. 1—(ploughing, −CC, −G), 1G—(ploughing, −CC, +G), 1T—(ploughing, +CC, −G); 1TG—(ploughing, +CC, +G), 3—(harrowing, −CC, −G), 3G—(harrowing, −CC, +G), 3T—(harrowing, +CC, −G), 3TG—(harrowing, +CC, +G), 5—(no till, −CC, −G), 5G—(no till, −CC, +G), 5T—(no till, +CC, −G), 5TG—(no till, +CC, +G). Note: CC—cover crops, G—glyphosate, − negative, + positive. * indicates significant differences at p < 0.05; WS indicates the data obtained from the closest weather station (distance < 0.5 km).
Sustainability 16 02859 g004
Table 1. Effects of different management systems (tillage, cover crops, and glyphosate) on soil physical properties.
TreatmentsVWC % VolEC mS m−1WFPS %Temp °CBD g cm−3WSA%TP m3 m−3
118.68 ± 1.36 ab11.13 ± 0.90 ab43.87 ± 3.19 ab20.87 ± 0.59 ab1.49 ± 0.03 b69.63 ± 1.63 b0.44 ± 0.011 a
318.08 ± 0.47 ab10.62 ± 1.19 ab42.46 ± 1.09 ab20.20 ± 0.32 ab1.53 ± 0.01 ab79.17 ± 4.09 ab0.42 ± 0.004 ab
519.58 ± 1.16 ab11.69 ± 1.60 ab45.98 ± 2.73 ab20.01 ± 0.23 b1.54 ± 0.01 ab81.4 ± 2.92 a0.42 ± 0.004 ab
1T23.57 ± 1.43 a16.16 ± 0.68 a55.35 ± 3.37 a20.17 ± 0.10 ab1.48 ± 0.02 b68.36 ± 0.94 b0.44 ± 0.007 a
3T20.92 ± 2.09 ab12.16 ± 2.11 ab49.14 ± 4.91 ab19.34 ± 0.14 b1.52 ± 0.01 ab73.86 ± 0.68 ab0.43 ± 0.003 ab
5T21.86 ± 0.50 ab14.76 ± 1.24 ab51.33 ± 1.17 ab20.01 ± 0.29 b1.59 ± 0.01 a78.21 ± 0.81 ab0.40 ± 0.005 b
1G19.14 ± 0.41 ab11.68 ± 0.96 ab44.96 ± 0.97 ab22.57 ± 1.42 a1.49 ± 0.03 b69.63 ± 1.63 b0.44 ± 0.011 a
3G17.48 ± 1.00 b9.43 ± 0.77 b41.05 ± 2.34 b20.19 ± 0.32 ab1.53 ± 0.01 ab79.17 ± 4.09 ab0.42 ± 0.004 ab
5G20.23 ± 0.47 ab13.01 ± 0.60 ab47.52 ± 1.10 ab20.43 ± 0.14 ab1.54 ± 0.01 ab81.40 ± 2.92 a0.42 ± 0.004 ab
1TG20.71 ± 1.69 ab12.89 ± 1.51 ab48.64 ± 3.96 ab20.05 ± 0.27 b1.48 ± 0.02 b68.36 ± 0.94 b0.44 ± 0.007 a
3TG20.41 ± 0.94 ab11.39 ± 0.57 ab47.93 ± 2.22 ab19.61 ± 0.05 b1.52 ± 0.01 ab73.86 ± 0.68 ab0.43 ± 0.003 ab
5TG20.53 ± 0.99 ab12.70 ± 0.78 ab48.22 ± 2.31 ab19.67 ± 0.19 b1.59 ± 0.01 a78.2 ± 0.81 ab0.40 ± 0.005 b
1—(ploughing, −CC, −G), 1G—(ploughing,−CC, +G), 1T—(ploughing, +CC, −G); 1TG—(ploughing, +CC, +G), 3—(harrowing, −CC, −G), 3G—(harrowing, − CC, −G), 3T—(harrowing, +CC, −G), 3TG—(harrowing, +CC, +G), 5—(no till, −CC, −G), 5G—(no till, −CC, +G), 5T—(no till, +CC, −G), 5TG—(no till, +CC, +G). Note: CC—cover crops, G—glyphosate, − negative, + positive. VWC—soil volumetric water content, EC—soil pore electrical conductivity, WFPS—water-filled pore space, Temp—soil temperature, BD—bulk density, WSA (1–0.25 mm, 0–20cm)—soil water-stable aggregates, TP—total porosity. Values are means ± standard error; different letters in each treatment factor correspond to significant differences (p < 0.05) between means according to Tukey’s test.
Table 2. Correlation matrix for soil physical parameters and greenhouse gas emissions in different management practices.
VWCTempECWFPSBDTPWSACO2N2OCH4
VWC –0.220.9 **0.94 **–0.03–0.01–0.19–0.260.180.14
Temp –0.06–0.31–0.35 *0.39 *–0.280.3–0.080.25
EC 0.87 **0.03–0.06–0.18–0.160.150.05
WFPS 0.3–0.34–0.02–0.310.180.01
BD –0.99 **0.51 **–0.180.04–0.39 *
TP –0.54 **0.18–0.120.37 *
WSA –0.120.11–0.07
CO2 0.140.28
N2O 0.06
CH4
VWC—soil volumetric water content, EC—soil pore electrical conductivity, WFPS—water-filled pore space, Temp—soil temperature, BD—bulk density, WSA (1–0.25 mm, 0–20cm)—soil water-stable aggregates, TP—total porosity, CO2—carbon dioxide, N2O—nitrous oxide, CH4—methane, ** p < 0.01; * p < 0.05.
Disclaimer/Publisher’s Note: The statements, opinions and data contained in all publications are solely those of the individual author(s) and contributor(s) and not of MDPI and/or the editor(s). MDPI and/or the editor(s) disclaim responsibility for any injury to people or property resulting from any ideas, methods, instructions or products referred to in the content.

