
Evaluating Performance Measurement Metrics for Lean and Agile Supply Chain Strategies in Large Enterprises

 ,
,
Abstract
1. Introduction
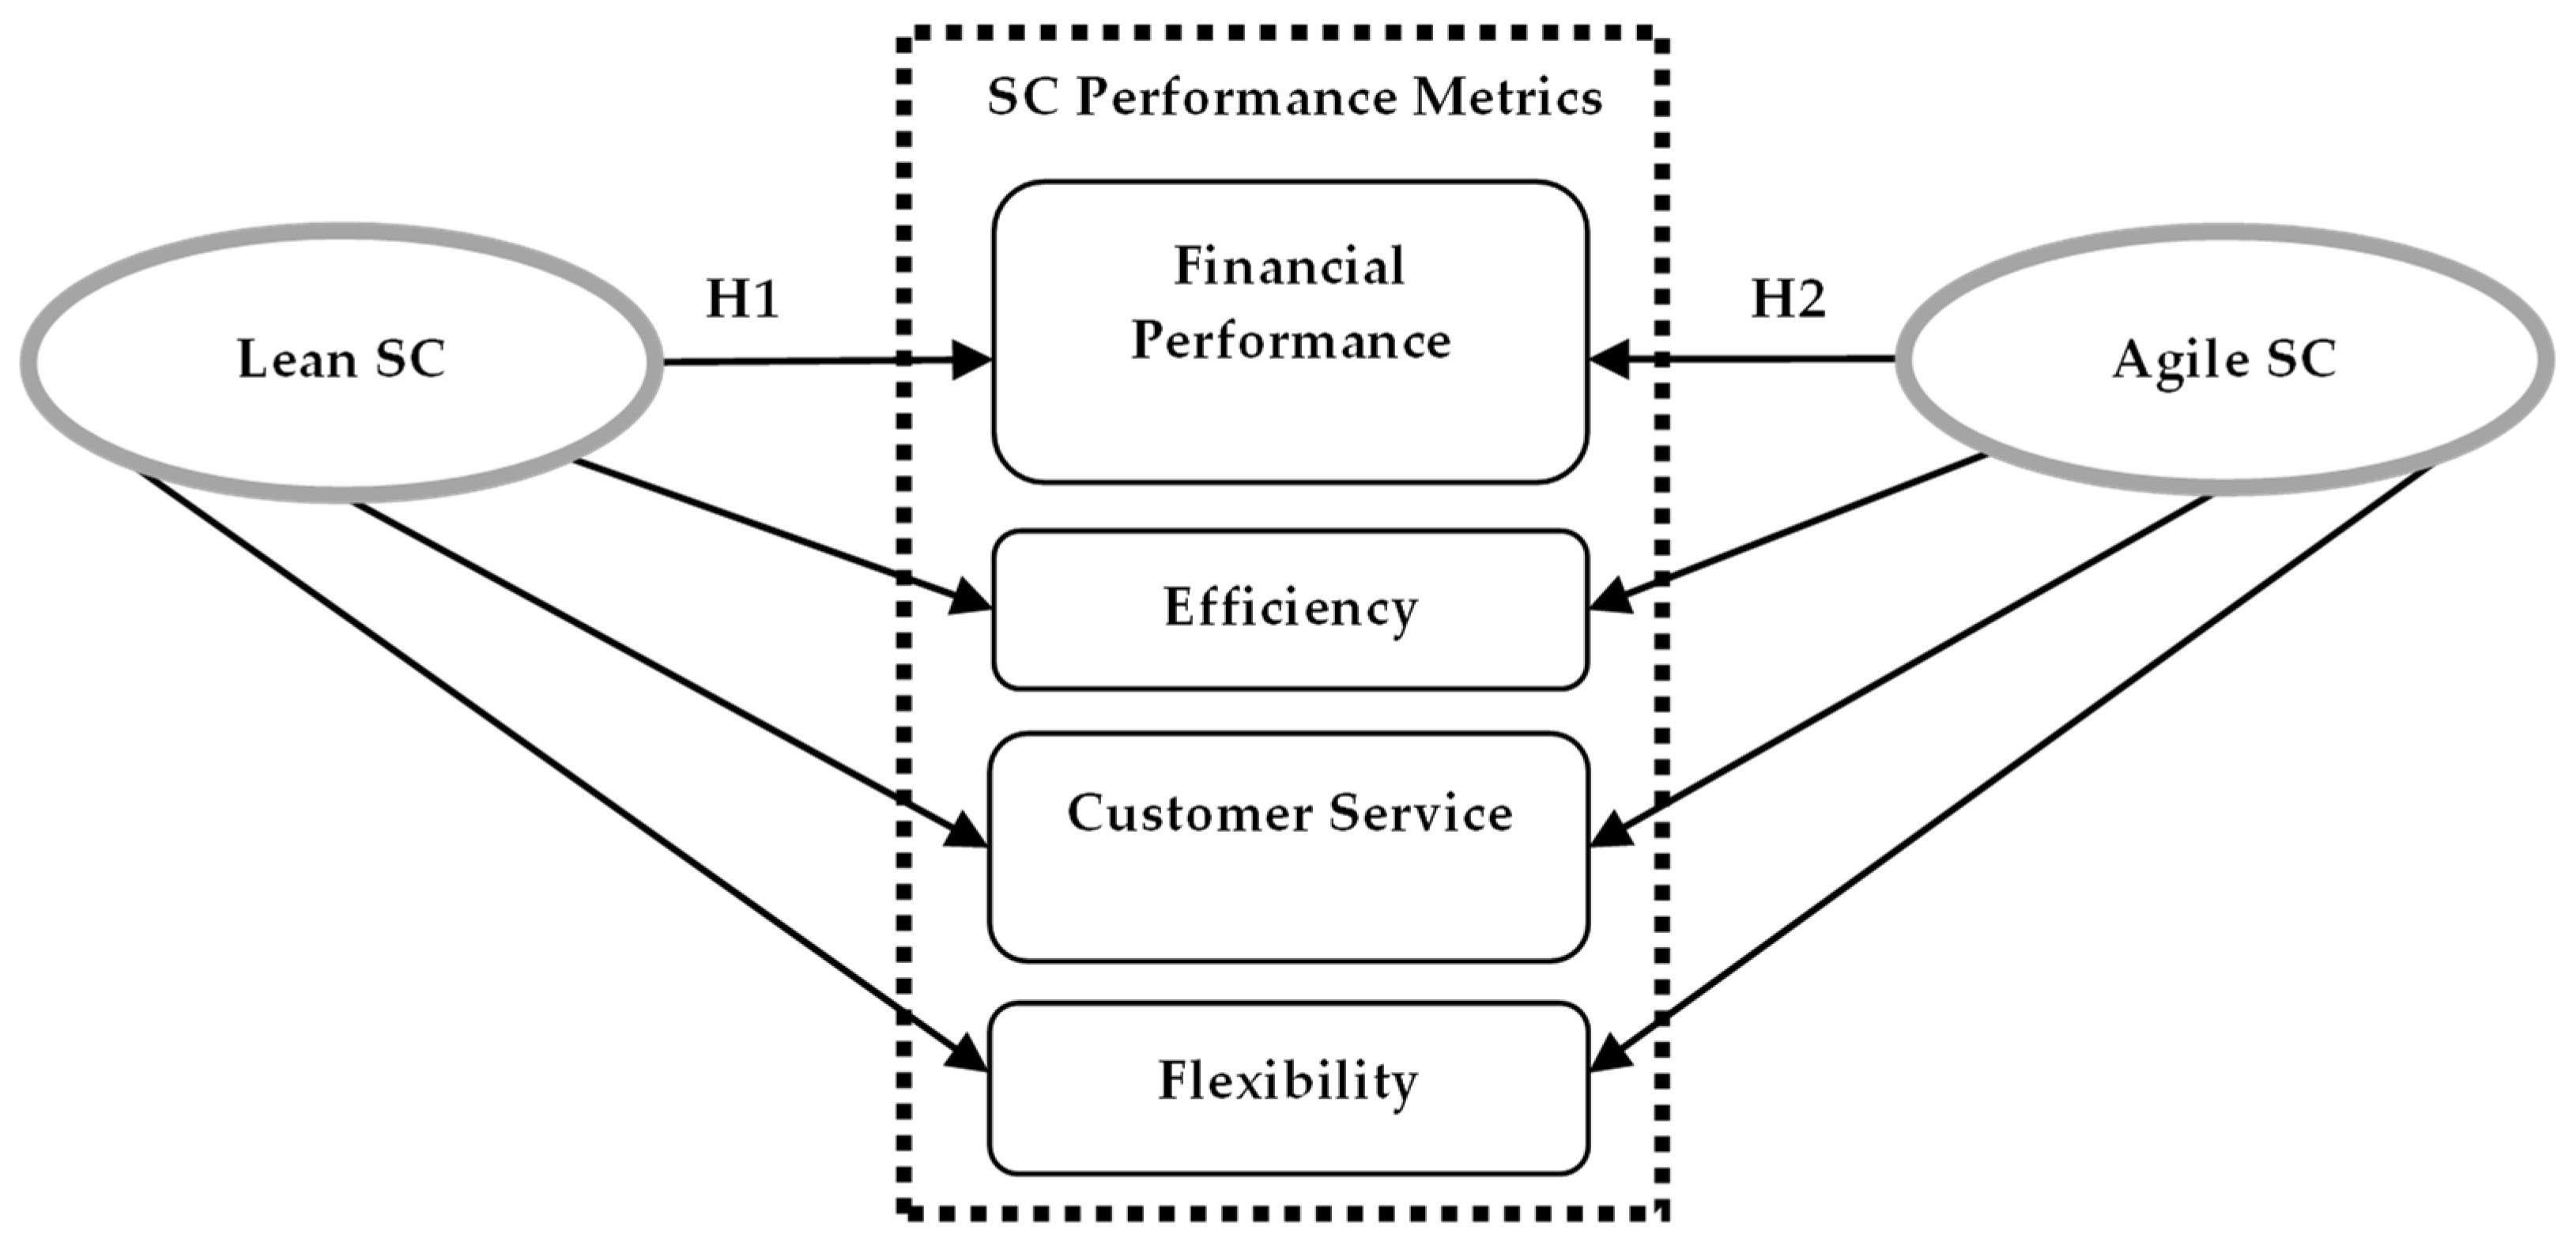
2. Theoretical Background and Hypotheses Development
2.1. Supply Chain Strategies: Lean and Agile Strategies
2.2. Supply Chain Performance Metrics for Lean and Agile Strategies
2.2.1. Supply Chain Performance Systems: An Overview
2.2.2. Matching SC Metrics with SC Strategy: A Contingency Theory
2.2.3. Specific Metrics for Lean Supply Chain Strategy
2.2.4. Specific Metrics for Agile Supply Chain Strategy
3. Research Methods
3.1. Research Instrument Development
3.2. Sampling Technique and Data Collection
4. Data Analysis
4.1. Outer Model Analysis
4.1.1. One-dimensionality Analysis and Composite Reliability
4.1.2. Convergent Validity Analysis
4.1.3. Convergent Validity Analysis
4.2. Inner Model Analysis (Hypotheses Testing Using PLS-PM Method)
5. Discussion
6. Conclusions
6.1. Theoretical Contributions
6.2. Managerial Contributions
6.3. Limitations and Future Research Scope
Author Contributions
Funding
Institutional Review Board Statement
Informed Consent Statement
Data Availability Statement
Conflicts of Interest
Appendix A. Research Instrument
| Axes | Construct | |
| Supply Chain Strategies | Lean supply chain For efficiency, our strategy consists of: |
|
| ||
| ||
| ||
| Agile supply chain For responsiveness, our strategy consists of: |
| |
| ||
| ||
| ||
| SC Performance How do you rate your performance compared to your competitors in the following areas (1 strogly disagree to 5 strongly agree): | Financial Performance |
|
| ||
| ||
| ||
| ||
| Efficiency |
| |
| ||
| Customer Service |
| |
| ||
| ||
| ||
| Flexibility |
| |
| ||
| ||
|
References
- Chopra, S.; Meindl, P. Supply Chain Management: Strategy, Planning, and Operation, 5th ed.; Pearson Education, Inc.: Indianapolis, Indiana; Prentice Hall: Upper Saddle River, NJ, USA, 2013. [Google Scholar]
- Mason-Jones, R.; Naylor, B.; Towill, D.R. Lean, agile or leagile? Matching your supply chain to the marketplace. Int. J. Prod. Res. 2000, 38, 4061–4070. [Google Scholar] [CrossRef]
- Beamon, B.M. Measuring supply chain performance. Int. J. Oper. Prod. Manag. 1999, 19, 275–292. [Google Scholar] [CrossRef]
- Chan, F.T.; Qi, H.J. An innovative performance measurement method for supply chain management. Supply Chain Manag. Int. J. 2003, 8, 209–223. [Google Scholar] [CrossRef]
- Shafiee, M.; Lotfi, F.H.; Saleh, H. Supply chain performance evaluation with data envelopment analysis and balanced scorecard approach. Appl. Math. Model. 2014, 38, 5092–5112. [Google Scholar] [CrossRef]
- Maestrini, V.; Luzzini, D.; Caniato, F.; Maccarrone, P.; Ronchi, S. Measuring supply chain performance: A lifecycle framework and a case study. Int. J. Oper. Prod. Manag. 2018, 38, 934–956. [Google Scholar] [CrossRef]
- Piotrowicz, W.; Cuthbertson, R. Performance measurement and metrics in supply chains: An exploratory study. Int. J. Product. Perform. Manag. 2015, 64, 1068–1091. [Google Scholar] [CrossRef]
- Piotrowicz, W.D.; Ryciuk, U.; Szymczak, M. Lean and agile metrics. Literature review and framework for measuring leagile supply chain. Int. J. Product. Perform. Manag. 2023, 72, 1560–1583. [Google Scholar] [CrossRef]
- Narasimhan, R.; Swink, M.; Kim, S.W. Disentangling leanness and agility: An empirical investigation. J. Oper. Manag. 2006, 24, 440–457. [Google Scholar] [CrossRef]
- Gunasekaran, A. Agile manufacturing: A framework for research and development. Int. J. Prod. Econ. 1999, 62, 87–105. [Google Scholar] [CrossRef]
- Naim, M.M.; Gosling, J. On leanness, agility and leagile supply chains. Int. J. Prod. Econ. 2011, 131, 342–354. [Google Scholar] [CrossRef]
- Ciccullo, F.; Pero, M.; Caridi, M.; Gosling, J.; Purvis, L. Integrating the environmental and social sustainability pillars into the lean and agile supply chain management paradigms: A literature review and future research directions. J. Clean. Prod. 2018, 172, 2336–2350. [Google Scholar] [CrossRef]
- Fisher, M.L. What is the right supply chain for your product? Harv. Bus. Rev. 1997, 75, 105–117. [Google Scholar]
- Christopher, M. Logistics and Supply Chain Management; Pearson: London, UK, 2022. [Google Scholar]
- Vonderembse, M.A.; Uppal, M.; Huang, S.H.; Dismukes, J.P. Designing supply chains: Towards theory development. Int. J. Prod. Econ. 2006, 100, 223–238. [Google Scholar] [CrossRef]
- Melton, T. The benefits of lean manufacturing: What lean thinking has to offer the process industries. Chem. Eng. Res. Des. 2005, 83, 662–673. [Google Scholar] [CrossRef]
- Basu, R.; Wright, J.N. Total Supply Chain Management; Routledge: London, UK, 2010. [Google Scholar]
- Carvalho, H.; Cruz-Machado, V. Integrating lean, agile, resilience and green paradigms in supply chain management (LARG_SCM). Supply Chain Manag. 2011, 2, 151–179. [Google Scholar]
- Gilaninia, S.; Taleghani, M.; Mousavian, S.J.; Tajani, T.K.; Ghoreishi, S.M.; Shahidi, S.F.; Seighalani, F.Z. Comparative study of lean and agile supply chain management along with the optimal model presentation of agile supply chain management. Kuwait Chapter Arab. J. Bus. Manag. Rev. 2011, 1, 46–56. [Google Scholar]
- Gligor, D.; Bozkurt, S.; Gölgeci, I.; Maloni, M.J. Does supply chain agility create customer value and satisfaction for loyal B2B business and B2C end-customers? Int. J. Phys. Distrib. Logist. Manag. 2020, 50, 721–743. [Google Scholar] [CrossRef]
- Safeer, A.A.; Le, T.T. Transforming customers into evangelists: Influence of online brand experience on relationship quality and brand evangelism in the banking industry. Asia Pac. J. Mark. Logist. 2023, 35, 2947–2964. [Google Scholar] [CrossRef]
- Christopher, M.; Peck, H. Building the Resilient Supply Chain. Int. J. Logist. Manag. 2004, 15, 1–14. [Google Scholar] [CrossRef]
- Towill, D.R.; Christopher, M. Do not lean too far – evidence from the first decade. Int. J. Agil. Syst. Manag. 2007, 2, 406. [Google Scholar]
- Gunasekaran, A.; Lai, K.; Cheng, T.E. Responsive supply chain: A competitive strategy in a networked economy. Omega 2008, 36, 549–564. [Google Scholar] [CrossRef]
- Aitken, J.; Christopher, M.; Towill, D. Understanding, Implementing and Exploiting Agility and Leanness. Int. J. Logist. Res. Appl. 2002, 5, 59–74. [Google Scholar] [CrossRef]
- Bowersox, D.J.; Closs, D.J.; Cooper, M.B.; Bowersox, J.C. Supply Chain Logistics Management; Mcgraw-Hill: New York, NY, USA, 2020. [Google Scholar]
- Baramichai, M.; Zimmers Jr, E.W.; Marangos, C.A. Agile supply chain transformation matrix: An integrated tool for creating an agile enterprise. Supply Chain Manag. Int. J. 2007, 12, 334–348. [Google Scholar] [CrossRef]
- Womack, J.P.; Jones, T.J.; Roos, D. The Machine That Changed the World: The Story of Lean Production; Harper Perennial: London, UK, 1990. [Google Scholar]
- Christopher, M. Supply Chain Management: Créer Des Réseaux À Forte Valeur Ajoutée; Village Mondial: Paris, France, 2005. [Google Scholar]
- Laghouag, A.; Zouaghi, I.; Makaci, M. Etude des Stratégies Supply Chain Lean, Agile, et Hybride. Roa Iktissadia Rev. 2020, 10, 237–250. [Google Scholar]
- Patel, B.S.; Tiwari, A.K.; Kumar, M.; Samuel, C.; Sutar, G. Analysis of agile supply chain enablers for an Indian manufacturing organisation. IJASM 2020, 13, 1. [Google Scholar] [CrossRef]
- Hartono, Y.; Astanti, R.D.; Ai, T.J. Enabler to successful implementation of lean supply chain in a book publisher. Procedia Manuf. 2015, 4, 192–199. [Google Scholar] [CrossRef][Green Version]
- Ahmed, W.; Rashdi, M.Z. Understanding the influence of lean and agile strategies on creating firms’ supply chain risk management capabilities. Compet. Rev. Int. Bus. J. 2021, 31, 810–831. [Google Scholar] [CrossRef]
- Oliveira-Dias, D.; Moyano-Fuentes, J.; Maqueira-Marín, J.M. Understanding the relationships between information technology and lean and agile supply chain strategies: A systematic literature review. Ann. Oper. Res. 2022, 312, 973–1005. [Google Scholar] [CrossRef]
- Raji, I.O.; Shevtshenko, E.; Rossi, T.; Strozzi, F. Industry 4.0 technologies as enablers of lean and agile supply chain strategies: An exploratory investigation. Int. J. Logist. Manag. 2021, 32, 1150–1189. [Google Scholar] [CrossRef]
- Ahmed, W.; Huma, S. Impact of lean and agile strategies on supply chain risk management. Total Qual. Manag. Bus. Excell. 2021, 32, 33–56. [Google Scholar] [CrossRef]
- De Oliveira-Dias, D.; Maqueira-Marin, J.M.; Moyano-Fuentes, J.; Carvalho, H. Implications of using Industry 4.0 base technologies for lean and agile supply chains and performance. Int. J. Prod. Econ. 2023, 262, 108916. [Google Scholar] [CrossRef]
- Hassani, Y.; Ceauşu, I.; Iordache, A. Lean and Agile model implementation for managing the supply chain. Proc. Int. Conf. Bus. Excell. 2020, 14, 847–858. [Google Scholar] [CrossRef]
- Simatupang, T.M.; Sridharan, R. Design for supply chain collaboration. Bus. Process Manag. J. 2008, 14, 401–418. [Google Scholar] [CrossRef]
- Morgan, C. Structure, speed and salience: Performance measurement in the supply chain. Bus. Process Manag. J. 2004, 10, 522–536. [Google Scholar] [CrossRef]
- Melnyk, S.A.; Stewart, D.M.; Swink, M. Metrics and performance measurement in operations management: Dealing with the metrics maze. J. Oper. Manag. 2004, 22, 209–218. [Google Scholar] [CrossRef]
- Schmitz, J.; Platts, K.W. Supplier logistics performance measurement: Indications from a study in the automotive industry. Int. J. Prod. Econ. 2004, 89, 231–243. [Google Scholar] [CrossRef]
- Kim, K.K.; Umanath, N.S.; Kim, J.Y.; Ahrens, F.; Kim, B. Knowledge complementarity and knowledge exchange in supply channel relationships. Int. J. Inf. Manag. 2012, 32, 35–49. [Google Scholar] [CrossRef]
- Schnetzler, M.J.; Sennheiser, A.; Schönsleben, P. A decomposition-based approach for the development of a supply chain strategy. Int. J. Prod. Econ. 2007, 105, 21–42. [Google Scholar] [CrossRef]
- Gunasekaran, A.; Patel, C.; Tirtiroglu, E. Performance measures and metrics in a supply chain environment. Int. J. Oper. Prod. Manag. 2001, 21, 71–87. [Google Scholar] [CrossRef]
- Hald, K.S.; Mouritsen, J. The evolution of performance measurement systems in a supply chain: A longitudinal case study on the role of interorganisational factors. Int. J. Prod. Econ. 2018, 205, 256–271. [Google Scholar] [CrossRef]
- Stephens, S. Supply chain operations reference model version 5.0: A new tool to improve supply chain efficiency and achieve best practice. Inf. Syst. Front. 2001, 3, 471–476. [Google Scholar] [CrossRef]
- de Almeida Santos, D.; Luiz Gonçalves Quelhas, O.; Francisco Simões Gomes, C.; Perez Zotes, L.; Luiz Braga França, S.; Vinagre Pinto de Souza, G.; Amarante de Araújo, R.; da Silva Carvalho Santos, S. Proposal for a maturity model in sustainability in the supply chain. Sustainability 2020, 12, 9655. [Google Scholar] [CrossRef]
- Park, J.H.; Lee, J.K.; Yoo, J.S. A framework for designing the balanced supply chain scorecard. Eur. J. Inf. Syst. 2005, 14, 335–346. [Google Scholar] [CrossRef]
- Bhagwat, R.; Sharma, M.K. Performance measurement of supply chain management: A balanced scorecard approach. Comput. Ind. Eng. 2007, 53, 43–62. [Google Scholar] [CrossRef]
- Thakkar, J.; Kanda, A.; Deshmukh, S.G. Supply chain performance measurement framework for small and medium scale enterprises. Benchmarking Int. J. 2009, 16, 702–723. [Google Scholar] [CrossRef]
- Laihonen, H.; Pekkola, S. Impacts of using a performance measurement system in supply chain management: A case study. Int. J. Prod. Res. 2016, 54, 5607–5617. [Google Scholar] [CrossRef]
- Kruger, S.D.; Zanin, A.; Durán, O.; Afonso, P. Performance measurement model for sustainability assessment of the swine supply chain. Sustainability 2022, 14, 9926. [Google Scholar] [CrossRef]
- Zhang, C.; Tang, L.; Zhang, J. Identifying Critical Indicators in Performance Evaluation of Green Supply Chains Using Hybrid Multiple-Criteria Decision-Making. Sustainability 2023, 15, 6095. [Google Scholar] [CrossRef]
- Varadejsatitwong, P.; Banomyong, R.; Julagasigorn, P. A Proposed Performance-Measurement System for Enabling Supply-Chain Strategies. Sustainability 2022, 14, 11797. [Google Scholar] [CrossRef]
- Rejc, A. Toward contingency theory of performance measurement. J. East Eur. Manag. Stud. 2004, 9, 243–264. [Google Scholar] [CrossRef]
- Burns, T.; Stalker, G.M. The Management of Innovation; Oxford University Press: Oxford, UK, 1994. [Google Scholar]
- Eccles, R.G. The performance measurement manifesto. Harv. Bus. Rev. 1991, 69, 131–137. [Google Scholar]
- Otley, D.T. The contingency theory of management accounting: Achievement and prognosis. Account. Organ. Soc. 1980, 5, 413–428. [Google Scholar] [CrossRef]
- Wisner, J.D.; Fawcett, S.E. Linking firm strategy to operating decisions through performance measurement. Prod. Inventory Manag. J. 1991, 32, 5. [Google Scholar]
- Waggoner, D.B.; Neely, A.D.; Kennerley, M.P. The forces that shape organisational performance measurement systems: An interdisciplinary review. Int. J. Prod. Econ. 1999, 60, 53–60. [Google Scholar] [CrossRef]
- Emmanuel, C.; Otley, D.; Merchant, K. Accounting for Management Control; Springer: Boston, MA, USA, 1990; pp. 357–384. [Google Scholar]
- Seidmann, A.; Sundararajan, A. Building and sustaining inter-organizational information sharing relationships: The competitive impact of interfacing supply chain operations with marketing strategy. In Proceedings of the Eighteenth International Conference on Information Systems, Atlanta, GA, USA, 15–17 December 1997; pp. 205–222. [Google Scholar]
- Rai, A.; Patnayakuni, R.; Seth, N. Firm performance impacts of digitally enabled supply chain integration capabilities. MIS Q. 2006, 30, 225–246. [Google Scholar] [CrossRef]
- Lee, H.L.; Padmanabhan, V.; Whang, S. The bullwhip effect in supply chains. Sloan Manag. Rev. 1997, 38, 93. [Google Scholar] [CrossRef]
- Lee, H.L. Aligning Supply Chain Strategies with Product Uncertainties. Calif. Manag. Rev. 2002, 44, 105–119. [Google Scholar] [CrossRef]
- Salah, A.; Çağlar, D.; Zoubi, K. The Impact of Production and Operations Management Practices in Improving Organizational Performance: The Mediating Role of Supply Chain Integration. Sustainability 2023, 15, 15140. [Google Scholar] [CrossRef]
- Arif-Uz-Zaman, K.; Nazmul Ahsan, A.M.M. Lean supply chain performance measurement. Int. J. Product. Perform. Manag. 2014, 63, 588–612. [Google Scholar] [CrossRef]
- Malmbrandt, M.; Åhlström, P. An instrument for assessing lean service adoption. Int. J. Oper. Prod. Manag. 2013, 33, 1131–1165. [Google Scholar] [CrossRef]
- Govindan, K.; Azevedo, S.G.; Carvalho, H.; Cruz-Machado, V. Lean, green and resilient practices influence on supply chain performance: Interpretive structural modeling approach. Int. J. Environ. Sci. Technol. 2015, 12, 15–34. [Google Scholar] [CrossRef]
- Hines, P.; Holweg, M.; Rich, N. Learning to evolve: A review of contemporary lean thinking. Int. J. Oper. Prod. Manag. 2004, 24, 994–1011. [Google Scholar] [CrossRef]
- Naylor, J.B.; Naim, M.M.; Berry, D. Leagility: Integrating the lean and agile manufacturing paradigms in the total supply chain. Int. J. Prod. Econ. 1999, 62, 107–118. [Google Scholar] [CrossRef]
- Rimienė, K. Supply chain agility concept evolution (1990–2010). Econ. Manag. 2011, 16, 892. [Google Scholar]
- Cho, H.; Jung, M.; Kim, M. Enabling technologies of agile manufacturing and its related activities in Korea. Comput. Ind. Eng. 1996, 30, 323–334. [Google Scholar] [CrossRef]
- Lin, C.-T.; Chiu, H.; Chu, P.-Y. Agility index in the supply chain. Int. J. Prod. Econ. 2006, 100, 285–299. [Google Scholar] [CrossRef]
- Khalili-Damghani, K.; Tavana, M. A new fuzzy network data envelopment analysis model for measuring the performance of agility in supply chains. Int. J. Adv. Manuf. Technol. 2013, 69, 291–318. [Google Scholar] [CrossRef]
- AlKahtani, M.; Rehman, A.U.; Al-Zabidi, A.; Choudhary, A. Agile Supply Chain Assessment: An Empirical Study on Concepts, Research and Issues. Arab. J. Sci. Eng. 2019, 44, 2551–2565. [Google Scholar] [CrossRef]
- Bruce, M.; Daly, L.; Towers, N. Lean or agile: A solution for supply chain management in the textiles and clothing industry? Int. J. Oper. Prod. Manag. 2004, 24, 151–170. [Google Scholar] [CrossRef]
- Qrunfleh, S.; Tarafdar, M. Supply chain information systems strategy: Impacts on supply chain performance and firm performance. Int. J. Prod. Econ. 2014, 147, 340–350. [Google Scholar] [CrossRef]
- Noor, S.; Tajik, O.; Golzar, J. Simple random sampling. Int. J. Educ. Lang. Stud. 2022, 1, 78–82. [Google Scholar]
- Taber, K.S. The Use of Cronbach’s Alpha When Developing and Reporting Research Instruments in Science Education. Res. Sci. Educ. 2018, 48, 1273–1296. [Google Scholar] [CrossRef]
- Bhattacherjee, A. Social Science Research: Principles, Methods, and Practices; University of South Florida: Tampa, FL, USA, 2012. [Google Scholar]
- Lee, S.-Y. Sustainable supply chain management, digital-based supply chain integration, and firm performance: A cross-country empirical comparison between South Korea and Vietnam. Sustainability 2021, 13, 7315. [Google Scholar] [CrossRef]
- Vanichchinchai, A. The effect of lean manufacturing on a supply chain relationship and performance. Sustainability 2019, 11, 5751. [Google Scholar] [CrossRef]
- Tarafdar, M.; Qrunfleh, S. Agile supply chain strategy and supply chain performance: Complementary roles of supply chain practices and information systems capability for agility. Int. J. Prod. Res. 2017, 55, 925–938. [Google Scholar] [CrossRef]


| Lean SC Strategy | Agile SC Strategy | Related Researches | |
|---|---|---|---|
| Definition | This strategy is based on cost reduction and flexibility, and process improvement, through the elimination of wastes generated by the existence of non-value added activities. | This strategy ensures that capabilities are developed to respond quickly to unpredictable changes in demand and supply (downstream/upstream flows). | [7,8,15,16,17,18,19,22,23,24,25,26,27,28,29,30,31,32,33,34,35,36,37,38] |
| Objectives | Low cost, high usage, minimum stock | Quick response, buffer capacity, deployed stock | |
| Organisational Structure | Low level of hierarchy levels | Virtual organisation with dynamic partnership | |
| Manufacturing Planning | Confirmed orders and reliable forecasts | Ability to respond quickly to different customer needs. | |
| Pricing | Low margin—price is an advantageous factor | High margin—price is a qualifying factor | |
| Supplier Selection | Selection is based on cost and quality. | Selection is based on speed, flexibility and quality. | |
| Product Life Cycle | Relatively long (+2 years) | Short (3 months–1 year) | |
| Collaboration with Partners | Traditional alliances such as operational level partnerships | Dynamic alliances (virtual organisation) that work on product design | |
| Product design Strategy | Maximise performance and minimise costs. | Product designs to meet individual customer needs. | |
| Delivery Time Management | Reduction in delays as long as this does not penalise costs. | High investment in methods to reduce delays. | |
| Demand Structure | Precisely predictable demand with an average deviation of 10%. | Unpredictable demand with a deviation exceeding 50%. | |
| Inventory Management | High inventory turnover which is minimised along the SC. | Manufacturing based on customer demand | |
| Product Characteristics | Functional product, low variety, low margin | Innovative product, high variety, high margin | |
| Process Characteristics | Elimination of wastes, high efficiency, quality | Flexibility, market sensitivity, virtual network | |
| Enablers | Standardisation, quality improvement, trust between SC, Industry 4.0 technologies, kanban system. | Virtual enterprises, customer satisfaction, adaptability, Industry 4.0 technologies a collaborative network of partners, and knowledge management | |
| Main Performance Metrics | Efficiency, productivity, cost, inventory, delivery | Responsiveness, flexibility, joint planning, integration, information sharing, market sensitivity. |
| Axes | Construct | Items | Scales | Related Research |
|---|---|---|---|---|
| Supply Chain Strategies | Lean SC | 4 items | Likert 1–5 | [1,2,72,78,79] |
| Agile SC | 4 items | Likert 1–5 | ||
| Supply Chain Performance | Financial Performance | 5 items | Likert 1–5 | [3,55,79] |
| Efficiency | 2 items | |||
| Customer Service | 4 items | |||
| Flexibility | 4 items | |||
| Total number of items | 23 items |
| Dimensions | Items | Cronbach’s Alpha | Dillon-Goldstein’s Rho | Critical Value | Eigenvalue |
|---|---|---|---|---|---|
| LSCS | 4 | 0.6949 | 0.8141 | 1.0000 | 2.0975 |
| 0.8929 | |||||
| ASCS | 4 | 0.6745 | 0.8041 | 1.0000 | 2.0308 |
| 0.8070 | |||||
| FIP | 5 | 0.8595 | 0.8996 | 1.0000 | 3.2160 |
| 0.7769 | |||||
| EFP | 2 | 0.7968 | 0.9078 | 1.0000 | 1.6622 |
| 0.3378 | |||||
| CSP | 4 | 0.8561 | 0.9029 | 1.0000 | 2.7983 |
| 0.4931 | |||||
| FLP | 4 | 0.8359 | 0.8922 | 1.0000 | 2.7079 |
| 0.8103 |
| LSCS | ASCS | FIP | AFP | CSP | FLP | AVE | |
|---|---|---|---|---|---|---|---|
| LSCS | 1 | 0.4667 | 0.4858 | 0.1746 | 0.4219 | 0.2356 | 0.4711 |
| ASCS | 0.4667 | 1 | 0.2748 | 0.1507 | 0.4880 | 0.3582 | 0.3691 |
| FIP | 0.4858 | 0.2748 | 1 | 0.4218 | 0.4998 | 0.3579 | 0.5247 |
| EFP | 0.1746 | 0.1507 | 0.4218 | 1 | 0.3946 | 0.3742 | 0.7240 |
| CSP | 0.4219 | 0.4880 | 0.4998 | 0.3946 | 1 | 0.5461 | 0.5997 |
| FLP | 0.2356 | 0.3582 | 0.3579 | 0.3742 | 0.5461 | 1 | 0.6079 |
| AVE | 0.4711 | 0.3691 | 0.5247 | 0.7240 | 0.5997 | 0.6079 | 0 |
| Performances Metrics | R2 | F | Pr > F | R2 (Bootstrap) | Standard Error | Critical Ratio (CR) | Lower Bound (95%) | Upper Bound (95%) |
|---|---|---|---|---|---|---|---|---|
| Financial Performance | 0.4901 | 15.3785 | 0.0000 | 0.5292 | 0.1369 | 3.5791 | 0.1570 | 0.8236 |
| Efficiency | 0.1944 | 3.8613 | 0.0315 | 0.2777 | 0.1527 | 1.2730 | 0.0237 | 0.6643 |
| Customer Service | 0.5437 | 19.0656 | 0.0000 | 0.6002 | 0.1548 | 3.5126 | 0.3040 | 0.8961 |
| Flexibility | 0.3692 | 9.3652 | 0.0006 | 0.4846 | 0.1301 | 2.8386 | 0.1974 | 0.7270 |
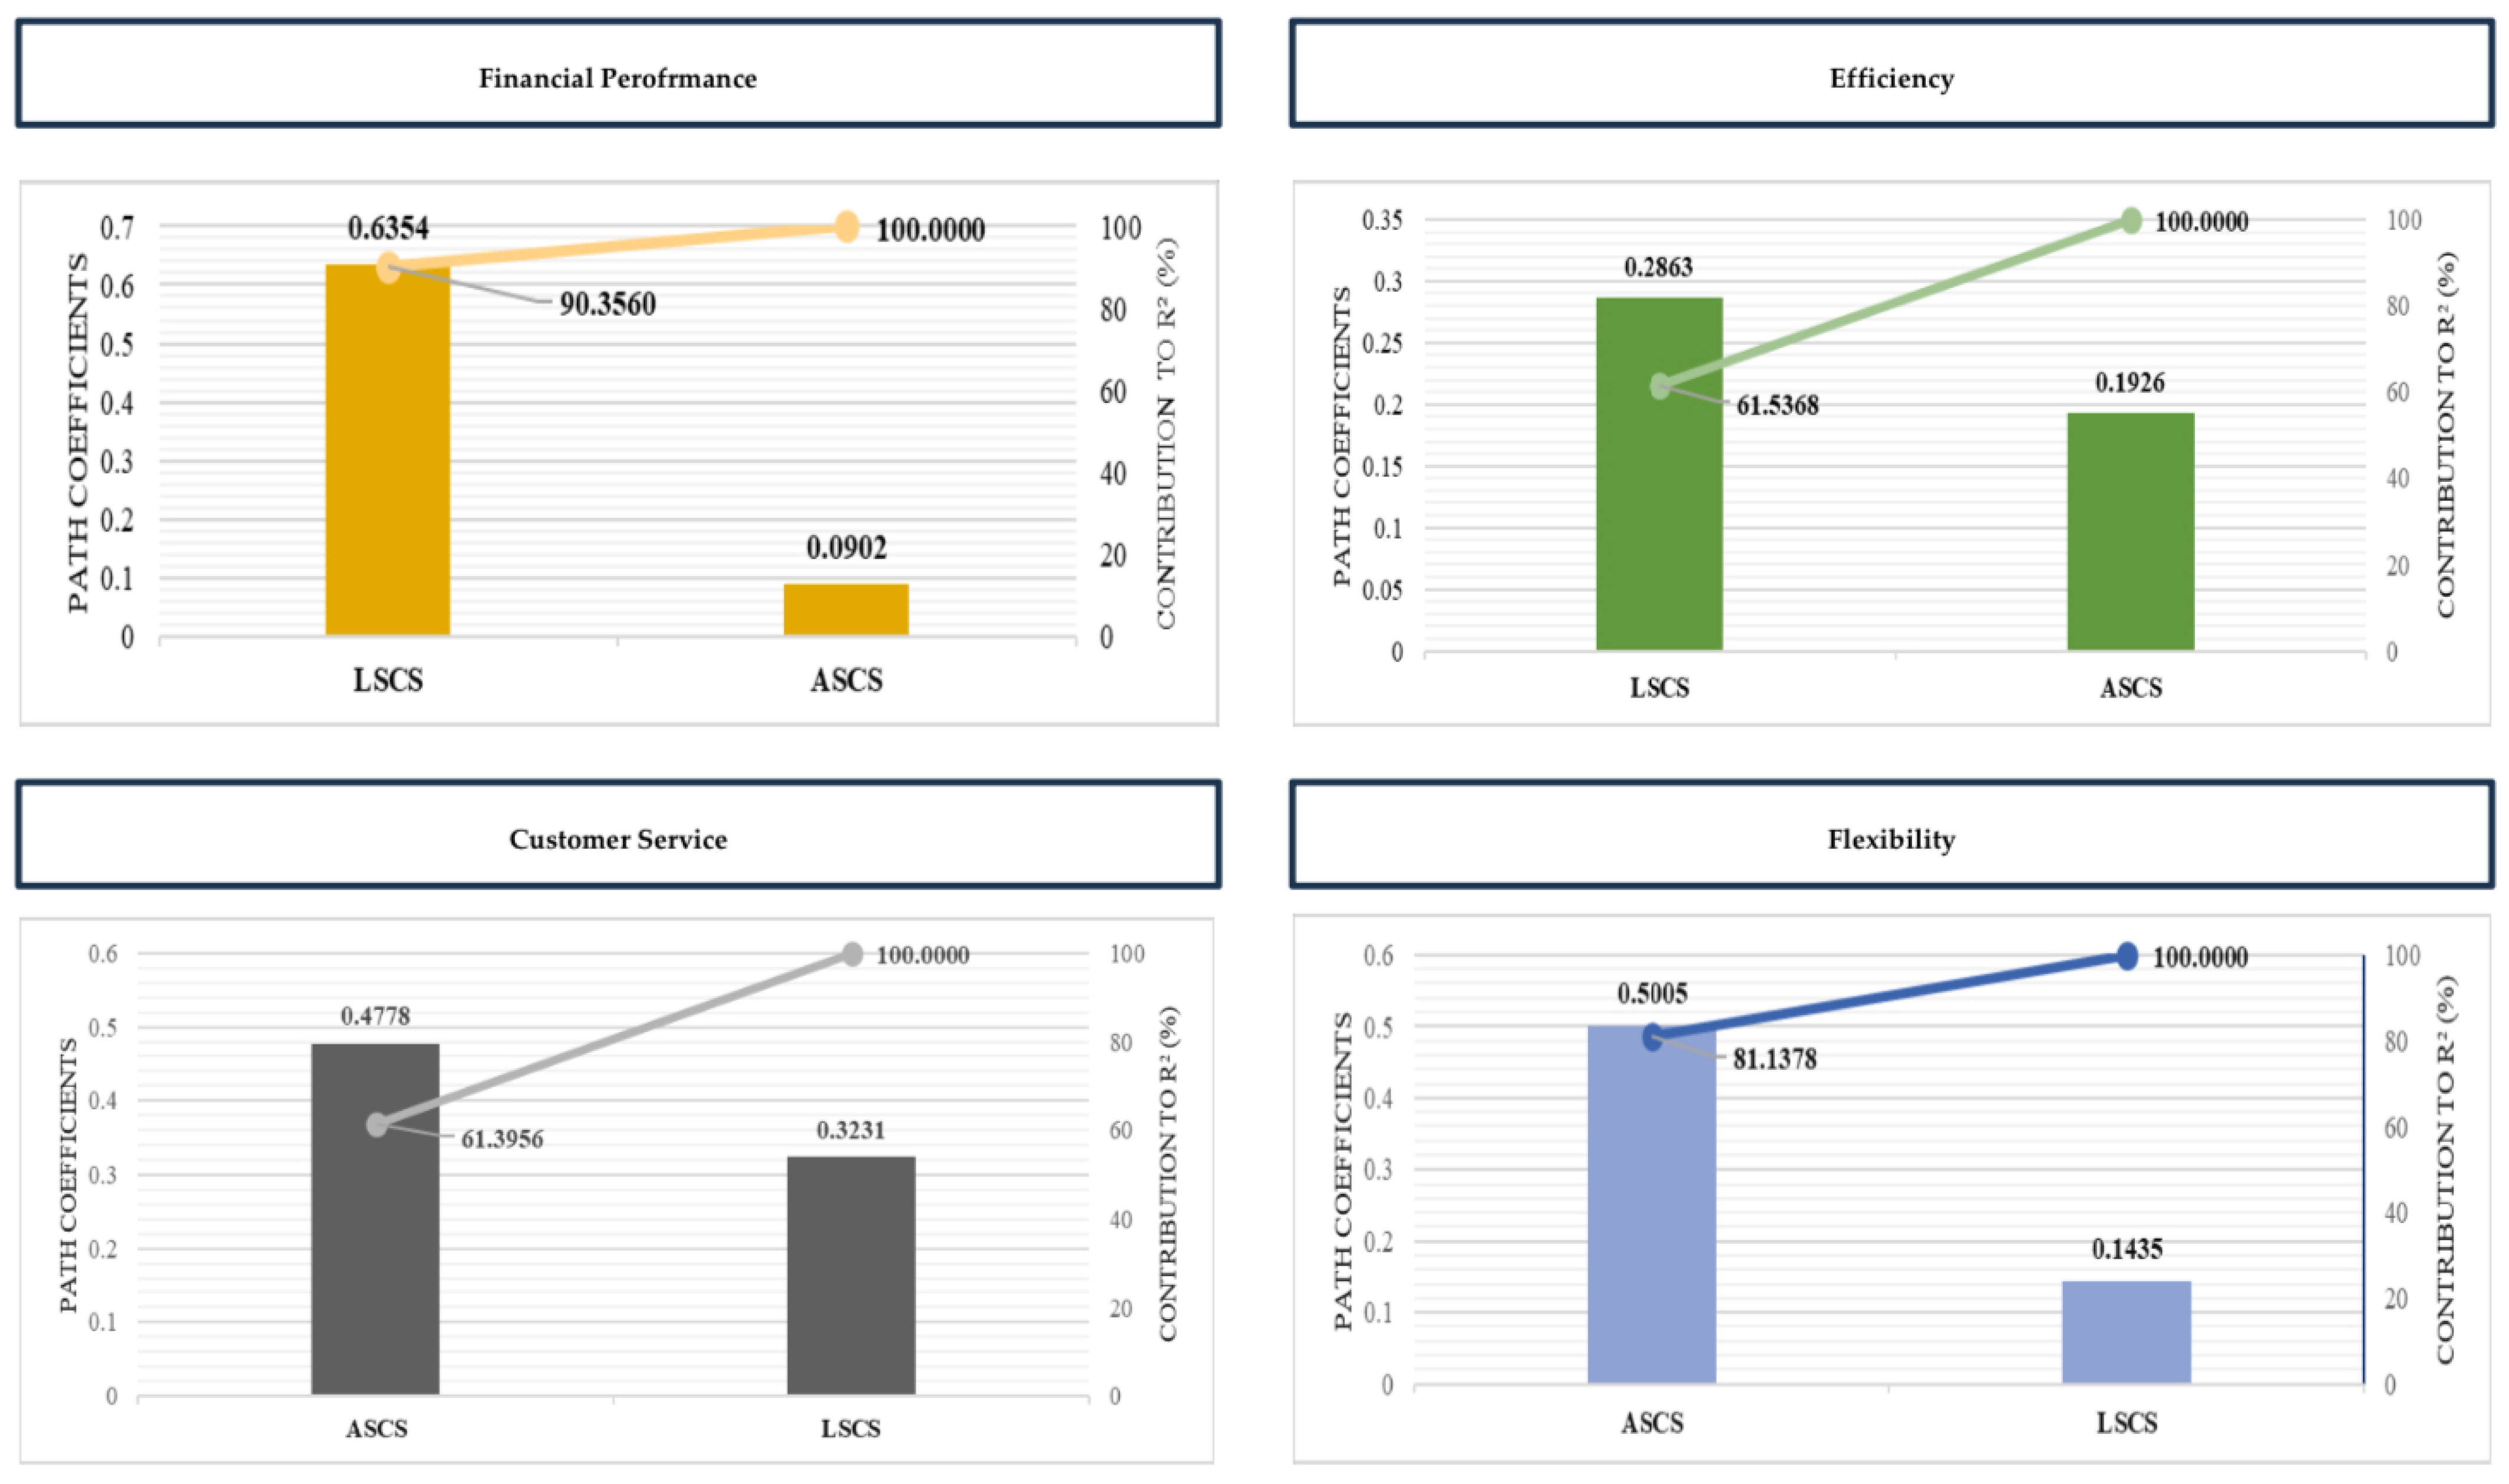
| LV | Value | Standard Error | t | Pr > |t| | f2 | Value (Bootstrap) | Standard Error (Bootstrap) | Critical Ratio (CR) | Lower Bound (95%) | Upper Bound (95%) | |
|---|---|---|---|---|---|---|---|---|---|---|---|
| Financial Performance | LSCS | 0.6354 | 0.1729 | 3.6758 | 0.0009 | 0.4222 | 0.5697 | 0.1975 | 3.2175 | 0.0397 | 0.9333 |
| ASCS | 0.0902 | 0.1729 | 0.5216 | 0.6055 | 0.0085 | 0.1378 | 0.2335 | 0.3862 | −0.4450 | 0.5023 | |
| SE* for FIP | Financial Performance (FIP) = 0.63537 × LSCS + 0.09016 × ASCS | ||||||||||
| Efficiency | LSCS | 0.2863 | 0.2173 | 1.3177 | 0.1970 | 0.0543 | 0.2826 | 0.2348 | 1.2192 | −0.4539 | 0.7563 |
| ASCS | 0.1926 | 0.2173 | 0.8866 | 0.3819 | 0.0246 | 0.1822 | 0,2628 | 0.7329 | −0.5048 | 0.7618 | |
| SE* for EFP | Efficiency (EFP) = 0.28629 × LSCS + 0.19263 × ASCS | ||||||||||
| Customer Service | LSCS | 0.3231 | 0.1635 | 1.9762 | 0.0568 | 0.1220 | 0.3763 | 0.1623 | 1.9904 | 0.0255 | 0.7358 |
| ASCS | 0.4778 | 0.1635 | 2.9223 | 0.0063 | 0.2669 | 0.4234 | 0.1908 | 2.5041 | −0.3797 | 0.7375 | |
| SE* for CSP | Customer Service (CSP) = 0.32313 × LSCS + 0.47784 × ASCS | ||||||||||
| Flexibility | LSCS | 0.1435 | 0.1923 | 0.7463 | 0.4610 | 0.0174 | 0.2397 | 0.2008 | 0.7144 | −0.1796 | 0.6968 |
| ASCS | 0.5005 | 0.1923 | 2.6034 | 0.0139 | 0.2118 | 0.4718 | 0.2067 | 2.4214 | −0.2981 | 0.8080 | |
| SE* for FLP | Flexibility (FLP) = 0.14347 × LSCS + 0.50052 × ASCS | ||||||||||
| Impact and Contribution of Variables to: | Financial Performance | Efficiency | Customer Service | Flexibility | ||||
|---|---|---|---|---|---|---|---|---|
| LSCS | ASCS | LSCS | ASCS | ASCS | LSCS | ASCS | LSCS | |
| Correlation | 0.6970 | 0.5242 | 0.4179 | 0.3882 | 0.6986 | 0.6496 | 0.5985 | 0.4854 |
| Path coefficient | 0.6354 | 0.0902 | 0.2863 | 0.1926 | 0.4778 | 0.3231 | 0.5005 | 0.1435 |
| Correlation coefficient | 0.4428 | 0.0473 | 0.1196 | 0.0748 | 0.3338 | 0.2099 | 0.2996 | 0.0696 |
| Contribution to R2 (%) | 90.3560 | 9.6440 | 61.5368 | 38.4632 | 61.3956 | 38.6044 | 81.1378 | 18.8622 |
| % cumulative | 90.3560 | 100.0000 | 61.5368 | 100.0000 | 61.3956 | 100.0000 | 81.1378 | 100.0000 |
Disclaimer/Publisher’s Note: The statements, opinions and data contained in all publications are solely those of the individual author(s) and contributor(s) and not of MDPI and/or the editor(s). MDPI and/or the editor(s) disclaim responsibility for any injury to people or property resulting from any ideas, methods, instructions or products referred to in the content. |
© 2024 by the authors. Licensee MDPI, Basel, Switzerland. This article is an open access article distributed under the terms and conditions of the Creative Commons Attribution (CC BY) license (https://creativecommons.org/licenses/by/4.0/).
Share and Cite
Dahinine, B.; Laghouag, A.; Bensahel, W.; Alsolamy, M.; Guendouz, T. Evaluating Performance Measurement Metrics for Lean and Agile Supply Chain Strategies in Large Enterprises. Sustainability 2024, 16, 2586. https://doi.org/10.3390/su16062586
Dahinine B, Laghouag A, Bensahel W, Alsolamy M, Guendouz T. Evaluating Performance Measurement Metrics for Lean and Agile Supply Chain Strategies in Large Enterprises. Sustainability. 2024; 16(6):2586. https://doi.org/10.3390/su16062586
Chicago/Turabian StyleDahinine, Benameur, Abderrazak Laghouag, Wassila Bensahel, Majed Alsolamy, and Tarek Guendouz. 2024. "Evaluating Performance Measurement Metrics for Lean and Agile Supply Chain Strategies in Large Enterprises" Sustainability 16, no. 6: 2586. https://doi.org/10.3390/su16062586
APA StyleDahinine, B., Laghouag, A., Bensahel, W., Alsolamy, M., & Guendouz, T. (2024). Evaluating Performance Measurement Metrics for Lean and Agile Supply Chain Strategies in Large Enterprises. Sustainability, 16(6), 2586. https://doi.org/10.3390/su16062586