1. Introduction
The expansion of cities leads to the continuous site development of vacant spaces. Due to the increase in the price of land, commercial, residential, and industrial buildings are built within close proximity to each other. Different heating and ventilation equipment is used to create comfortable working and living conditions. This equipment emits large amounts of air and causes noise as a result. According to the World Health Organization data, approximately 20 percent of the population of the European Union suffers from a level of noise that medical experts identify as unacceptable. Acoustic comfort problems can be solved by installing noise barriers. However, ventilation equipment cannot be covered as it must cool down and take in or release air into the environment. Therefore, this noise prevention measure is not suitable for such cases. The increasing standardization constraints of noise values have led many manufacturing and commercial companies to look for effective solutions to keep the prescribed noise levels in the environment.
When assessing the impact of noise on health, a significant effect is observed on poorer sleep quality, annoyance, and the risk of hypertension due to these factors [
1,
2,
3,
4,
5]. Ref. [
6] conducted a study revealing that noise contributes to a minimum of 16,600 fatalities and 72,000 hospitalizations each year in Europe. Based on data from strategic noise mapping, approximately 22 million residents experience chronic annoyance caused by noise, while over 6.5 million suffer from chronic sleep disturbances [
7]. The reasons for this are various sleep disorders, annoyance, exhaust heart disease, tinnitus, and developmental disorders [
8,
9].
The second problem analyzed in this work is the current management of waste tires which causes both ecological and economic issues [
10,
11]. Despite current regulations, the ongoing accumulation of discarded tires in landfills remains an issue, and an economically and environmentally effective solution for recycling or reuse has not yet been discovered. The complexity of the physical and chemical structure of waste tires, varying based on their performance requirements, is the underlying cause of this phenomenon. Additionally, the three-dimensional cross-linked structure achieved through an irreversible vulcanization process renders waste tires a non-biodegradable residue resistant to numerous external factors [
12,
13]. The prevalent approach to managing waste tire rubber involves energy recovery [
14,
15]. The combustion of tires emits harmful pollutants, such as carbon dioxide, a significant driver of the greenhouse effect [
16,
17]. Whole or scrap tires are used as fuel in cement kilns, paper mills, or power plants [
14]. It is a relatively safe method; however, due to the environmental, financial, and efficiency issues, innovative reuse solutions are required [
12].
Rubber waste is a major problem due to the fact that tire rubber lasts for a very long time, and while decomposing, it releases hazardous chemicals into the environment. Tire rubber takes 800–1000 years to degrade in the soil [
17]. In recent years, tire rubber production has reached nearly 30 million tons. A total of 1.5 billion tires are discarded each year, containing up to 90% vulcanized rubber [
18]. Due to the mechanical resistance and changes in thermal conditions of resistance, vulcanized rubber is used in the manufacture of tires.
Table 1 shows the traditional structural composition of vehicle tires.
The storage of useless tires in landfills and waste collection facilities poses a risk of fire and environmental problems [
20,
21]. Currently, tires are being disposed of by burning. However, the problem of air pollution is particularly acute due to global warming. Burning tires requires expensive flue gas treatment equipment [
22], the maintenance costs of which are so high that such a method of disposal often becomes unprofitable. It is important to emphasize that the burning of tires produces hazardous ash [
23,
24], the disposal of which is prohibited in landfills. This further increases the cost of this type of tire management.
Also, tires are granulated to produce a variety of rubber products that can be used in the environment. Nevertheless, the market for such products is very insignificant. The use of tire waste depends on the selected recycling method. The main waste tire management methods are tire waste shredding, pyrolysis, retreading, and use for energy recovery [
25]. The products of recycling tires are rubber granules, rubber powder, metal, carbon black, and oil [
26,
27]. Rubber granules are a material obtained as a result of granulation with a particle size of 0.9 to 20 mm. Rubber granulate plates have good sound absorption and insulation properties [
28]. Moreover, they are often used for the installation of artificial surfaces for sports grounds, tracks, and arenas [
29]. This is the most common way of tire waste recovery, corresponding with the waste hierarchy and the principles of circular economy. Rubber powder (with a size not exceeding 0.8 mm) is obtained through the cryogenic processing of tires used in the manufacturing of rubber plates, tires, and anti-vibration items [
30].
The aim of the work is to create an innovative, effectively sound-absorbing structure with changeable sound insulation, which would comply with the principles of circular economy and be used to reduce the sound level produced by equipment that requires high air permeability (heat pumps, generators, fans, etc.). Waste tire rubber is to be used for the design of the structure.
2. Materials and Methods
All experimental studies were conducted in accordance with standard laboratory measurement methods. Environmental factors, including temperature, humidity, pressure, and other ambient conditions, were controlled and considered during measurements, thereby minimizing their influence on the results. Additionally, laboratory equipment underwent regular calibration to maintain accuracy, ensuring reliable and consistent measurements. To minimize variability between samples, meticulous attention was given to sample preparation. Factors such as sample size, shape, and surface were precisely checked and selected to ensure measurement accuracy.
Rubber granulate plates connected to perforated plates printed with a 3D printer were examined with an interferometer, thus reproducing the elements used in the structure under analysis. Rubber granule plates were made from rubber granules by separating the rubber from the tire structure and shredding it, and later gluing the granules with polyurethane glue. The ratio of rubber granules and the binder is 30/70%. Nine different types of rubber granules were used to produce the plates. Nine rubber granulate plates of different fractions, thickness, and density were examined using an interferometer. The rubber granulate plate parameters are presented in
Table 2, and the samples are shown in
Figure 1.
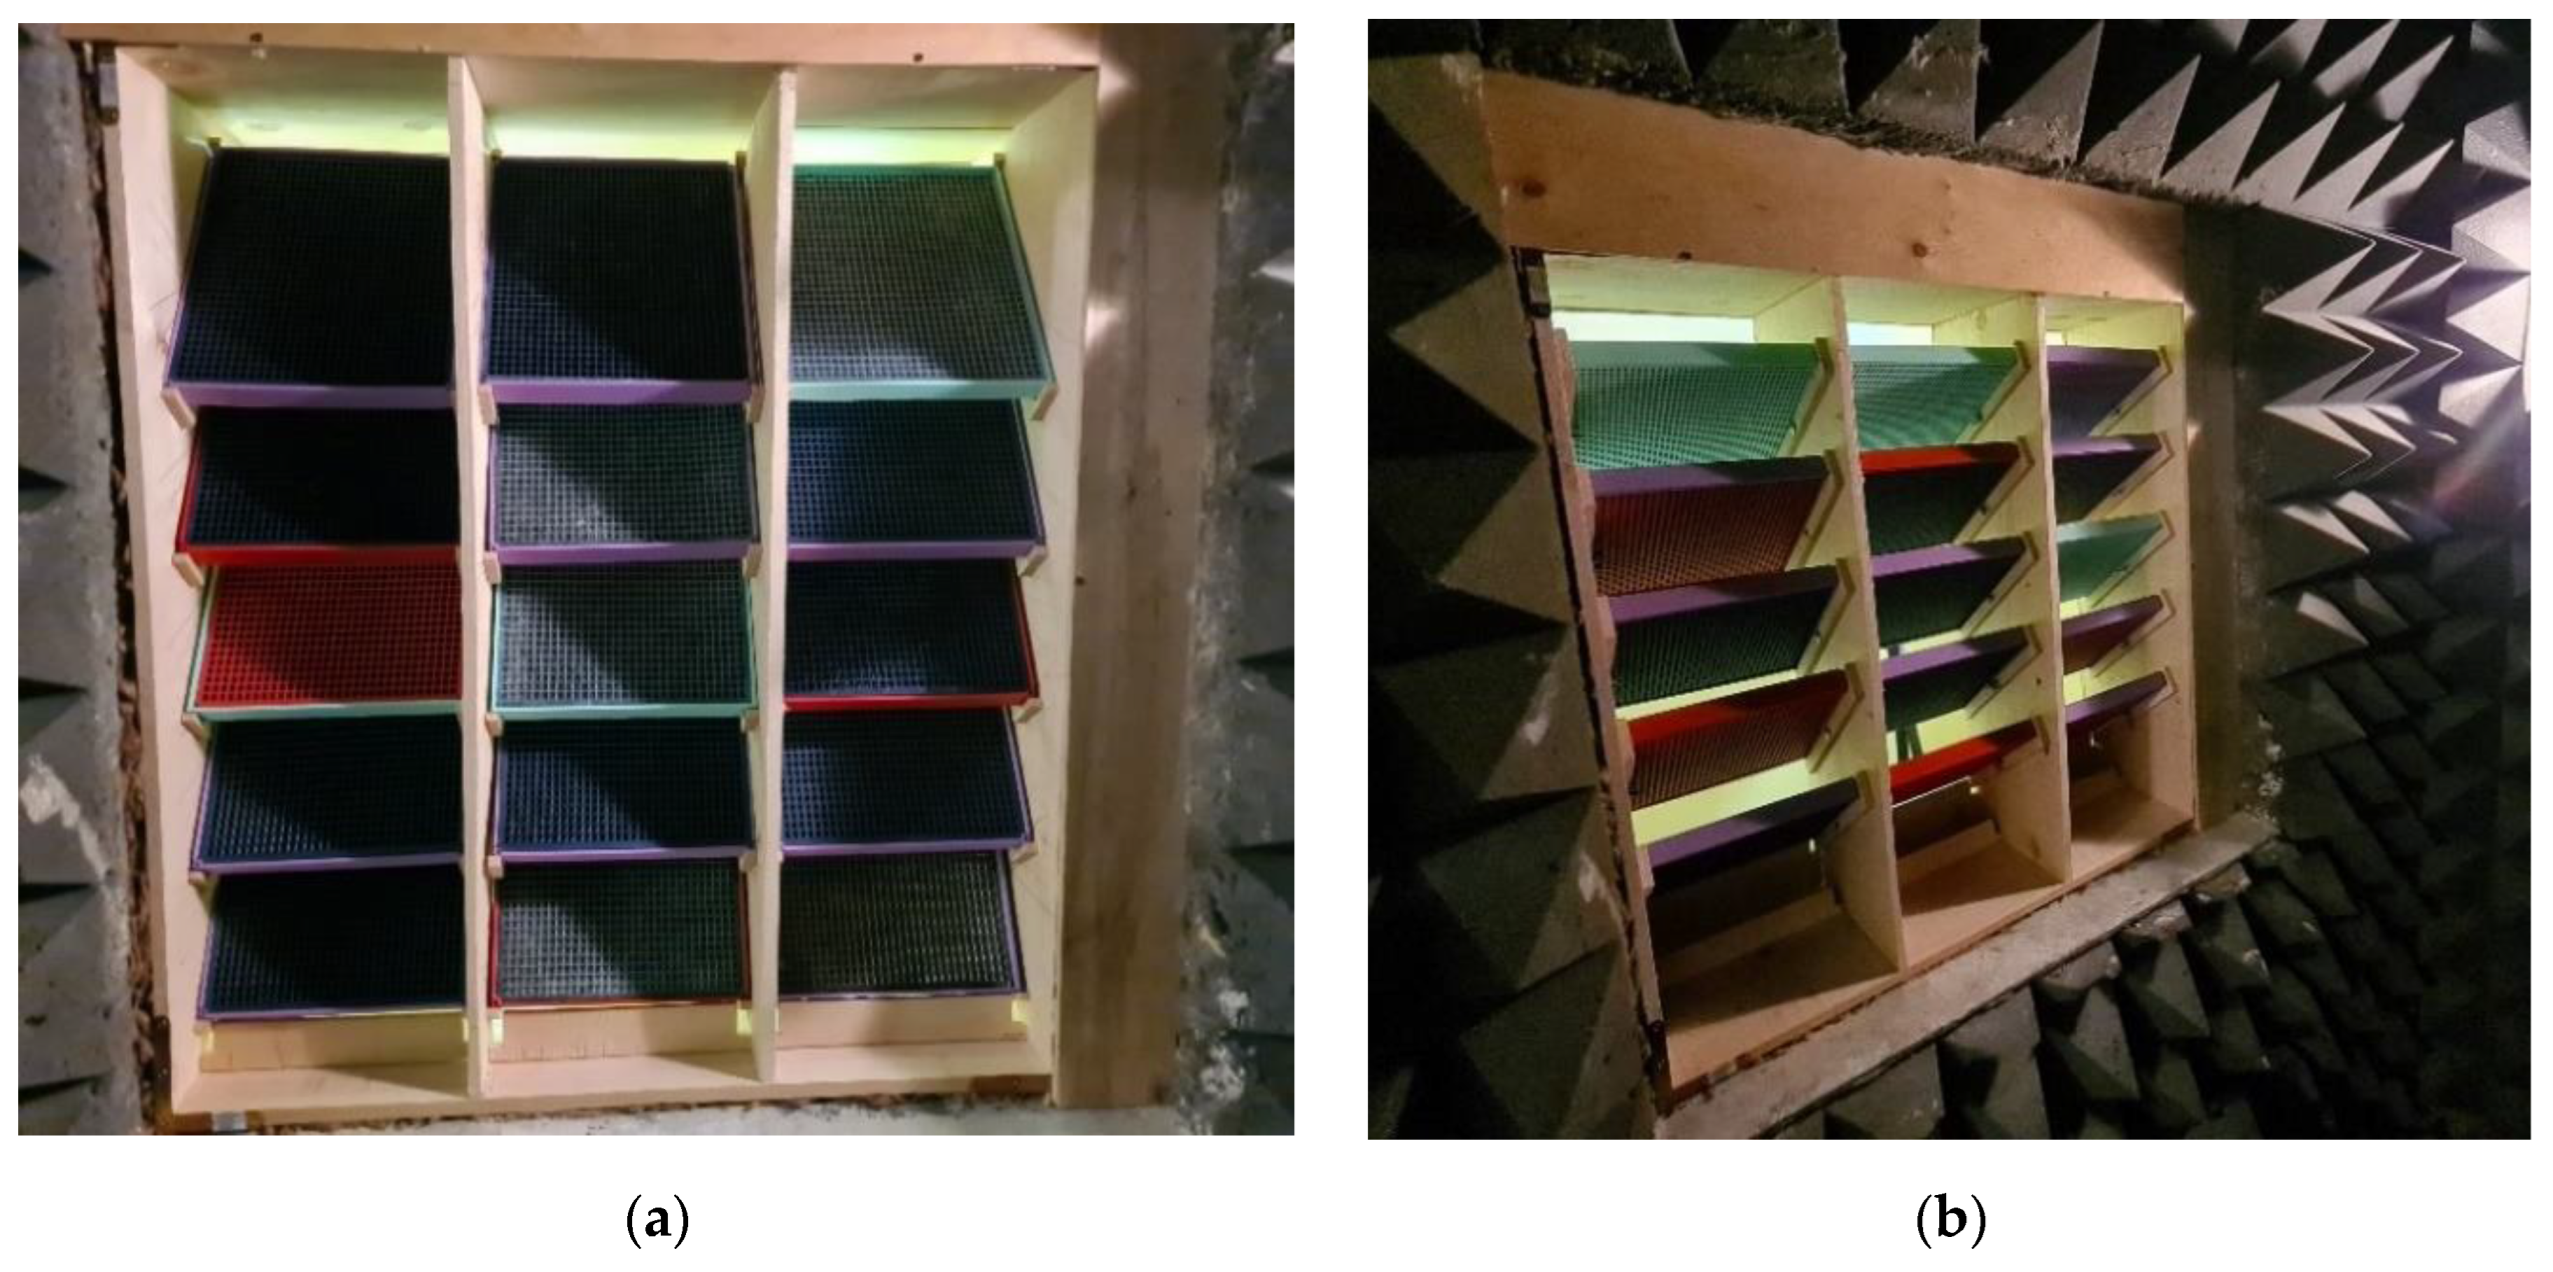
After the interferometer measurements of sound absorption and sound transmission loss in the material, the rubber granulate plates with the best performance were selected and used as the sound absorbing material in the test structure (
Figure 2).
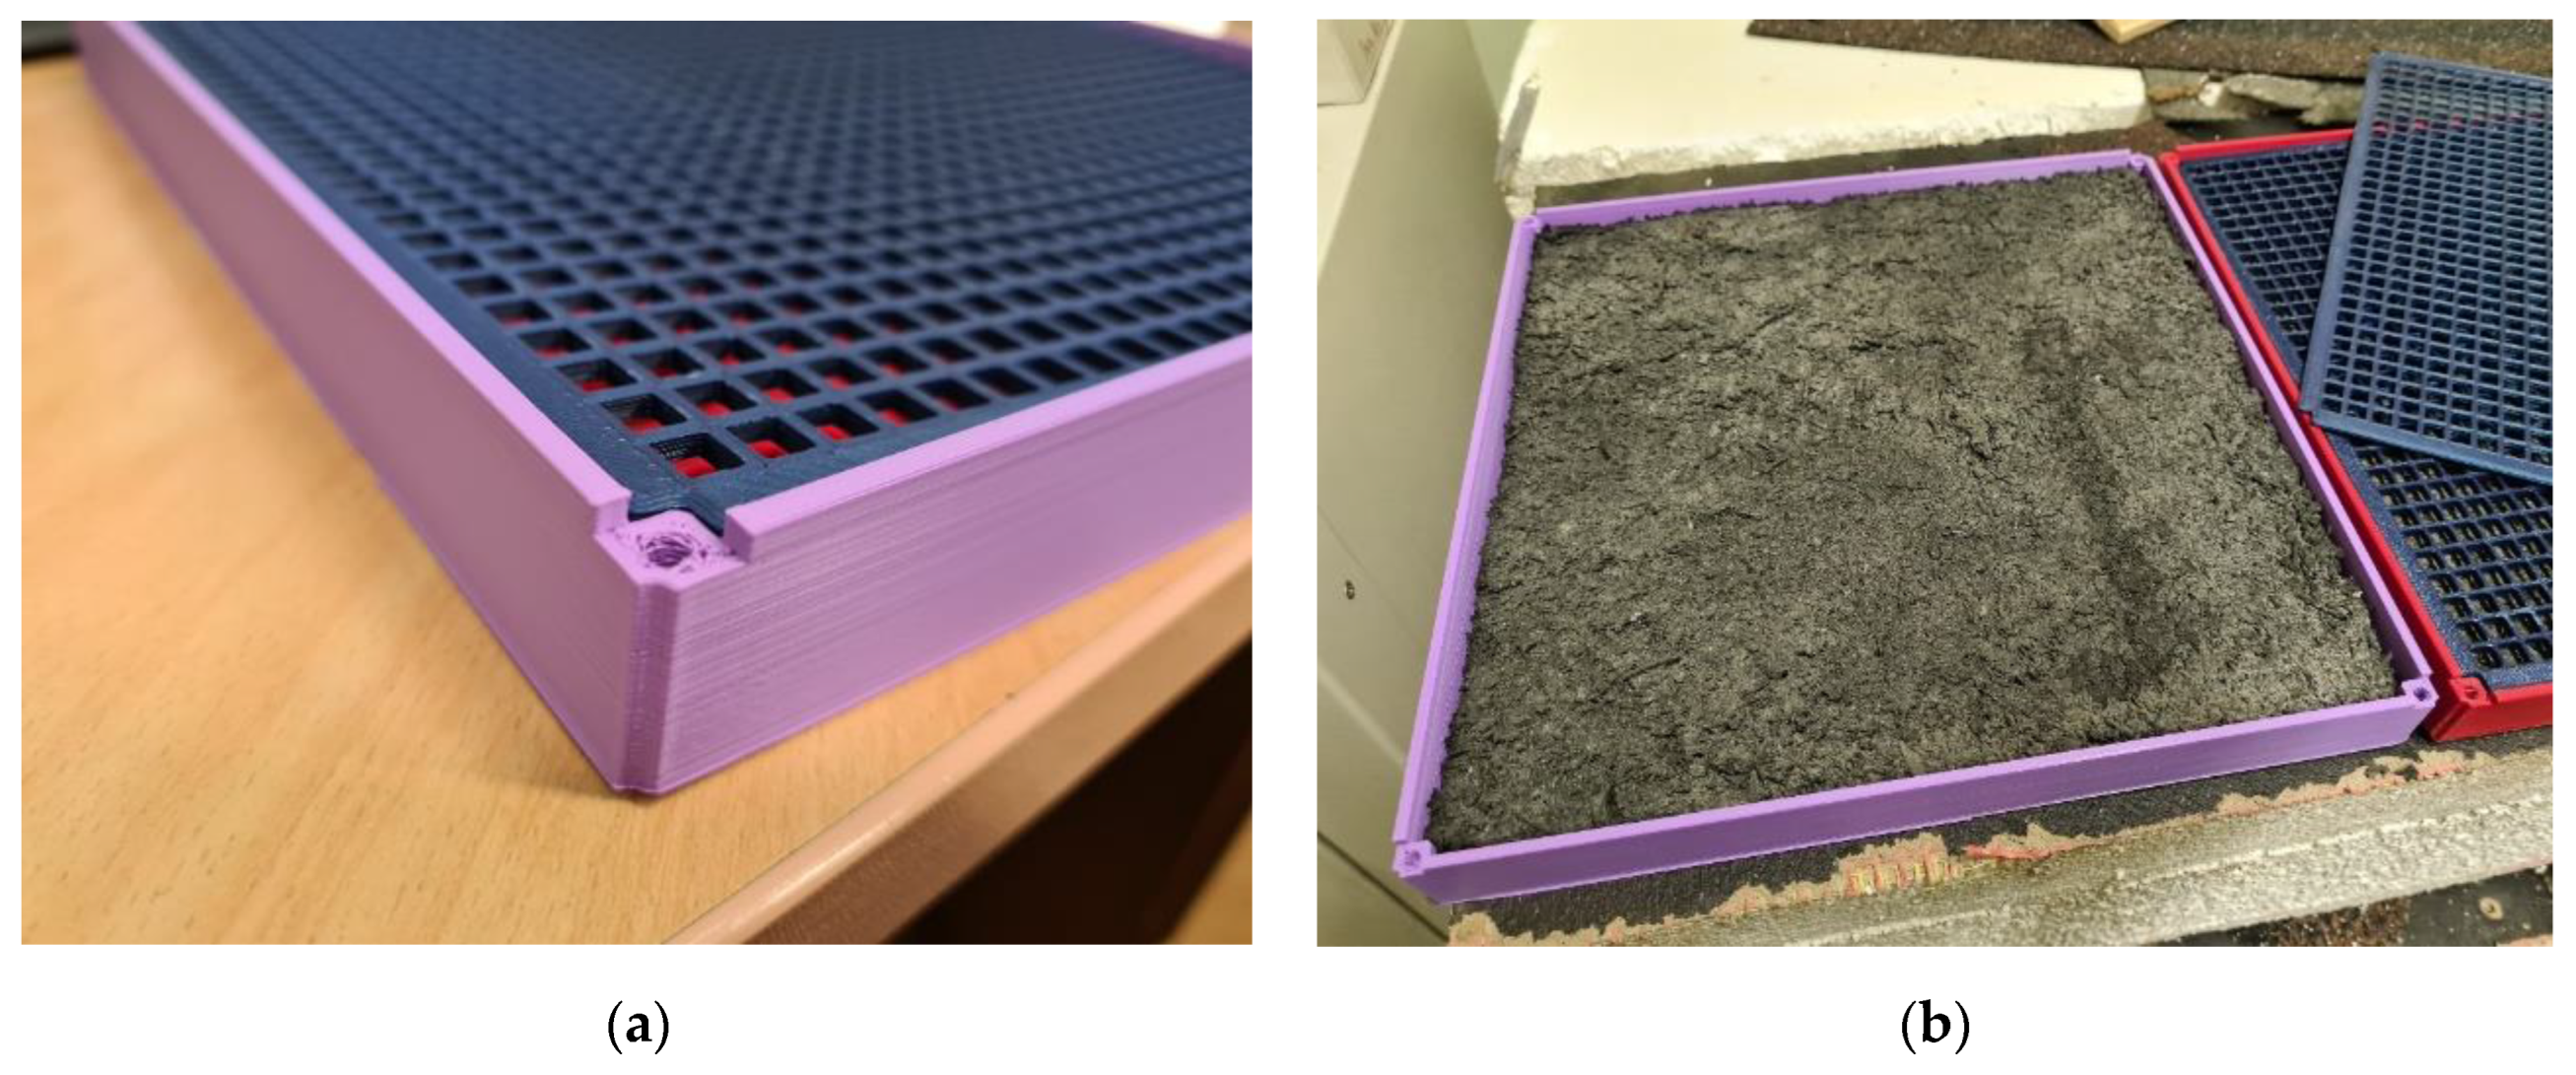
The test structure consists of a wooden framework with 15 or 27 identical-size, 3D-printed plastic frames filled with recycled rubber composite and attached to perforated plates on both sides. The wooden framework consists of three sections, each of which can accommodate 5 or 9 3D-printed perforated cartridges. Framework size: length 0.9 m, width 0.9 m, thickness 0.3 m. The image of 3D-printed cartridges is shown in
Figure 3.
The length and width of the plastic cartridges are both 265 mm and the thickness is 30 mm. The plate is perforated with 4 × 4 mm square holes with a gap of 2 mm between them, and the plate thickness is 2 mm. The recycled tire rubber plates of different thickness are rigidly inserted into the 3D-printed plate and covered with the perforated plates from the top and bottom.
2.1. Methods for Identifying Sound Absorption and Sound Transmission Loss in a Material by Using an Impedance Tube
To determine the acoustic parameters of the material, the sound absorption and sound transmission loss in the material are under analysis. The ratio of the sound energy absorbed by a material α represents sound absorption. Different materials absorb and reflect sound waves differently. The sound absorption of the material depends on the thickness, density, and porosity of the test sample.
Understanding the acoustic properties of materials is greatly enhanced by measurements of the sound absorption coefficient. Sound absorption refers to the process in which a material absorbs sound energy rather than reflecting it. The sound absorption coefficient quantifies this process, representing the ratio of absorbed sound energy to incident sound energy. A commonly used method to determine these coefficients is through the impedance tube [
31].
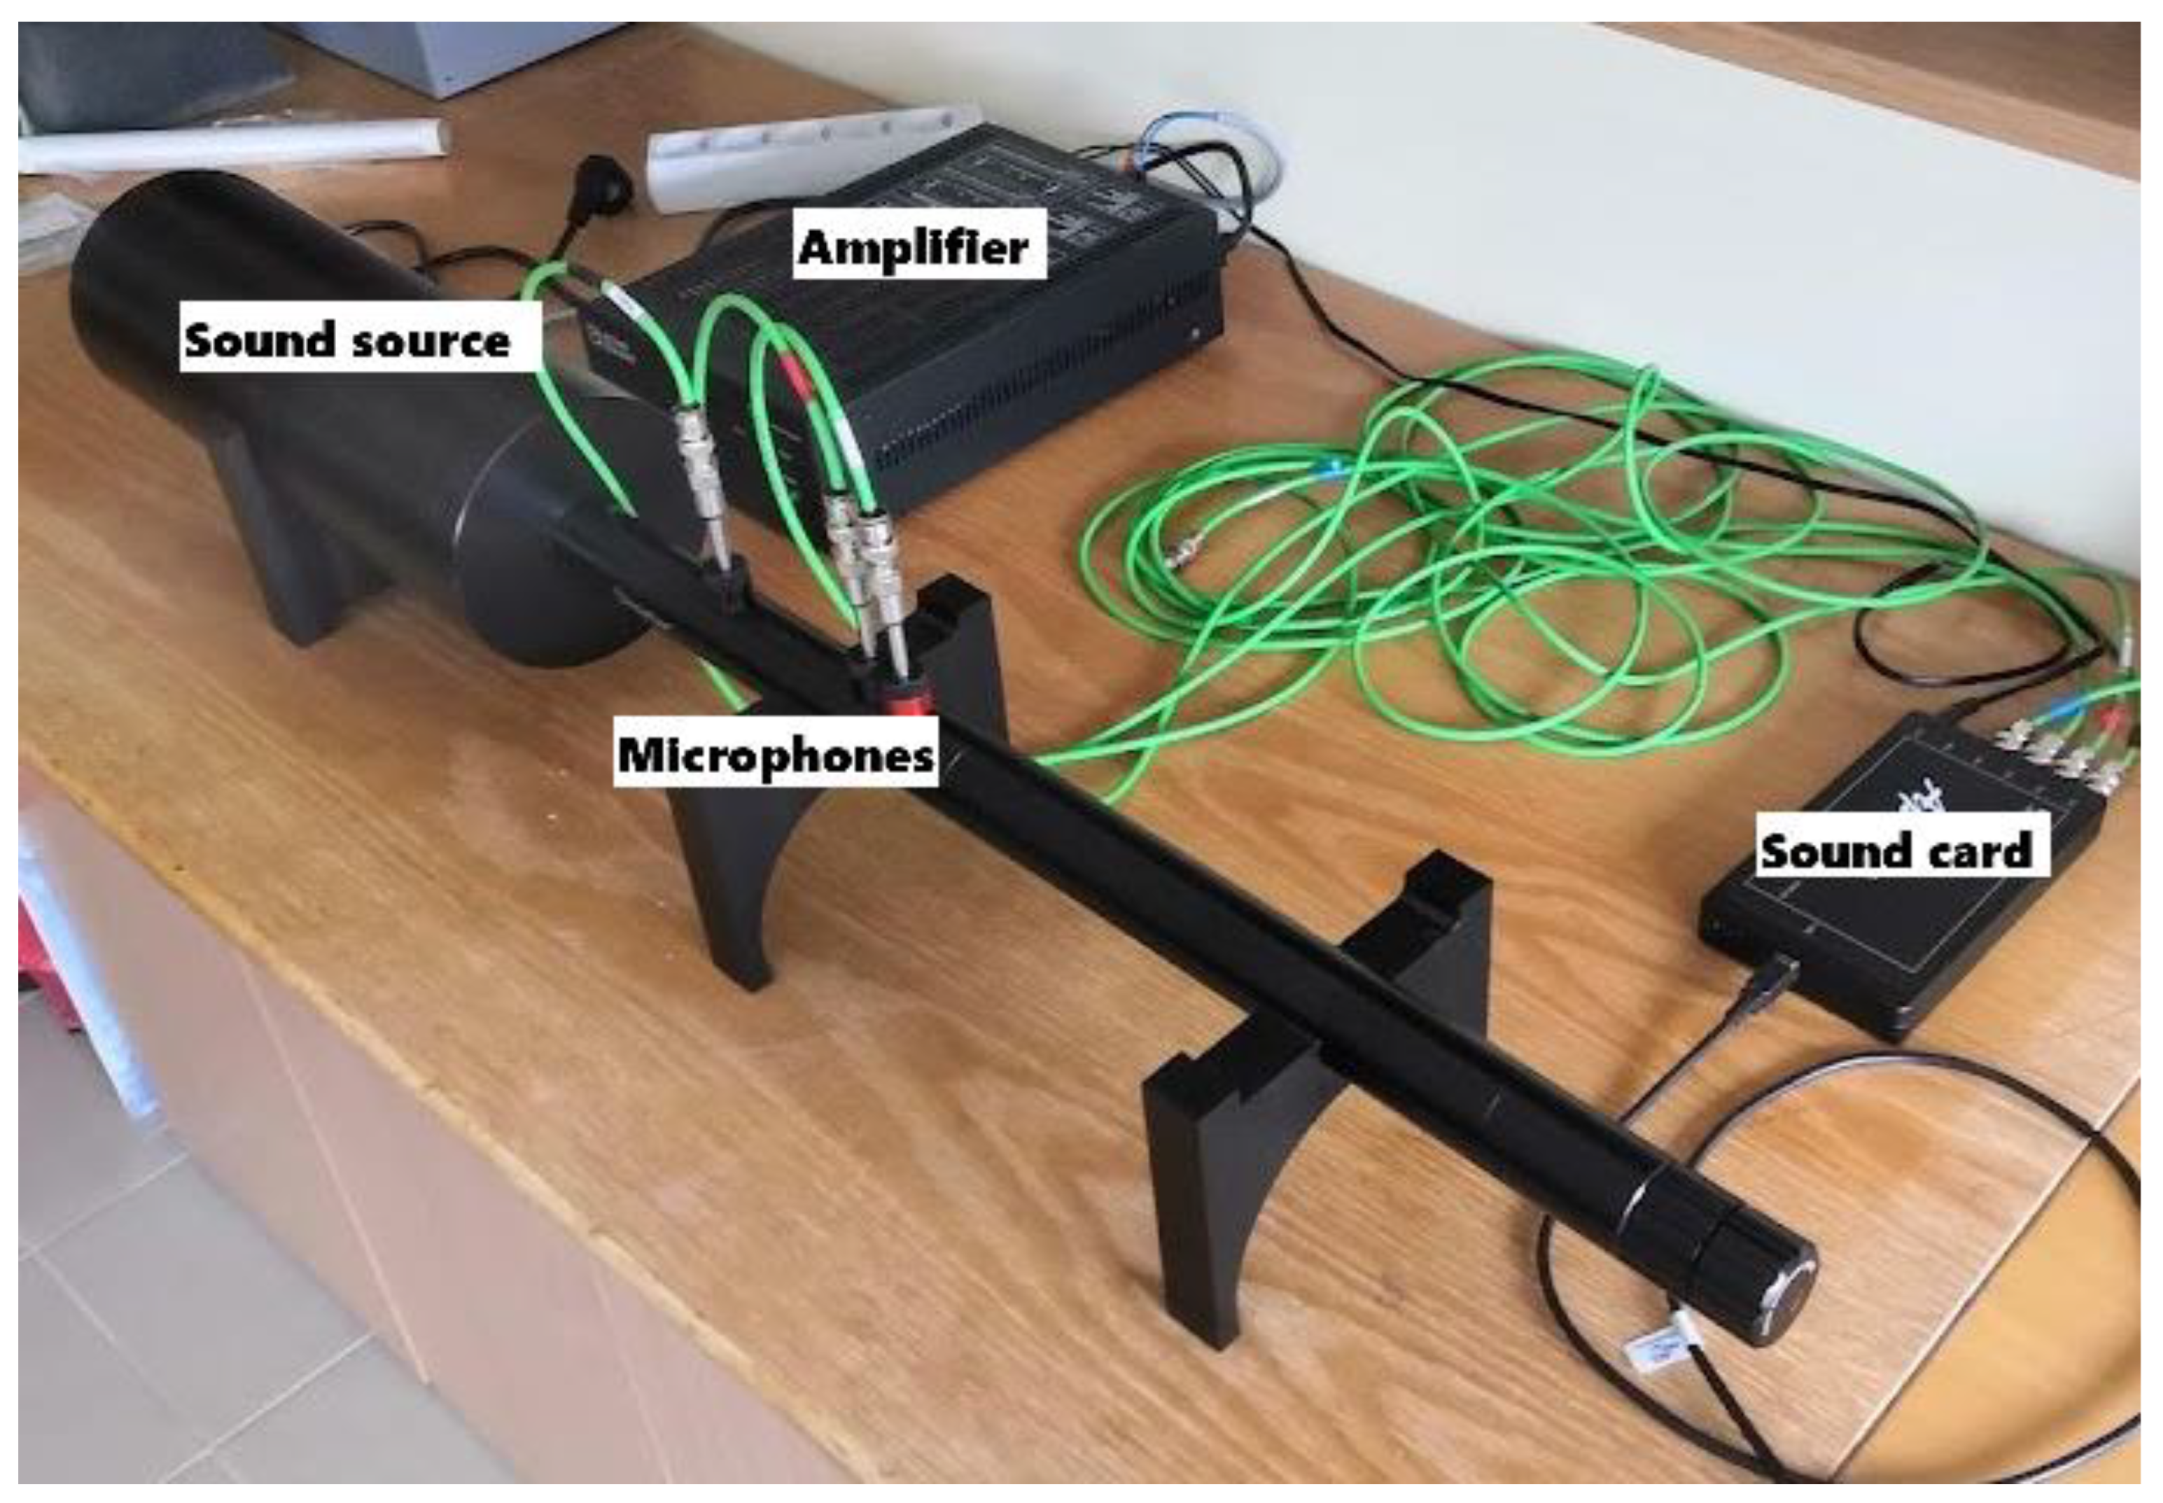
This is a device designed to measure the sound absorption of a material and sound reflection in a material. The impedance tube consists of a thin hermetically sealed frame, a sound source, microphones, and space for installing the test sample (
Figure 4). This method for determining sound absorption by using an interferometer relies heavily on the principle that only flat and reflected waves are present in parallel to the axis of the interferometer tube on the control stand. Thus, other forms of sound waves should be avoided. The direct wave and the reflected wave, traveling in opposite directions within the tube, combine vectorially. They synchronize in some areas and oppose in others, producing a stationary wave. The sample inside the tube affects the absorption of some of the incoming energy. The sample’s impedance changes how sound reflects, allowing the calculation of the absorption coefficient at normal incidence by measuring the resulting standing wave [
32].
The impedance tube indeed presents several limitations. While it typically operates within a specific frequency range, this range, although often broad, might not encompass all relevant frequencies, especially for materials exhibiting significant frequency-dependent absorption properties. In our case, the impedance tube’s measurement range was 160 to 5000 Hz. Moreover, the impedance tube measures absorption coefficients under normal incidence, which means that it might not accurately depict the absorption behavior of materials under oblique angles of incidence. Additionally, the accuracy of measurements can be influenced by the thickness of the tested material. For thin materials, the tube’s measurements might not fully capture their absorption properties, while for very thick materials, limitations in the tube’s length and the wavelengths of incident waves might hinder the full characterization of absorption.
Sound transmission loss in a material (DTL) is an important acoustic property, showing how much sound is lost as waves propagate through a given substance. The density, thickness, and air resistance of the test samples have the greatest impact on sound transmission loss. A commonly used method to determine sound transmission loss is through the impedance tube and it is called the four-microphone method.
There are also several limitations for transmission loss measurements in the impedance tube. First of all, when using small samples for measurements, boundary conditions exert a greater influence on the results compared to larger ones. Additionally, the circular cross-section of the impedance tube poses challenges in measurement. Cutting a sample with the same diameter as the tube proves to be quite challenging. Smaller samples may result in air leaks, while larger ones may experience edge compressions that alter material properties [
33]. For these reasons, special attention must be paid to the precise and accurate preparation of specimens and their insertion into the impedance tube.
2.1.1. The Method of Measuring Sound Absorption by Using an Interferometer
The impedance tube consists of two sections: one containing the sound source and microphones, and the other designed for the sample. The part of the device housing the sample can be unscrewed, allowing for the insertion of the sample into the tube. Once the sample is in place, the rigid backing is pressed against it and secured by screwing it on. Finally, both sections of the tube are connected. The material to be measured is placed firmly in the sample holder in the interferometer. A built-in speaker is at the other end of the tube which spreads white noise. Measurements are conducted using software. Schematic representation of the impedance tube setup for conducting experimental measurements of sound absorption is shown in
Figure 5.
Three microphones labelled as 1, 2, and 3 are positioned at specific distances from each other. The distance between microphone No. 1 and No. 2, indicated as
X12, is set at 100 mm. Similarly, the distance between microphones No. 2 and No. 3, identified as
X23, measures 20 mm. The distance between microphone No. 3 and the sample under test, specified as
X3S, is established at 60 mm. The tube’s diameter is 30 mm. After measuring the sound pressure, the pressure is determined at each frequency. The research was carried out in accordance with ISO 10534-2:1998 standard [
34]. The transmission function between the microphones is calculated according to Formula (1):
Next, the transmission function of the incident wave is determined according to Formulas (2) and (3).
Following the calculations made according to Formulas (1)–(3), the reflection ratio is calculated:
The absorption ratio of a material is the inverse of the reflection ratio. Therefore, the absorption ratio of a material for flat waves is determined according to the following formula:
Three samples of each rubber granulate plate are examined. The results are presented in the 1/3 octave frequency range, ranging from 200 to 5000 Hz.
2.1.2. Methods for Identifying Sound Transmission Loss in a Material by Using an Interferometer
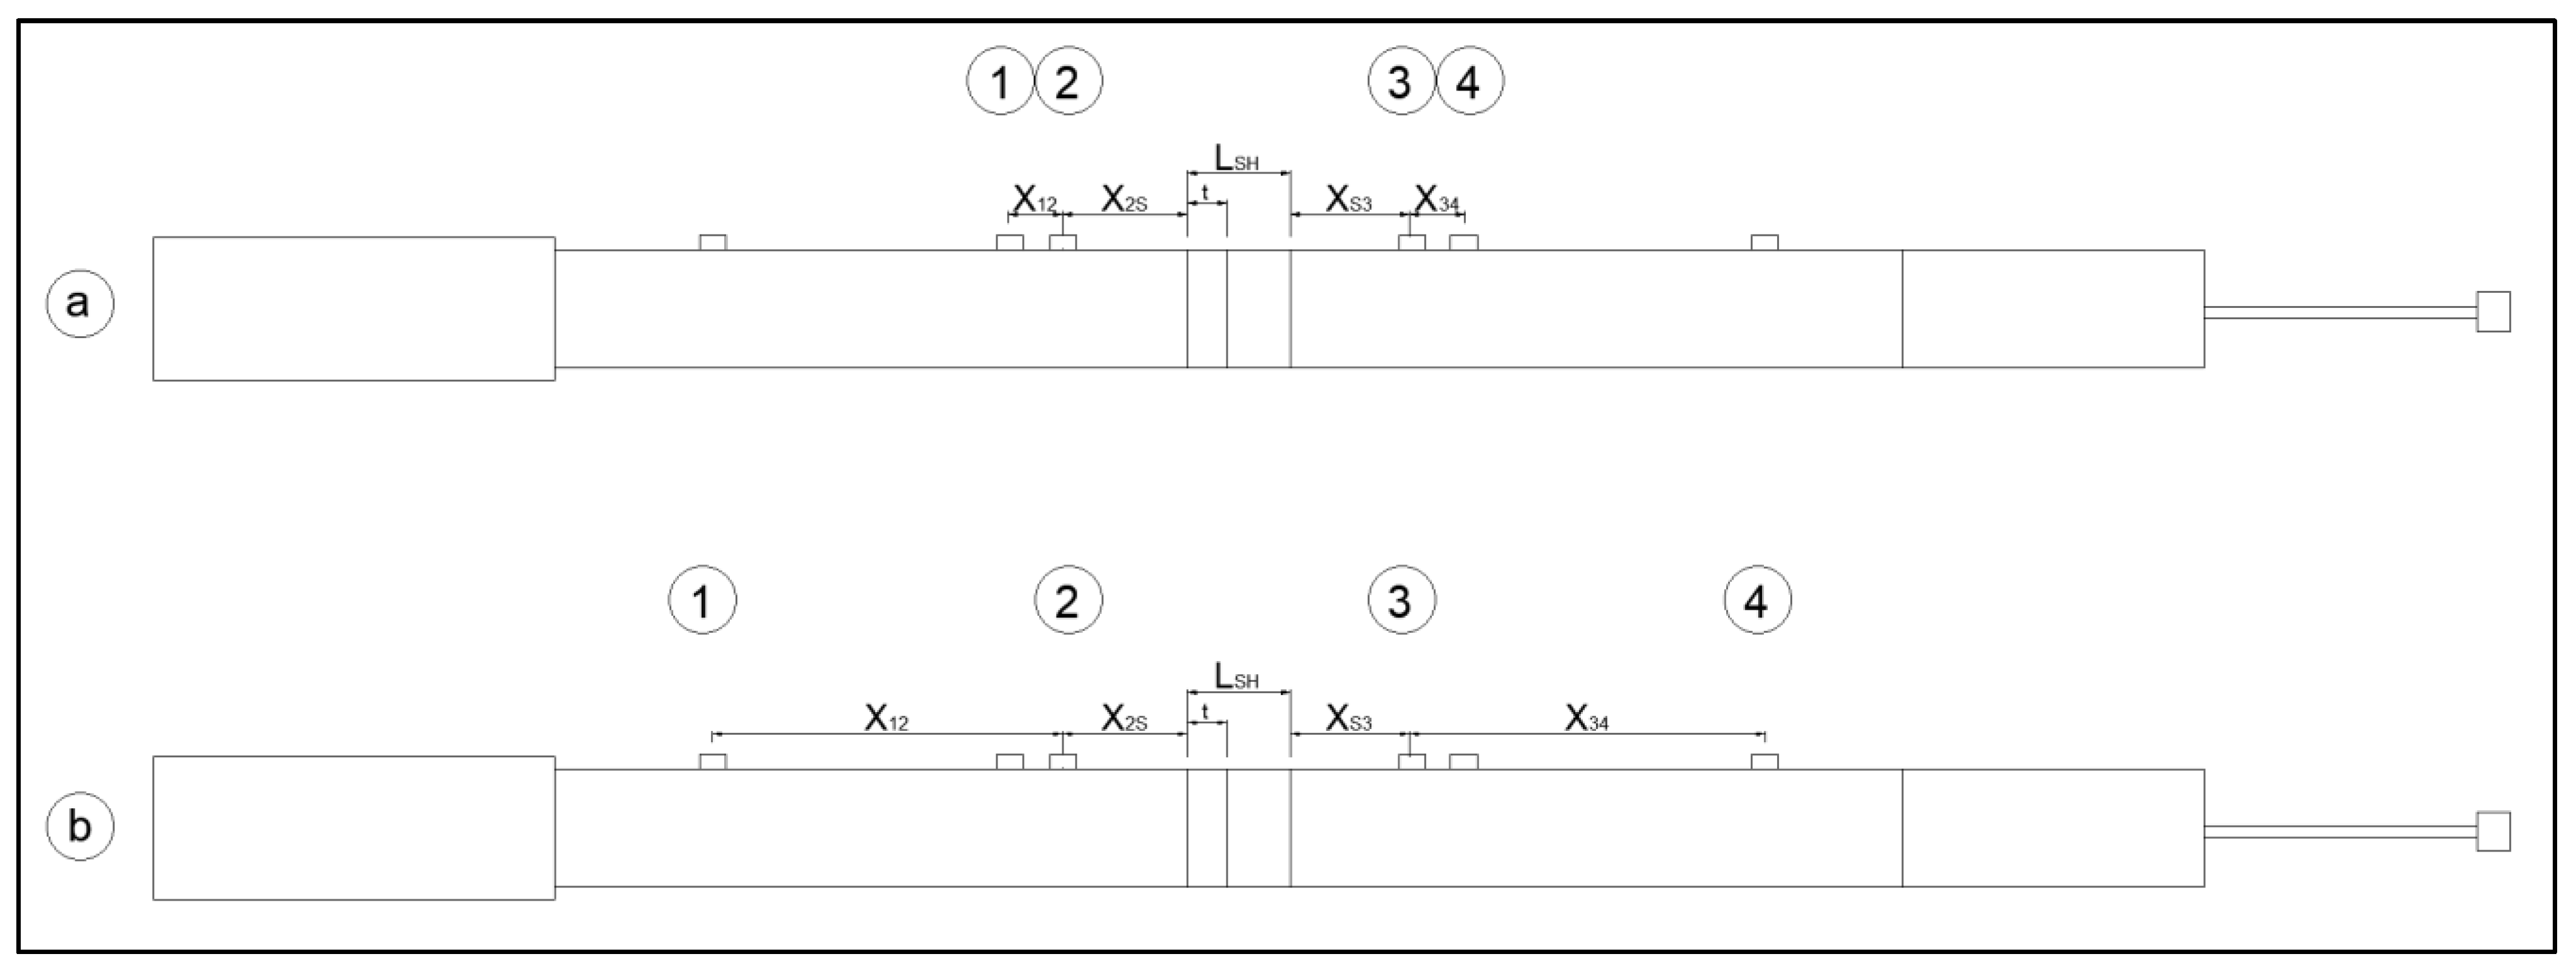
The interferometer-based method for the measurements of the sound transmission loss is commonly referred to as the four-microphone method, with two microphones mounted in front of the test sample and the other two microphones behind it. A 4-microphone and single-load system is used to research the sound transmission loss; the corresponding diagram is shown in
Figure 6. Experimental measurements were made in accordance with ASTM E2611-19 [
35].
Setup for measuring the frequency range 1000–5000 Hz: four microphones labeled 1, 2, 3, and 4 are positioned accordingly. The distance between microphone No. 1 and No. 2, denoted as X12, is set at 20 mm. The distance between microphone No. 2 and the sample, indicated as X2S, is 60 mm. Likewise, the distance between microphone No. 3 and the sample, labeled as X3S, measures 40 mm. Finally, the distance between microphone No. 3 and No. 4, identified as X34, is 20 mm. The setup for measuring the frequency range 160–1000 Hz is similar to the previous setup. The distance between microphone No. 1 and No. 2, denoted as X12, is extended to 120 mm. The distance between microphone No. 2 and the sample, designated as X2S, remains at 60 mm. Similarly, the distance between microphone No. 3 and the sample, labeled as X3S, is maintained at 40 mm. The distance between microphone No. 3 and No. 4, identified as X34, is adjusted to 120 mm.
To begin the test, the speed of sound (
C) and air density (
ρ) must be calculated. The speed of sound is calculated in the following manner:
Next, the air density follows (
ρ):
Knowing the transmission function between the microphones as well as the distances between the microphones and the sample, the returning and outgoing waves are calculated:
Then, the pressure and particle velocity on both sides of the sample (
X = 0 and
X =
d) are calculated:
The formed matrix should satisfy these conditions: T11 = T22 and T11T22 − T12T21 = 1.
The sound transmission ratio (
τ) is calculated in this way:
Next, the sound transmission loss (
TL) is calculated:
The sound transmission loss adequately demonstrates the ability of a material to isolate sound, specifying the characteristics of the material in terms of its porosity, reflectivity and sound absorption. Three samples of each rubber granulate plate are examined. The results are presented in the 1/3 octave frequency range, ranging from 160 to 5000 Hz.
2.2. The Method of Determining the Acoustic Parameters of the Structure in the Sound-Absorbing Chamber
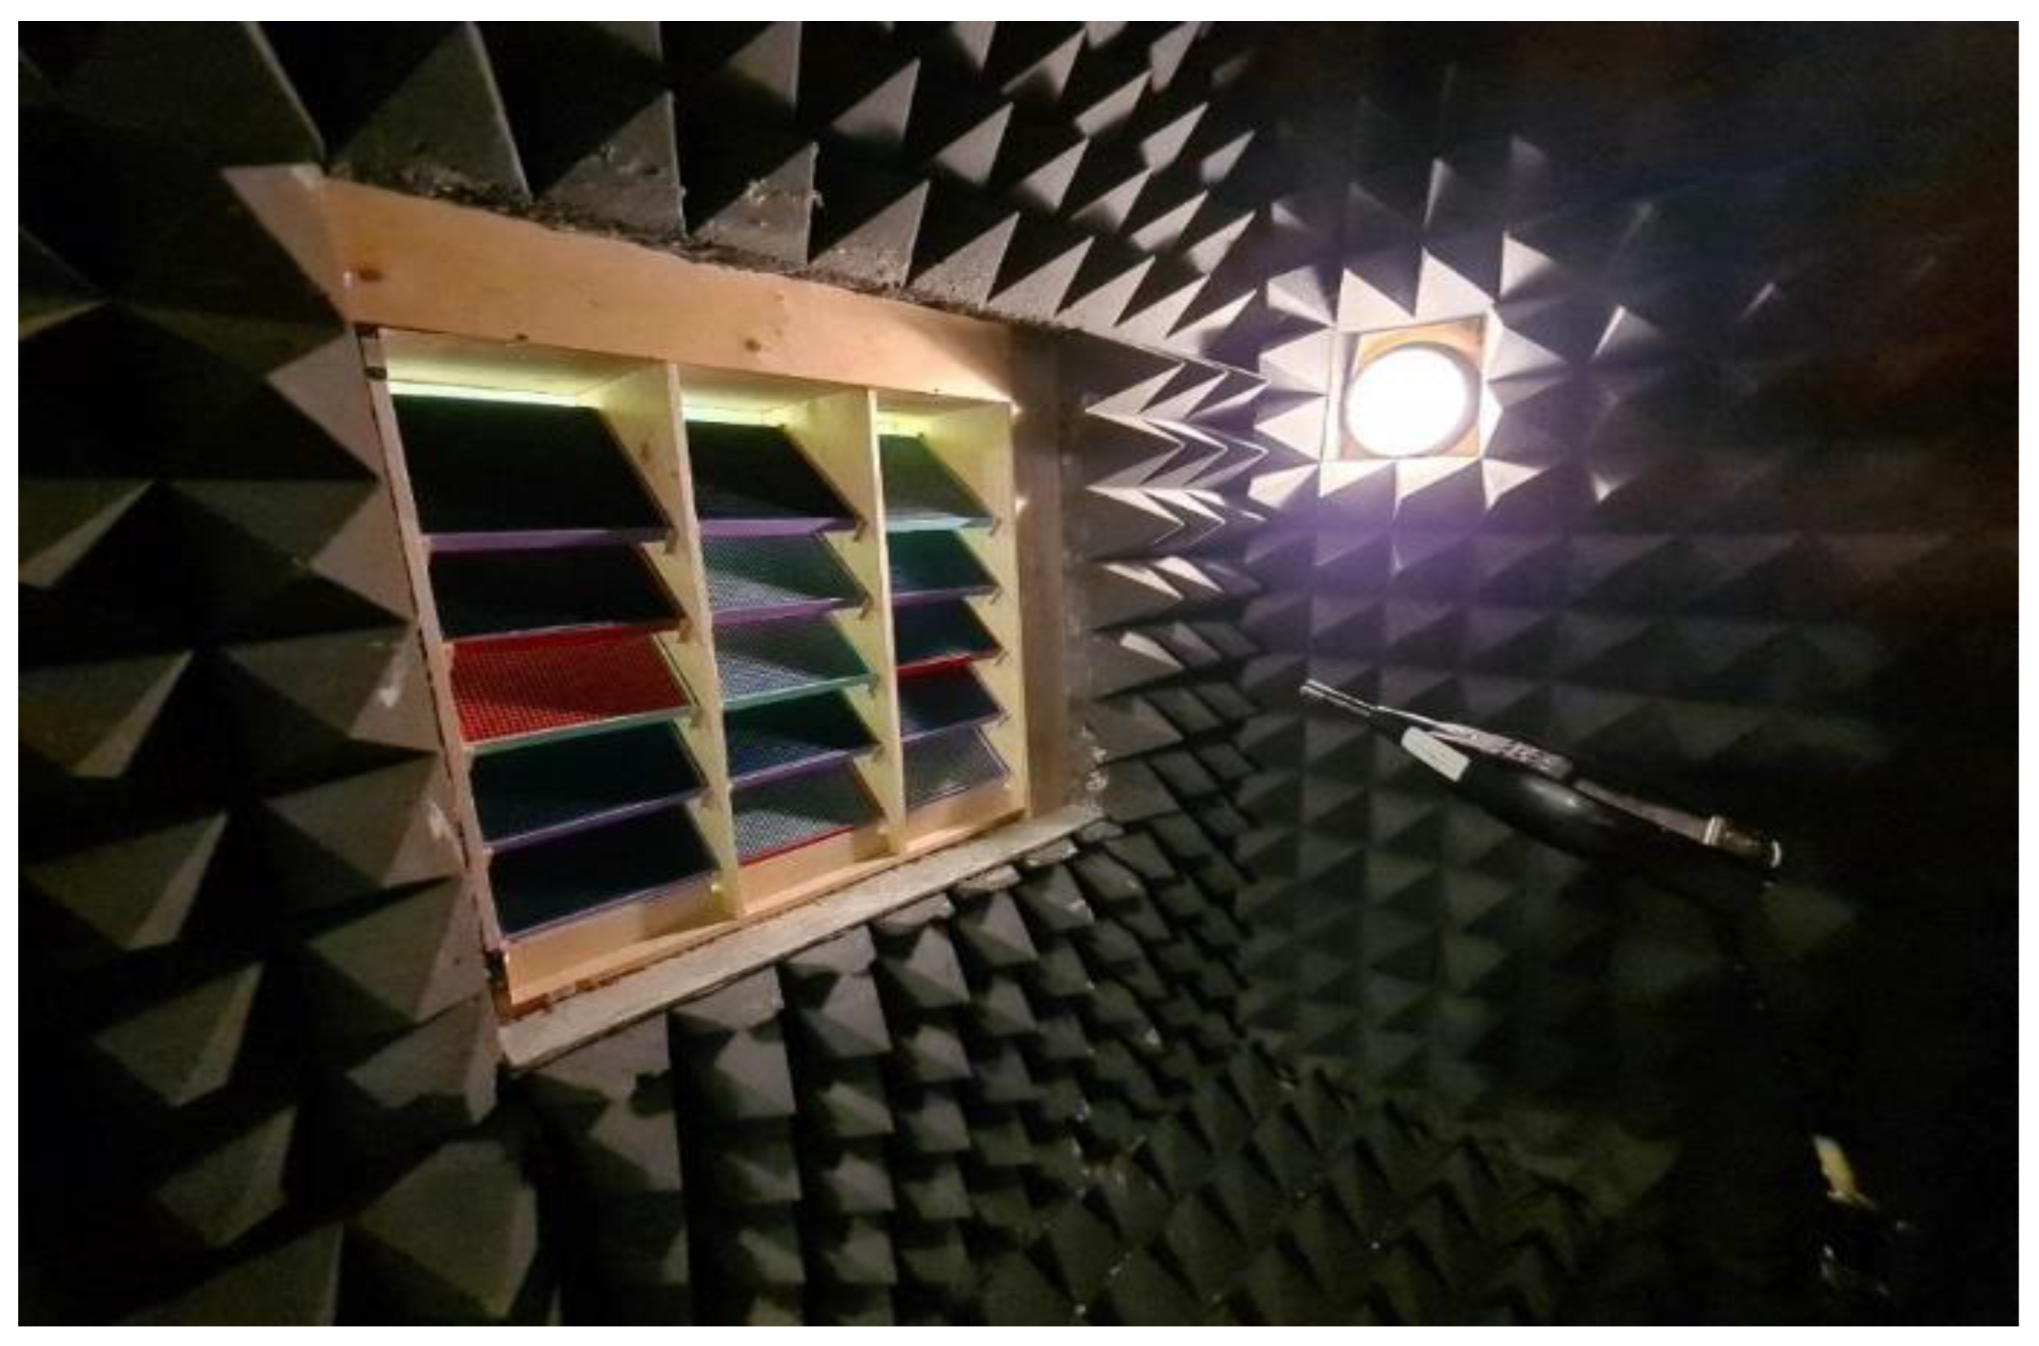
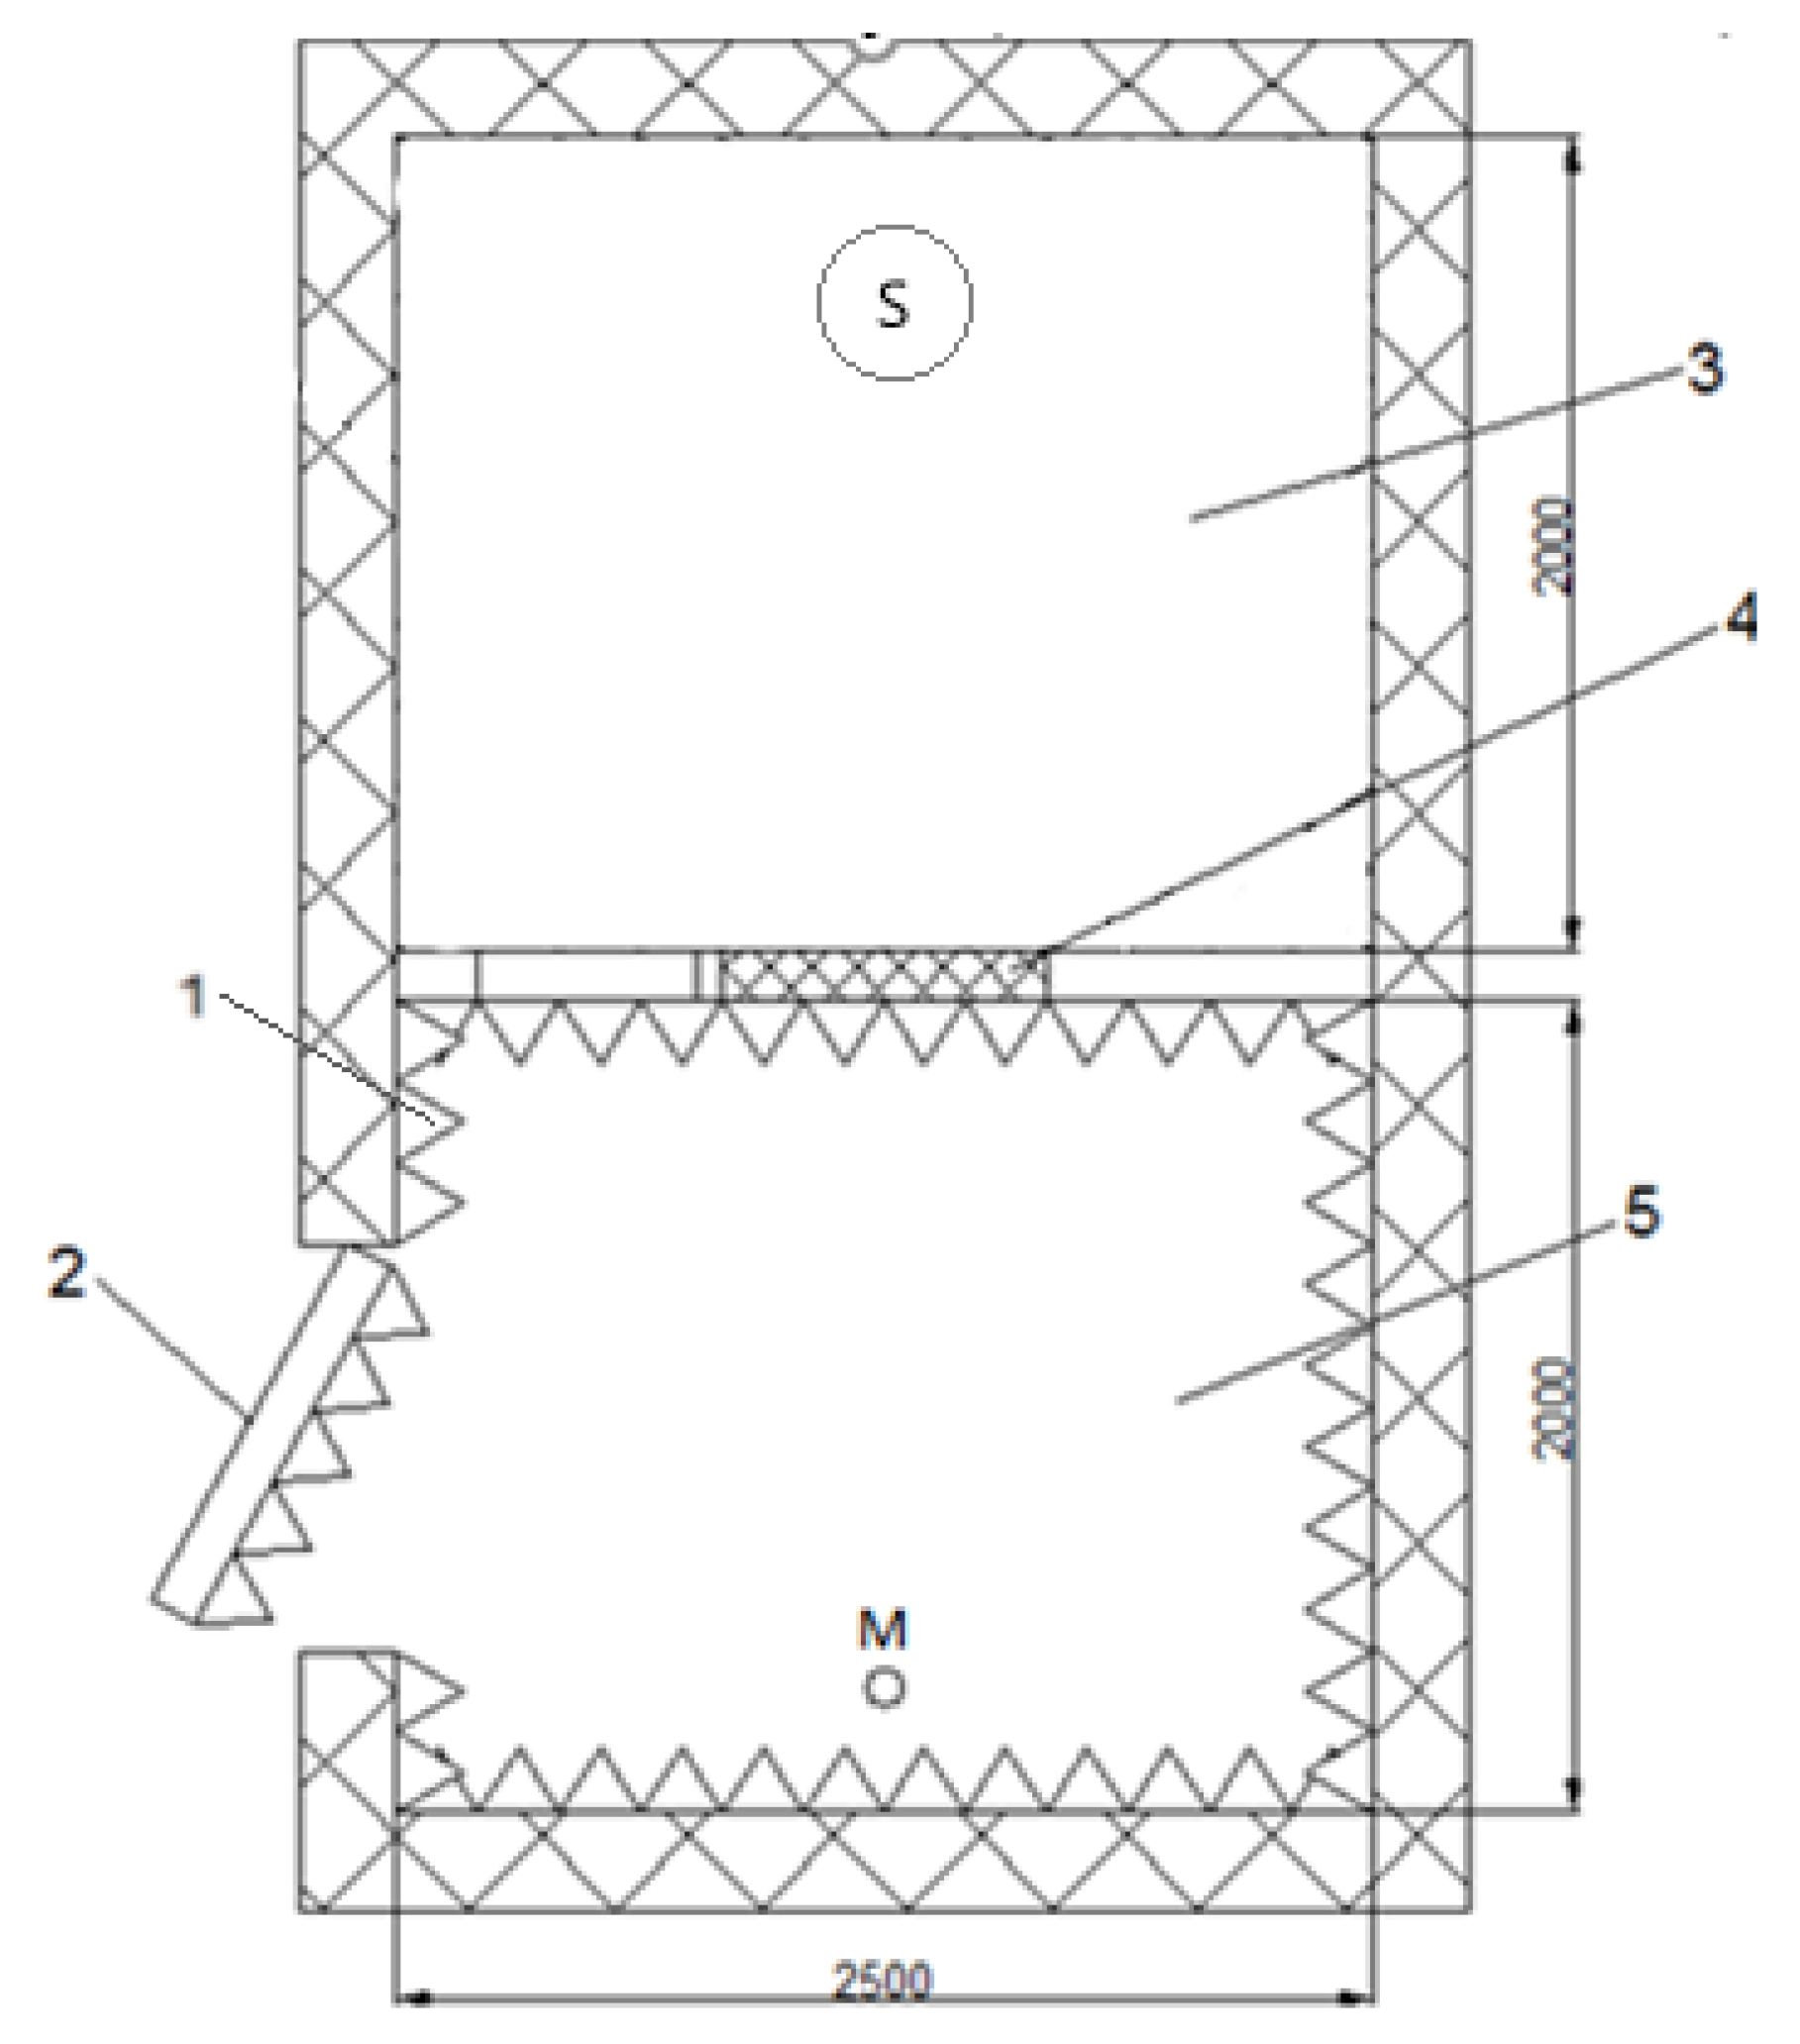
The structure was tested in a semi-anechoic sound-absorbing chamber to determine the dependence of the efficiency of the designed structure on the size, thickness, porosity, and angle of inclination of the rubber granulate fraction. The sound-absorbing chamber (
Figure 7) is designed to determine the sound insulation and absorption of different structures and materials. The tests in the chamber are performed in accordance with the standard ISO 10140-2:2021 “Laboratory measurement of sound insulation of building elements—Part 2: Measurement of airborne sound insulation” [
36], using high-precision, calibrated equipment of class 1.
The wall separating the chamber rooms is equipped with a 1 m2 opening in which a 1.0 m × 1.0 m sample is rigidly installed.
In the sound reception room, the microphone is permanently installed, and in the sound transmission room, the omnidirectional speaker creates a constant diffuse sound field; its spectrum is uninterrupted in the selected frequency range. By way of experiment, the sound level is measured using a one-third octave band filter. The measurement duration at each microphone position and in the one-third octave band is at least 60 s.
Measurements are made by turning the plates at different angles directed to and from the noise source (
Figure 8).
The plates are rotated from 0, 15, 30, and 45 degrees, every 15 degrees. The following parameters are measured:
Average sound pressure level without installation of the structure in the provided opening;
Average sound pressure level in the sound reception room after the installation of the test structure;
Equivalent reduction in sound pressure level across the frequency band.
First, during the experiment, the sound level was measured without installing the test structure. Then, the structure was installed and the sound pressure level was measured. The result of the sound pressure level after the installation of the structure was subtracted from the result obtained by measuring the sound pressure level prior to the installation of the structure. Thus, graphs of the sound pressure level decrease in the whole frequency band were obtained. The same principle was used to measure the equivalent sound pressure level, and an equivalent sound level loss was obtained.
Insertion loss was calculated as the difference in the sound pressure level measured before and after the louvers were installed. The result was submitted in graphs of insertion loss. One microphone position was used to measure insource and receiver rooms.
During the experimental measurements, the omnidirectional loudspeaker “Brüel & Kjær The OmniPower Sound Source Type 4292-L” was used as a sound source. White noise was used for sound attenuation testing. Sound insertion loss was measured from 800 Hz to 8000 Hz using 1/3 octave band filtering. During A-weighted insertion loss LAeq measurements, the LAeq of the source was 95.0 dB. The spectrum involved ranged from 160 to 8000 Hz.
During the experiment, structures with different fractions and thickness of recycled rubber granulate filler were tested. During the research, the sound level reduction of each structure was measured with a change of tilting angle of the louvers from 0 to 45 degrees. First, the louvers were filled with 21 mm thick rubber granulate plates in the 2–8 mm fraction. The perforated plates were filled with 30 mm thick rubber granulate (4 to 8 mm fraction of rubber granules) to improve the acoustic properties of the structure. During the research, measurements of the sound level reduction throughout the frequency band and the equivalent sound level loss were made. The distance between the plates in the horizontal position was 86 mm for a structure consisting of 15 cartridges and 65 mm for a structure consisting of 27 cartridges.
3. Results
This section presents the results of an interferometer-based study of the acoustic properties of rubber granulate samples with nine different parameters. After the interferometer measurements of sound absorption and sound transmission loss in the material, two rubber granulate plates with the best performance were selected and used as the sound absorbing material in the test structure. The sound level loss and the equivalent sound level reduction were identified in the sound absorbing chamber by using the test structure. The result is presented with the estimation of the dependence on the tilting angle of the louvers and on the position in relation to the sound source.
3.1. The Results of Measuring Sound Absorption by Using an Interferometer
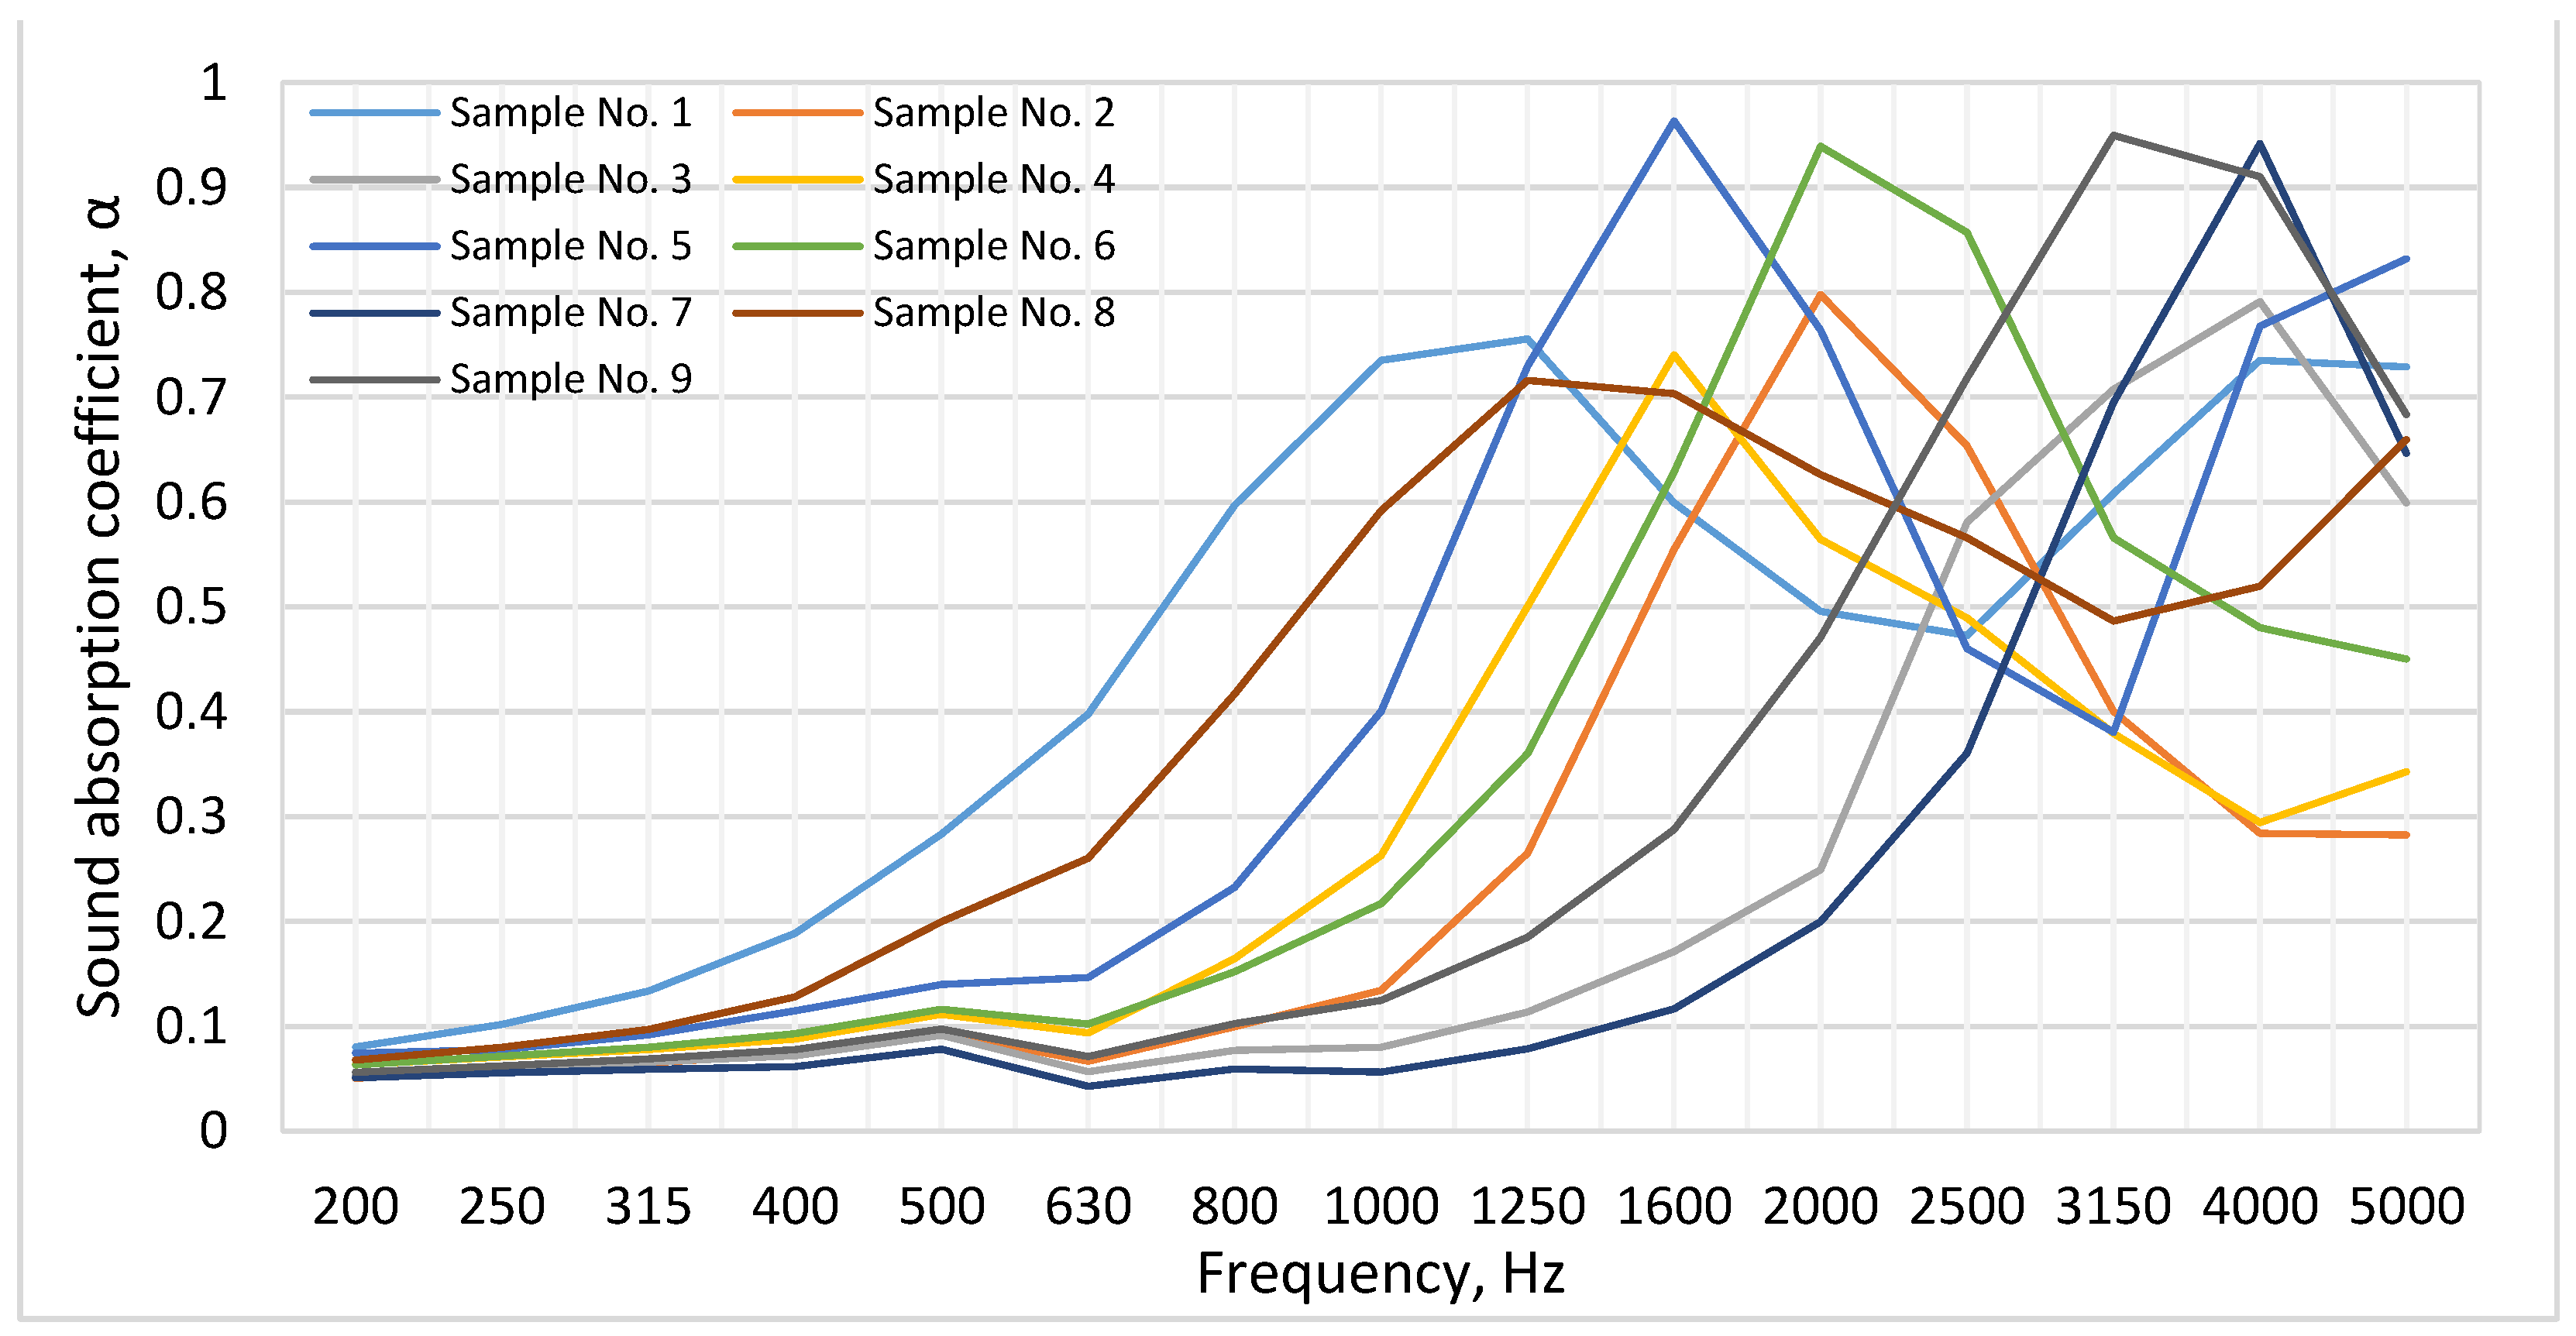
Nine rubber granulate plates with 3D-printed perforated plates of different fractions and thickness were examined with the use of an interferometer, thus reproducing the elements used in the structure under analysis (results shown in
Figure 9).
The investigation of the sample sound absorption with the use of an interferometer proves that the highest efficiency in sound absorption was in the range of medium (500 Hz to 1600 Hz) and high (1600 Hz to 5000 Hz) frequencies. This consistent pattern was observed in all the tested samples. The analysis of the results showed that in the low frequency range (160 Hz to 500 Hz), samples No. 1, No. 5, and No. 8 were the best in sound absorption. At a frequency level of 500 Hz, the sound absorption ratio (α) was 0.28, 0.14, and 0.20, respectively. In the medium frequency range (500 Hz to 1600 Hz), these samples are marked by a good consistent result and at 1000 Hz they reach the values of 0.74, 0.40, and 0.59, respectively. A similar pattern also remains in the high frequency band (from 1600 Hz to 5000 Hz), where at the 5000 Hz limit, the sound absorption ratio (α) is equal to 0.73, 0.82, and 0.66, respectively. To summarize the sound absorption results of the samples tested with the use of an interferometer (in the full frequency band), it can be stated that samples No. 1, No. 5, and No. 8 showed the best sound absorption performance. Similar results were obtained by Iannace G, who analyzed the sound absorption of materials obtained from the shredding of worn tires. Measurements of the absorption coefficient were made using a Kundt tube in the range from 200 Hz to 2.0 kHz. The results show that materials with a rigid skeleton and a thickness of 20 to 30 mm and particle sizes ranging from 2 to 4 mm and 4 to 6 mm exhibit peaks of absorption in the frequency range from 1400 Hz to 2000 Hz [
37]. The thickness (30, 24, and 21 mm), density (0.772, 0.560, and 0.757 g/cm
3), and fraction size (4–8, 4–15, and 2–8 mm, respectively) of rubber tire granulate were found to have the most significant impact on the sound absorption in the samples.
3.2. The Results of Identifying Sound Transmission Loss in a Material by Using an Interferometer
Sound transmission loss in a material is an important acoustic property, showing how much sound is lost as waves propagate through a given substance. The density and thickness of the test samples have the greatest impact on sound loss. In order to perform a full-fledged analysis of the acoustic properties of the samples under investigation, nine rubber granulate plates (rubber specifications are presented in
Table 2) connected to the 3D-printed perforated plates of different fractions and thickness were examined with the use of an interferometer, thus reproducing the elements used in the structure under analysis.
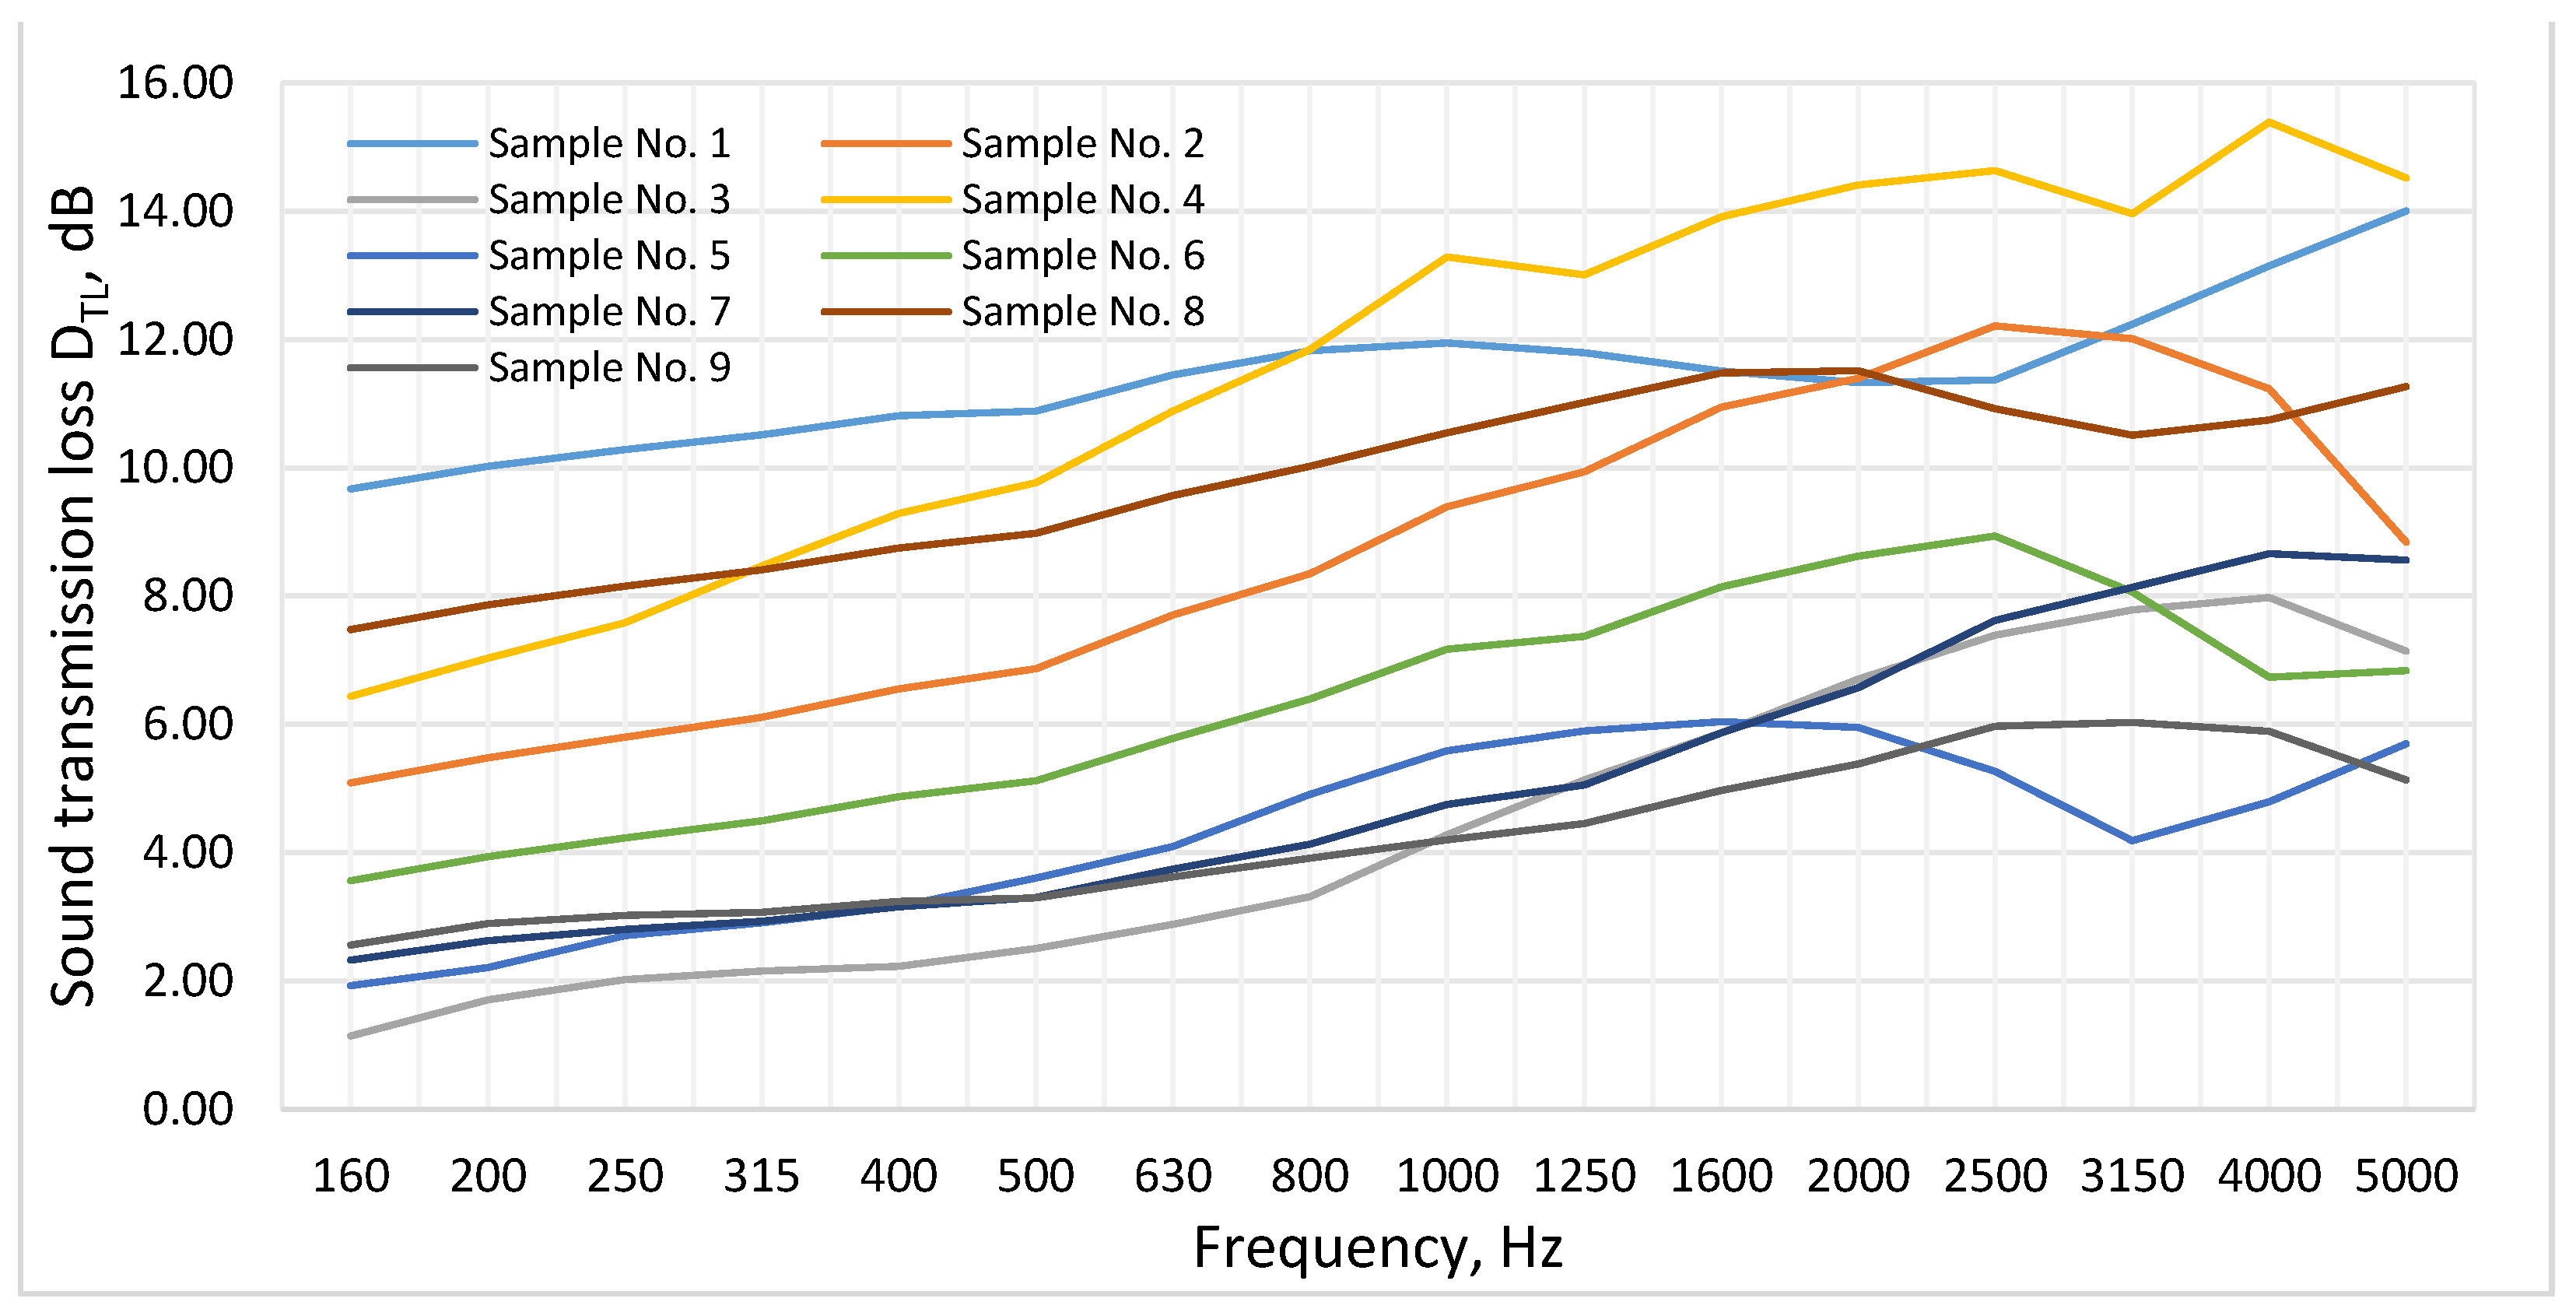
In summary, the obtained results of sound transmission loss show that the highest efficiency in sound loss in the material was achieved in the high frequency range (from 1600 Hz to 5000 Hz). This consistent pattern was observed in all the tested samples. The general graph of the sample sound transmission loss results throughout the frequency band is shown in
Figure 10.
The presented results show that the samples which were the most effective in reducing sound transmission were No. 4, No. 1, and No. 8. Sample No. 1 (160 Hz to 500 Hz) was significant in the low frequency band. The sound transmission loss (DTL) in this sample ranged from 9.67 dB to 10.89 dB. The results of the samples No. 4 and No. 8 at 500 Hz were 9.77 dB and 8.98 dB, respectively. In the medium frequency range (500 Hz to 1600 Hz), these samples were marked with a good consistent result and at 1000 Hz they reached 13.28 dB, 11.94 dB, and 10.54 dB, respectively. In the high frequency band (1600 Hz to 5000 Hz), most of the sound was lost as the sound waves propagated through sample No. 4, and at the 4000 Hz limit, the sound loss (DTL) was equal to 15.39 dB. The results of the samples No. 1 and No. 8 at the level of the same frequency were 13.15 dB and 10.74 dB, respectively. The thickness and density of the rubber tire granulate were proved to have the most significant impact on sound loss in the samples. In this case, density determines the amount of free air gaps in the rubber granulate. This factor affects the porosity, with the increase in which sound loss during the propagation through the test material shows worse results.
The interferometer measurements of sound absorption and sound transmission loss in the material showed that the best results in the analysis of sound absorption (α) and sound loss (DTL) were obtained from samples No. 1 and No. 8. For this reason, rubber granulate plates which met the sample parameters were selected for the use in the structure of the louvers and for further testing in the sound absorbing chamber.
3.3. The Results of the Testing of the Acoustic Parameters of the Structure in the Sound-Absorbing Chamber
After the performance of interferometer measurements of sound absorption and sound transmission loss in the material, two rubber granulate plates with the best performance were selected which were used as fillers in the 3D-printed perforated cartridges. The parameters of the rubber granulate plates used in the structure of the louvers are given in
Table 3.
The louver’s structure assembly was installed in the sound absorbing chamber. The sound level loss throughout the frequency band and the equivalent sound level loss were determined by tilting the louvers at different angles directed to and from the noise source.
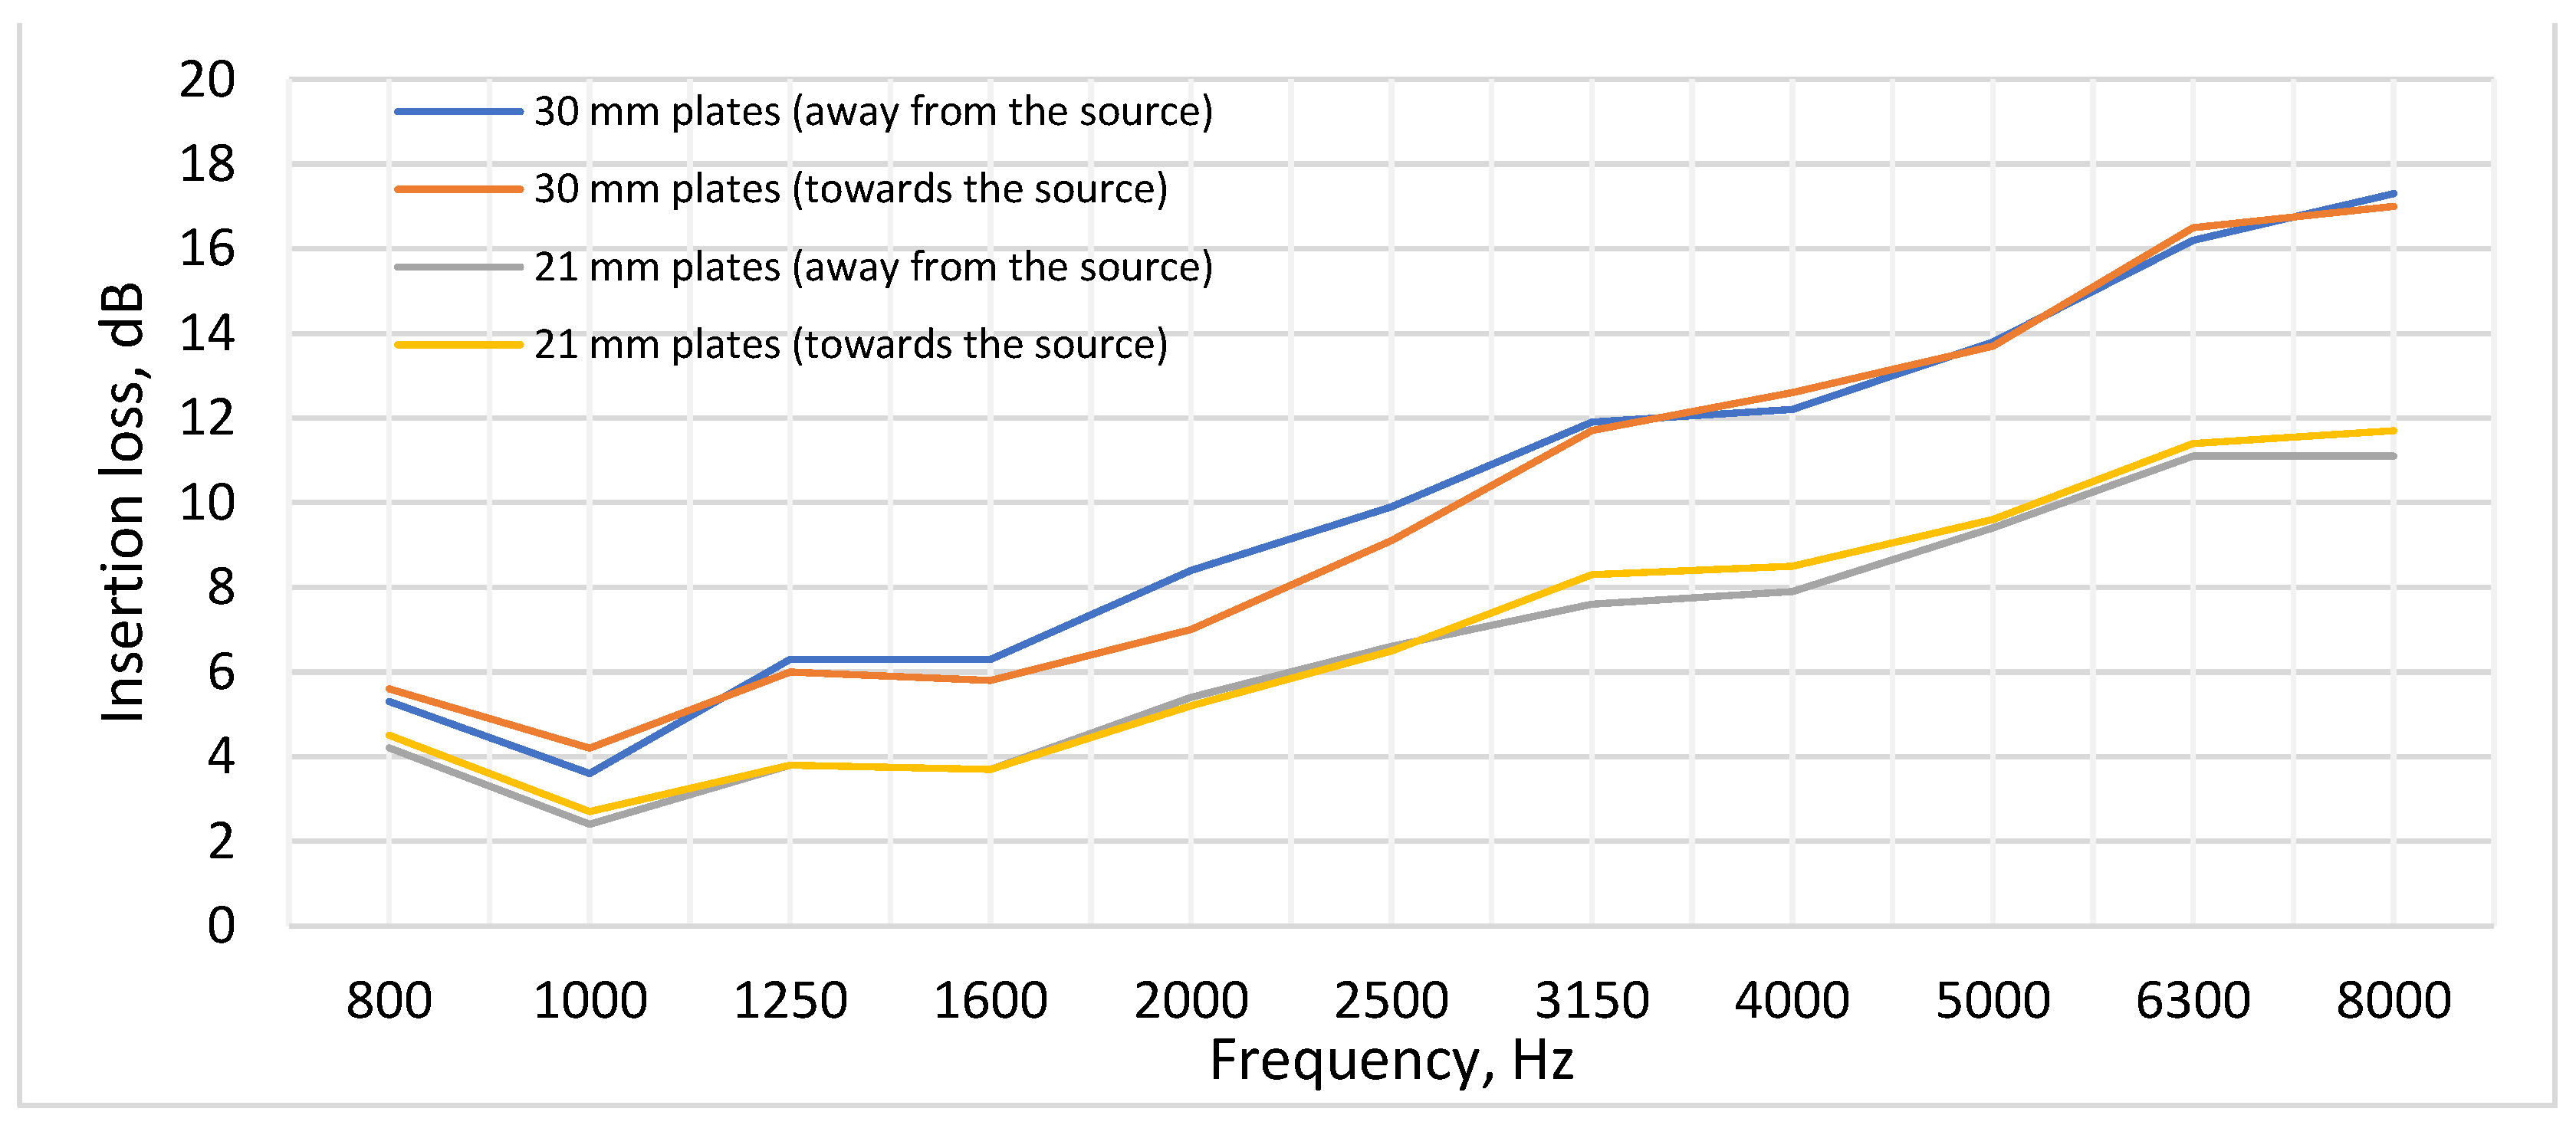
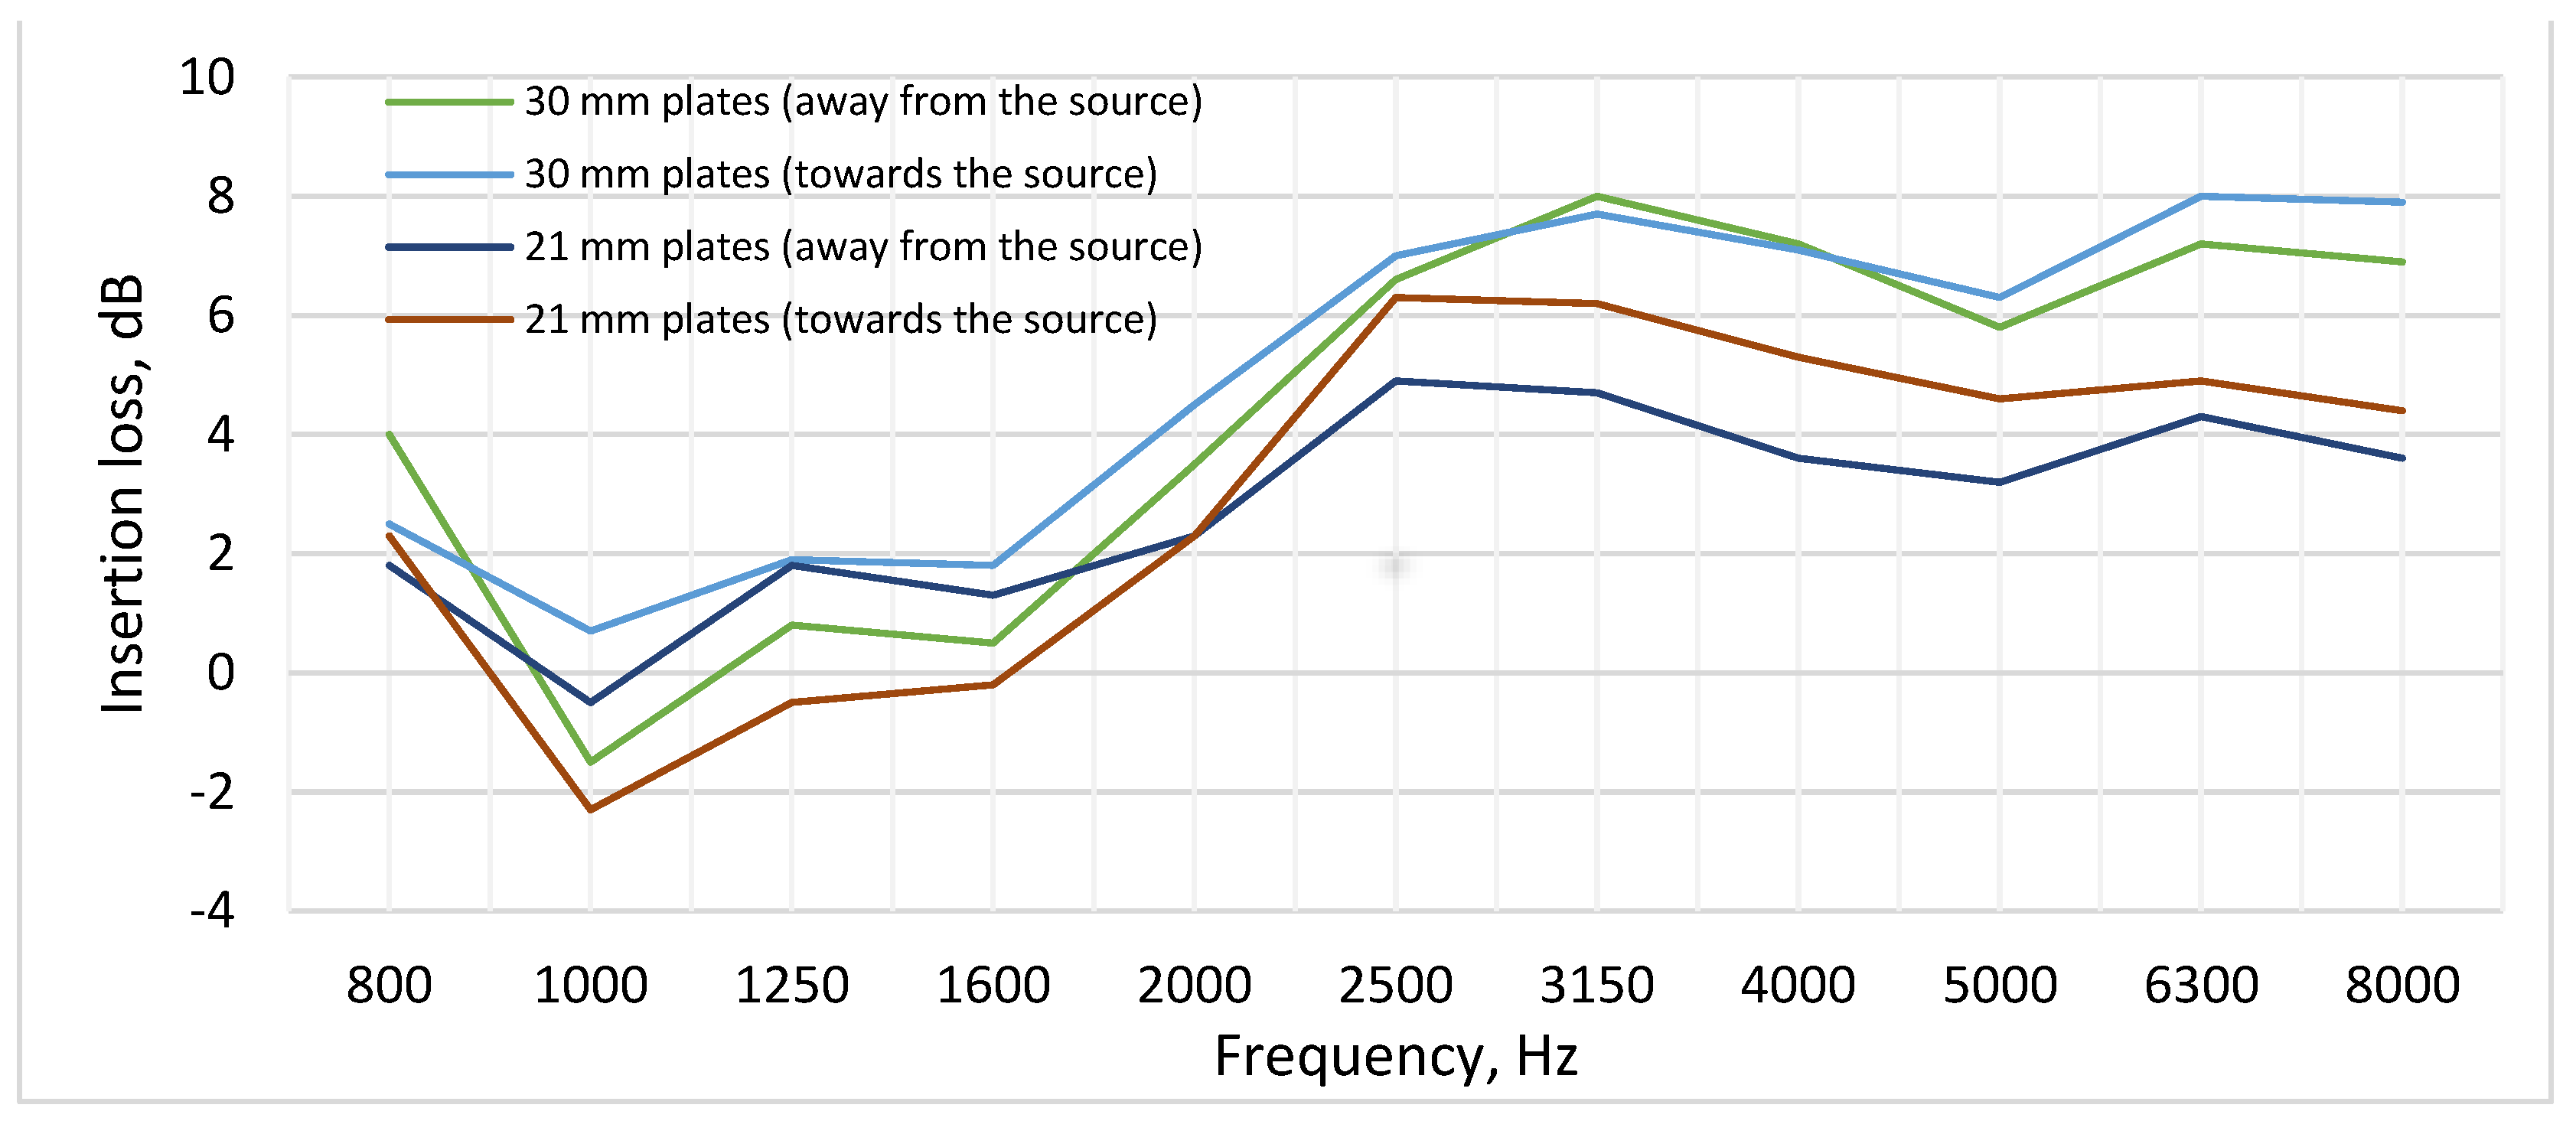
Graphs of the sound level loss throughout the frequency band (
Figure 11 and
Figure 12) and the equivalent sound level loss (L
Aeq) (
Figure 13 and
Figure 14) by tilting the louvers at an angle of 45 degrees directed from and to the noise source were used to compare the efficiency of the investigated structures.
The use of 27 rubber granulate plates with a thickness of 30 mm (4 to 8 mm fraction) and a density of 0.772 g/cm3 when tilted away from the noise source resulted in a maximum sound level loss of 17.3 dB (in the 8000 Hz range); when the louvers were tilted in the direction of the noise source, the result was 17 dB. The estimation of the efficiency of the louvers consisting of 15 plates with the use of the same type of rubber granulate plate proves that the efficiency was significantly lower and the maximum sound level loss was 8.0 dB (at 3150 Hz). The use of 27 rubber granulate plates with a thickness of 21 mm (2 to 8 mm fraction) and a density of 0.757 g/cm3 shows that the maximum sound pressure loss—11.7 dB—was observed at the frequency of 8000 Hz. Meanwhile, the maximum efficiency of the louvers consisting of 15 sound-absorbing plates was noticed in the frequency band of 2500 Hz with the value of 6.3 dB (while tilting the louvers towards the noise source).
A direct dependence of the result on the tilting angle of the louvers and on the number of rubber granulate plates was identified. The highest values throughout the frequency band were obtained while using the louvers with 27 rubber granulate plates compared to 15, regardless of their thickness. This is due to the smaller air gap between the louvers, which reaches 65 mm in the horizontal position, while when using 15 plates, the distance is 86 mm. The increase in the number of plates and the tilting angle in the test structure also expands the absorbing surface area, which results in the higher efficiency of the structure.
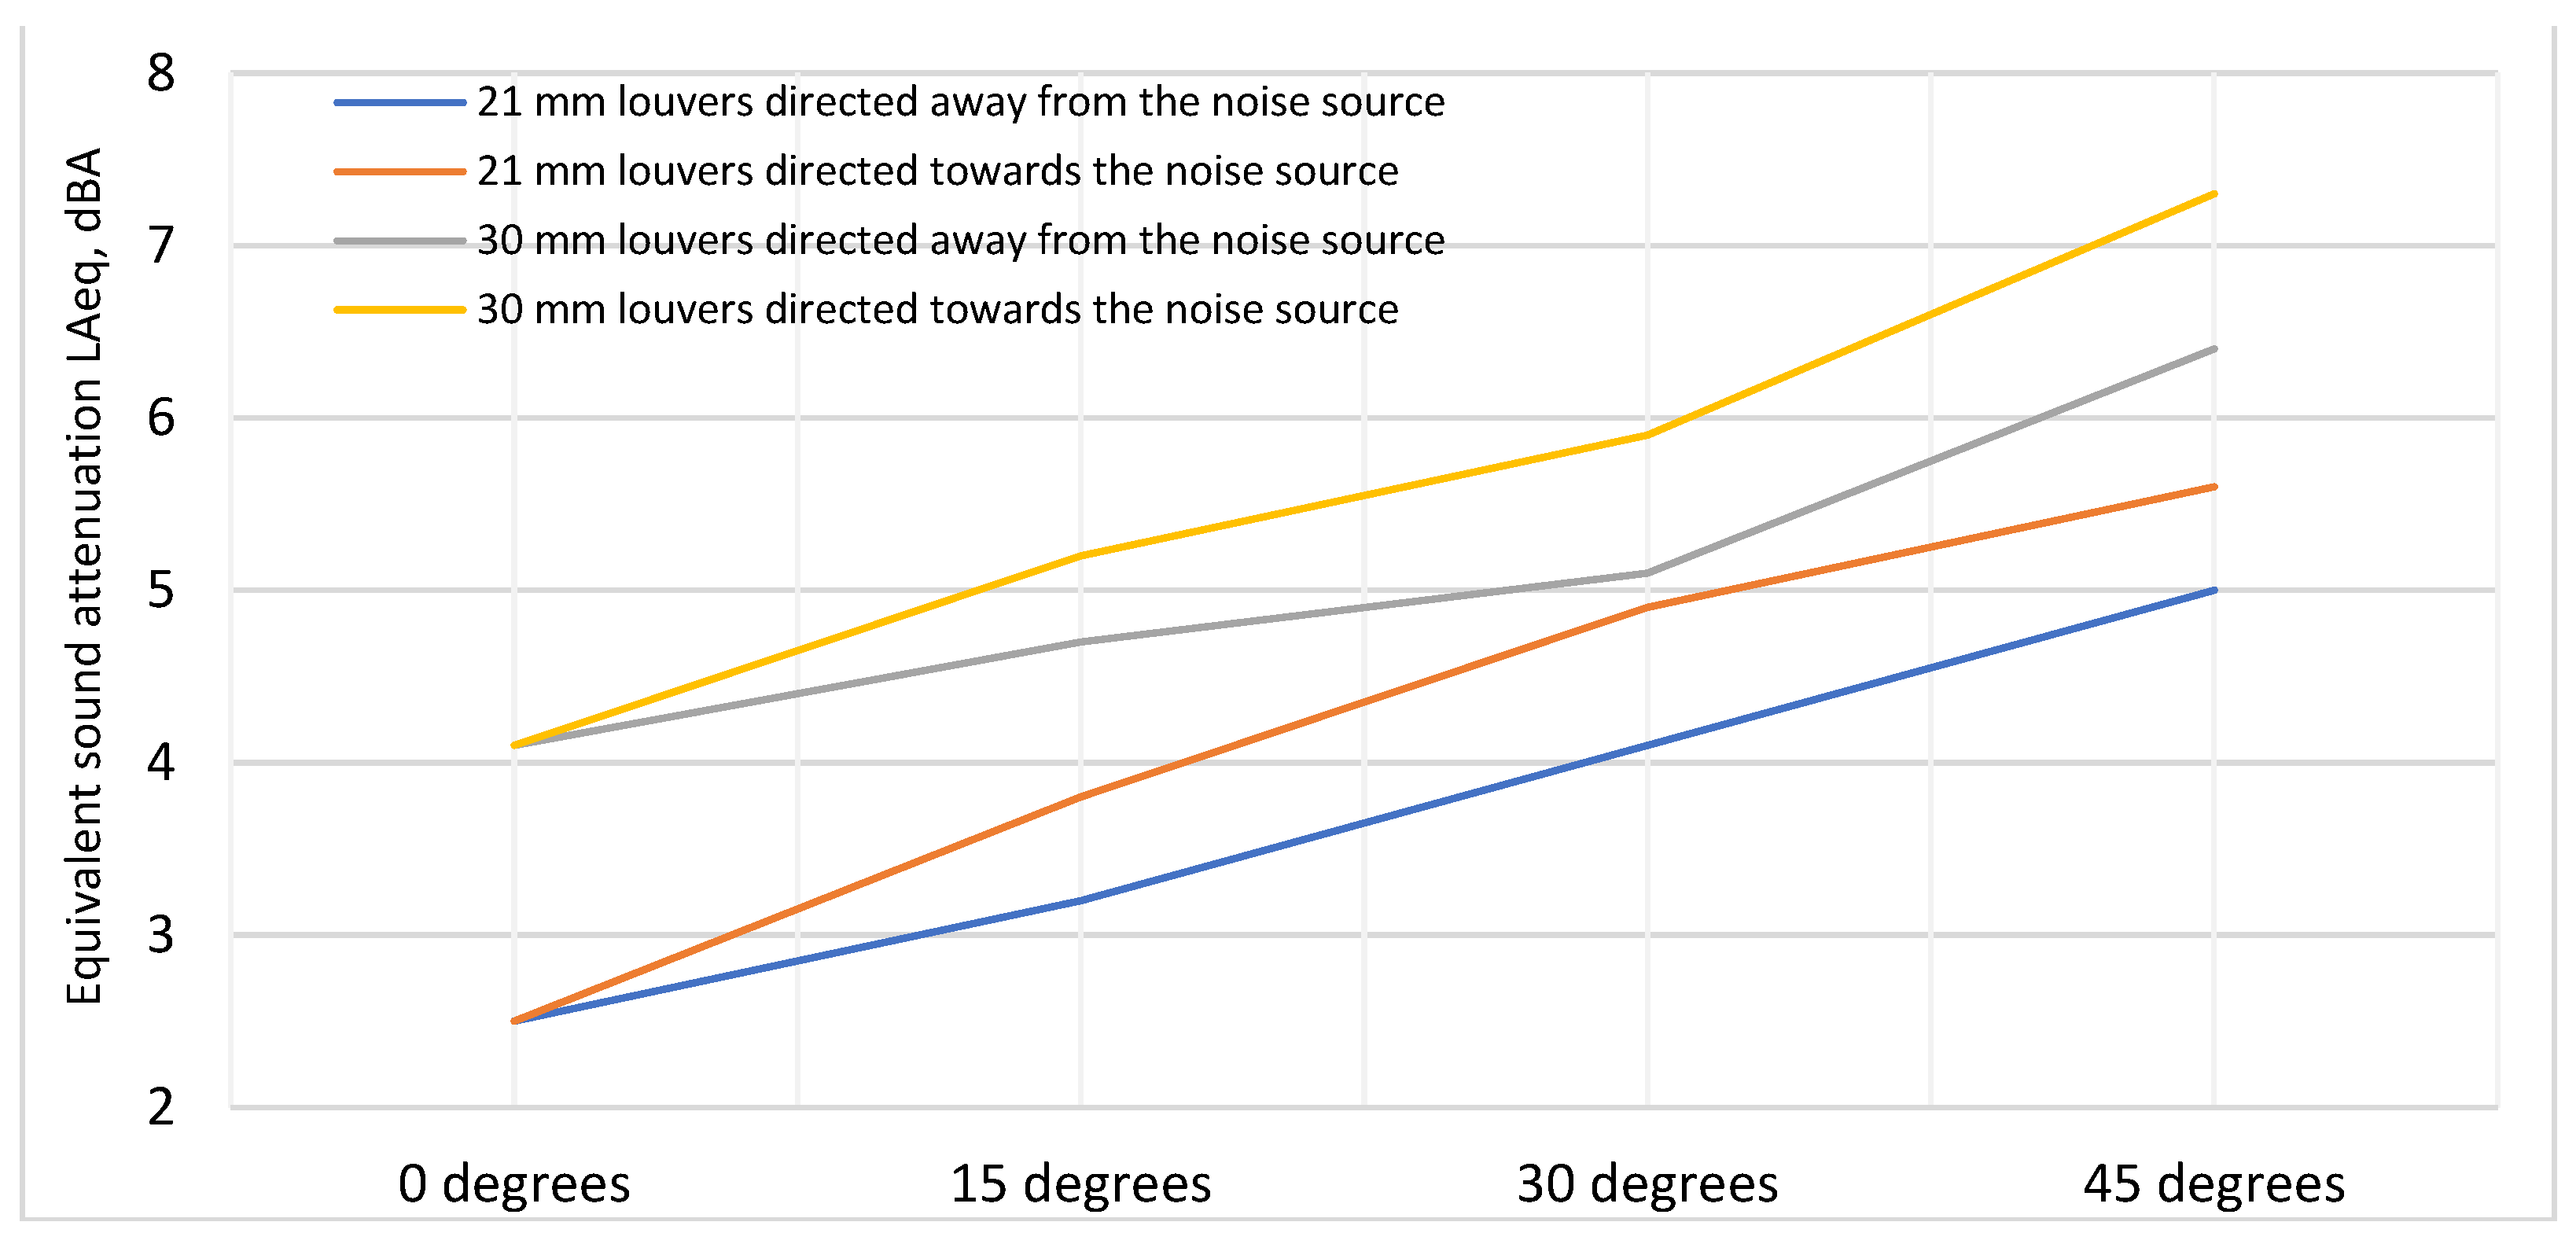
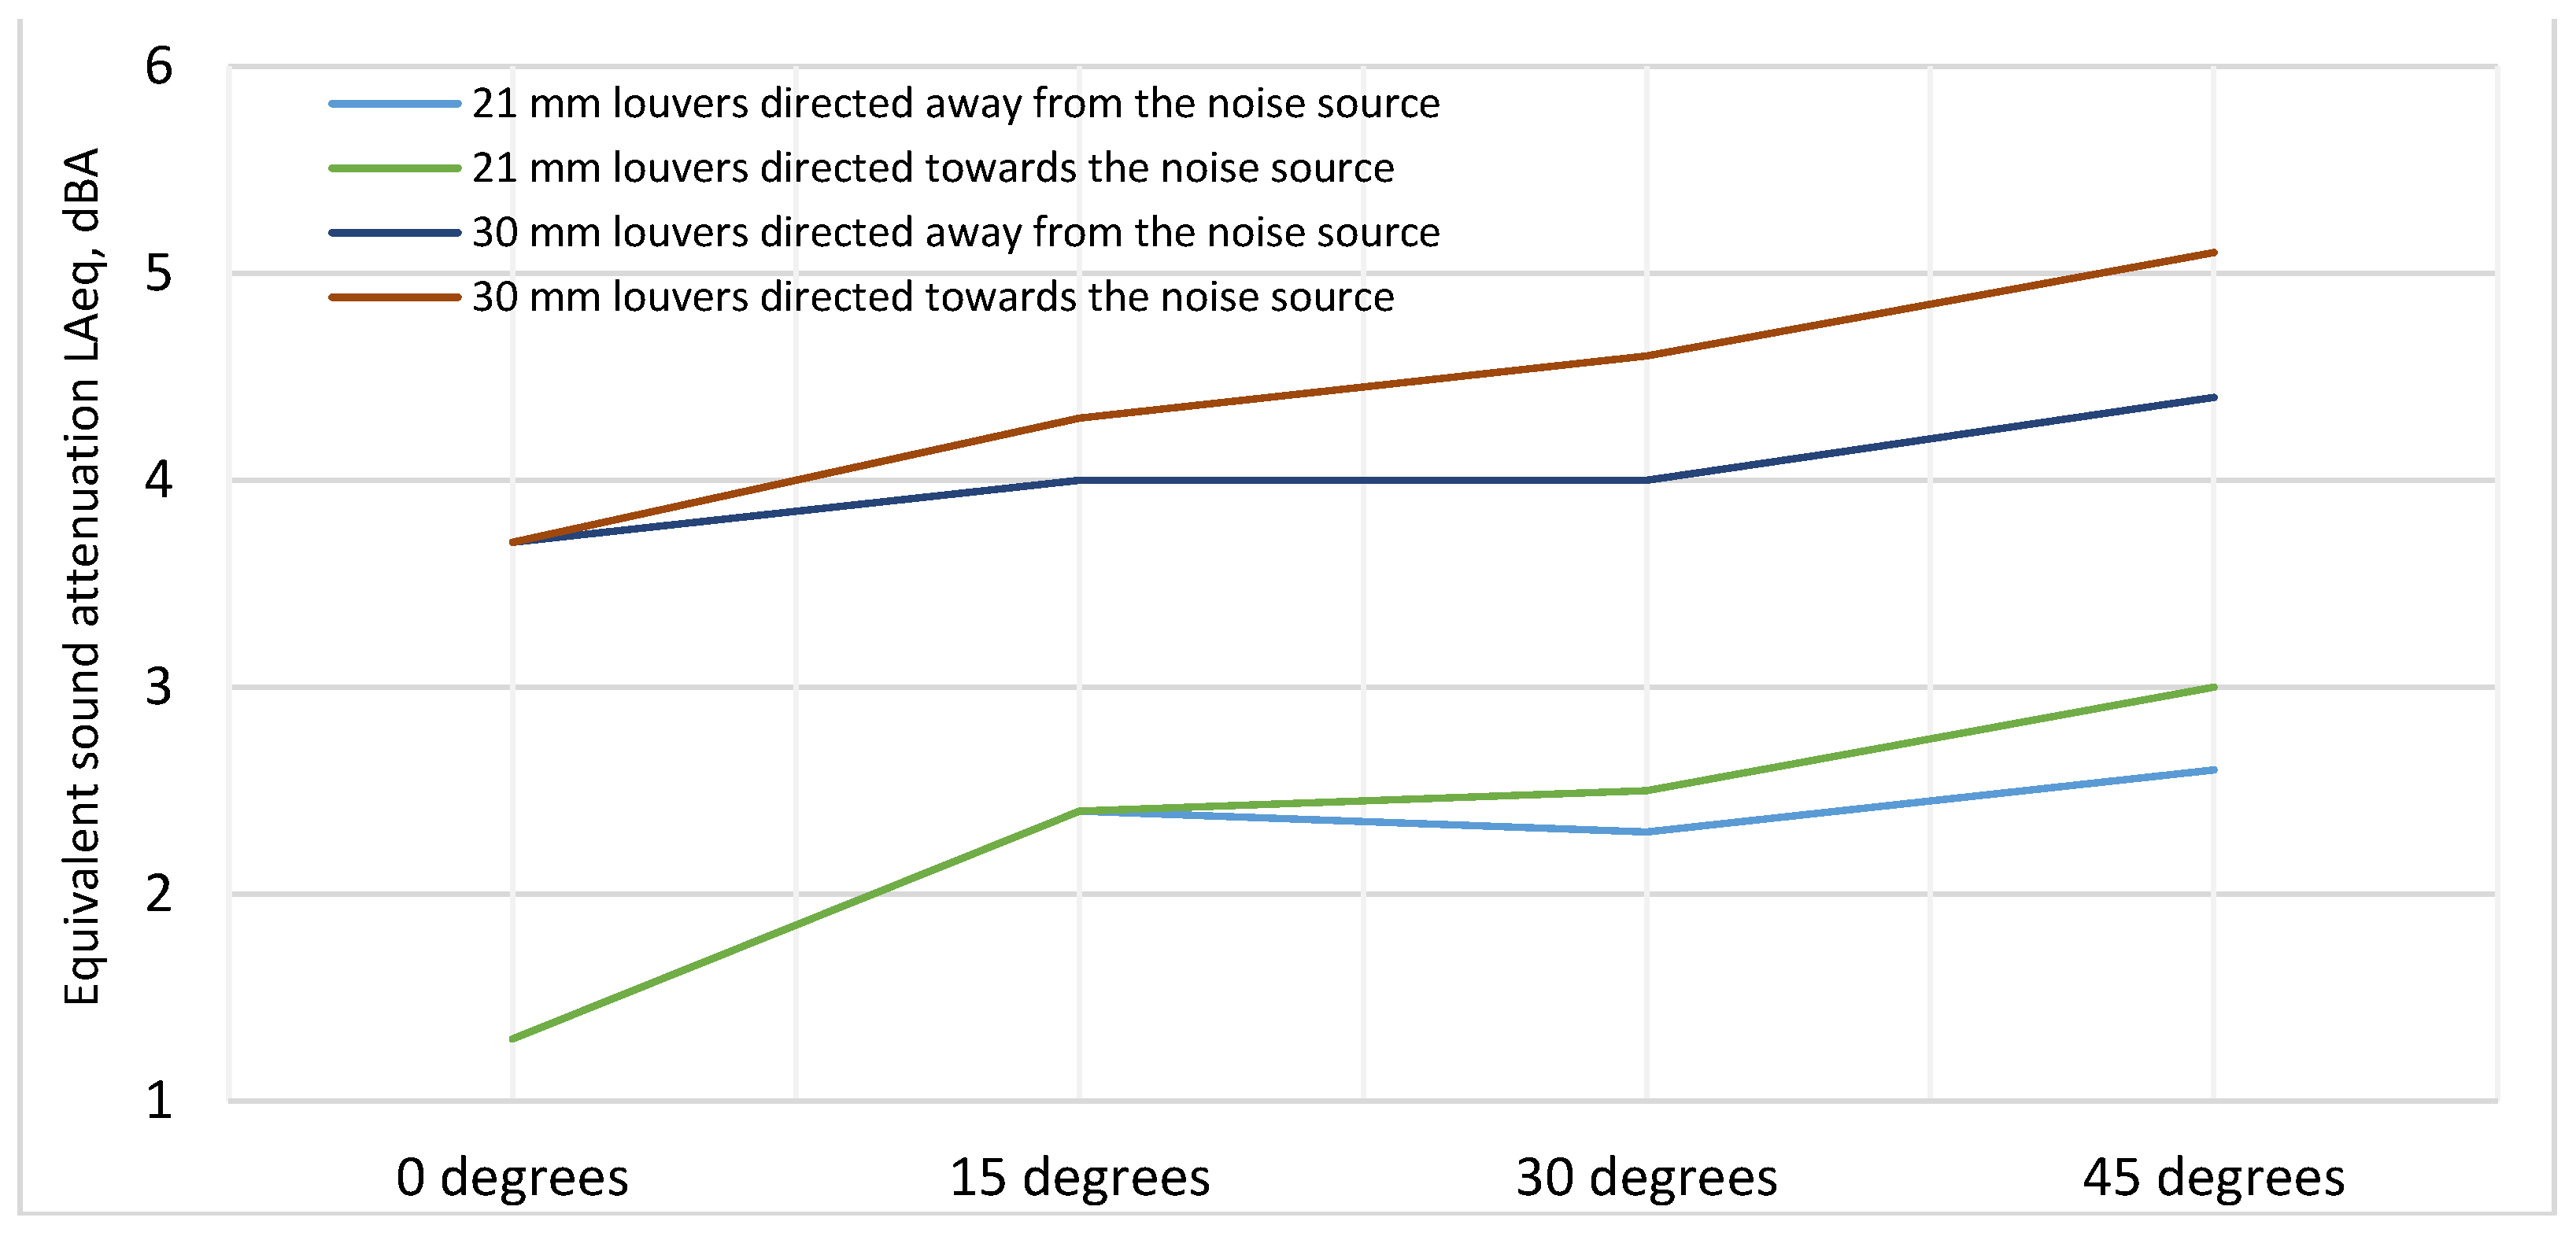
The evaluation of the equivalent sound level loss (L
Aeq) (
Figure 13 and
Figure 14) indicates that in all cases, increasing the tilting angle of the louvers consequently led to a higher efficiency of the structure. The most effective sound absorption was found in louvers tilted towards the noise source with the following rubber granulate plates: a thickness of 27, 30 mm, 4–8 mm fraction, and 0.772 g/cm
3 density. At 15 degrees, the structure efficiency reached 5.2 dBA; at 30 degrees, it reached 5.9 dBA, and at 45 degrees, it went up to 7.3 dBA. When testing a structure consisting of 15 plates filled with the same granulate, the efficiency proved to be lower. Tilting the louvers towards the noise source at 15-degree angles resulted in 5.2 dBA, at 30 degrees in 5.9 dBA, and at 45 degrees in 7.3 dBA.
This consistent pattern can also be observed in structures using the following rubber granulate plates: thickness—21 mm; fraction—2–8 mm; and density—0.757 g/cm3. In conclusion, it is most appropriate to fill the louvers with 30 mm thick, 4–8 mm fraction, 0.772 g/cm3 rubber granulate and use a structure consisting of 27 plates, thus increasing the absorbing surface area and reducing the air gap between the louvers. Experiments have shown that the structure is most effective in suppressing high-frequency sound (in the range of 3150 to 8000 Hz). The maximum sound level reduction was 17.3 dB (in the 8000 Hz frequency range), and the maximum equivalent sound level reduction (LAeq) was 7.3 dBA. In summary, the results obtained by investigating the acoustic properties of the samples with the use of an interferometer corresponded to the results obtained in the sound absorbing chamber. Thicker and larger fractions of rubber granulate plates demonstrate higher efficiency. It was found that the type, number, thickness, and tilting angle of the rubber granulate plate have the most significant impact on the structure efficiency.
5. Conclusions
An innovative sound-proof structure has been developed. Waste tire rubber was used to produce it, thus presenting a solution for the waste management problem. The structure could possibly be used indoors and outdoors, is easy to install, and is suitable for reducing noise generated by equipment that requires a large amount of air flow to function.
Interferometer measurements of nine different rubber granulate plates revealed the sound absorption and sound transmission loss of the samples. The best results in the analysis of sound absorption (α) and sound loss (DTL) (throughout the entire frequency band) were obtained in the case of a sample with a thickness of 30 mm, a fraction of 4 to 8 mm, and a density of 0.772 g/cm3, and a sample with a thickness of 21 mm, a fraction of 2 to 8 mm, and a density of 0.757 g/cm3. The 30 mm thickness sample had a maximum sound absorption ratio (α) of 0.75 and a sound loss (DTL) of 14.00 dB. The 21 mm thickness sample reached a maximum sound absorption ratio (α) of 0.71 and a sound loss (DTL) of 11.51 dB. The results were taken into consideration and the rubber granulate plates corresponding to the parameters of the samples were used in the structure of the louvers.
The structure efficiency was investigated in the sound absorbing chamber. The best result of sound absorption was found to be provided by a structure consisting of 27, 30 mm thick, 4–8 mm fraction, 0.772 g/cm3 density rubber granulate plates, with a space of 65 mm between the louvers in the horizontal position and a tilting angle of 45 degrees, with the louvers directed towards the noise source. The maximum sound level reduction observed was 17.3 dB (in the 8000 Hz frequency band), and the maximum equivalent sound level reduction (LAeq) was 7.3 dBA. The highest efficiency of the construction was achieved by attenuating high-frequency sound (from 3150 to 8000 Hz); therefore, it could be used to reduce noise from such equipment as centrifuges, compressors, pumps, and turbines which often generate sound in the higher frequency range. Also, louvered barriers can be used for noise reduction from cooling systems, cooling towers, fans, and HVAC systems.


