_Li.png)
Assessment of Performance Measurement Systems’ Ability to Mitigate or Eliminate Typical Barriers Compromising Organisational Sustainability


Abstract
1. Introduction
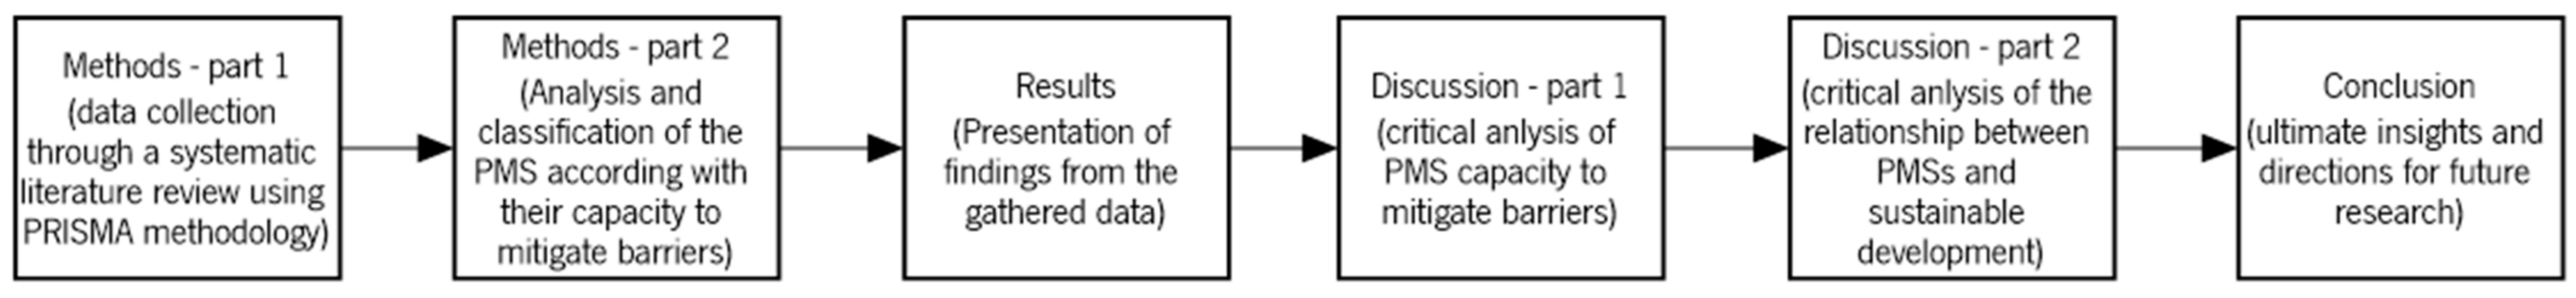
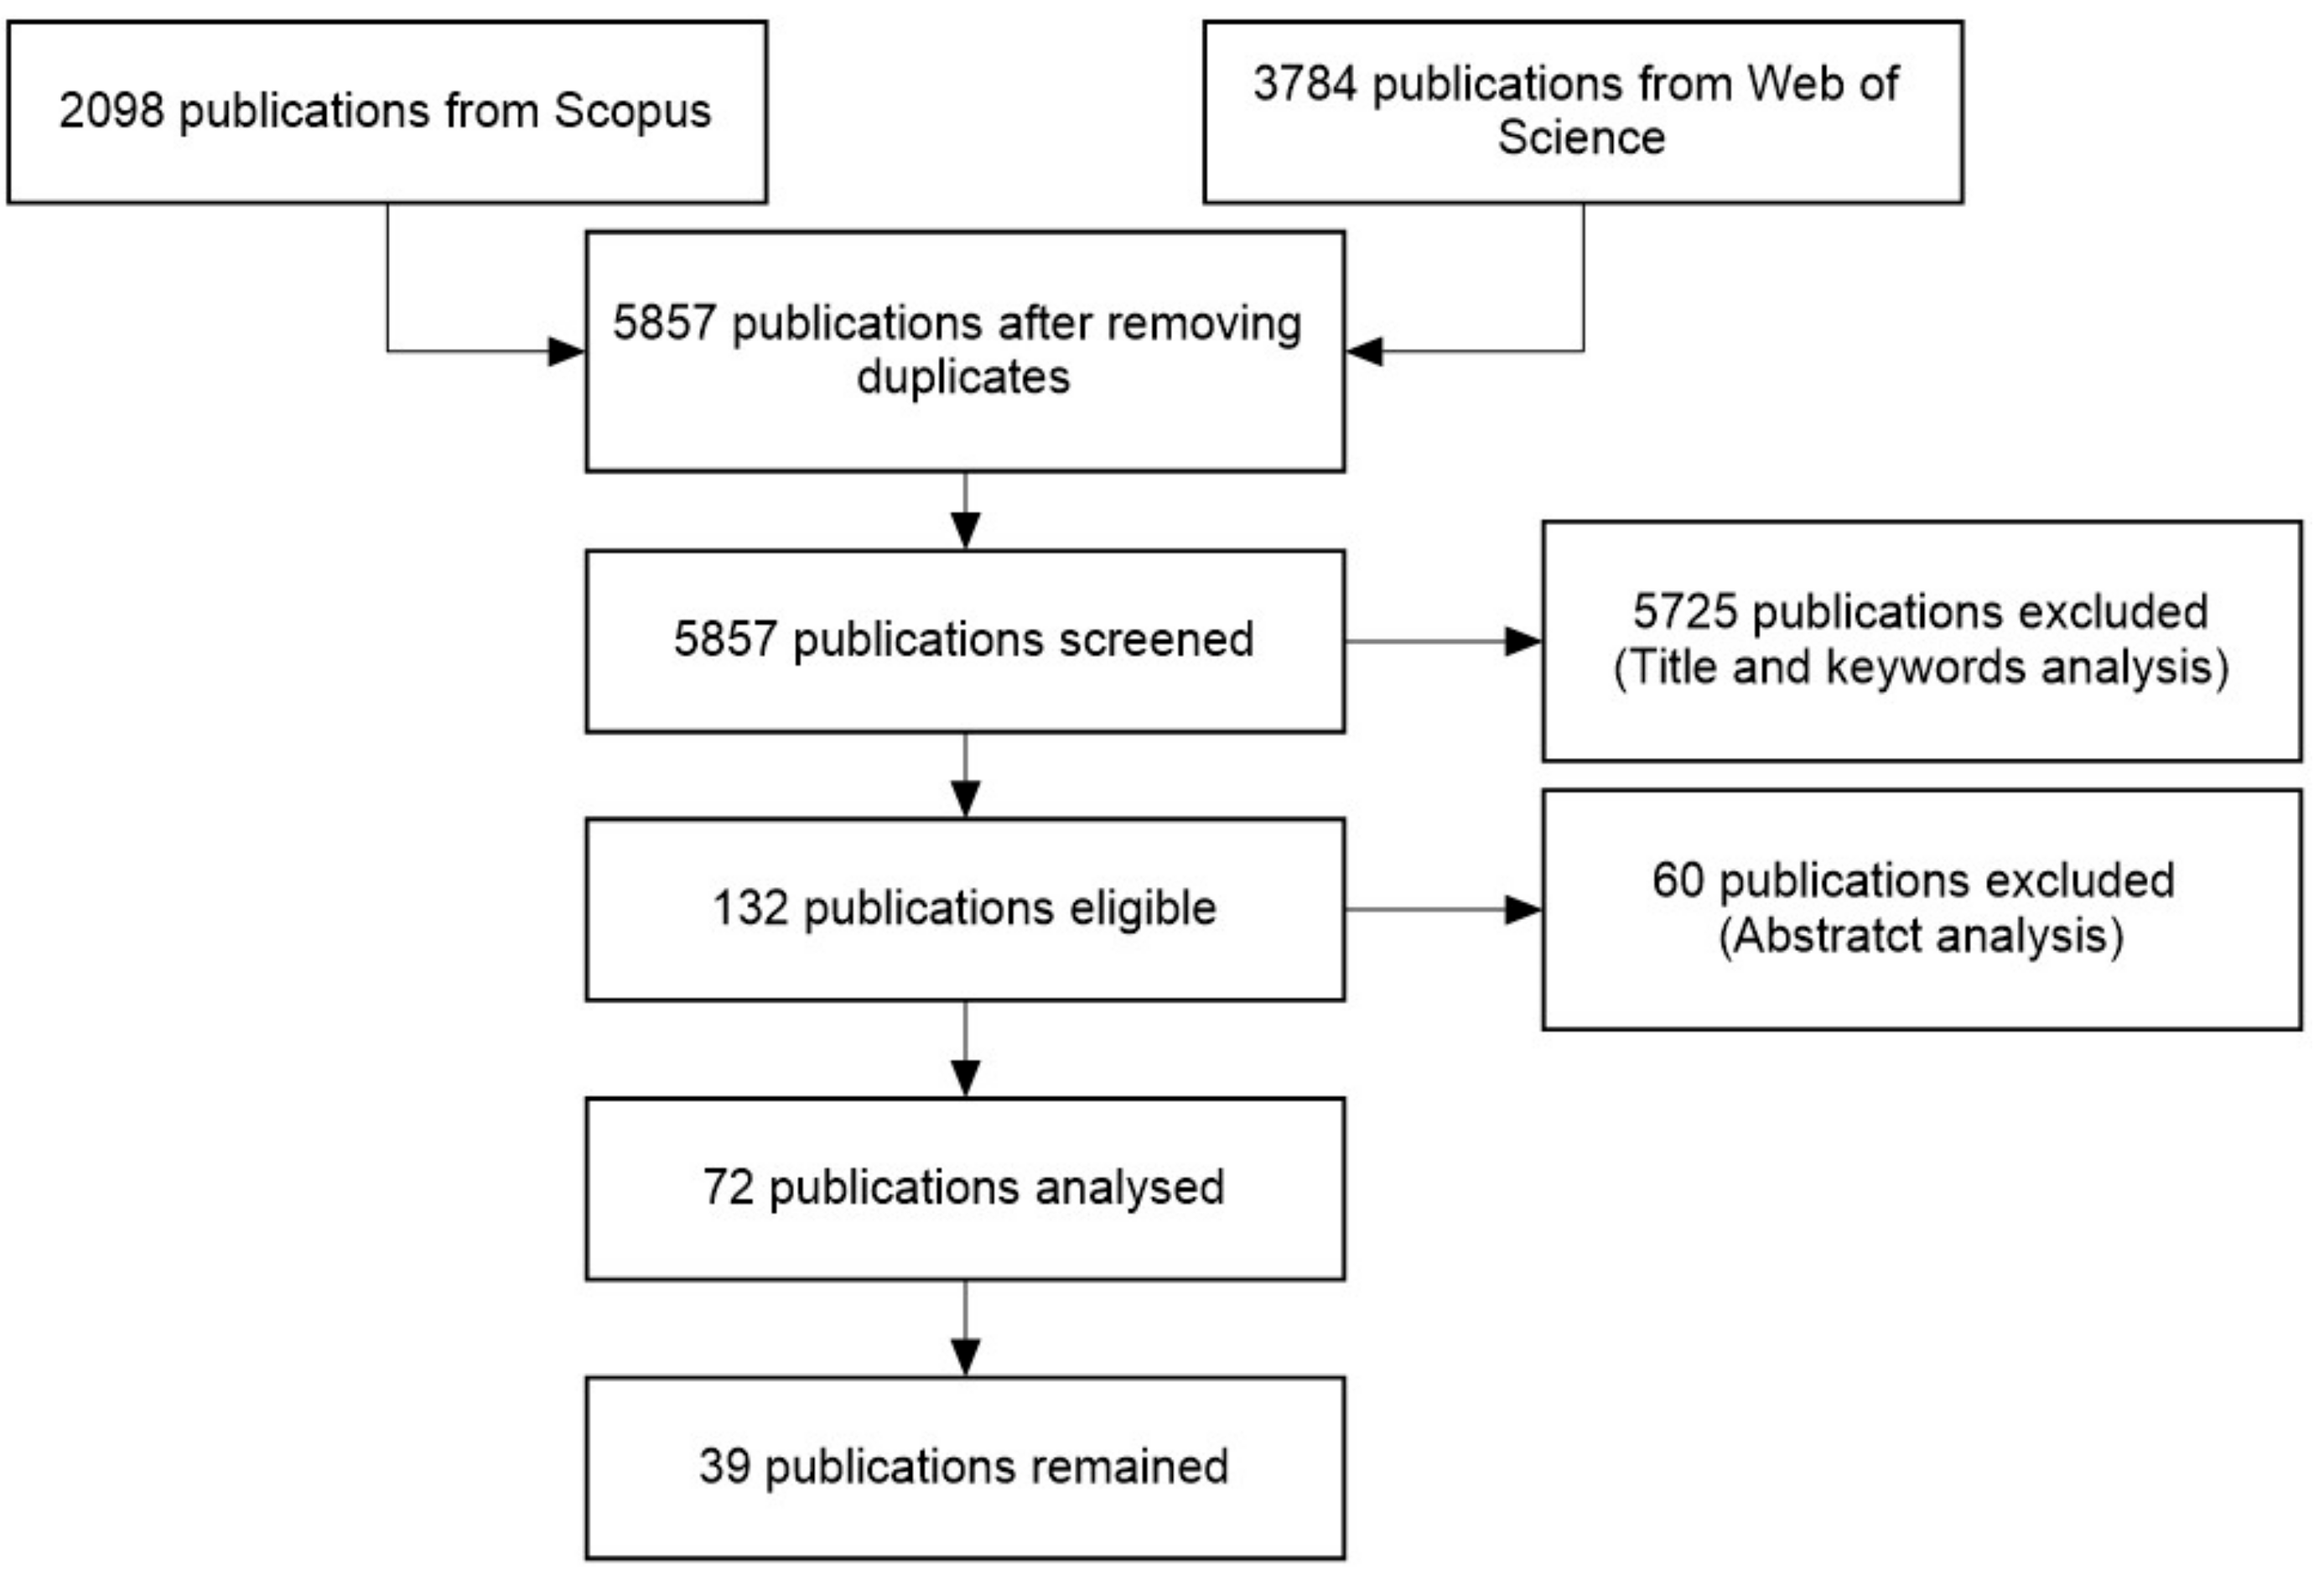
2. Methods
3. Results
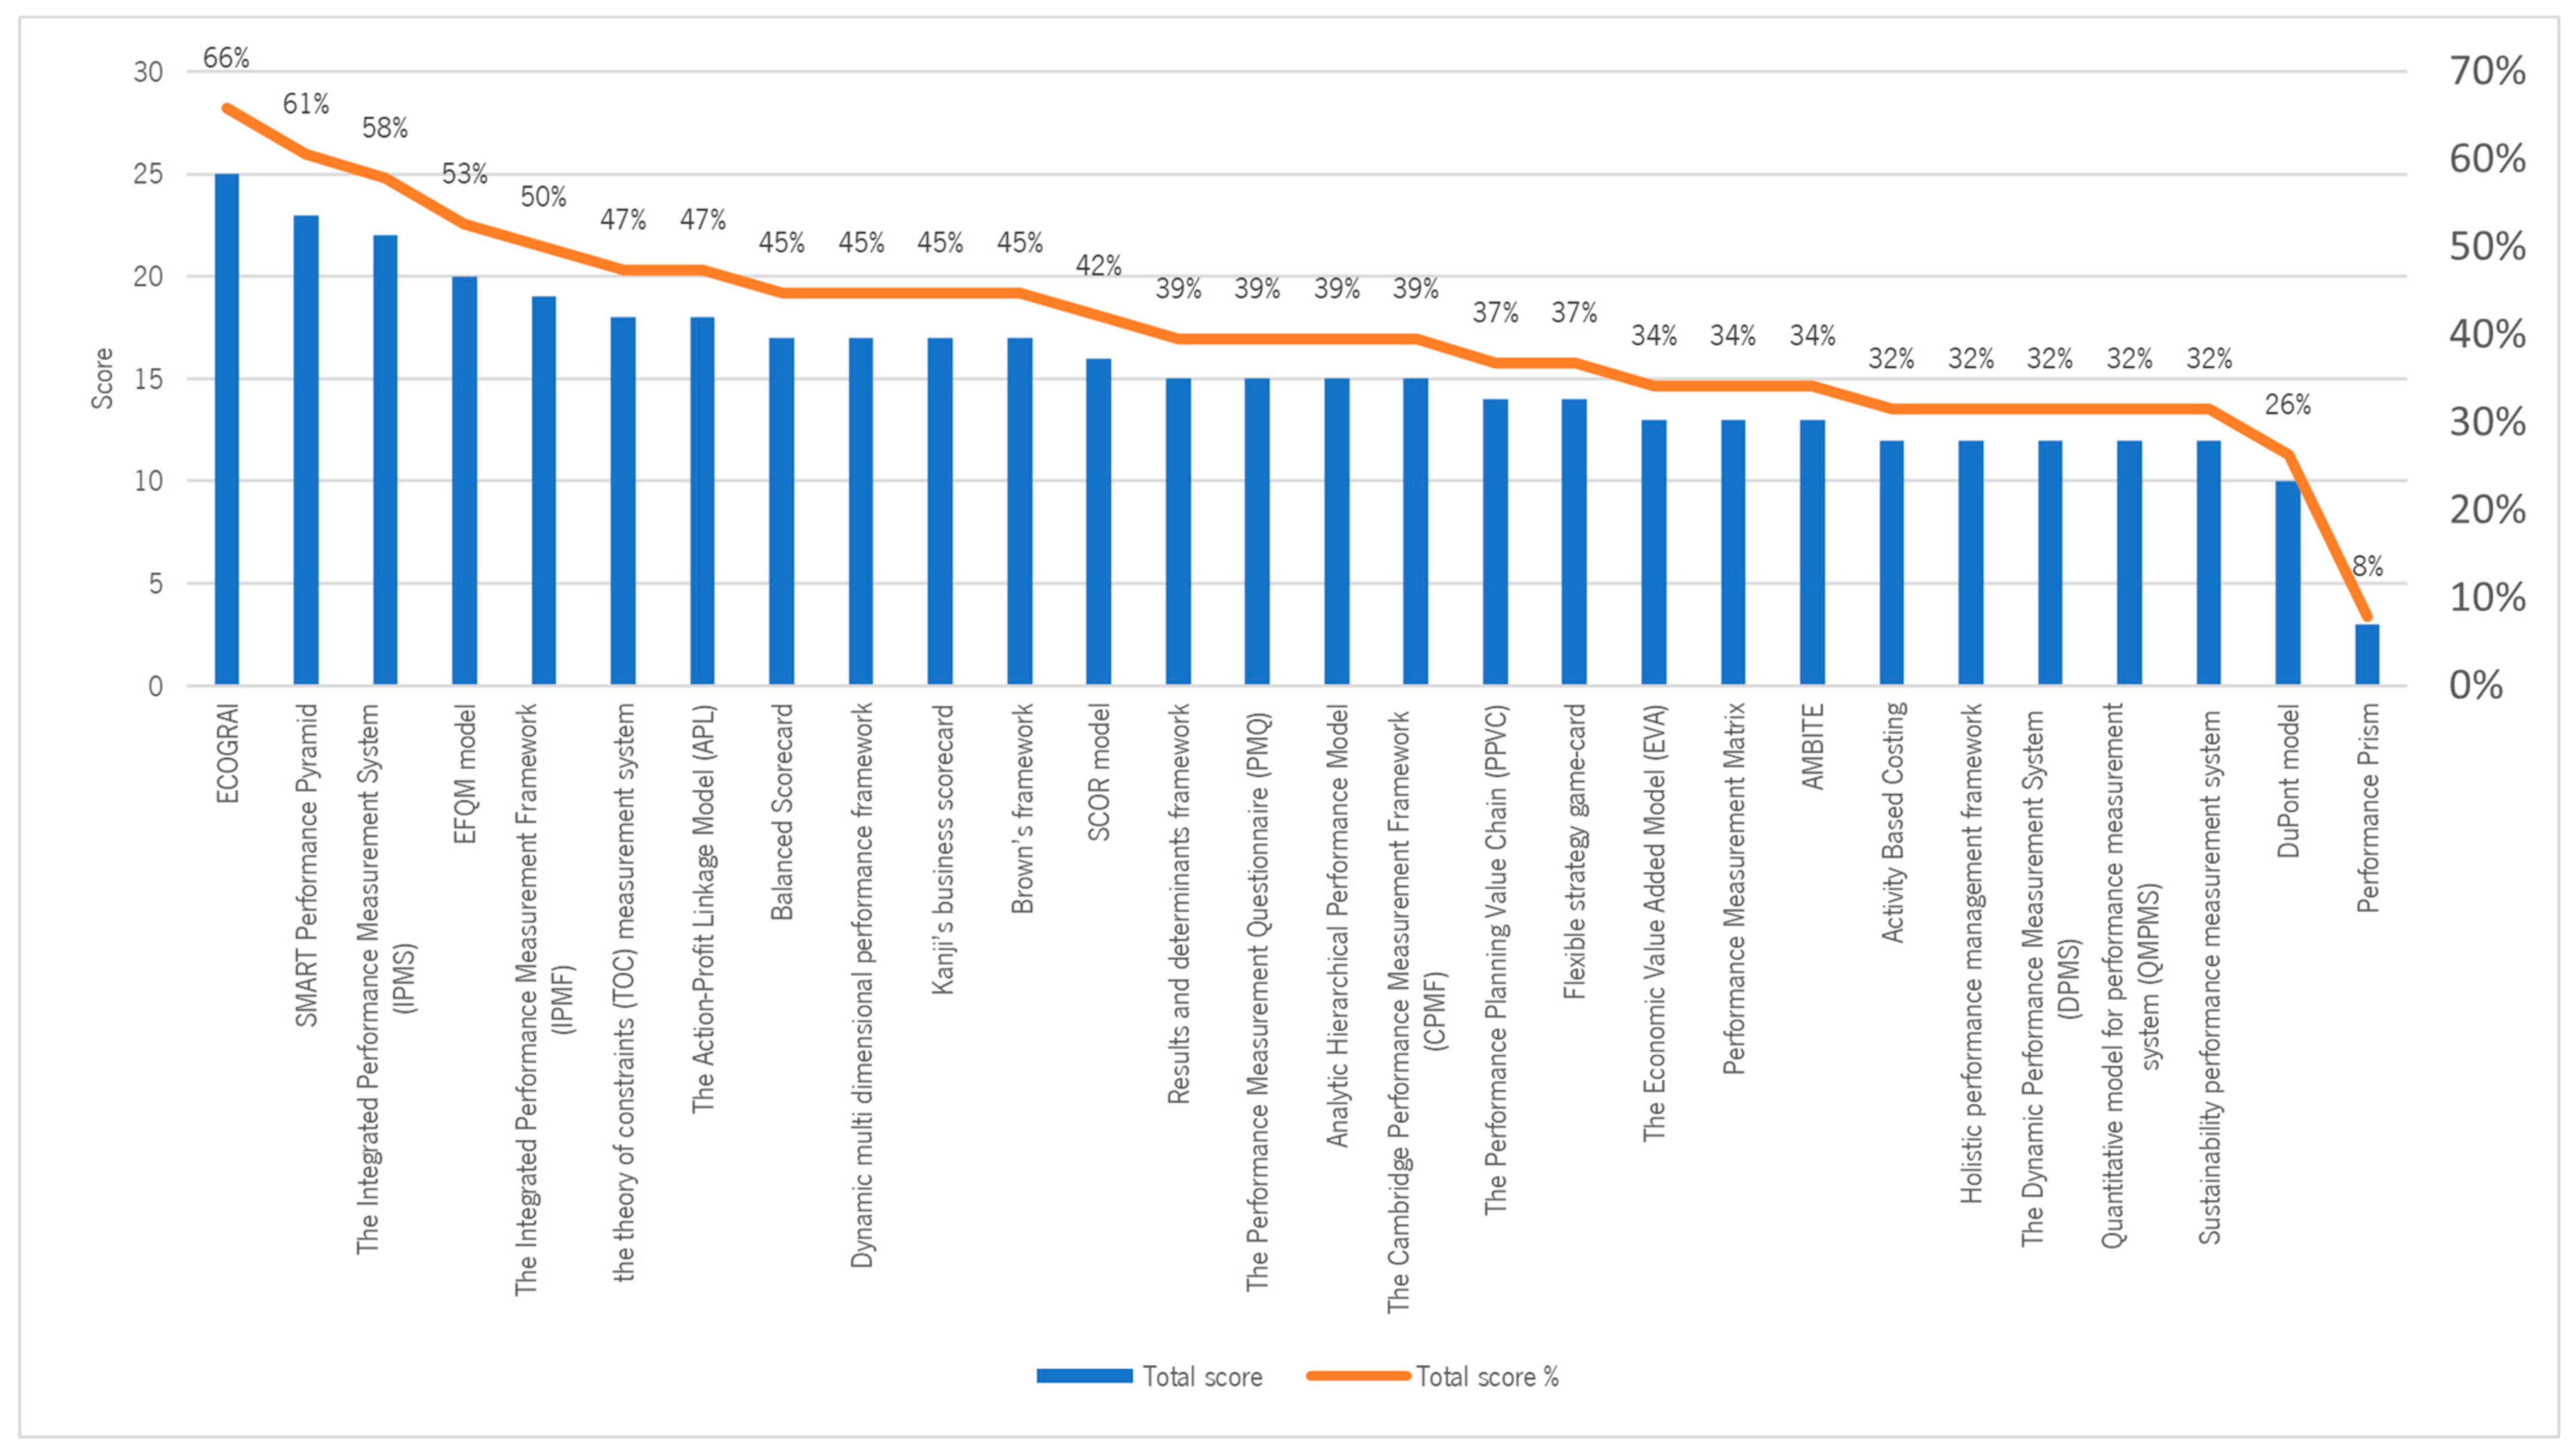
- ECOGRAI is capable of mitigating or eliminating eight barriers and has some capacity to mitigate or eliminate another nine. It is classified as not being able to mitigate or eliminate only two barriers.
- Performance Pyramid is capable of mitigating or eliminating seven barriers and has some capacity to mitigate or eliminate another nine. It is classified as not being able to mitigate or eliminate three barriers.
- IPMS is capable of mitigating or eliminating five barriers and has some capacity to mitigate or eliminate another twelve. It is classified as not being able to mitigate or eliminate only two barriers.
- EFQM model is capable of mitigating or eliminating two barriers and has some capacity to mitigate or eliminate another sixteen. It is classified as not being able to mitigate or eliminate only one barrier.
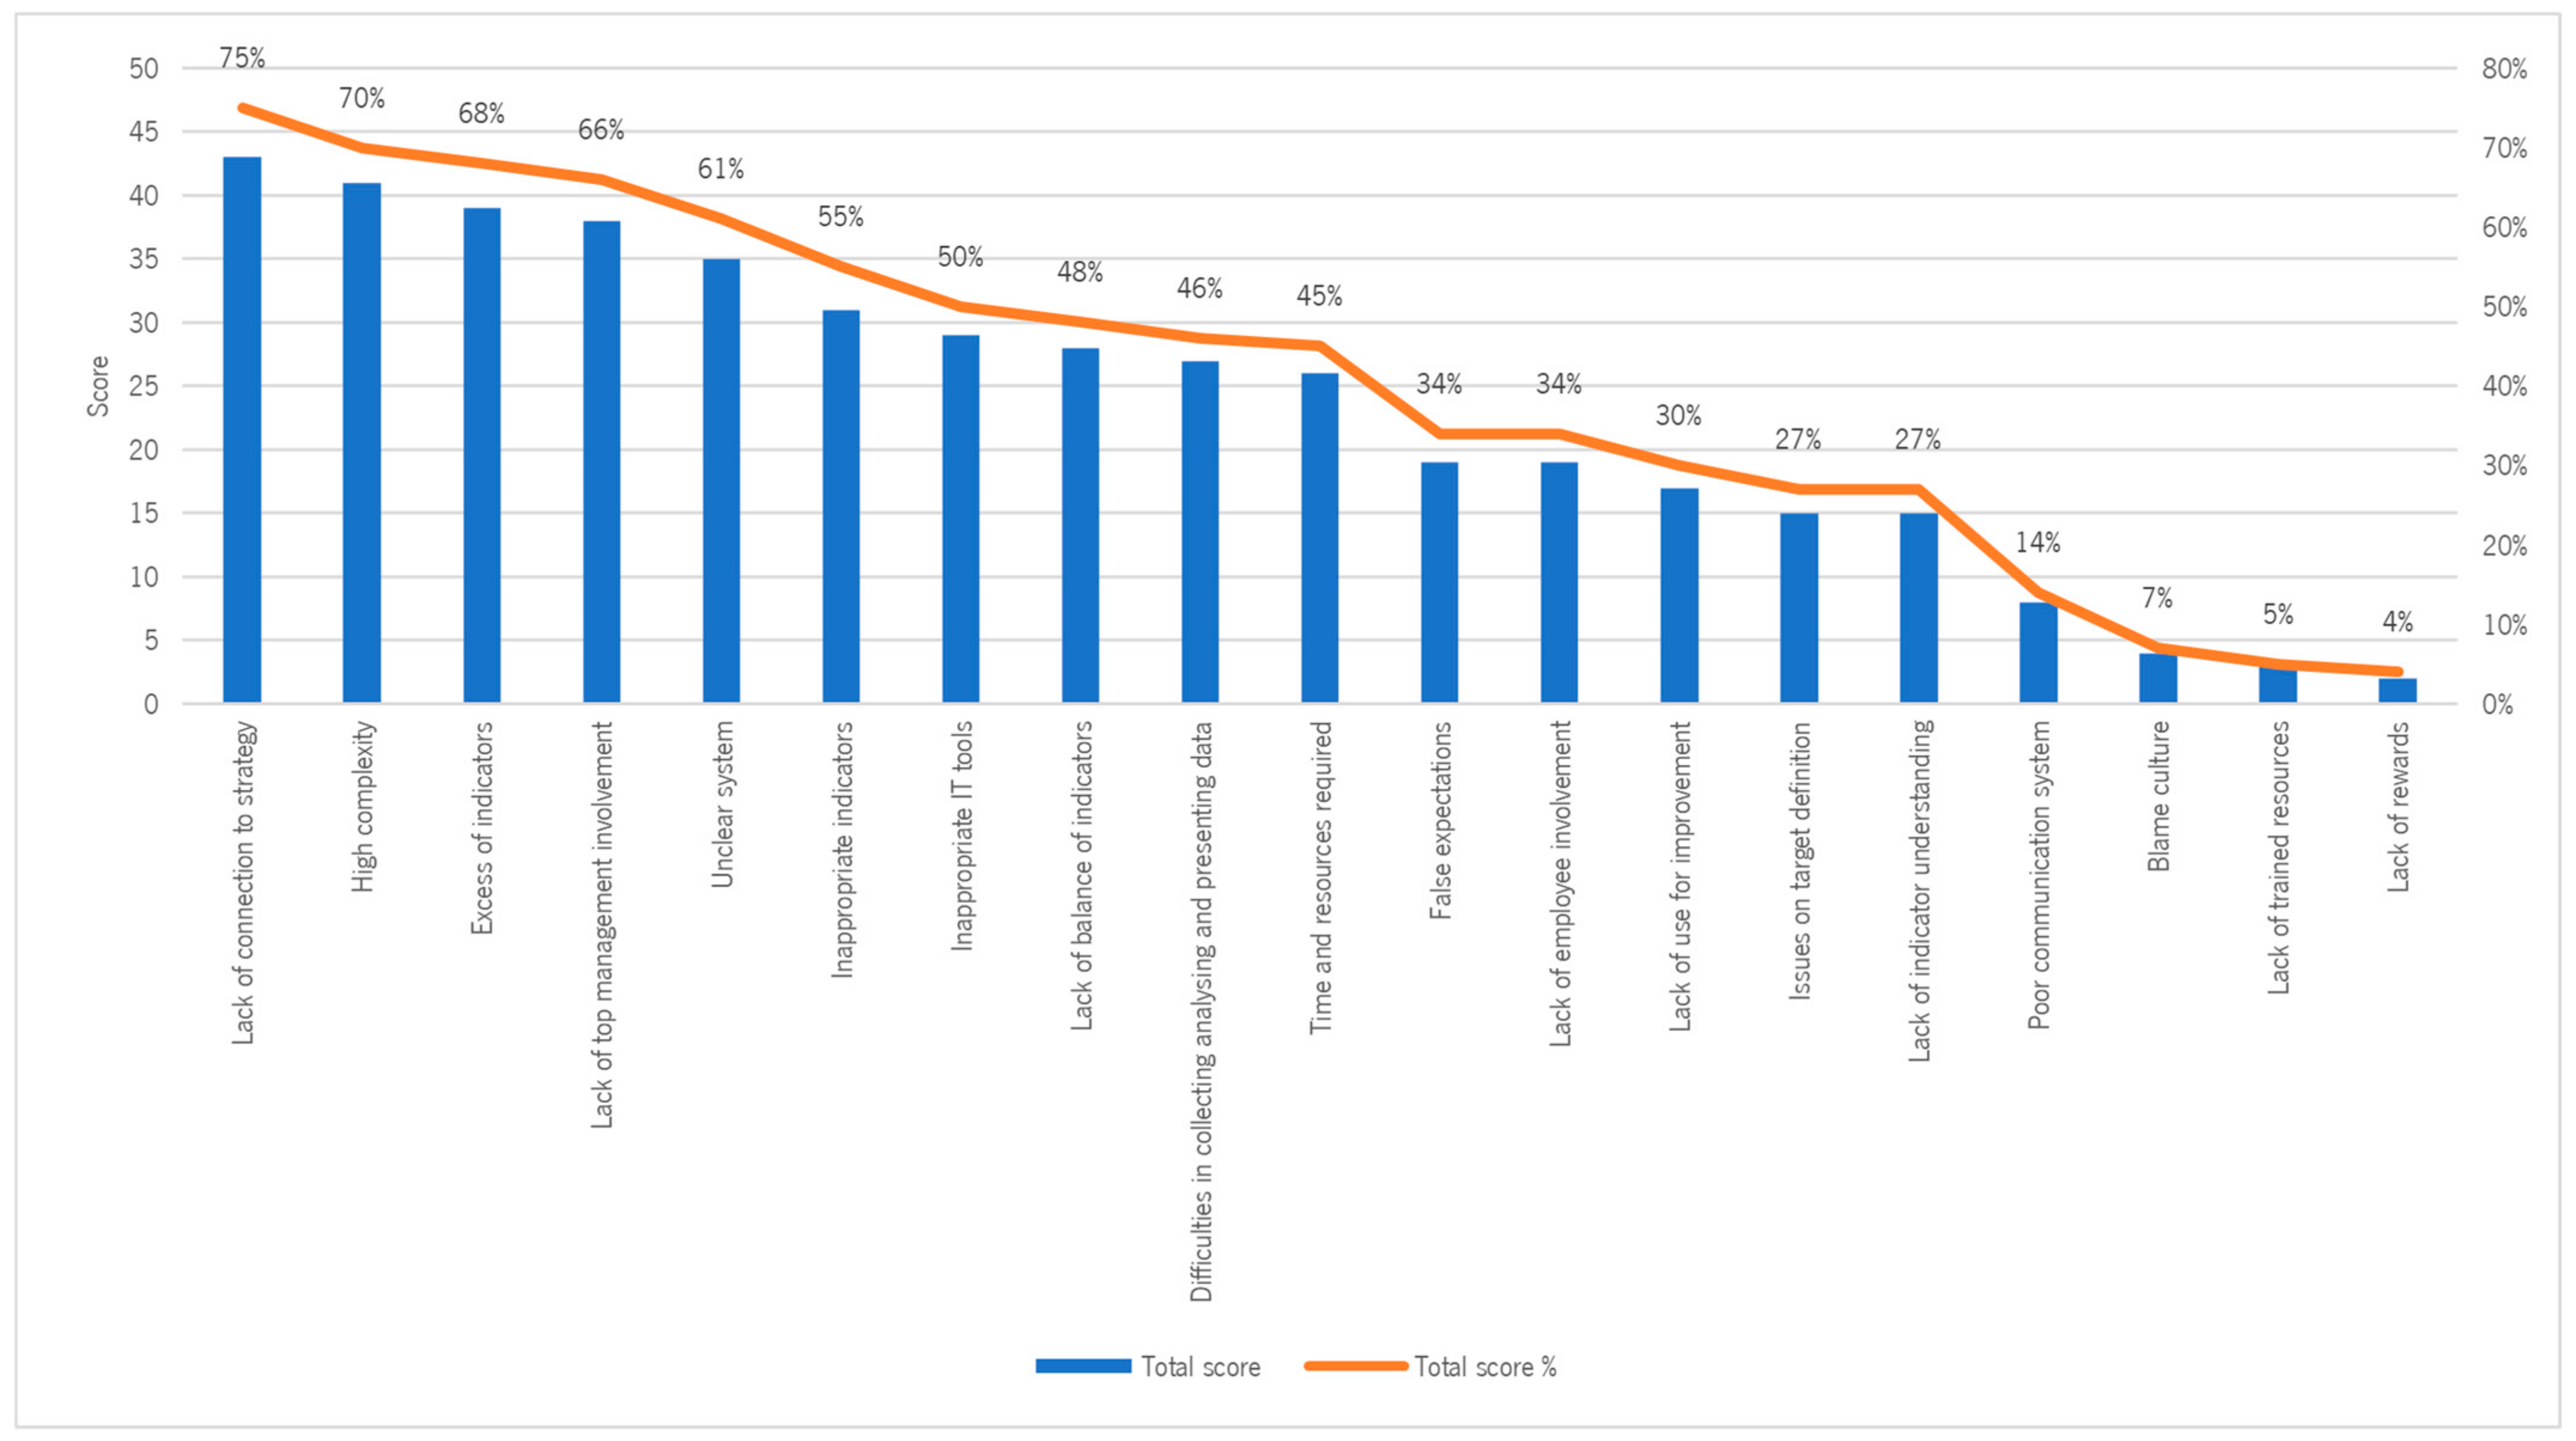
- Lack of connection to strategy: A total of 16 PMSs have capacity to eliminate or mitigate this barrier, and 10 have some capacity. Only two PMSs have weak or no capacity.
- High complexity: A total of 14 PMSs have capacity to eliminate or mitigate this barrier, and 11 have some capacity. Three PMSs have weak or no capacity.
- Excess of indicators: A total of 11 PMSs have capacity to eliminate or mitigate this barrier, and 16 have some capacity. Only one PMS has weak or no capacity.
4. Discussion
4.1. PMS Capacity to Mitigate Barriers
- Blame culture
- 2.
- Lack of connection to strategy
- 3.
- Issues on target definition
- 4.
- Unclear system
- 5.
- Lack of top management involvement
- 6.
- Poor communication system
- 7.
- High complexity
- 8.
- Lack of use for improvement
- 9.
- Lack of balance of indicators
- 10.
- Lack of rewards
- 11.
- False expectations
- 12.
- Inappropriate IT tools
- 13.
- Excess of indicators
- 14.
- Lack of trained resources
- 15.
- Lack of employee involvement
- 16.
- Inappropriate indicators
- 17.
- Lack of indicator understanding
- Identification details, including the indicator’s name, decision centre, time horizon, and reporting period.
- Objectives and underlying drivers associated with the indicator.
- Identification of any potential adverse effects or unintended consequences.
- Identification of the necessary data for implementing the indicator.
- Specification of the data processing methods.
- Utilisation of visual representations, typically through graphics, to enhance clarity.
- 18.
- Time and resources required
- 19.
- Difficulties in collecting, analysing, and presenting data
4.2. Relationship between PMSs and Sustainable Development
5. Conclusions
Author Contributions
Funding
Data Availability Statement
Conflicts of Interest
References
- Dinis-Carvalho, J.; Sousa, R.M.; Moniz, I.; Macedo, H.; Lima, R.M. Improving the Performance of a SME in the Cutlery Sector Using Lean Thinking and Digital Transformation. Sustainability 2023, 15, 8302. [Google Scholar] [CrossRef]
- Klarin, T. The Concept of Sustainable Development: From its Beginning to the Contemporary Issues. Zagreb Int. Rev. Econ. Bus. 2018, 21, 67–94. [Google Scholar] [CrossRef]
- Manioudis, M.; Meramveliotakis, G. Broad strokes towards a grand theory in the analysis of sustainable development: A return to the classical political economy. New Polit. Econ. 2022, 27, 866–878. [Google Scholar] [CrossRef]
- United Nations. Sustainable Development Goals—Teaching Guide and Resources; United Nations: New York, NY, USA, 2018.
- United Nations. Transforming Our World: The 2030 Agenda for Sustainable Development; United Nations: New York, NY, USA, 2016; p. 36.
- Papulová, Z.; Gažová, A.; Šlenker, M.; Papula, J. Performance measurement system: Implementation process in smes. Sustainability 2021, 13, 4794. [Google Scholar] [CrossRef]
- Fantozzi, I.C.; Di Luozzo, S.; Schiraldi, M.M. Industrial Performance Measurement Systems Coherence: A Comparative Analysis of Current Methodologies, Validation and Introduction to Key Activity Indicators. Appl. Sci. 2023, 13, 235. [Google Scholar] [CrossRef]
- Bititci, U.S. Managing Business Performance; Wiley: Hoboken, NJ, USA, 2015. [Google Scholar]
- Cunha, F.; Dinis-Carvalho, J.; Sousa, R.M. Performance Measurement Systems in Continuous Improvement Environments: Obstacles to Their Effectiveness. Sustainability 2023, 15, 867. [Google Scholar] [CrossRef]
- Taticchi, P.; Balachandran, K.; Tonelli, F. Performance measurement and management systems: State of the art, guidelines for design and challenges. Meas. Bus. Excell. 2012, 16, 41–54. [Google Scholar] [CrossRef]
- Yadav, N.; Sushil; Sagar, M. Revisiting performance measurement and management: Deriving linkages with strategic management theories. Int. J. Bus. Perform. Manag. 2014, 15, 87–105. [Google Scholar] [CrossRef]
- Yadav, N.; Sushil; Sagar, M. Performance measurement and management frameworks: Research trends of the last two decades. Bus. Process Manag. J. 2013, 19, 947–971. [Google Scholar] [CrossRef]
- Folan, P.; Browne, J. A review of performance measurement: Towards performance management. Comput. Ind. 2005, 56, 663–680. [Google Scholar] [CrossRef]
- Chorfi, Z.; Benabbou, L.; Berrado, A. An integrated performance measurement framework for enhancing public health care supply chains. Supply Chain Forum 2018, 19, 191–203. [Google Scholar] [CrossRef]
- Moreira, M.; Tjahjono, B. Applying performance measures to support decision-making in supply chain operations: A case of beverage industry. Int. J. Prod. Res. 2016, 54, 2345–2365. [Google Scholar] [CrossRef]
- Franco-Santos, M.; Lucianetti, L.; Bourne, M. Contemporary performance measurement systems: A review of their consequences and a framework for research. Manag. Account. Res. 2012, 23, 79–119. [Google Scholar] [CrossRef]
- Atkinson, M. Developing and using a performance management framework: A case study. Meas. Bus. Excell. 2012, 16, 47–56. [Google Scholar] [CrossRef]
- Sousa, S.; Aspinwall, E. Development of a performance measurement framework for SMEs. Total Qual. Manag. Bus. Excell. 2010, 21, 475–501. [Google Scholar] [CrossRef]
- Ferreira, P.S.; Shamsuzzoha, A.H.M.; Toscano, C.; Cunha, P. Framework for performance measurement and management in a collaborative business environment. Int. J. Product. Perform. Manag. 2012, 61, 672–690. [Google Scholar] [CrossRef]
- Gambelli, D.; Solfanelli, F.; Orsini, S.; Zanoli, R. Measuring the economic performance of small ruminant farms using balanced scorecard and importance-performance analysis: A european case study. Sustainability 2021, 13, 3321. [Google Scholar] [CrossRef]
- Zanon, L.G.; Ulhoa, T.F.; Esposto, K.F. Performance measurement and lean maturity: Congruence for improvement. Prod. Plan. Control 2021, 32, 760–774. [Google Scholar] [CrossRef]
- Frederico, G.F.; Garza-Reyes, J.A.; Kumar, A.; Kumar, V. Performance measurement for supply chains in the Industry 4.0 era: A balanced scorecard approach. Int. J. Product. Perform. Manag. 2021, 70, 789–807. [Google Scholar] [CrossRef]
- Pei, Y.L.; Amekudzi, A.A.; Meyer, M.D.; Barrella, E.M.; Ross, C.L. Performance measurement frameworks and development of effective sustainable transport strategies and indicators. Transp. Res. Rec. 2010, 2163, 73–80. [Google Scholar] [CrossRef]
- Micheli, P.; Kennerley, M. Performance measurement frameworks in public and non-profit sectors. Prod. Plan. Control 2005, 16, 125–134. [Google Scholar] [CrossRef]
- Öz, H.H.; Özyörük, B. Performance measurement in-fourth party reverse logistics. Meas. Bus. Excell. 2021, 27, 549–578. [Google Scholar] [CrossRef]
- Gaiardelli, P.; Saccani, N.; Songini, L. Performance measurement systems in after-sales service: An integrated framework. Int. J. Bus. Perform. Manag. 2007, 9, 145–171. [Google Scholar] [CrossRef]
- Suwignjo, P.; Bititci, U.S.; Carrie, A.S. Quantitative Models for Performance Measurement System. Int. J. Prod. Econ. 2000, 64, 231–241. [Google Scholar] [CrossRef]
- Saleheen, F.; Habib, M.M.; Hanafi, Z. Supply chain performance measurement model: A literature review. Int. J. Supply Chain Manag. 2018, 7, 70–78. [Google Scholar]
- Bai, C.; Sarkis, J. Supply-chain performance-measurement system management using neighbourhood rough sets. Int. J. Prod. Res. 2012, 50, 2484–2500. [Google Scholar] [CrossRef]
- Gimbert, X.; Bisbe, J.; Mendoza, X. The role of performance measurement systems in strategy formulation processes. Long Range Plann. 2010, 43, 477–497. [Google Scholar] [CrossRef]
- Berrah, L.; Clivillé, V. Towards an aggregation performance measurement system model in a supply chain context. Comput. Ind. 2007, 58, 709–719. [Google Scholar] [CrossRef]
- Lauras, M.; Lamothe, J.; Pingaud, H. A business process oriented method to design supply chain performance measurement systems. Int. J. Bus. Perform. Manag. 2011, 12, 354–376. [Google Scholar] [CrossRef]
- Melnyk, S.A.; Stewart, D.M.; Swink, M. Metrics and performance measurement in operations management: Dealing with the metrics maze. J. Oper. Manag. 2004, 22, 209–218. [Google Scholar] [CrossRef]
- Agami, N.; Saleh, M.; Rasmy, M. A hybrid dynamic framework for supply chain performance improvement. IEEE Syst. J. 2012, 6, 469–478. [Google Scholar] [CrossRef]
- Garengo, P. A performance measurement system for SMEs taking part in Quality Award Programmes. Total Qual. Manag. Bus. Excell. 2009, 20, 91–105. [Google Scholar] [CrossRef]
- Dweekat, A.J.; Hwang, G.; Park, J. A supply chain performance measurement approach using the internet of things: Toward more practical SCPMS. Ind. Manag. Data Syst. 2017, 117, 267–286. [Google Scholar] [CrossRef]
- Bhagwat, R.; Sharma, M.K. An application of the integrated AHP-PGP model for performance measurement of supply chain management. Prod. Plan. Control 2009, 20, 678–690. [Google Scholar] [CrossRef]
- Tan, W.A.; Shen, W.; Xu, L.; Zhou, B.; Li, L. A business process intelligence system for enterprise process performance management. IEEE Trans. Syst. Man Cybern. Part C Appl. Rev. 2008, 38, 745–756. [Google Scholar] [CrossRef]
- Laitinen, E.K.; Länsiluoto, A.; Rautiainen, I. Extracting appropriate scope for information systems: A case study. Ind. Manag. Data Syst. 2009, 109, 305–321. [Google Scholar] [CrossRef]
- Taticchi, P.; Garengo, P.; Nudurupati, S.S.; Tonelli, F.; Pasqualino, R. A review of decision-support tools and performance measurement and sustainable supply chain management. Int. J. Prod. Res. 2015, 53, 6473–6494. [Google Scholar] [CrossRef]
- Amir-Heidari, P.; Maknoon, R.; Taheri, B.; Bazyari, M. A new framework for HSE performance measurement and monitoring. Saf. Sci. 2017, 100, 157–167. [Google Scholar] [CrossRef]
- Bititci, U.S.; Suwignjo, P.; Carrie, A.S. Strategy management through quantitative modelling of performance measurement systems. Int. J. Prod. Econ. 2001, 69, 15–22. [Google Scholar] [CrossRef]
- Lee, H.; Han, I.; Kwak, W. Developing a business performance evaluation system: An analytic hierarchical model. Eng. Econ. 1995, 40, 343–357. [Google Scholar] [CrossRef]
- Yurdakul, M. Measuring a manufacturing system’s performance using Saaty’s system with feedback approach. Integr. Manuf. Syst. 2002, 13, 25–34. [Google Scholar] [CrossRef]
- ISO 22400; Automation Systems and Integration. International Organization for Standardization: Geneva, Switzerland, 2014.


| 1. blame culture | 11. false expectations |
| 2. lack of connection to strategy | 12. inappropriate IT tools |
| 3. issues on target definition | 13. excess of indicators |
| 4. unclear system | 14. lack of trained resources |
| 5. lack of top management involvement | 15. lack of employee involvement |
| 6. poor communication system | 16. inappropriate indicators |
| 7. high complexity | 17. lack of indicator understanding |
| 8. lack of use for improvement | 18. time and resources required |
| 9. lack of balance of indicators | 19. difficulties in collecting, analysing, and presenting data |
| 10. lack of rewards |
| Value | Symbol | Meaning |
|---|---|---|
| 0 | ● | Weak capacity to mitigate or eliminate |
| 1 | ● | Some capacity to mitigate or eliminate |
| 2 | ● | Strong capacity to mitigate or eliminate |
| PMS | Number of References | References |
|---|---|---|
| Balanced Scorecard | 28 | [10,11,12,13,14,15,16,17,18,19,20,21,22,23,24,25,26,27,28,29,30,31,32,33,34,35,36,37] |
| Performance prism | 15 | [10,11,12,13,16,17,19,21,23,24,25,28,29,30,32] |
| Performance pyramid (SMART) | 14 | [10,11,13,17,21,25,26,27,28,29,30,31,38,39] |
| SCOR MODEL | 12 | [14,18,19,22,25,28,29,31,32,34,36,40] |
| Activity based costing | 7 | [10,27,28,31,32,34,38] |
| Results and determinants framework | 7 | [10,11,12,13,17,26,38] |
| Integrated Performance and Measurement framework (IPMF) | 6 | [10,11,12,13,14,41] |
| EFQM model | 6 | [10,11,12,13,25,26] |
| Performance Measurement Questionnaire (PMQ) | 5 | [10,11,15,27,32] |
| Economic Value-Added Model (EVA) | 4 | [10,11,12,34] |
| Performance Measurement Matrix | 4 | [11,17,21,26] |
| Integrated Performance Measurement System (IPMS) | 3 | [10,11,12] |
| Performance Planning Value Chain (PPVC) | 3 | [10,11,12] |
| ECOGRAI | 3 | [15,31,32] |
| Theory of constraints (TOC) measurement system | 3 | [25,33,34] |
| Action-Profit Linkage Model (APL) | 3 | [10,11,12] |
| Dynamic Performance Measurement System (DPMS) | 3 | [10,11,12] |
| Quantitative model for performance measurement system (QMPMS) | 3 | [12,27,42] |
| Analytic Hierarchical Performance Model | 2 | [43,44] |
| Dynamic multidimensional performance framework | 2 | [11,12] |
| Flexible strategy game-card | 2 | [11,12] |
| AMBITE | 2 | [13,38] |
| Kanji’s business scorecard | 2 | [11,12] |
| Cambridge Performance Measurement Framework (CPMF) | 2 | [10,32] |
| Brown’s framework | 2 | [13,17] |
| DuPont model | 2 | [11,33] |
| Sustainability performance measurement system | 2 | [11,12] |
| Holistic performance management framework | 2 | [11,12] |
| PMS | 1 | 2 | 3 | 4 | 5 | 6 | 7 | 8 | 9 | 10 | 11 | 12 | 13 | 14 | 15 | 16 | 17 | 18 | 19 |
|---|---|---|---|---|---|---|---|---|---|---|---|---|---|---|---|---|---|---|---|
| Balanced Scorecard | ● | ● | ● | ● | ● | ● | ● | ● | ● | ● | ● | ● | ● | ● | ● | ● | ● | ● | ● |
| Performance prism | ● | ● | ● | ● | ● | ● | ● | ● | ● | ● | ● | ● | ● | ● | ● | ● | ● | ● | ● |
| Performance pyramid (SMART) | ● | ● | ● | ● | ● | ● | ● | ● | ● | ● | ● | ● | ● | ● | ● | ● | ● | ● | ● |
| Supply Chain Operations Reference (SCOR) Model | ● | ● | ● | ● | ● | ● | ● | ● | ● | ● | ● | ● | ● | ● | ● | ● | ● | ● | ● |
| Activity based costing (ABC) | ● | ● | ● | ● | ● | ● | ● | ● | ● | ● | ● | ● | ● | ● | ● | ● | ● | ● | ● |
| Results and determinants framework | ● | ● | ● | ● | ● | ● | ● | ● | ● | ● | ● | ● | ● | ● | ● | ● | ● | ● | ● |
| Integrated Performance and Measurement framework (IPMF) | ● | ● | ● | ● | ● | ● | ● | ● | ● | ● | ● | ● | ● | ● | ● | ● | ● | ● | ● |
| European Foundation for Quality Management (EFQM) Model | ● | ● | ● | ● | ● | ● | ● | ● | ● | ● | ● | ● | ● | ● | ● | ● | ● | ● | ● |
| Performance Measurement Questionnaire (PMQ) | ● | ● | ● | ● | ● | ● | ● | ● | ● | ● | ● | ● | ● | ● | ● | ● | ● | ● | ● |
| Economic Value-Added Model (EVA) | ● | ● | ● | ● | ● | ● | ● | ● | ● | ● | ● | ● | ● | ● | ● | ● | ● | ● | ● |
| Performance Measurement Matrix | ● | ● | ● | ● | ● | ● | ● | ● | ● | ● | ● | ● | ● | ● | ● | ● | ● | ● | ● |
| Integrated Performance Measurement System (IPMS) | ● | ● | ● | ● | ● | ● | ● | ● | ● | ● | ● | ● | ● | ● | ● | ● | ● | ● | ● |
| Performance Planning Value Chain (PPVC) | ● | ● | ● | ● | ● | ● | ● | ● | ● | ● | ● | ● | ● | ● | ● | ● | ● | ● | ● |
| ECOGRAI | ● | ● | ● | ● | ● | ● | ● | ● | ● | ● | ● | ● | ● | ● | ● | ● | ● | ● | ● |
| Theory of constraints (TOC) measurement system | ● | ● | ● | ● | ● | ● | ● | ● | ● | ● | ● | ● | ● | ● | ● | ● | ● | ● | ● |
| Action-Profit Linkage Model (APL) | ● | ● | ● | ● | ● | ● | ● | ● | ● | ● | ● | ● | ● | ● | ● | ● | ● | ● | ● |
| Dynamic Performance Measurement System (DPMS) | ● | ● | ● | ● | ● | ● | ● | ● | ● | ● | ● | ● | ● | ● | ● | ● | ● | ● | ● |
| Quantitative model for performance measurement system (QMPMS) | ● | ● | ● | ● | ● | ● | ● | ● | ● | ● | ● | ● | ● | ● | ● | ● | ● | ● | ● |
| Analytic Hierarchical Performance Model | ● | ● | ● | ● | ● | ● | ● | ● | ● | ● | ● | ● | ● | ● | ● | ● | ● | ● | ● |
| Dynamic multidimensional performance framework | ● | ● | ● | ● | ● | ● | ● | ● | ● | ● | ● | ● | ● | ● | ● | ● | ● | ● | ● |
| Flexible strategy game-card | ● | ● | ● | ● | ● | ● | ● | ● | ● | ● | ● | ● | ● | ● | ● | ● | ● | ● | ● |
| AMBITE | ● | ● | ● | ● | ● | ● | ● | ● | ● | ● | ● | ● | ● | ● | ● | ● | ● | ● | ● |
| Kanji’s business scorecard | ● | ● | ● | ● | ● | ● | ● | ● | ● | ● | ● | ● | ● | ● | ● | ● | ● | ● | ● |
| Cambridge Performance Measurement Framework (CPMF) | ● | ● | ● | ● | ● | ● | ● | ● | ● | ● | ● | ● | ● | ● | ● | ● | ● | ● | ● |
| Brown’s framework | ● | ● | ● | ● | ● | ● | ● | ● | ● | ● | ● | ● | ● | ● | ● | ● | ● | ● | ● |
| DuPont model | ● | ● | ● | ● | ● | ● | ● | ● | ● | ● | ● | ● | ● | ● | ● | ● | ● | ● | ● |
| Sustainability performance measurement system | ● | ● | ● | ● | ● | ● | ● | ● | ● | ● | ● | ● | ● | ● | ● | ● | ● | ● | ● |
| Holistic performance management framework | ● | ● | ● | ● | ● | ● | ● | ● | ● | ● | ● | ● | ● | ● | ● | ● | ● | ● | ● |
Disclaimer/Publisher’s Note: The statements, opinions and data contained in all publications are solely those of the individual author(s) and contributor(s) and not of MDPI and/or the editor(s). MDPI and/or the editor(s) disclaim responsibility for any injury to people or property resulting from any ideas, methods, instructions or products referred to in the content. |
© 2024 by the authors. Licensee MDPI, Basel, Switzerland. This article is an open access article distributed under the terms and conditions of the Creative Commons Attribution (CC BY) license (https://creativecommons.org/licenses/by/4.0/).
Share and Cite
Cunha, F.; Dinis-Carvalho, J.; Sousa, R.M. Assessment of Performance Measurement Systems’ Ability to Mitigate or Eliminate Typical Barriers Compromising Organisational Sustainability. Sustainability 2024, 16, 2173. https://doi.org/10.3390/su16052173
Cunha F, Dinis-Carvalho J, Sousa RM. Assessment of Performance Measurement Systems’ Ability to Mitigate or Eliminate Typical Barriers Compromising Organisational Sustainability. Sustainability. 2024; 16(5):2173. https://doi.org/10.3390/su16052173
Chicago/Turabian StyleCunha, Flávio, José Dinis-Carvalho, and Rui M. Sousa. 2024. "Assessment of Performance Measurement Systems’ Ability to Mitigate or Eliminate Typical Barriers Compromising Organisational Sustainability" Sustainability 16, no. 5: 2173. https://doi.org/10.3390/su16052173
APA StyleCunha, F., Dinis-Carvalho, J., & Sousa, R. M. (2024). Assessment of Performance Measurement Systems’ Ability to Mitigate or Eliminate Typical Barriers Compromising Organisational Sustainability. Sustainability, 16(5), 2173. https://doi.org/10.3390/su16052173