Article

Helically Coiled Tube Flocculators in Water Clarification Systems: Optimal Length Evaluation and Process Efficiency Probabilistic Analysis

by
Danieli S. Oliveira
1,*,† and
Clainer B. Donadel
2,†
1
Federal Institute of Espírito Santo, Campus Cariacica, Rodovia Governador José Sette, 184, Cariacica 29150-410, Brazil
2
Federal Institute of Espírito Santo, Campus Vitória, Avenida Vitória, 1.729, Vitória 29040-780, Brazil
*
Author to whom correspondence should be addressed.
These authors contributed equally to this work.
Sustainability 2024, 16(5), 2172; https://doi.org/10.3390/su16052172
Submission received: 21 August 2023 / Revised: 24 October 2023 / Accepted: 30 October 2023 / Published: 6 March 2024
(This article belongs to the Special Issue Advanced Technologies for Sustainable Water Distribution Systems)

Abstract

:
New sustainable technologies have been explored as potential solutions to address the global issue of water scarcity by enhancing water treatment processes. In this context, an innovative coagulation/flocculation unit known as the helically coiled tube flocculator (HCTF) has emerged, offering notable advantages such as high process efficiency, short detention time, and cost-effectiveness compared to conventional hydraulic units. The HCTF harnesses its flow energy to disperse coagulation/flocculation agents and facilitate the formation of flocs through collisions between destabilized particles. This paper introduces an assessment of the process efficiency, geometric properties, and hydraulic characteristics of an alternative and sustainable water clarification system incorporating an HCTF, with the aim of determining its optimal length. In HCTFs, the flocculator’s length (referred to as L) can exert a significant influence on process efficiency, necessitating a comprehensive evaluation of this parameter for the rational design of such units. To accomplish this, the paper scrutinizes physical experimental findings from previous research articles, which are related to the efficiency of flocculation (indirectly estimated by analyzing turbidity removal efficiency). Additionally, it examines the geometric and hydraulic attributes across 48 distinct variations of HCTFs. This study culminates in the development of a model for determining the optimal length for HCTFs. Furthermore, it includes a probabilistic assessment that establishes a connection between the optimal length and other parameters involved in the clarification process—whether deterministic or probabilistic—and their impact on the final process efficiency, all with a 90% confidence level. This paper stands out by pioneering the determination of the optimal length of HCTFs, filling a gap in the existing literature, which previously only mentioned the importance of this parameter in process efficiency without providing a predictive model. The results highlight the robustness of the proposed alternative clarification system. Even in scenarios with substantial variations in dimensional hydraulic parameters (such as a worst-case relative standard deviation of 20%), the process efficiency fluctuations range between 1.3% and 5.2%. These outcomes lend support to the adoption of such alternative water clarification systems. They also underscore the potential of probabilistic evaluation as a valuable tool for investigating novel water and wastewater treatment units and enhancing existing ones.

1. Introduction

At present, the number of people without access to clean drinking water at home is 2.1 billion globally [1]. These data highlight the need for attention to the basic sanitation of the global population, as it brings direct benefits to the population across various public domains, particularly in health. Basic sanitation is a major concern in public health, especially in low- and middle-income countries, and is considered a significant environmental determinant of health [2]. Adequate availability of water in both quantity and quality serves as a preventive measure against diseases, a principle that is also evident in sanitation services, public hygiene, solid waste management, and urban drainage.
Among the technical justifications underscoring the significance of basic sanitation, several key points are notable: the adverse externalities stemming from the lack of sanitation, which impact not only those without access but also those with access; the detrimental effects on public health, encompassing both increased morbidity and mortality rates (positioning sanitation within the purview of welfare policies); and additionally, the economic repercussions, given that sanitation is an integral component of economic infrastructure and therefore a pivotal element in policies oriented toward development [3].
Even in regions with access to fundamental sanitation, especially when it comes to clean drinking water supply, it is crucial to meticulously evaluate the unwanted byproducts generated in the process. In the conventional methods used to produce drinking water, waste is generated due to impurities present in the raw water and the use of chemical substances. Beyond environmental concerns, the utilization of chemical coagulants (typically aluminum and iron salts) can endanger the well-being of individuals who consume the treated water. Depending on the buildup of aluminum levels in the body, it can become toxic and result in substantial health issues, including motor coordination impairments, Alzheimer’s, and Parkinson’s disease [4].
Water resource management is becoming one of the most critical challenges of the 21st century for humanity. The combination of population growth, economic advancement, and the expansion of irrigated agriculture has resulted in a substantial surge in water consumption. Statistics show that the world population will continue to grow in the next few decades [5]; therefore, as water becomes scarcer and more contaminated, advanced technologies are needed to provide clean water [6].
New sustainable technologies to drive water treatment processes have been studied as a potential solution to minimize the global issue of water scarcity. The application of solar energy in water treatment [7,8], new methods to remove pesticide residues [9,10], magnetic water treatment [11,12], membrane separation technologies [13,14,15,16], and electrocoagulation [17,18], among others, have been thoroughly studied. Nevertheless, conventional water treatment methods continue to be used and improved upon (in particular, coagulation and flocculation processes).
Coagulation is a chemical step wherein suspended particles are destabilized by coagulants, which can be chemical (like aluminum sulfate) or natural (like Moringa oleifera seeds). Flocculation is a physical step in which destabilized particles collide, and flocs are formed for posterior solid–liquid separation by sedimentation or flotation.
An alternative coagulation/flocculation unit with high process efficiency, low detention time, and low construction/maintenance costs (compared to conventional hydraulic units) is the helically coiled tube flocculator—HCTF [19,20,21,22,23,24,25,26,27]. The HCTF flow energy is used to disperse coagulation/flocculation reagents and promote floc formation through collisions between destabilized particles. Mechanized equipment is not necessary for this type of unit, making HCTF an alternative with easy handling and low cost of installation and maintenance. This type of unit is suitable for remote communities, on a small scale, and/or those that do not have access to the public water supply system.
Previous work ascribes the efficiency of the HCTF process to its hydraulic, hydrodynamic, and geometrical parameters, and their modus operandi—initial fluid characteristics, concentration of reagents, etc. [25]. An essential geometric parameter that significantly influences the efficiency of the treatment process in HCTFs is reactor length ( L ). L is directly related to the detention time, which influences the interaction of particles destabilized by coagulation; if the unit length (and consequently process time) is insufficient/low, unsatisfactory formation of flocs will occur and the subsequent phase process will be impaired. If the unit length (and consequently process time) is too high, the previously formed flocs can be broken within the unit, reducing the efficiency of the process.
Despite the importance of the L parameter for the efficiency of clarification systems composed of HCTFs, its evaluation is commonly neglected by researchers. Most studies that use HCTFs for water clarification do not consider that variations in this parameter can significantly influence the final process efficiency. An exception to this is the work of Oliveira and Teixeira [24], which evaluated the effect of variations in reactor length on turbidity removal efficiency and obtained an optimal range of values for different values of flow and tube diameter. However, this work does not describe the process for obtaining this optimal length for other HCTFs.
Another study by Oliveira et al. considered reactor length in HCTFs [25] and proposed models for predicting the turbidity removal efficiency based on geometric, hydraulic, and hydrodynamic parameters. Reactor length was among the evaluated geometric parameters; however, this parameter was only an input variable in the model, and it was not possible to obtain its value using the proposed models. In addition, variations in the input parameters of the models were not considered, and a deterministic simulation model was obtained. Such a deterministic analysis cannot be consistent with operational reality in water treatment plants, where parameters, such as flow rate, continuously change.
Based on this information, this paper proposes a model to predict the optimal length in HCTFs to support a rational alternative water clarification system composed of this type of reactor, which has not been previously documented in the literature. This paper stands out by pioneering the determination of the optimal length of HCTFs, filling a gap in the existing literature that previously only mentioned the importance of this parameter in process efficiency without providing a predictive model for this parameter or conducting a detailed probabilistic analysis of process efficiency behavior as a function of hydraulic parameters after defining this optimum value. The flocculation process efficiency (indirectly estimated via turbidity removal efficiency) and various geometric and hydraulic characteristics were considered by physical modeling, using data obtained from the analysis performed by Oliveira et al. [24,25]. In addition, a probabilistic evaluation that correlates optimum length and other parameters involved in this process, whether deterministic or probabilistic, was performed to analyze their influence on process efficiency.

2. Materials and Methods

The methodology used during this research is divided into two parts: (a) physical modeling/experimental apparatus (including characteristics of the HCTFs used in this work and the apparatus needed to obtain experimental data of turbidity removal efficiency), and (b) mathematical/statistical modeling (with probabilistic analysis of the optimal values of turbidity removal efficiency).

2.1. Physical Modeling/Experimental Apparatus

The experimental data used in this paper were obtained from the work of Oliveira et al. [24], conducted in a system built by the authors in the Federal Institute of Espírito Santo/Brazil. The experimental apparatus used in that study [
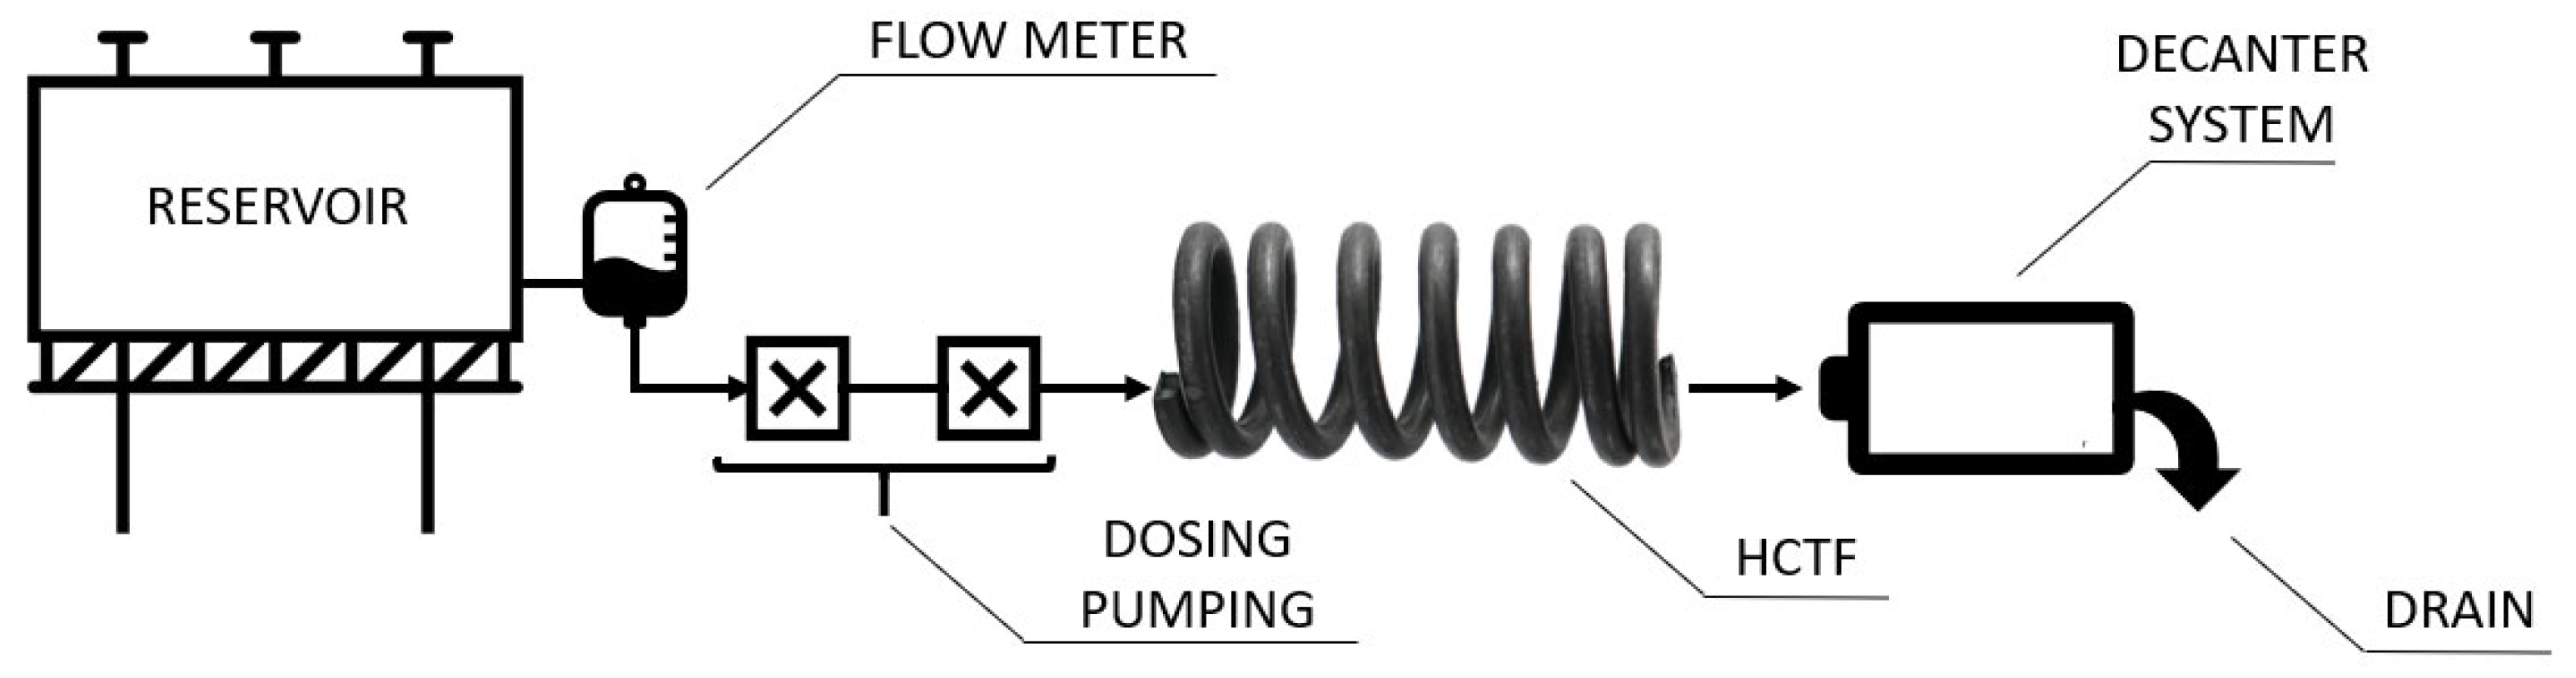
24] included a reservoir of synthetic water, flow meter, dosing pumping system for chemical agents, flocculator (HCTF), decanter system, and drain (for fluid disposal). A representative schematic of the experimental apparatus used by Oliveira et al. [24] is shown in Figure 1. A brief description of the apparatus and the HCTF-tested setups are presented below.
Initially, synthetic water was prepared using bentonite and water. The turbidity of this synthetic water was the same for all tests (50 UNT). This fluid was then placed in a reservoir for the subsequent measurement of its flow rate. Flow rate values used for each test are listed in Table 1, along with the geometric characteristics of HCTFs used in the experimental tests. Subsequently, chemical agents (coagulants and alkalizing aluminum sulfate and sodium hydroxide) enter the hydraulic circuit through dosing pumps, and the fluid is routed to the coagulation/flocculation unit, i.e., the HCTF. The hydrodynamic behavior verified in this unit favors the formation of flocs, which are separated by sedimentation in the settling system (decanter system) located downstream of the HCTF. Samples for evaluating the turbidity removal efficiency were obtained at this stage, and the fluid was then discarded through the drain at the end of the circuit.
To ensure that the hydraulic and geometric characteristics of the decanter system do not influence the final efficiency of the turbidity removal process, a single decanter was used in all the experiments. Moreover, the decanter was designed to be sensitive to changes in the HCTF, meaning that it was not designed to operate at its maximum efficiency under any condition.
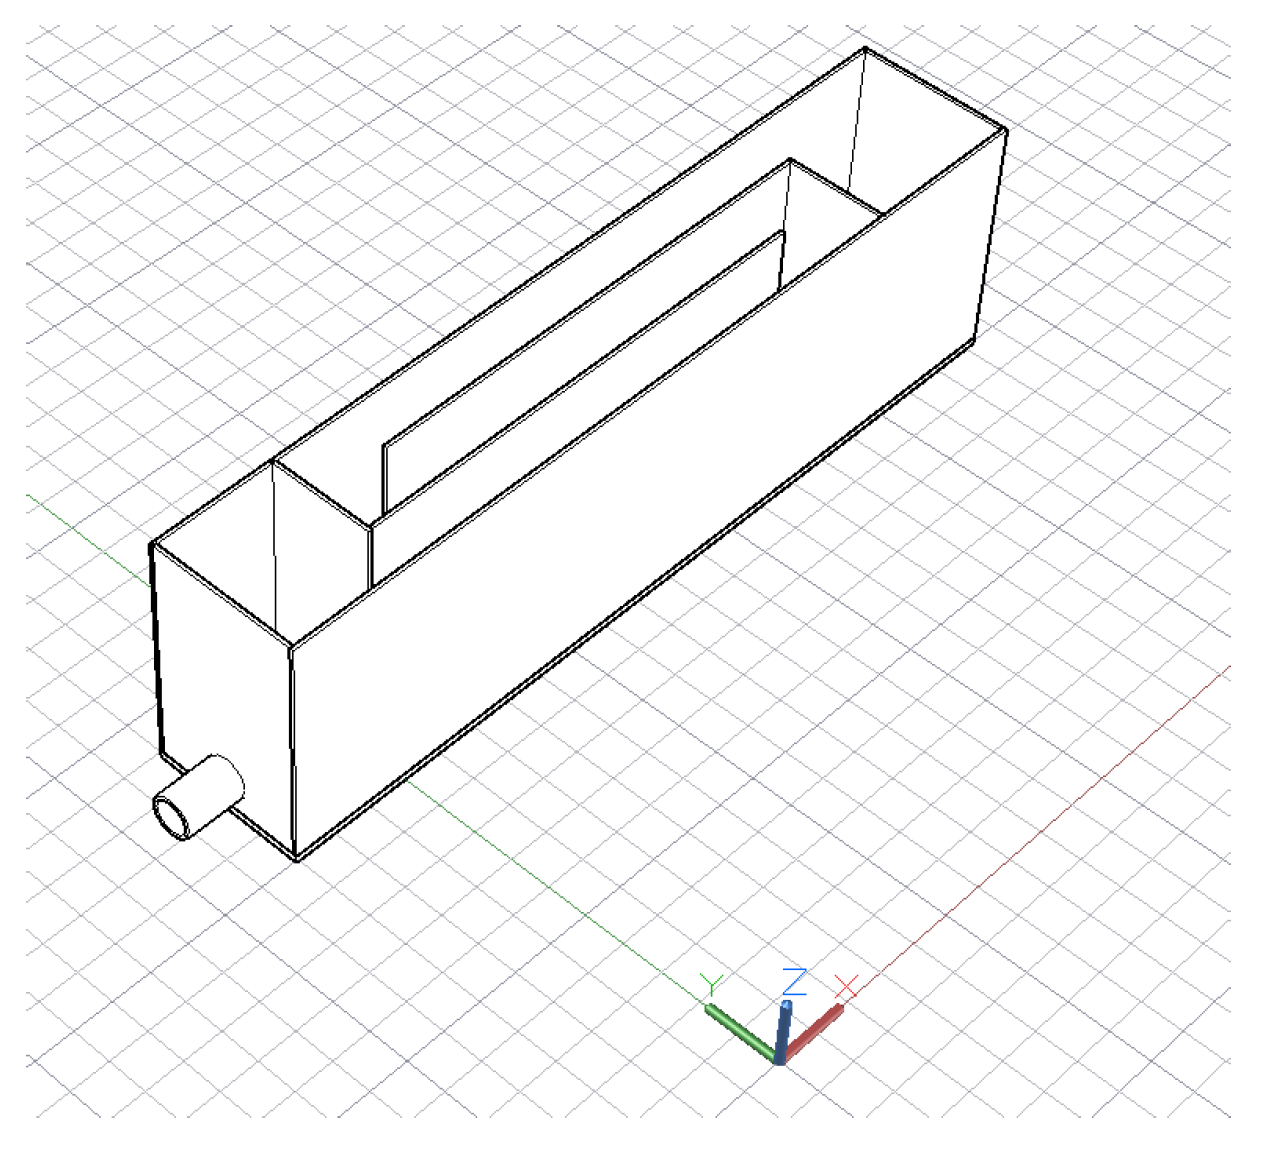
The decanter system consists of a rectangular tank of 3.76 × 10⁻³ m3 volume, with horizontal flow, composed of an entrance compartment, three compartments defined from baffles, and an outlet compartment, where samples were collected to analyze the remaining turbidity. The decanter design was based on the detention time, flow velocity, flow rate, and inlet and outlet devices following the methodology described in [28]. The material used in the external walls was transparent polystyrene and the baffles were produced with plastic plates of 1.5 mm thickness, with heights of the inflow and outflow spouts equal to 10 and 8 cm, respectively. Figure 2 shows the main geometric characteristics of the decanter.

2.2. HCTF Setups

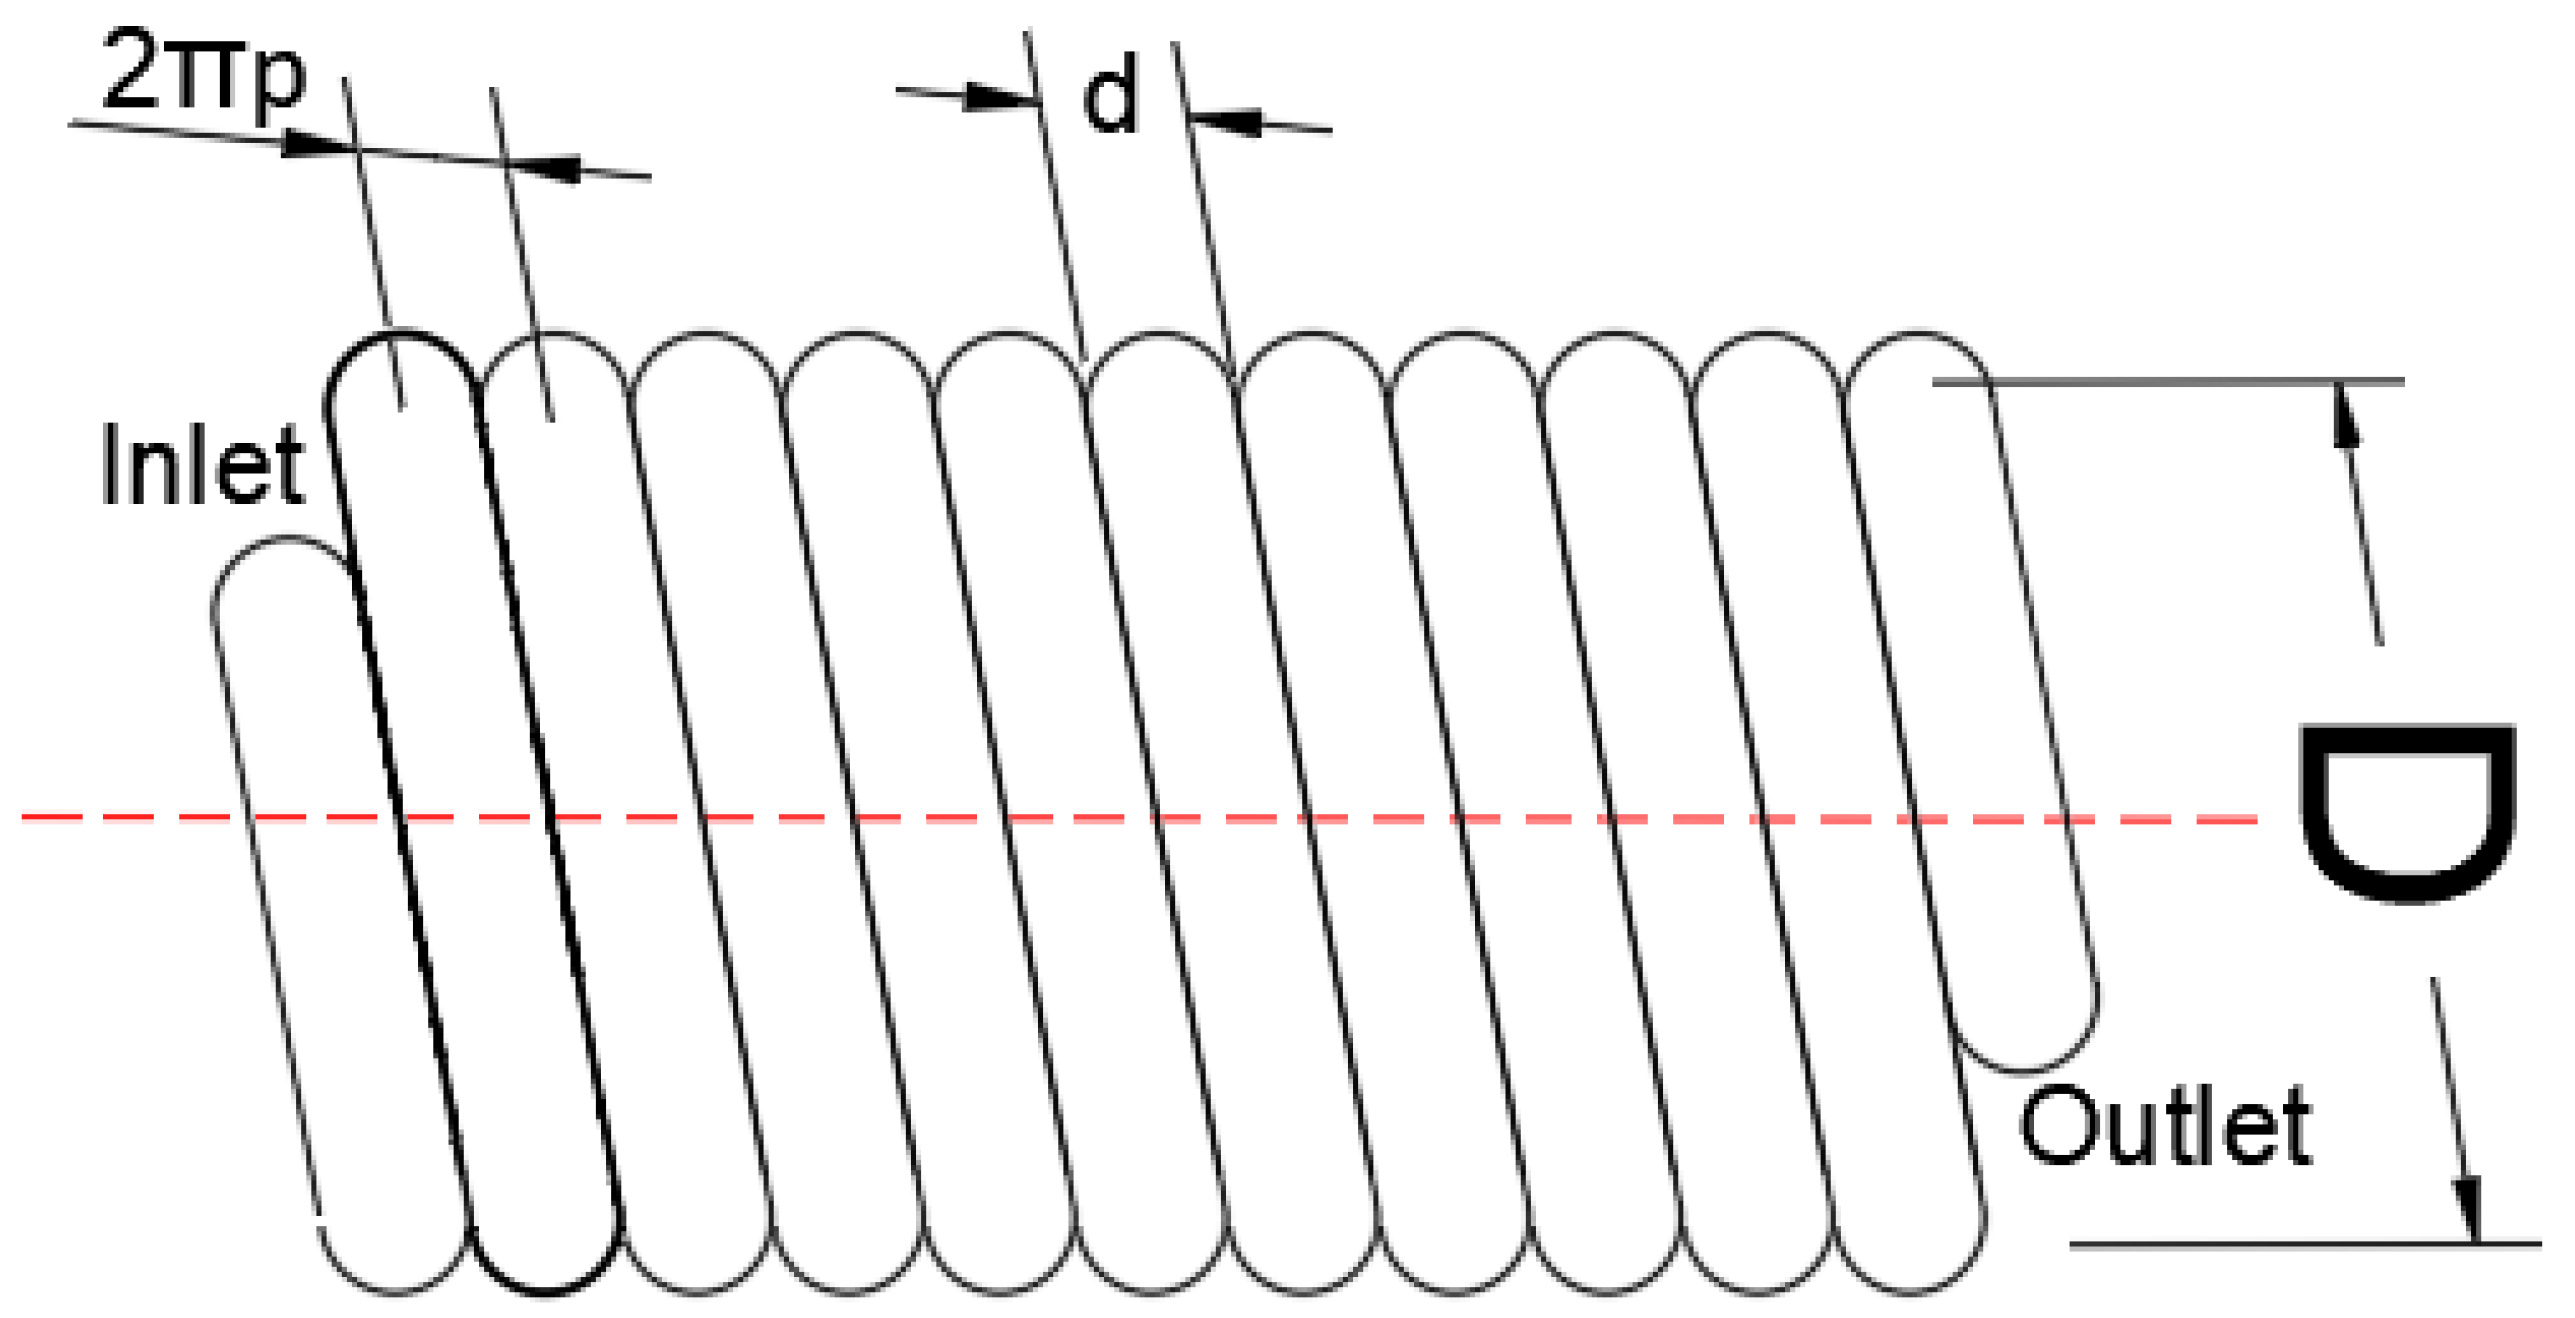
The coagulation–flocculation system used in the aforementioned study was the HCTF: a hydraulic reactor that consists of a flexible, transparent polyvinyl-chloride (PVC) hose wrapped around a rigid PVC tube. A schematic representation of an HCTF is shown in Figure 3, which displays the geometric characteristics d (tube diameter), D (curvature diameter), and p (pitch). The HCTFs used in this study had distinct geometric and hydraulic characteristics, as shown in Table 1.
Two flow rate values were tested for the three arrangements analyzed in this study, totaling six configurations. The geometric parameters d , D , and p have constant values for each configuration, while the length varies. Eight length values were tested for each configuration, totaling 48 tests. These settings were defined to verify the influence of flow rate and length on turbidity removal efficiency in HCTFs.

2.3. Mathematical and Statistical Modeling

Oliveira et al. [25] conducted a dimensional analysis of the factors affecting HCTFs to establish the dimensionless parameters that best represent the coagulation–flocculation process. These parameters were classified into two categories: hydraulic parameters and geometric parameters (derived from overall characteristics). This study focused on assessing the efficiency of turbidity removal as the dependent variable. The dimensionless parameters can be found in Table 2.
In this study [25], models relating turbidity removal efficiency to the dimensionless parameters (presented in Table 2) were proposed using linear and non-linear regression and artificial neural networks. A linear regression model was used in this study as a basis to obtain the model for optimal length.
Finally, a probabilistic analysis was performed. All hydraulic parameters were considered independent probabilistic variables, being modeled as a probability density function. A probability density function p ( x ) is a non-negative real number following 2 properties: p x > 0     x and p x = 1 . All probabilistic variables were modeled using lognormal probability density functions, commonly used for non-negative variables. As a result, a probability density function of E f was built considering four different scenarios of relative standard deviation (RSD), 5%, 10%, 15%, and 20%. The confidence interval was 90%. The probabilistic approach was performed using MATLAB (Version R2018a)®.

3. Results

3.1. Mathematical Modeling—Optimal Length

The linear regression model obtained by Oliveira et al. [25] is given as Equation (1):
E f = c 1 c 2 C a c 3 R e c 4 p L + c 5 D d
where
  • c 1 ,   c 2 ,…,   c 5 : Positive constants
After performing substitutions shown in Equation (2),
T = L / v m v m = Q / A = 4 Q / π d 2 C a = G T = G L / v m = G L π d 2 / 4 Q R e = ρ v m d / μ = 4 ρ Q / μ π d
where
  • T : Detention time
    v m : Average velocity
    ρ :  Specific mass
    μ :  Dynamic viscosity
    G : Velocity gradient
Equation (1) can be rewritten by expanding the geometric and hydraulic parameters to express the turbidity removal efficiency as a function of elementary variables, resulting in Equation (3):
E f = c 1 c 2 G L π d 2 4 Q c 3 4 ρ Q μ π d c 4 p L + c 5 D d
To determine the critical numbers in Equation (3), its first-order derivative with respect to L is set to zero, resulting in Equation (4):
d E f d L = E f = c 2 G π d 2 4 Q + c 4 p L 2 = 0 c 4 p L 2 = c 2 G π d 2 4 Q c 10 c 4 p L 2 = c 10 L 2 = c 4 p c 10 L = L c r i t i c a l = + c 4 p c 10
In Equation (4), the parameter c 10 is always positive because c 2 , G , and Q are positive real variables. Furthermore, L is a positive real variable. In this case, the values of L when L 0 can be ignored. The increasing/decreasing test of the first-order derivative can be applied to Equation (4), as shown in Table 3.
The concavity test can be applied using the second-order derivative of Equation (3), resulting in Equation (5):
E f = 2 c 4 p L 3
In Equation (5), L > 0 , c 4 > 0 , and p > 0 . Therefore, E f < 0 . Thereby, E f has concave downward trending at intervals [ 0 , + ] and L c r i t i c a l represents the maximum of E f function. The general behavior of E f as a function of L is shown in Figure 4.

3.2. Probabilistic Analysis

Once the optimal length is defined, the HCTF is built with a known length ( L = L c r i t i c a l ). Therefore, after this step, L becomes a constant in the proposed model. However, hydraulic parameters can vary, affecting the process efficiency of an already-built HCTF. A probabilistic approach is proposed to assess this impact. In this probabilistic approach, all dimensional geometric parameters ( d , D , p , and L ) and model coefficients ( c 1 , c 2 ,…, c 5 ) are considered constants. All dimensional hydraulic parameters ( G and Q ) are considered independent probabilistic variables, modeled through lognormal probability density functions, and are recommended in the existing literature to model non-negative variables—see Equation (6).
f x , μ , σ = 1 x σ 2 π e x p l n x μ ¯ 2 2 σ 2
where
  • μ ¯ :  Average value
    σ : Standard deviation
    x :  Random variable value
The proposed methodology was applied to the six configurations listed in Table 1. The results of configurations #1 to #6 are presented in Table 4, Table 5, Table 6, Table 7 and Table 8 and Figure 5, Figure 6, Figure 7 and Figure 8.

4. Discussion

The optimal length data for each configuration are listed in Table 4. 
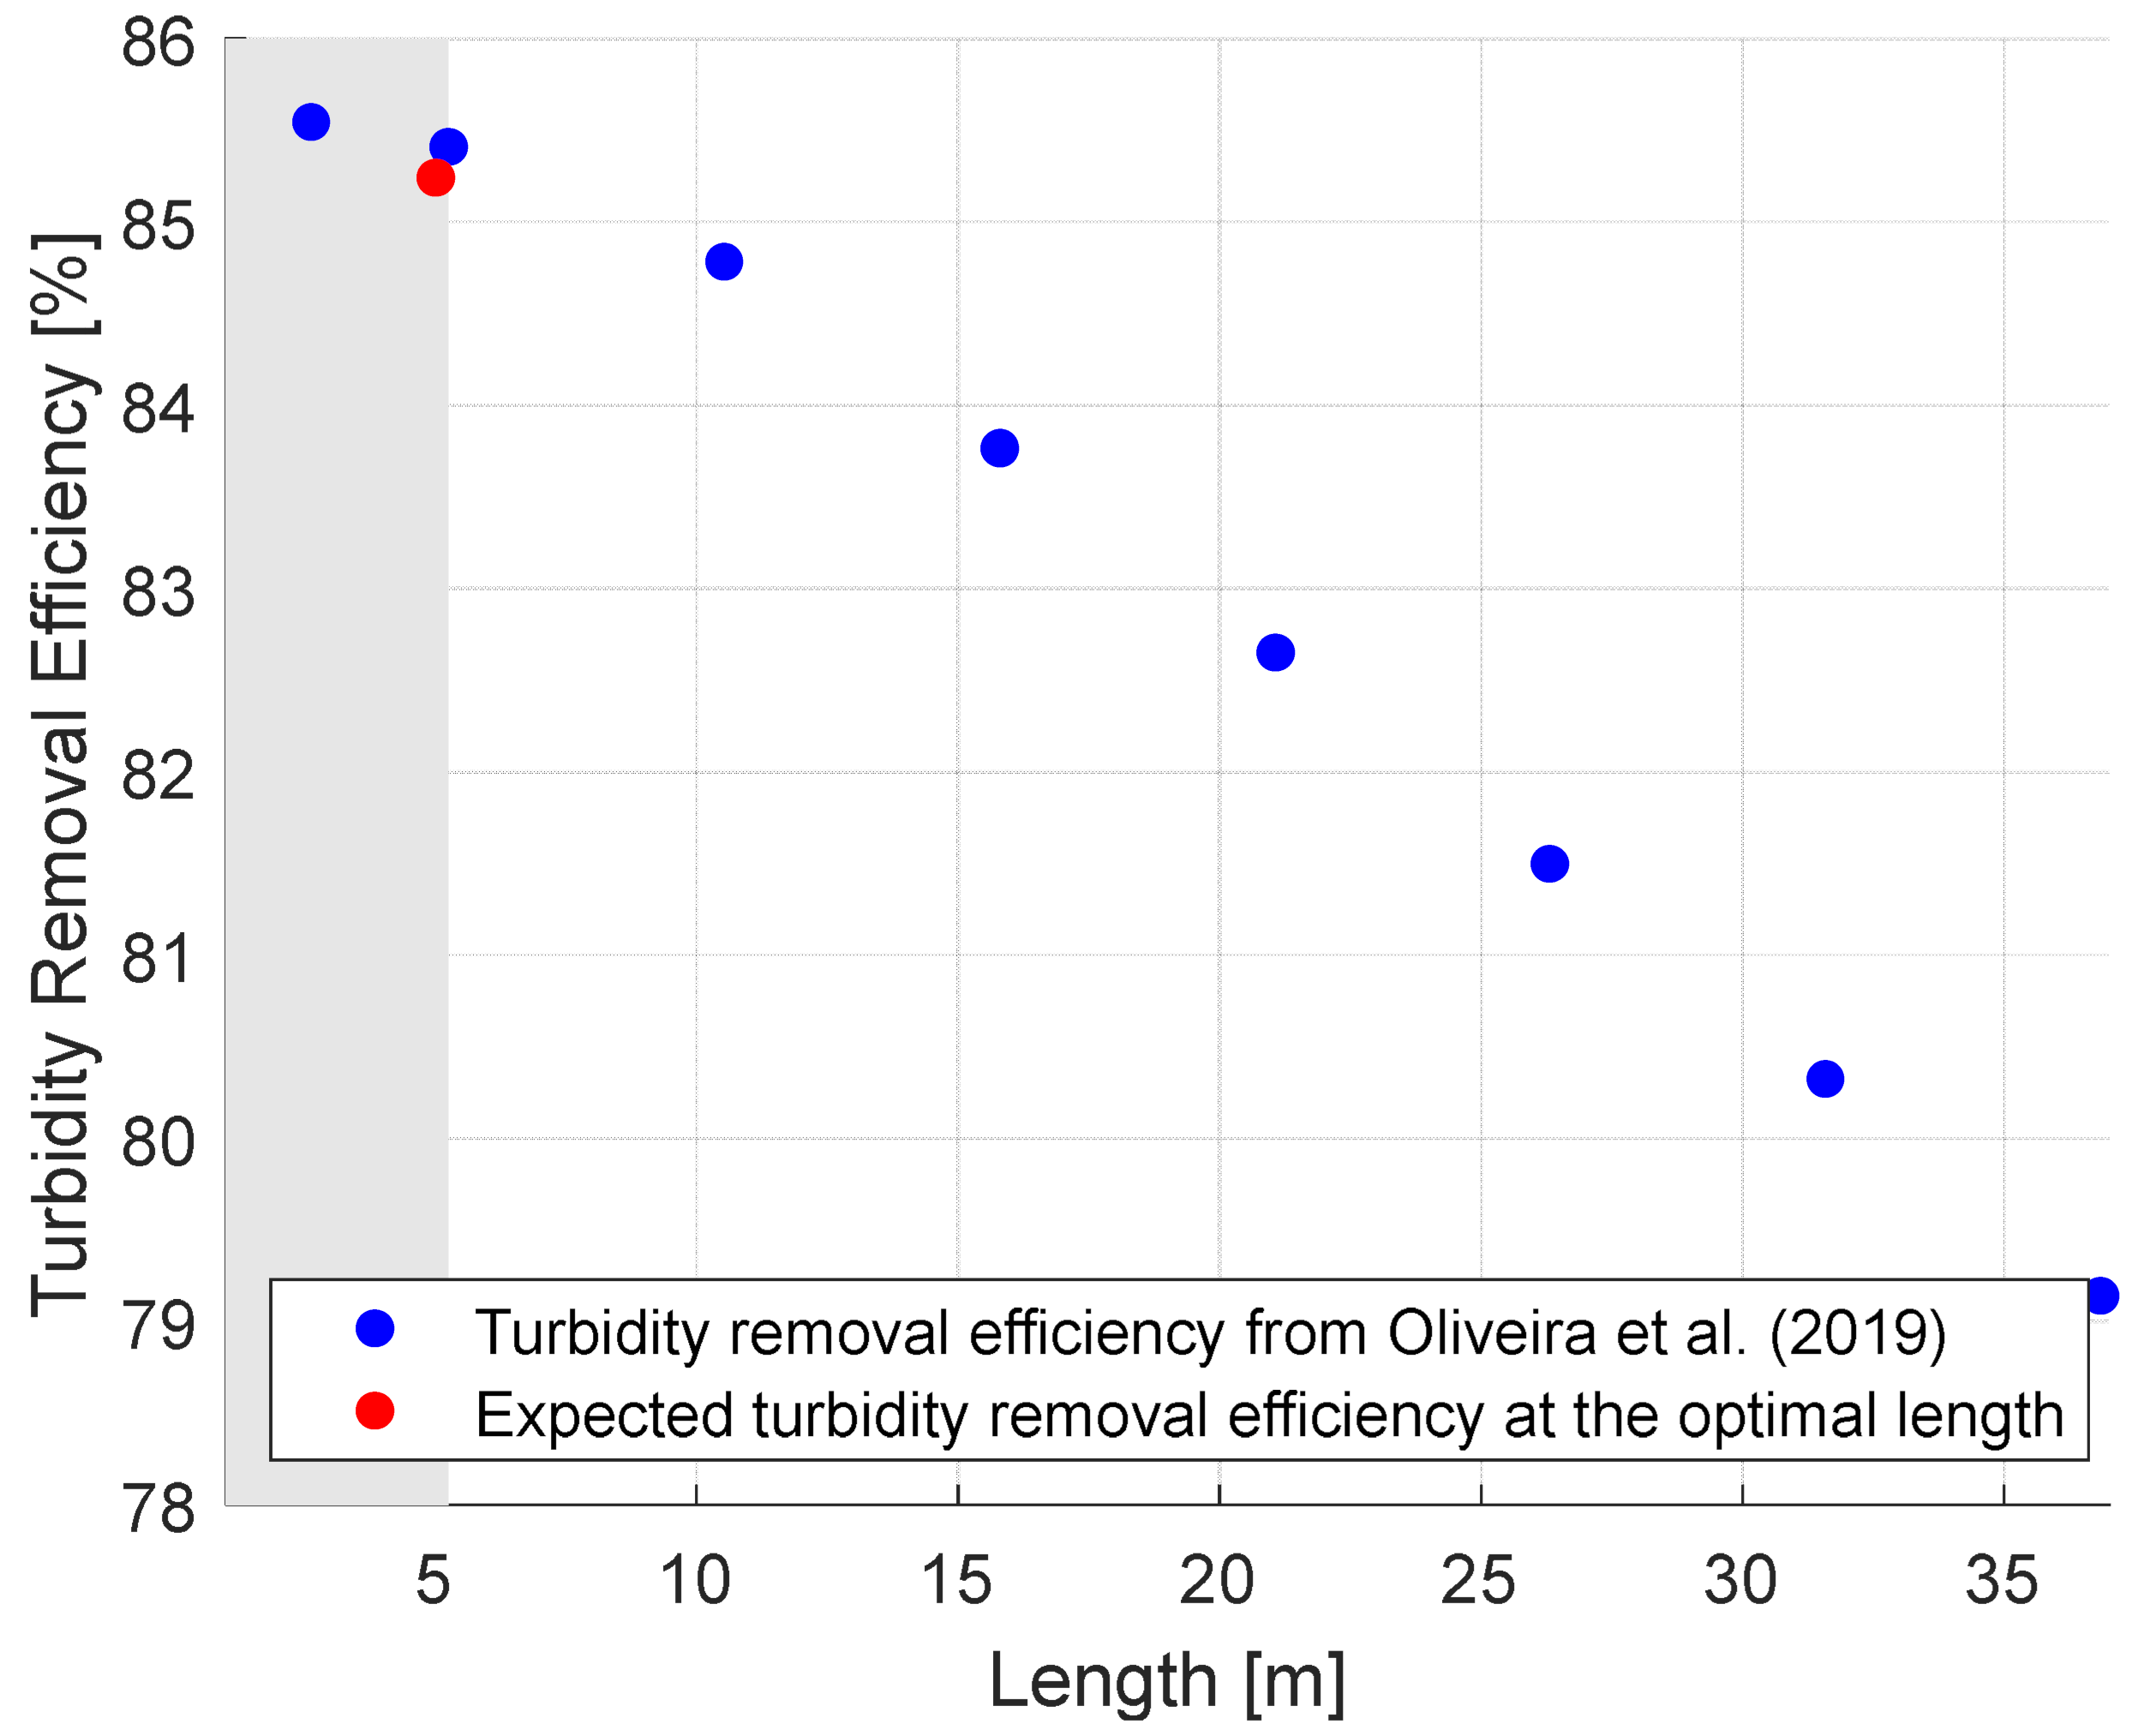
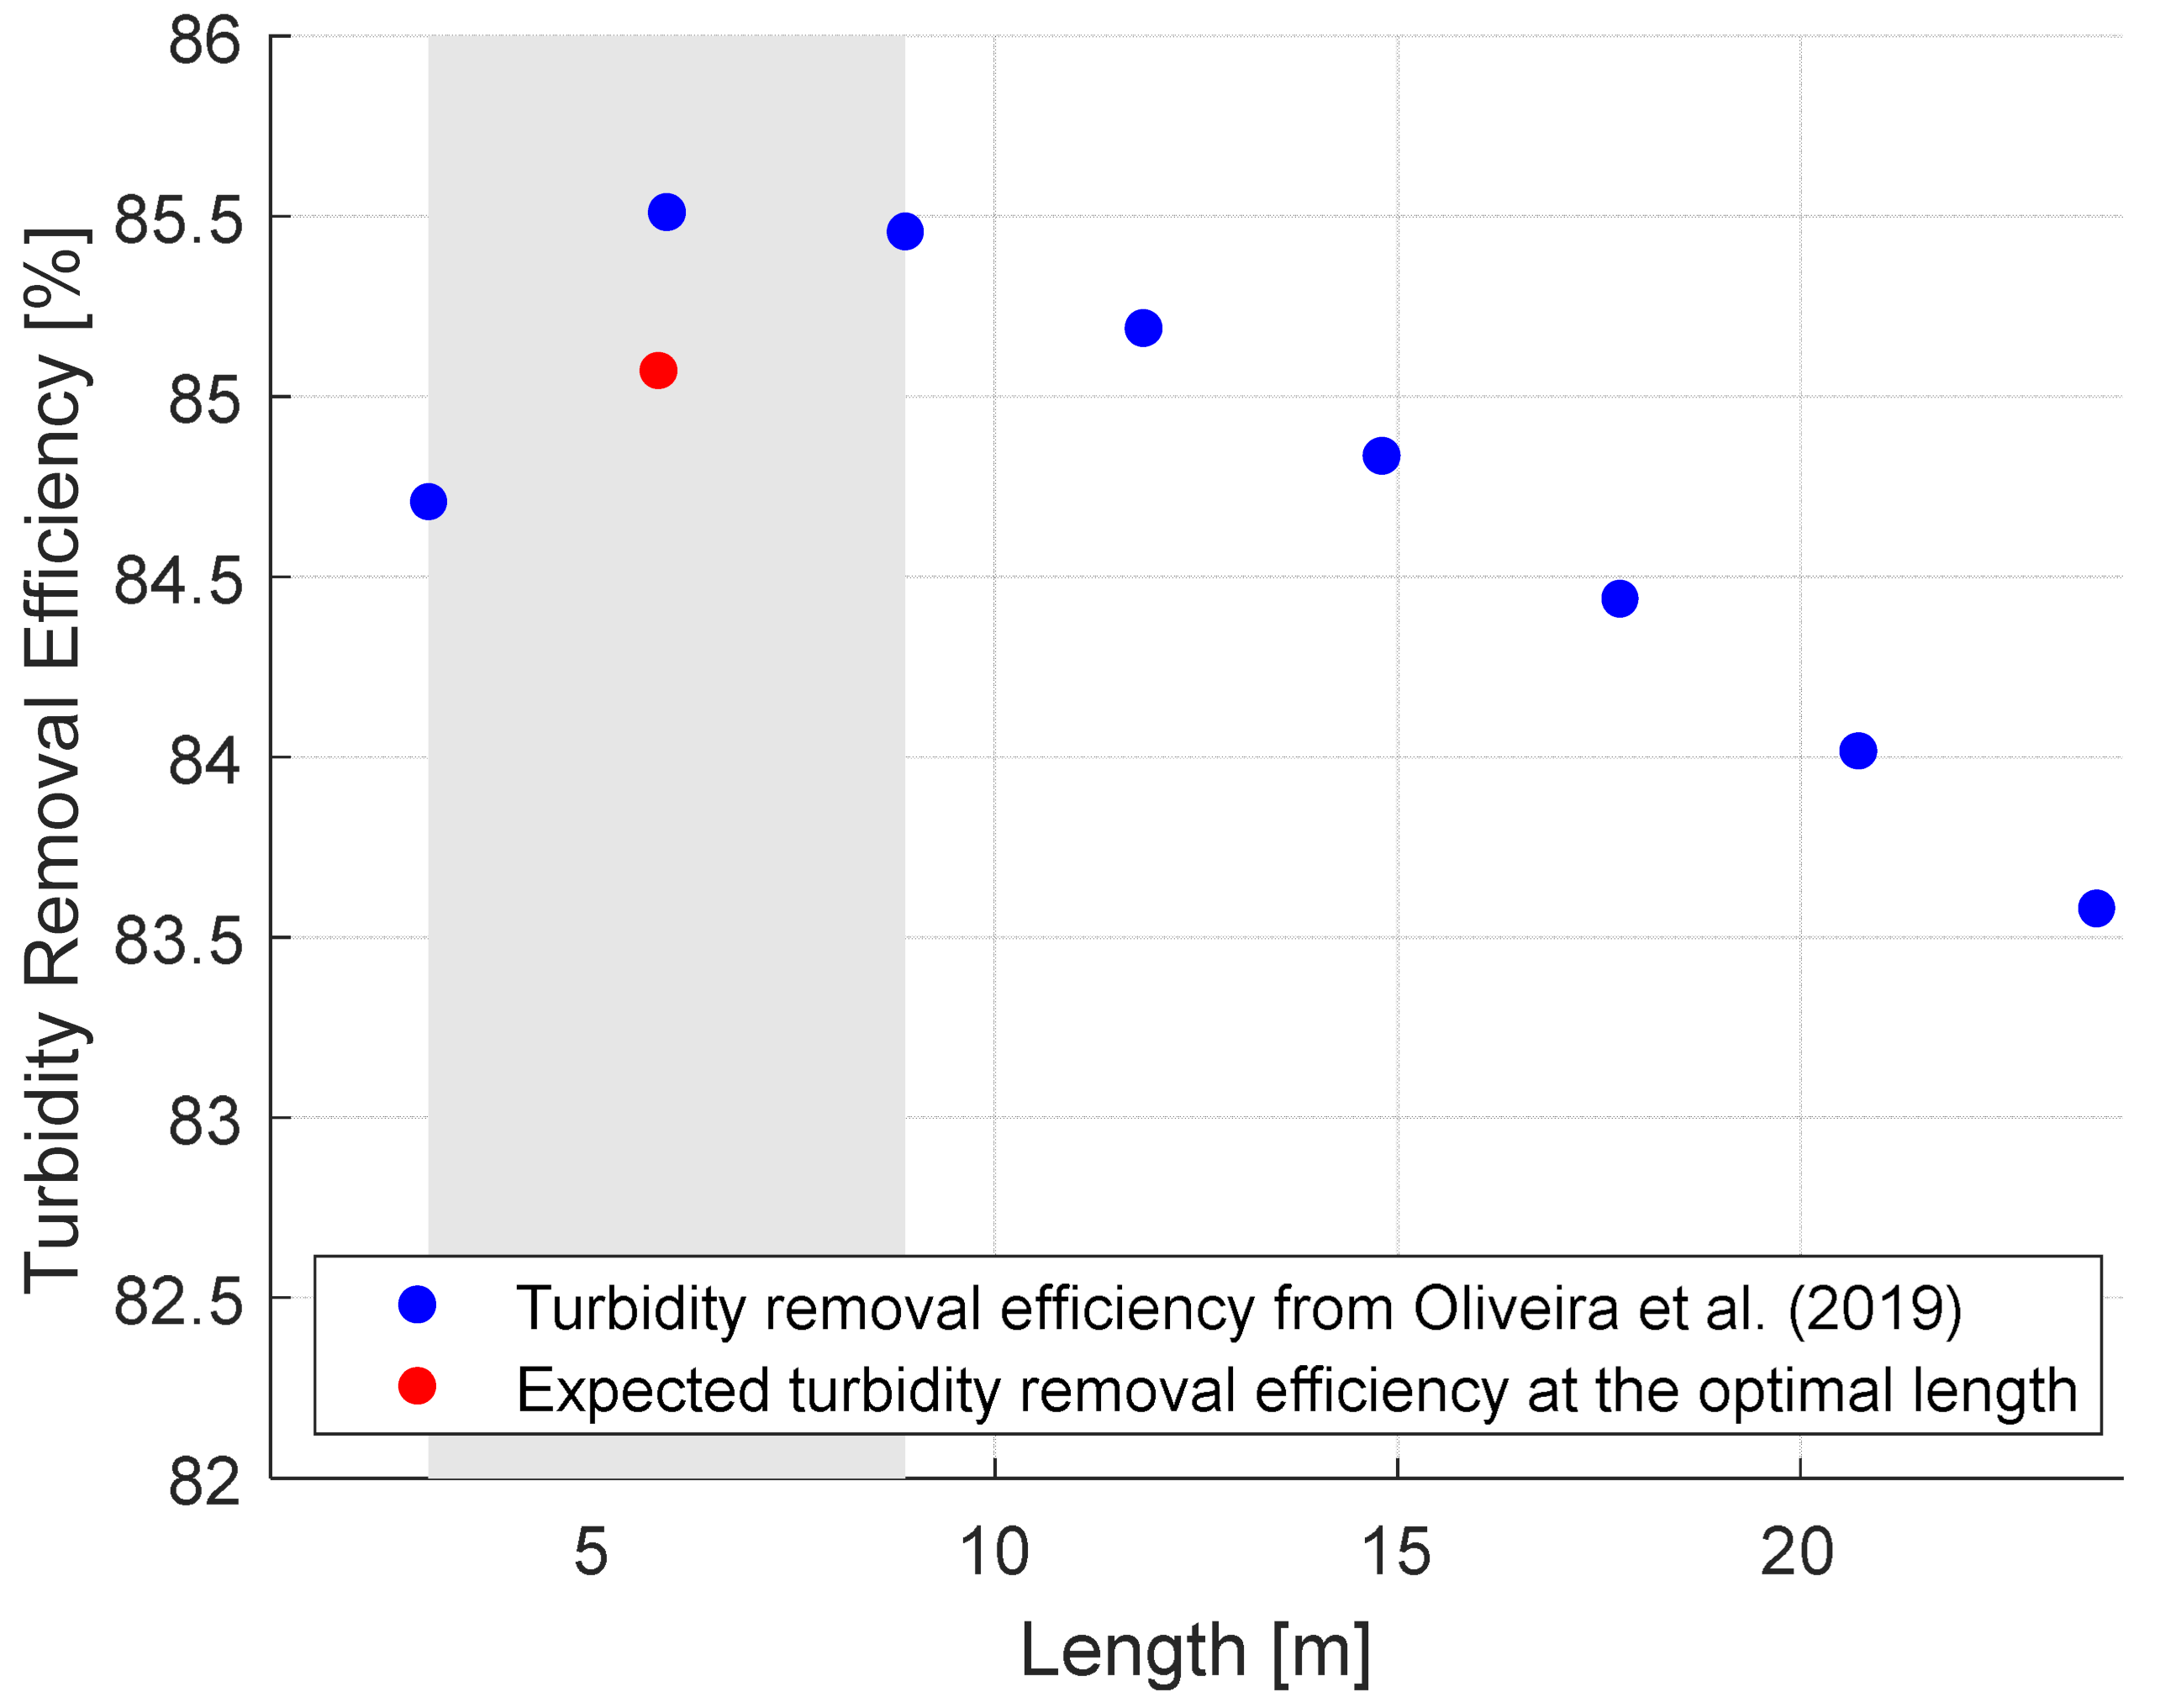
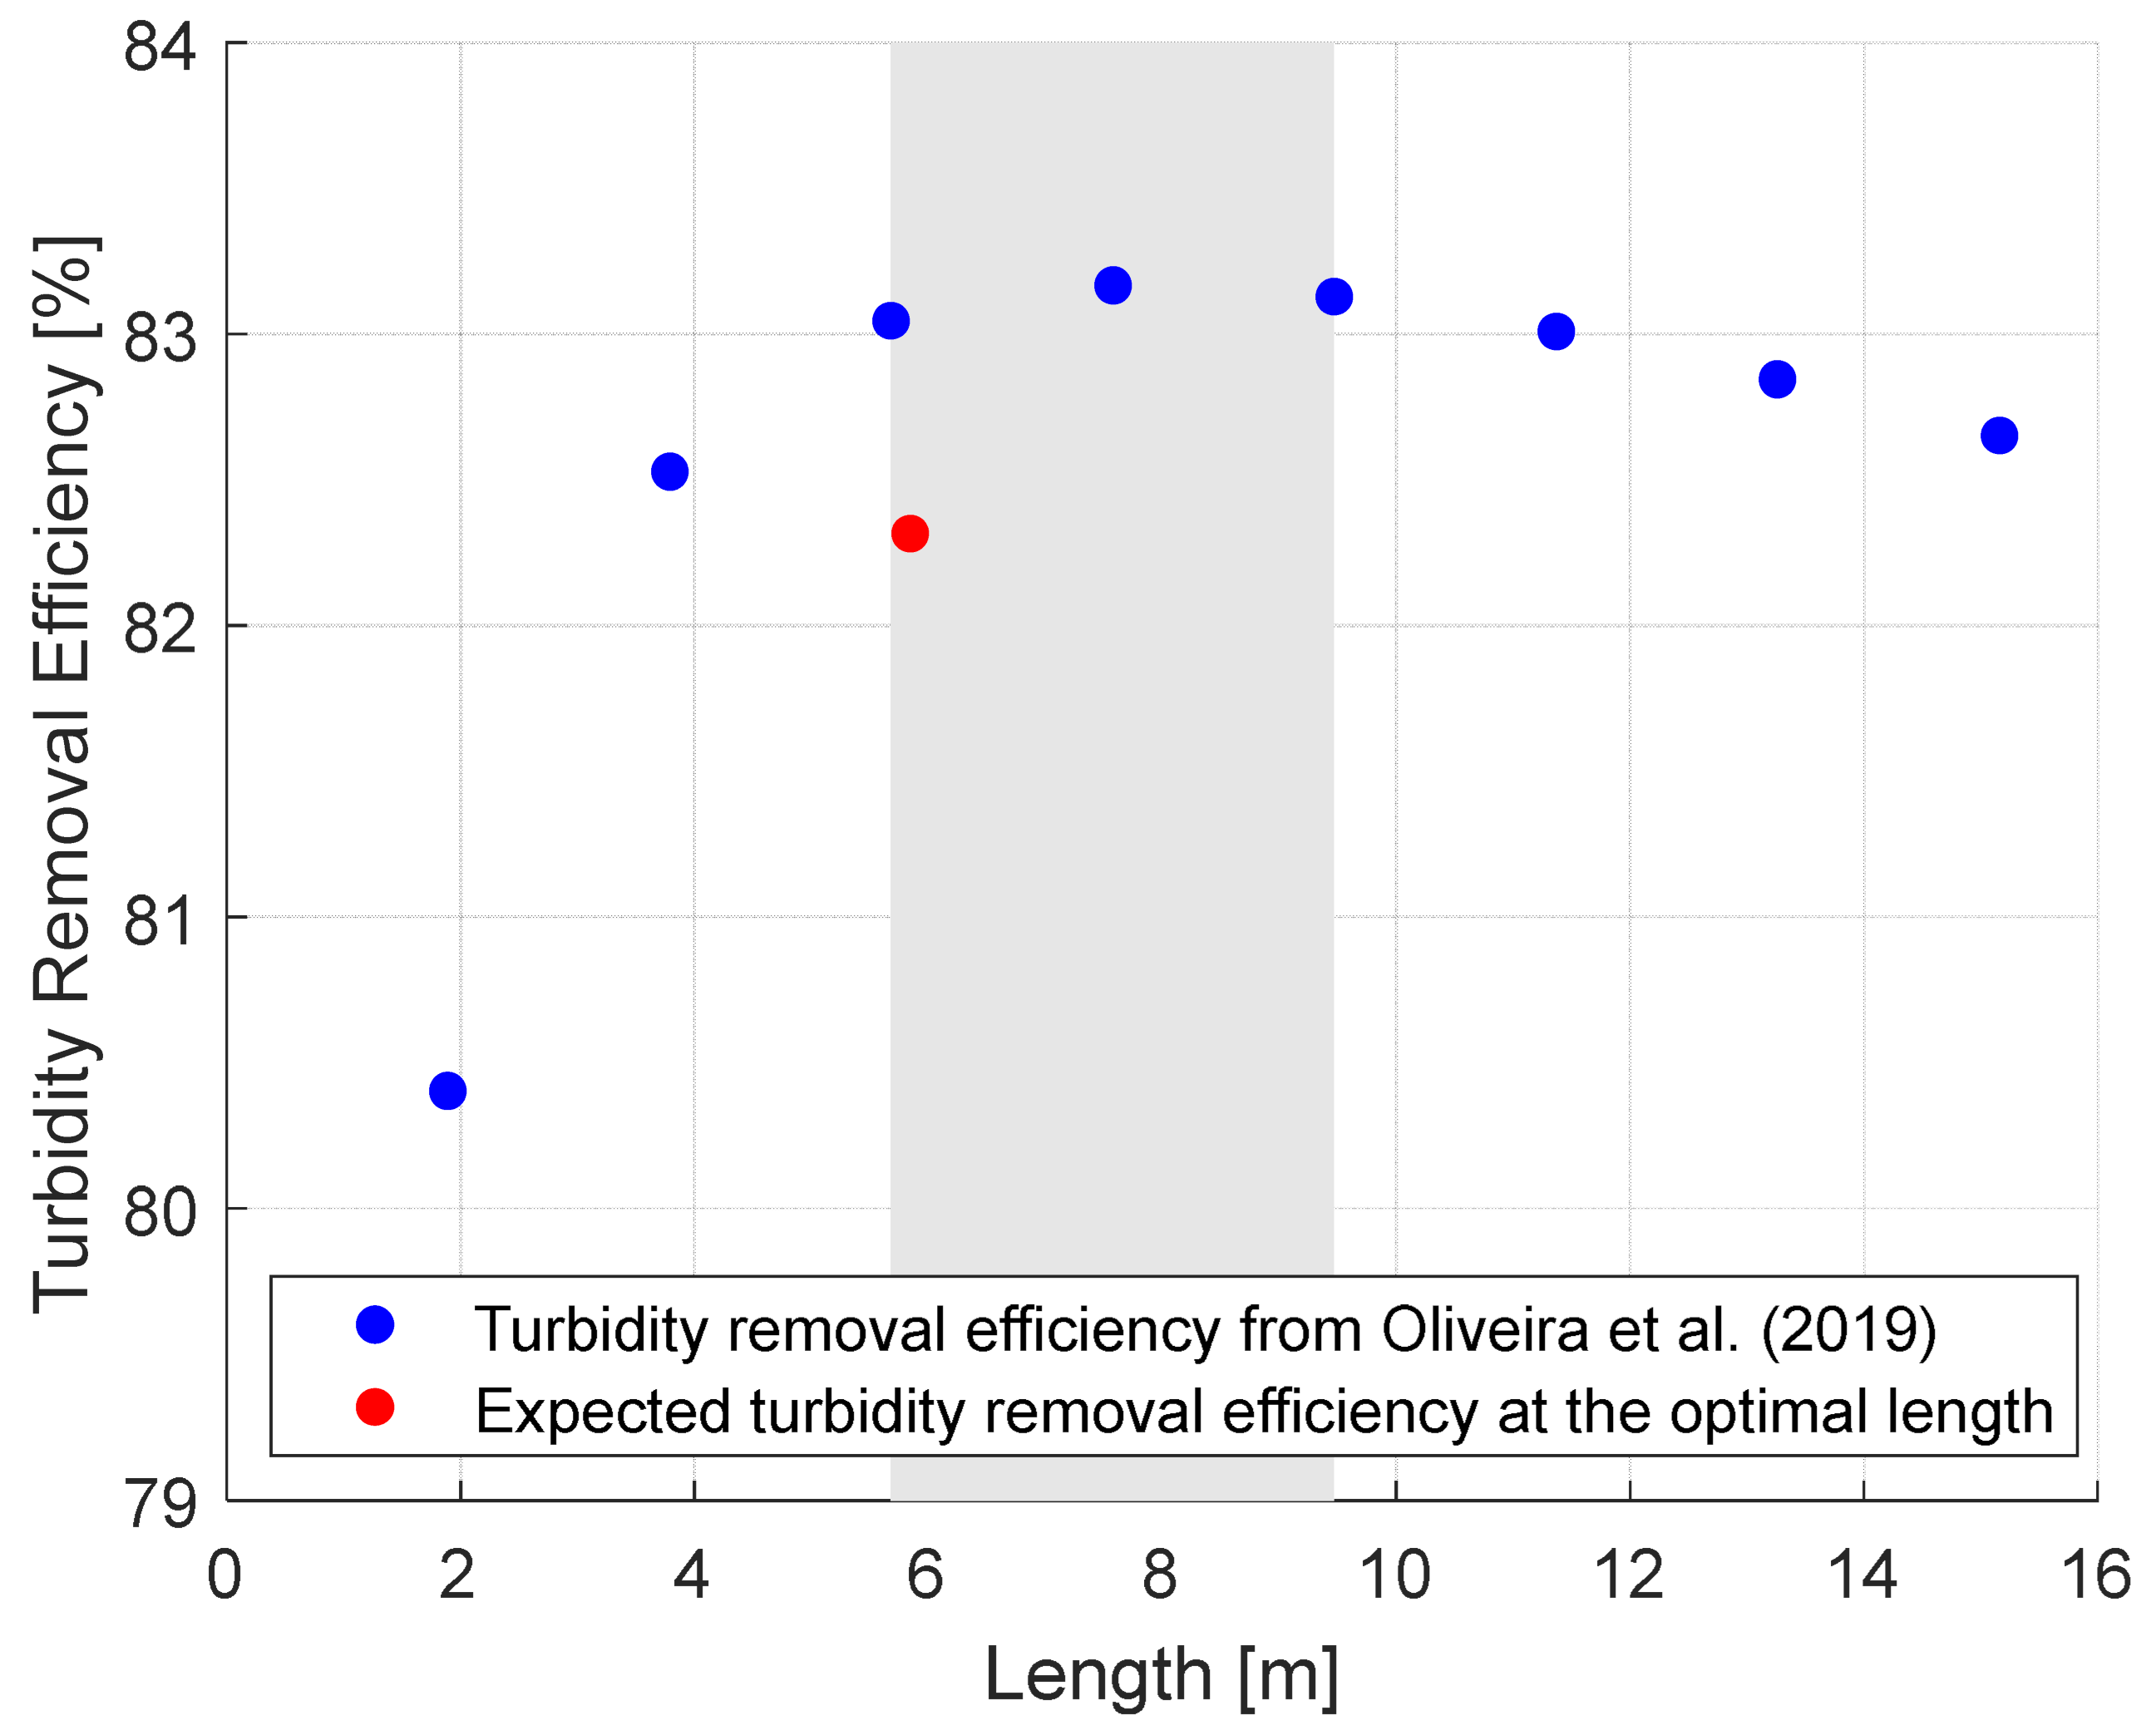
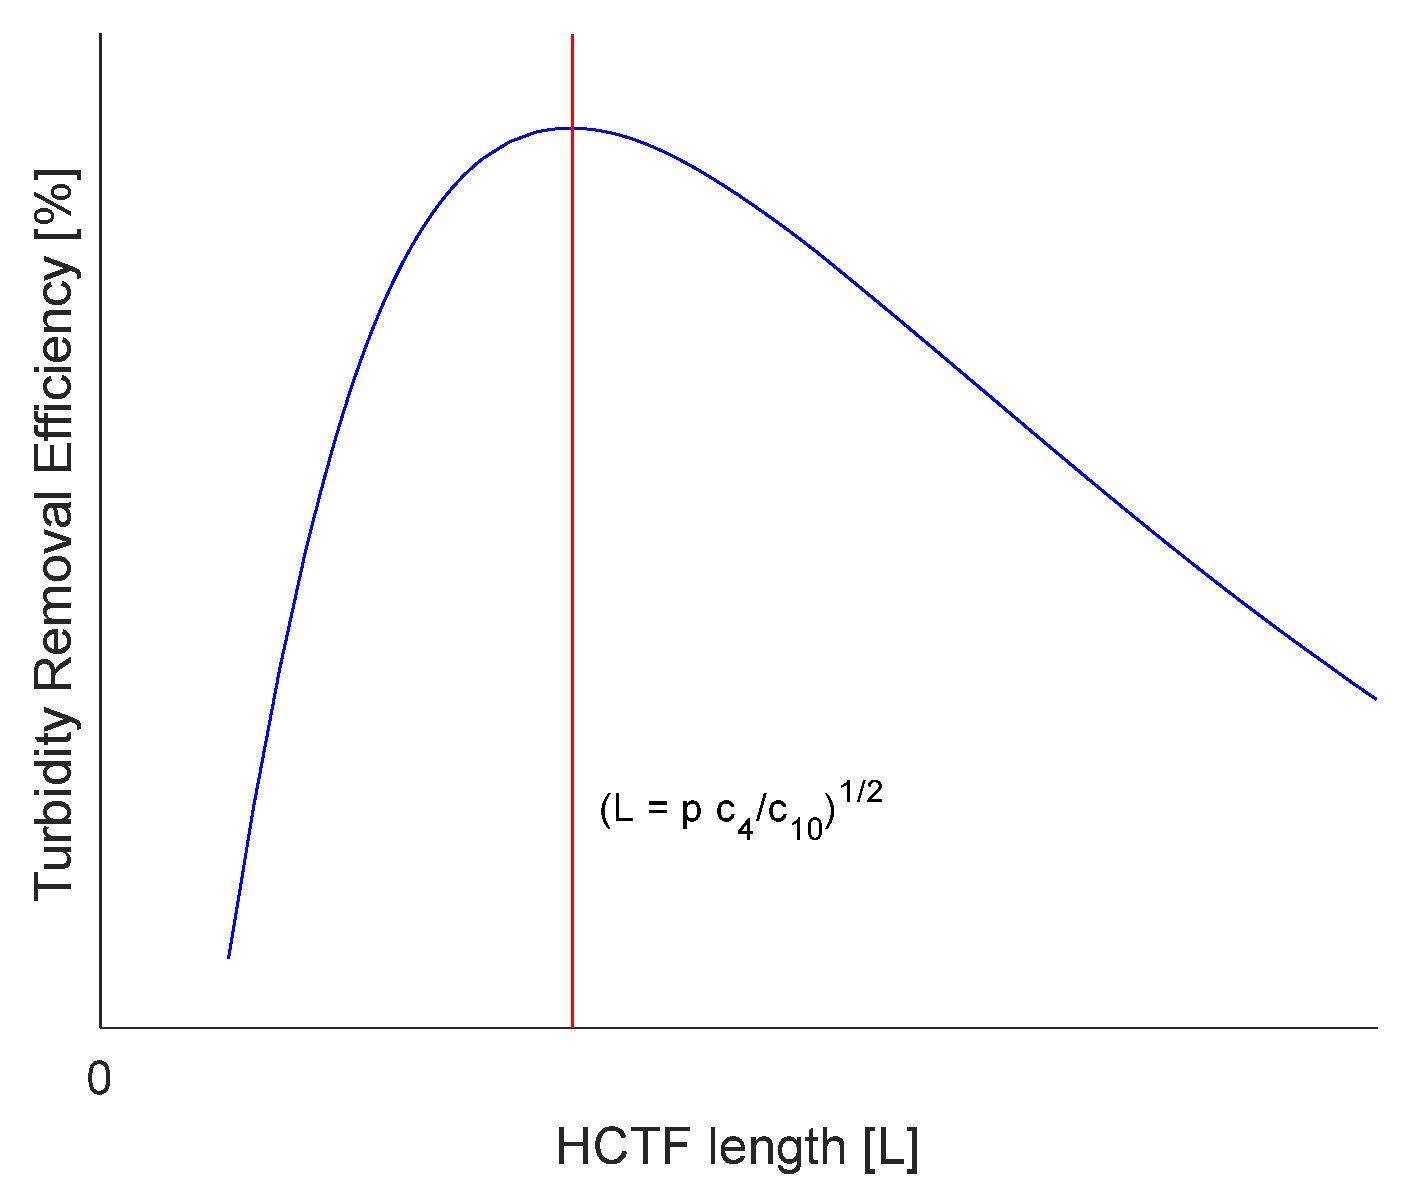
Table 4 verifies whether the optimal length obtained from the proposed model is within the expected range. The expected range was determined using the graphical representation of Equation (3), which is applied to each configuration by considering the distance between (a) the first point ahead of the maximum turbidity removal efficiency, and (b) the first point behind the maximum turbidity removal efficiency. The area is highlighted in gray in the graphical representation column of Table 4. Furthermore, in this graphical representation, turbidity removal efficiency values are estimated using the linear regression model obtained by Oliveira et al. [25] are shown in blue (using length values from Table 1). For example, the optimal length for configuration #2 is 4.8 m, with an expected range of 2.6 m–10.5 m. In all cases, the optimal length was within the expected range.
In Table 5, Table 6, Table 7 and Table 8, a comparative analysis between the deterministic and probabilistic approaches is presented, highlighting how the turbidity removal efficiency was affected when hydraulic parameters vary after L has been defined. For example, considering configuration #2, the estimated turbidity removal efficiency was 81.4% at its optimal length (4.8 m), using deterministic analysis. Considering the proposed probabilistic approach, the data in Table 5 show that the turbidity removal efficiency is in the range of 80.8–81.8% for scenario 1 (RSD = 5%), and the probability of a turbidity removal efficiency higher than its deterministic value is 36.5%. In scenario 2 (RSD = 10%), the data from Table 6 show that the turbidity removal efficiency is in the range of 80.2–82.1% for scenario 2 (RSD = 10%), and the probability of a turbidity removal efficiency higher than its deterministic value is 42.2%. In scenario 3 (RSD = 15%), the data from Table 7 show that the turbidity removal efficiency is in the range of 79.5–83.0%, and the probability of a turbidity removal efficiency higher than its deterministic value is 53.9%. In scenario 4 (RSD = 20%), the data from 
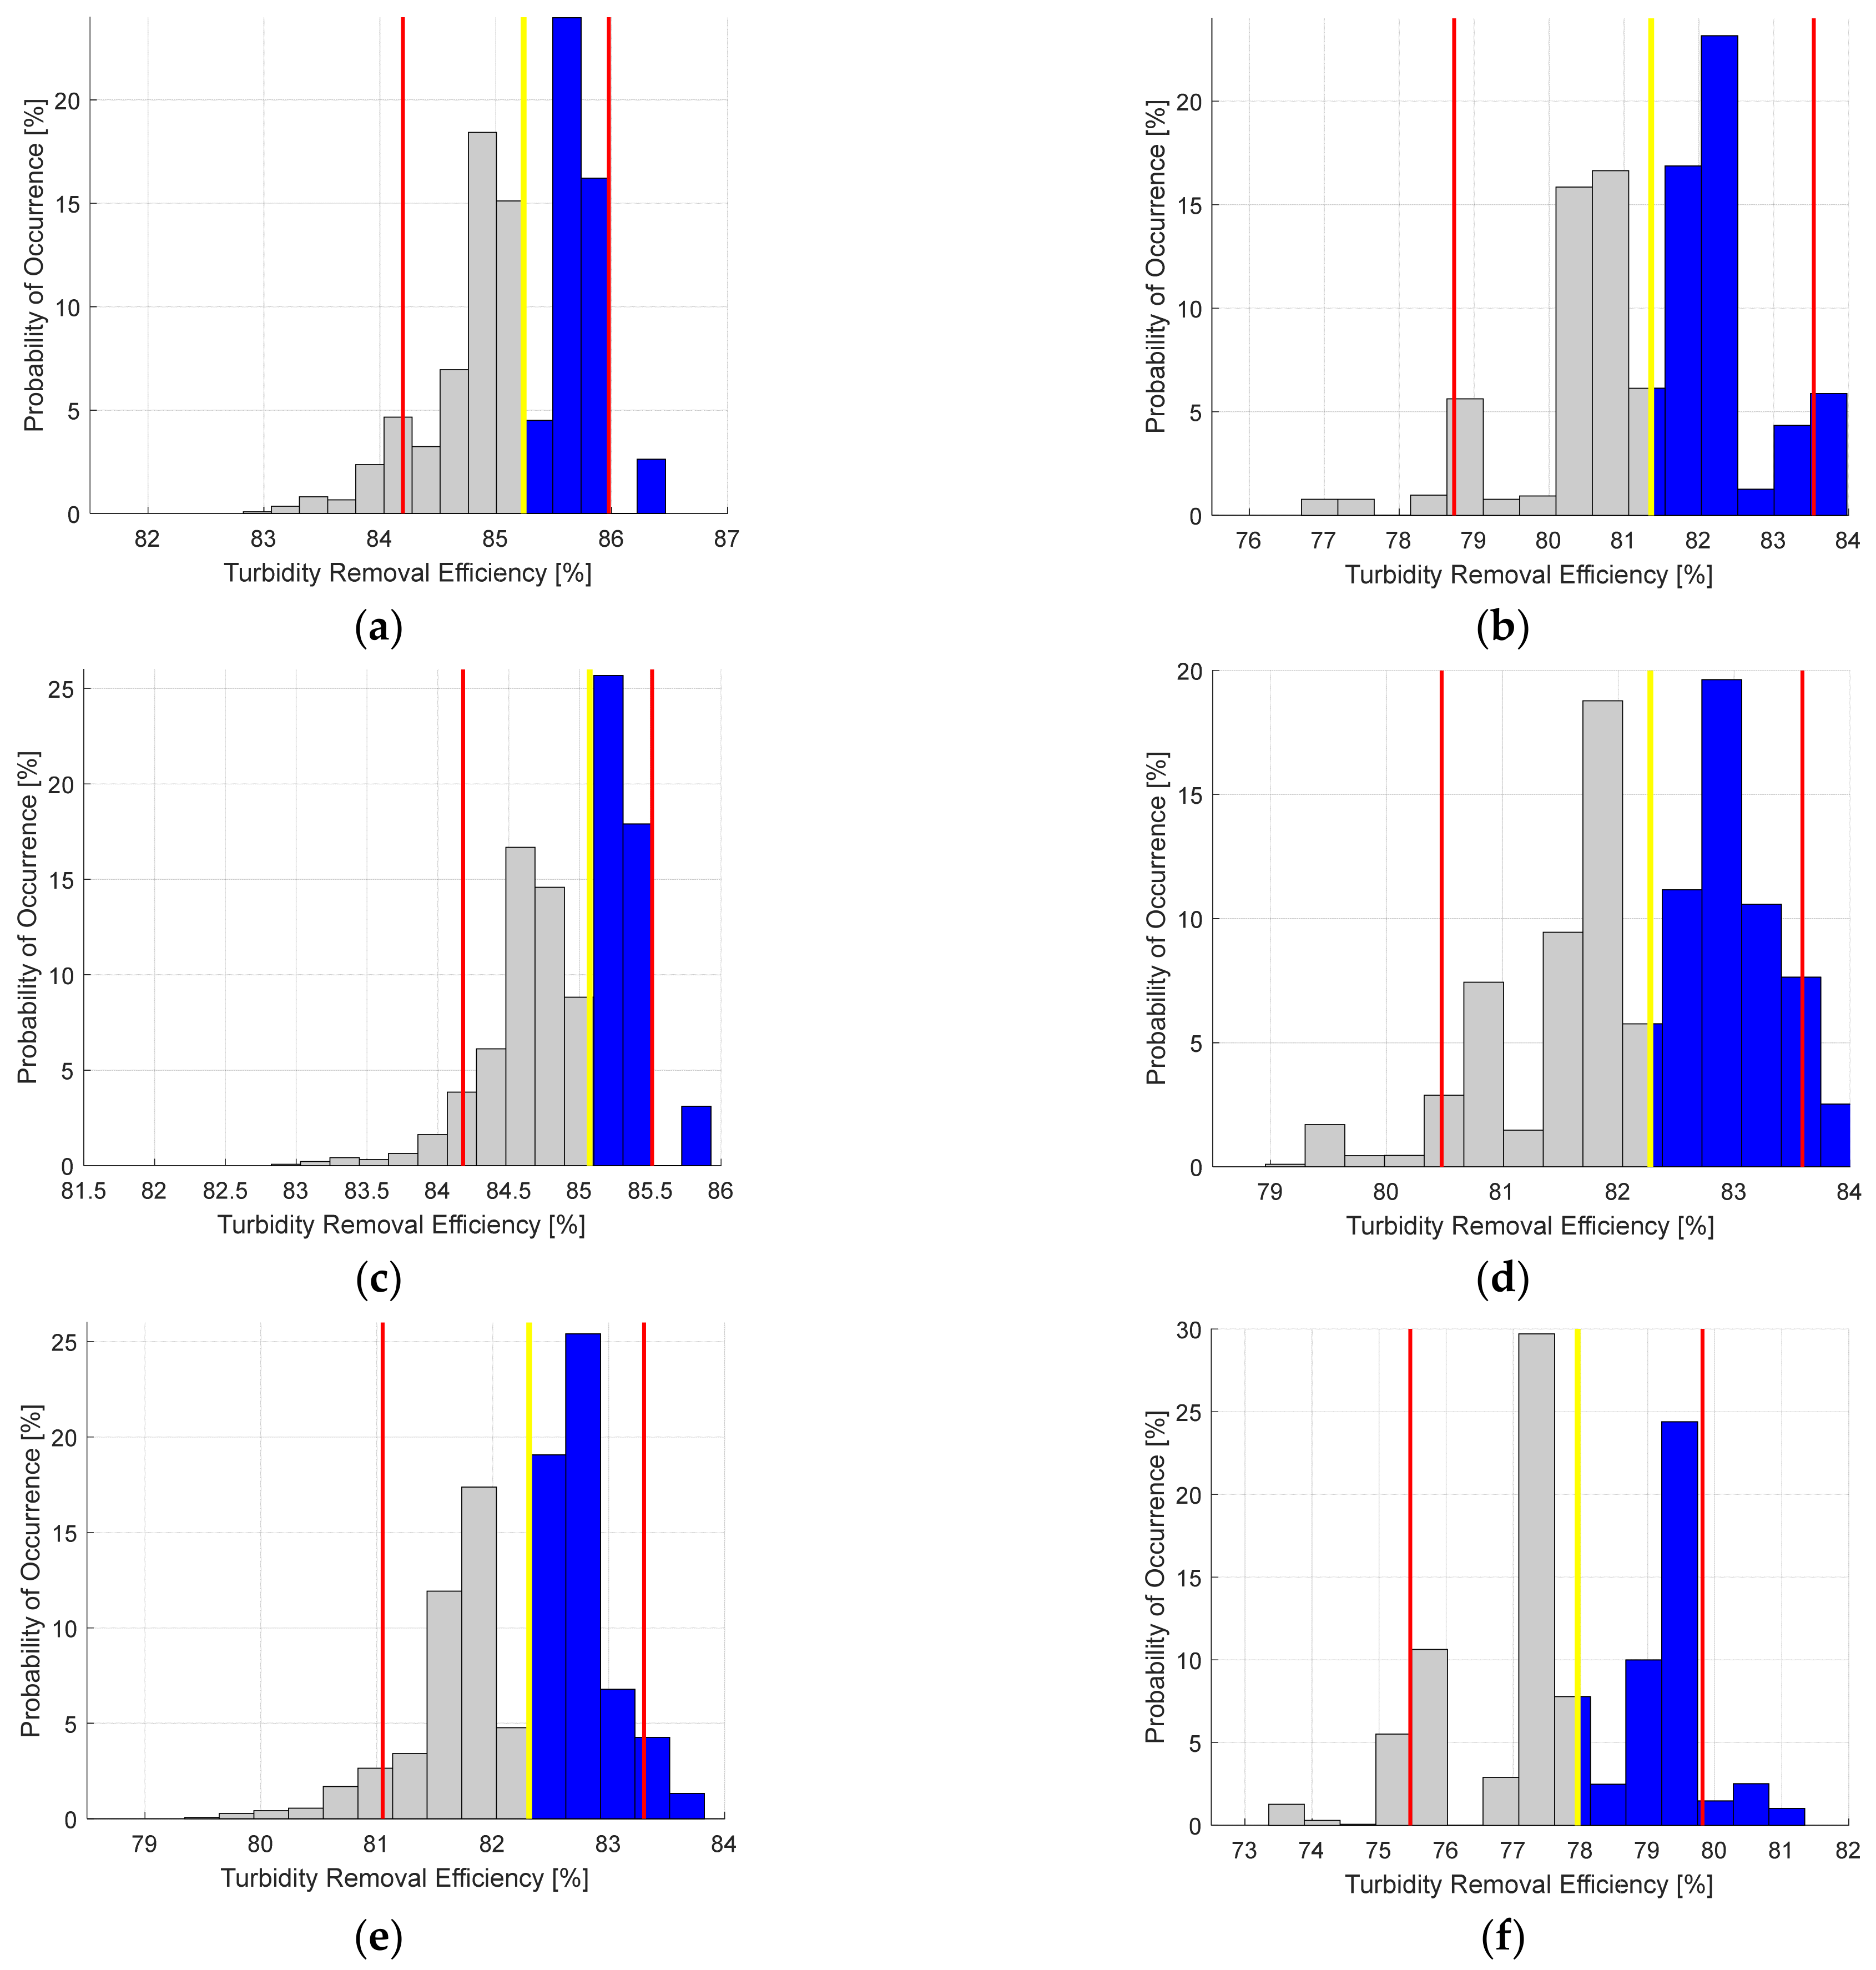
Table 8 show that the turbidity removal efficiency is in the range of 78.3–83.5%, and the probability of a turbidity removal efficiency higher than its deterministic value is 49.5%.
The data presented in Table 5, Table 6, Table 7 and Table 8 also demonstrate the robustness of the alternative clarification system consisting of an HCTF coupled to a conventional decanter system. After determining the optimal flocculator length, the process efficiency remains within a range of values considered acceptable, even when significant variations occur in dimensional hydraulic parameters G and Q. For a relative standard deviation (RSD) of 5%, variations in turbidity removal efficiency ranging from 0.4% to 1.1% were observed. With an RSD of 10%, these variations increased to a range of 0.8% to 2.8%. At an RSD of 15%, the observed variations in turbidity removal efficiency extended from 1.0% to 3.5%. Finally, in the worst-case scenario evaluated, featuring an RSD of 20%, process efficiency exhibited variations spanning from 1.3% to 5.2%. In all cases, the variations in turbidity removal efficiency were significantly lower than the variations in dimensional hydraulic parameters.
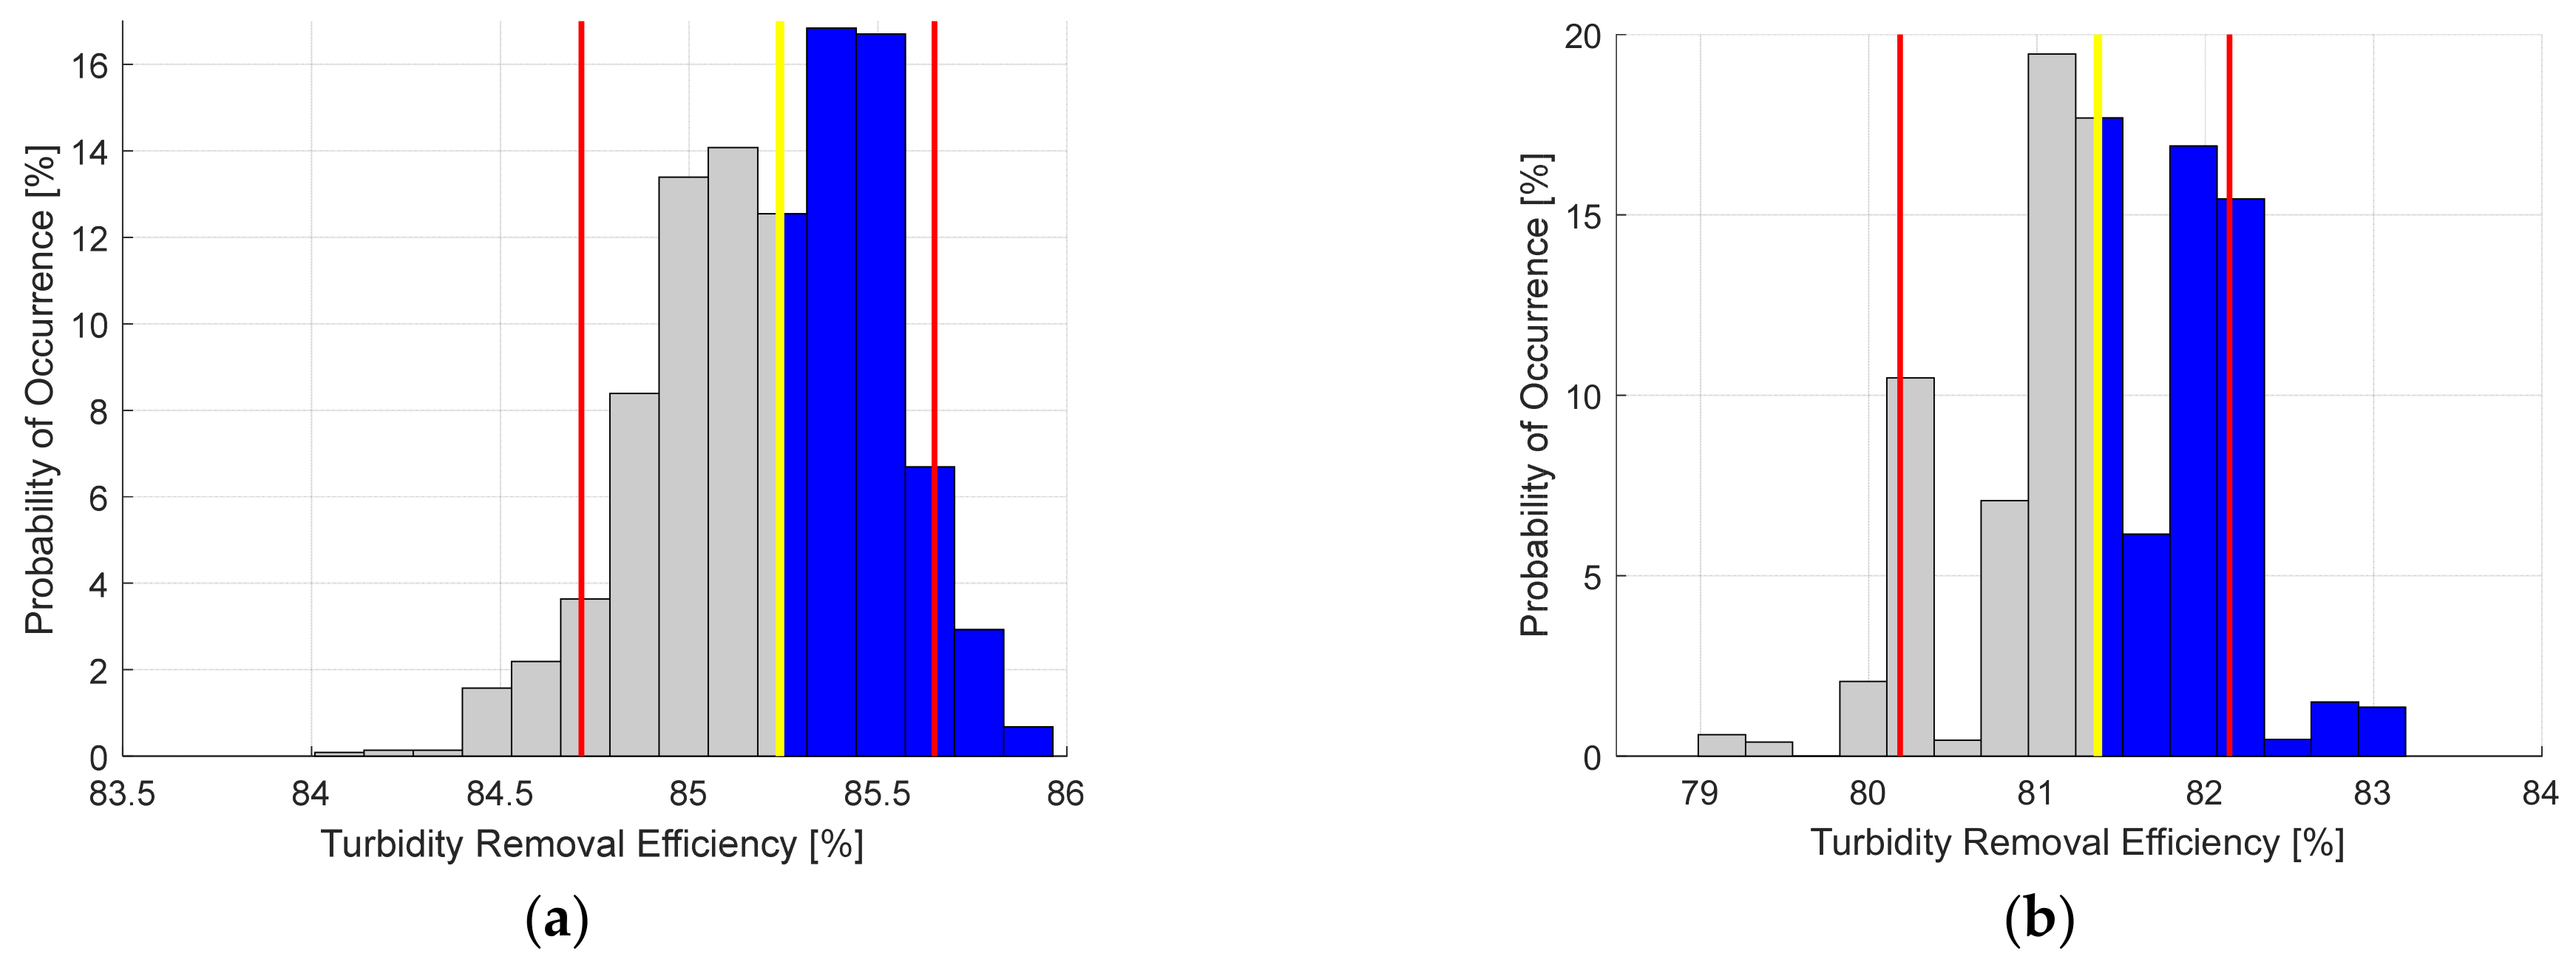
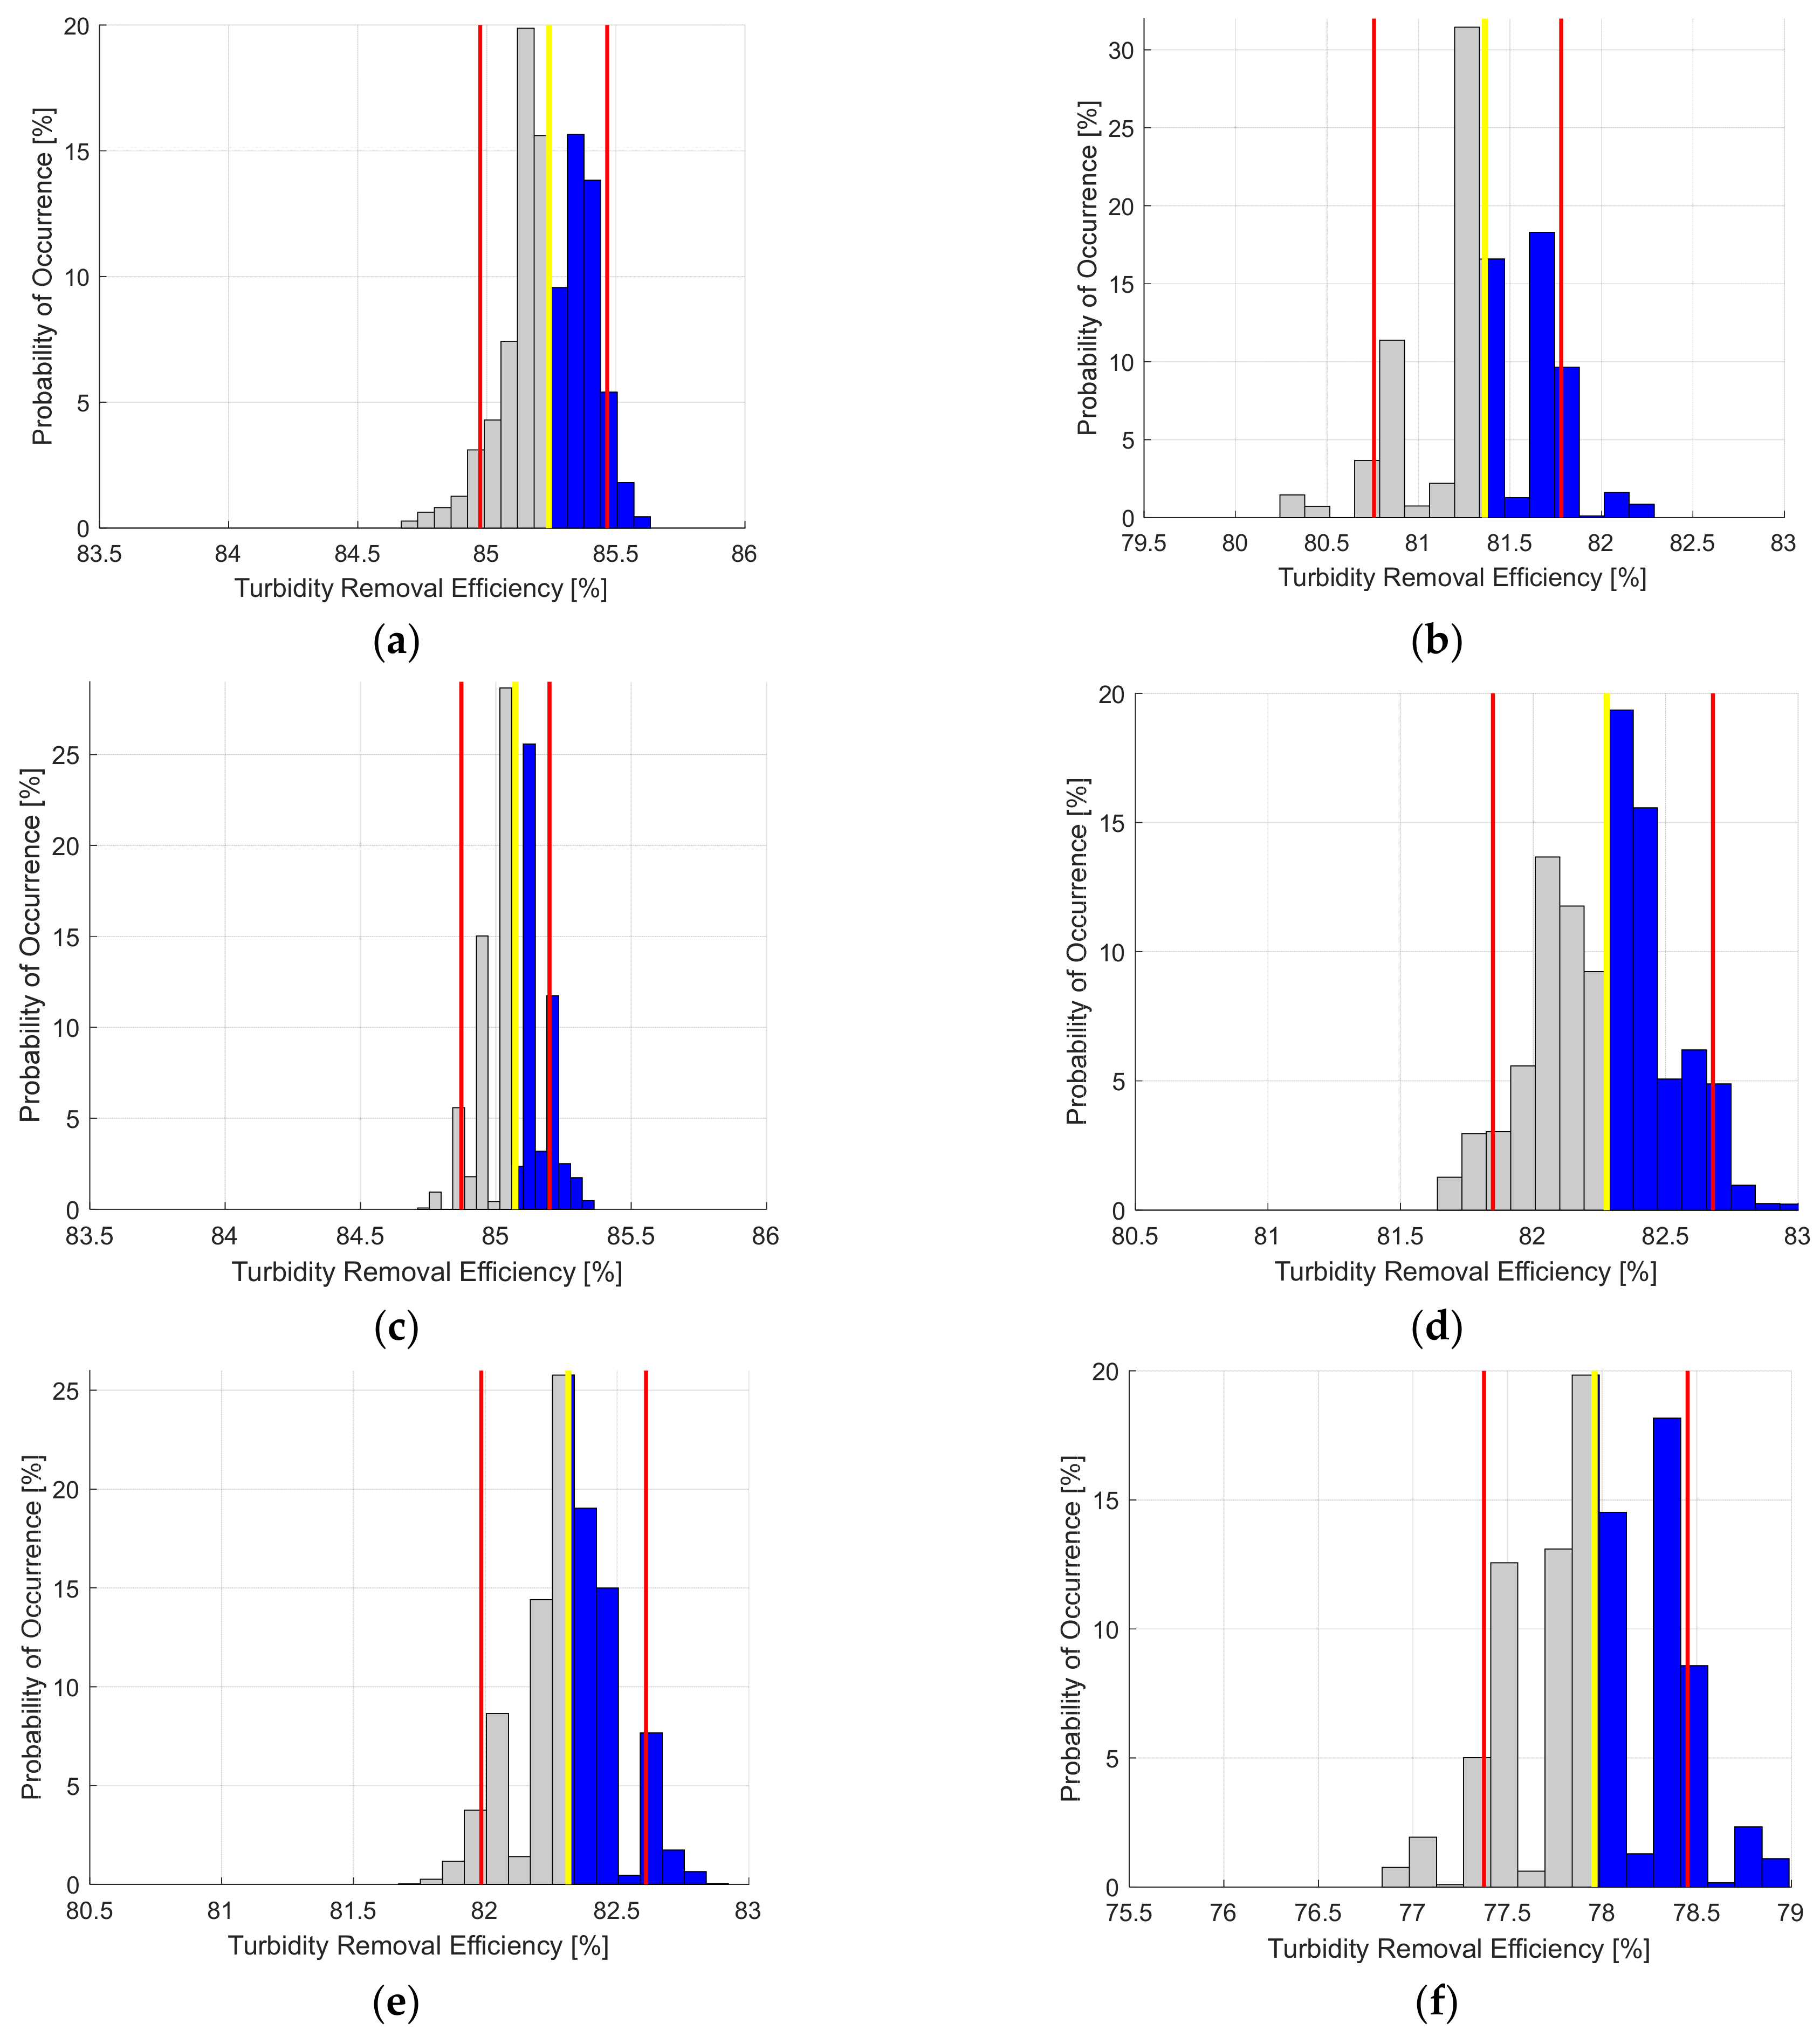
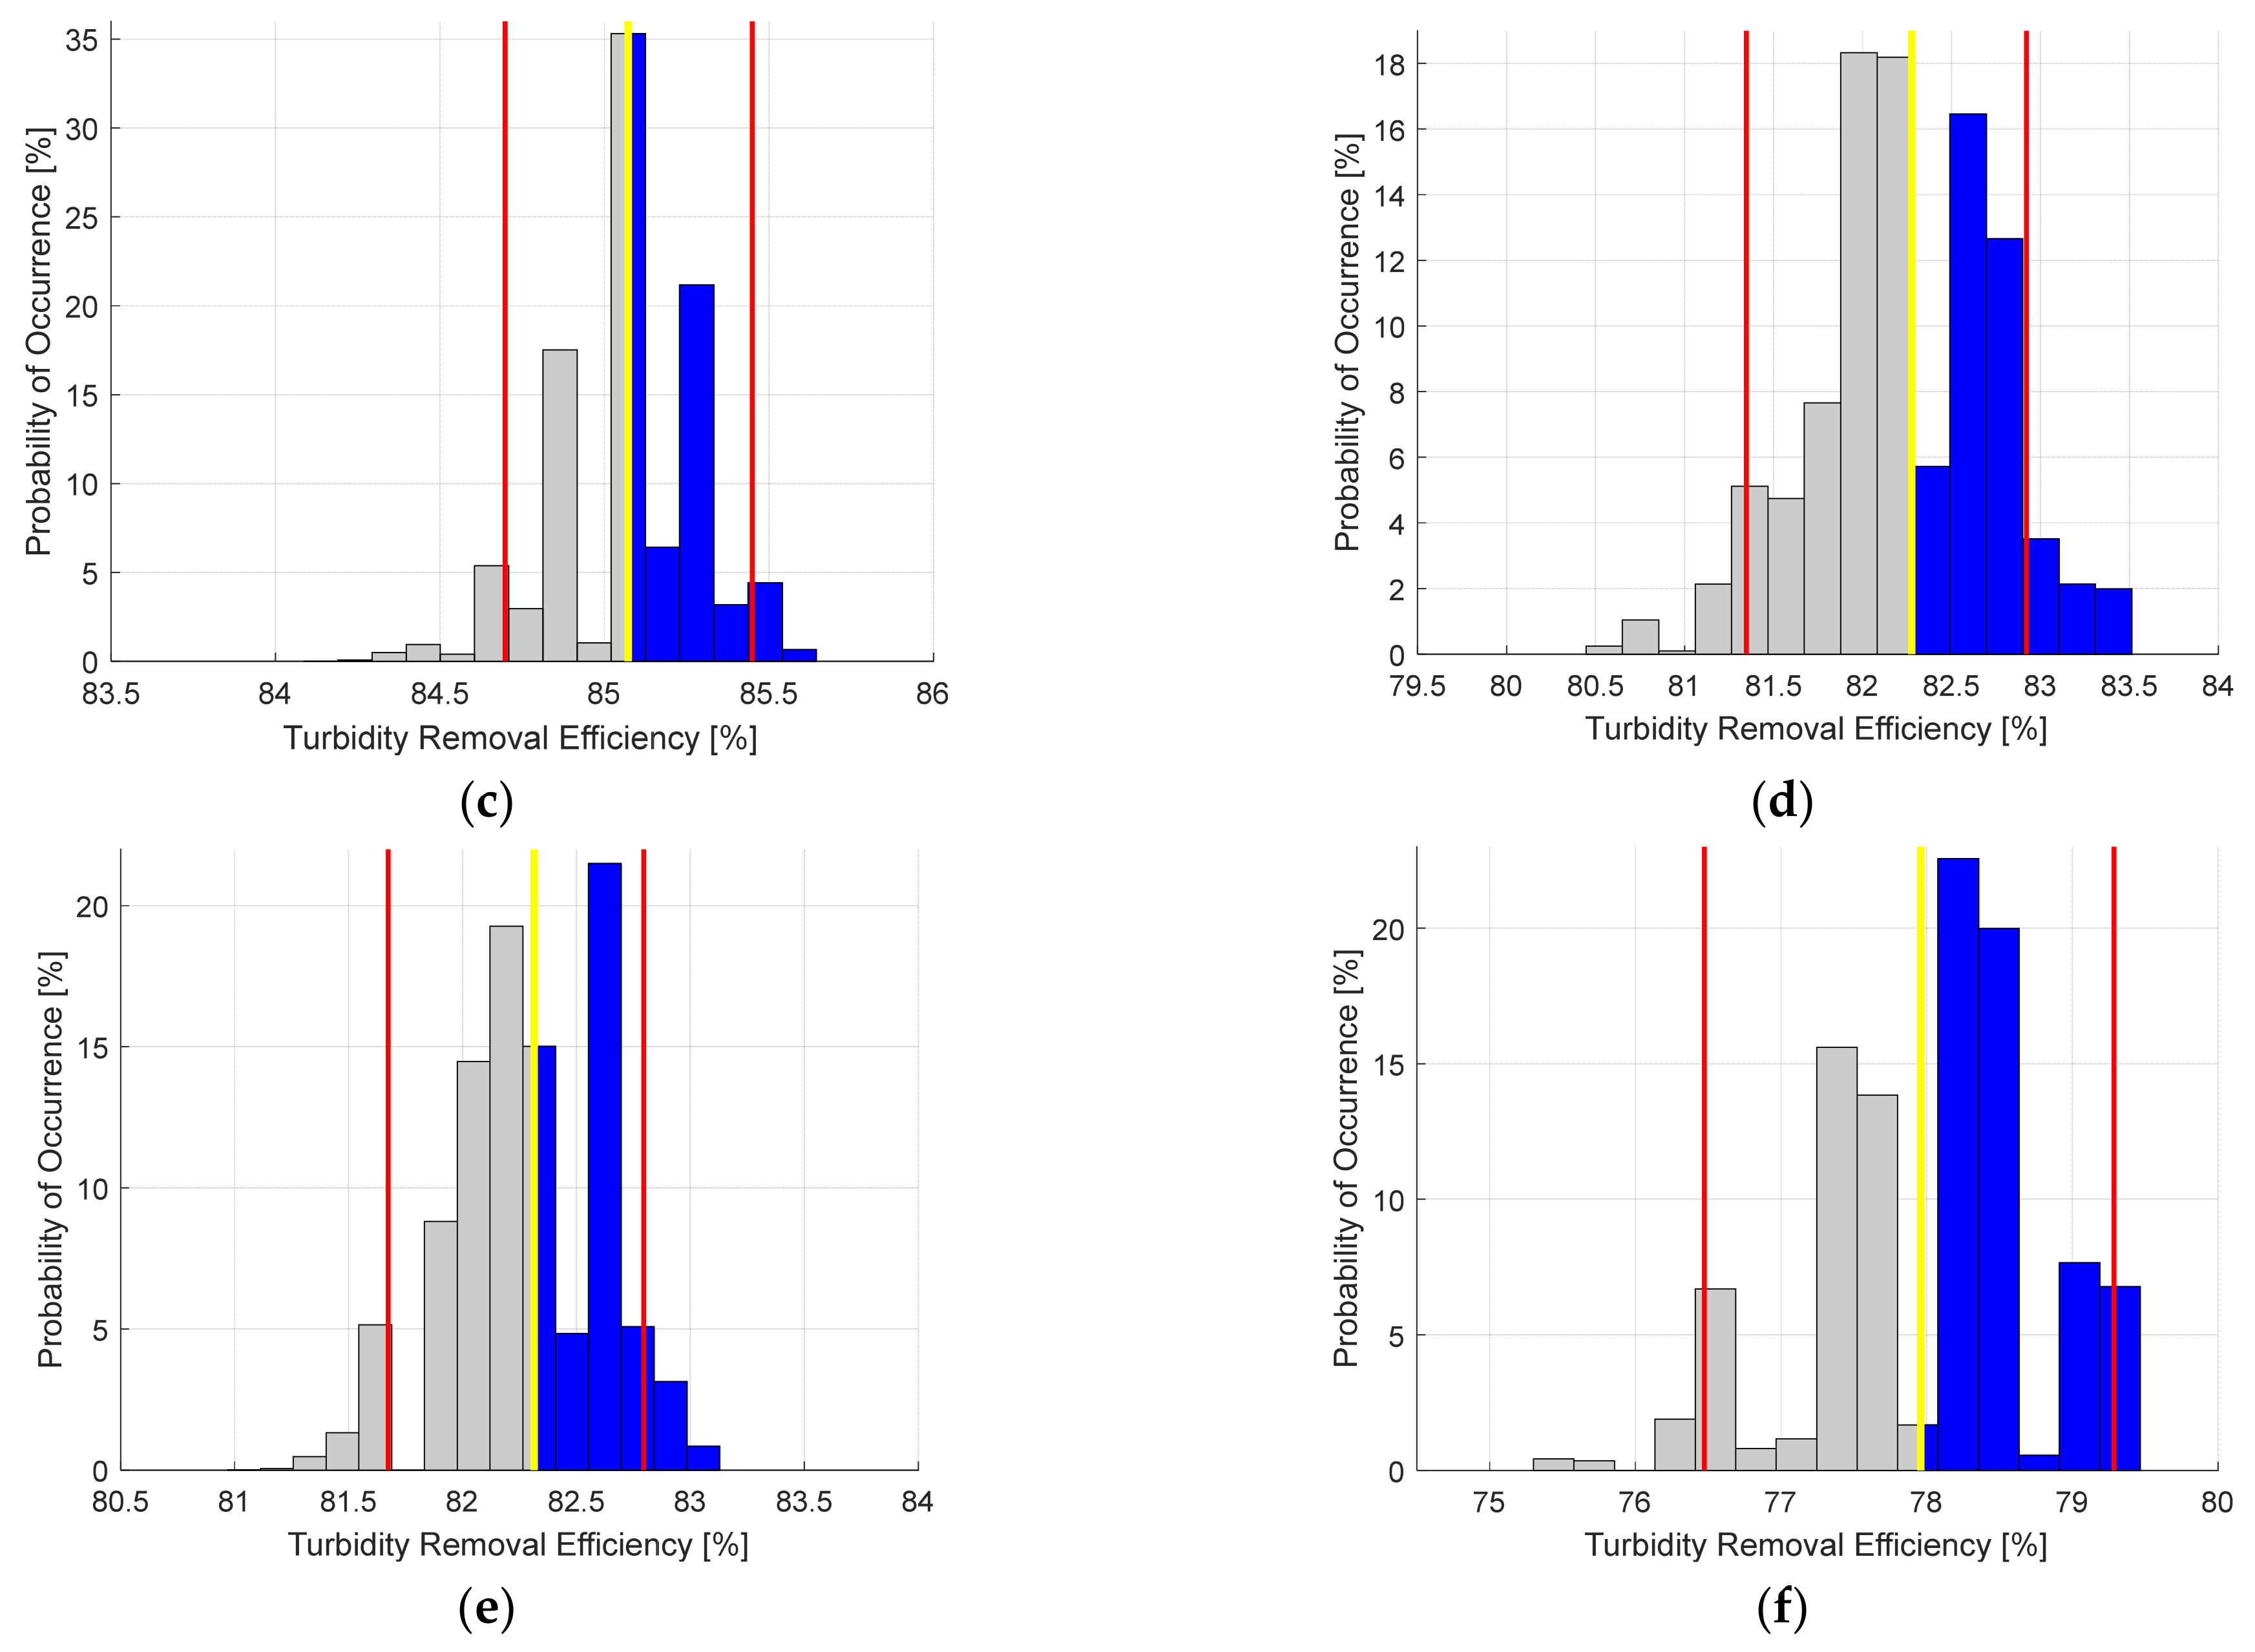
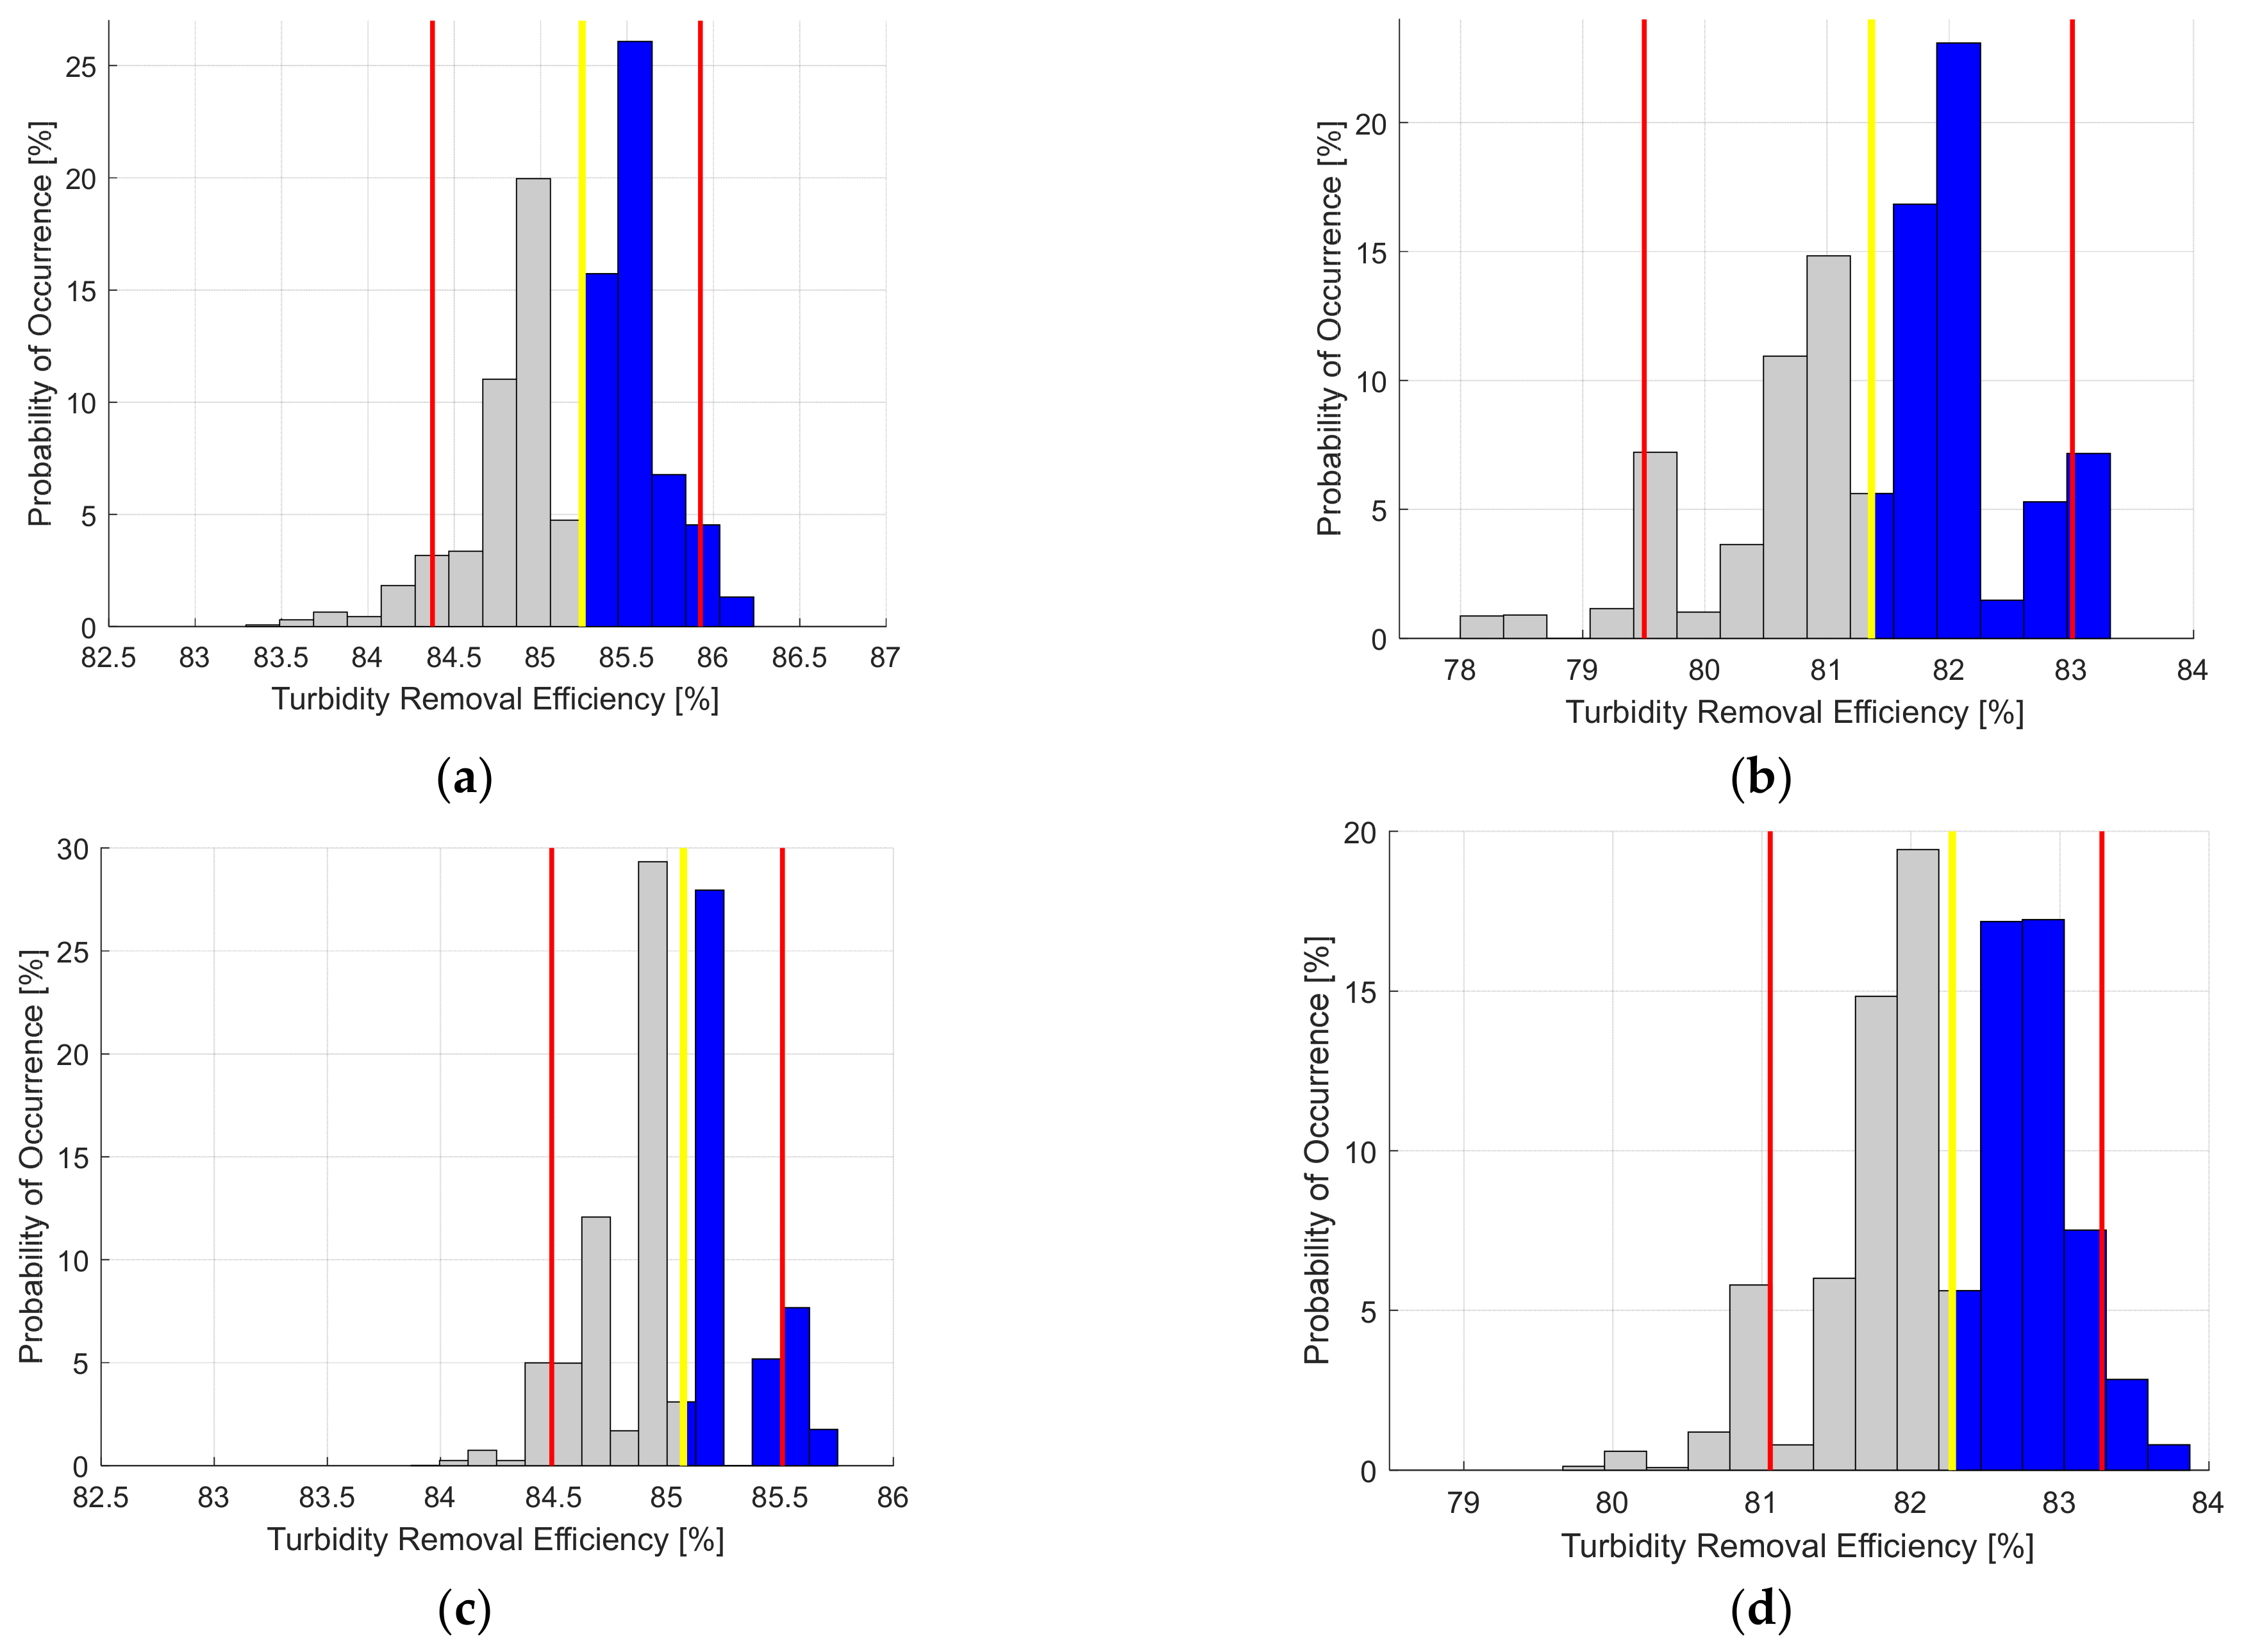
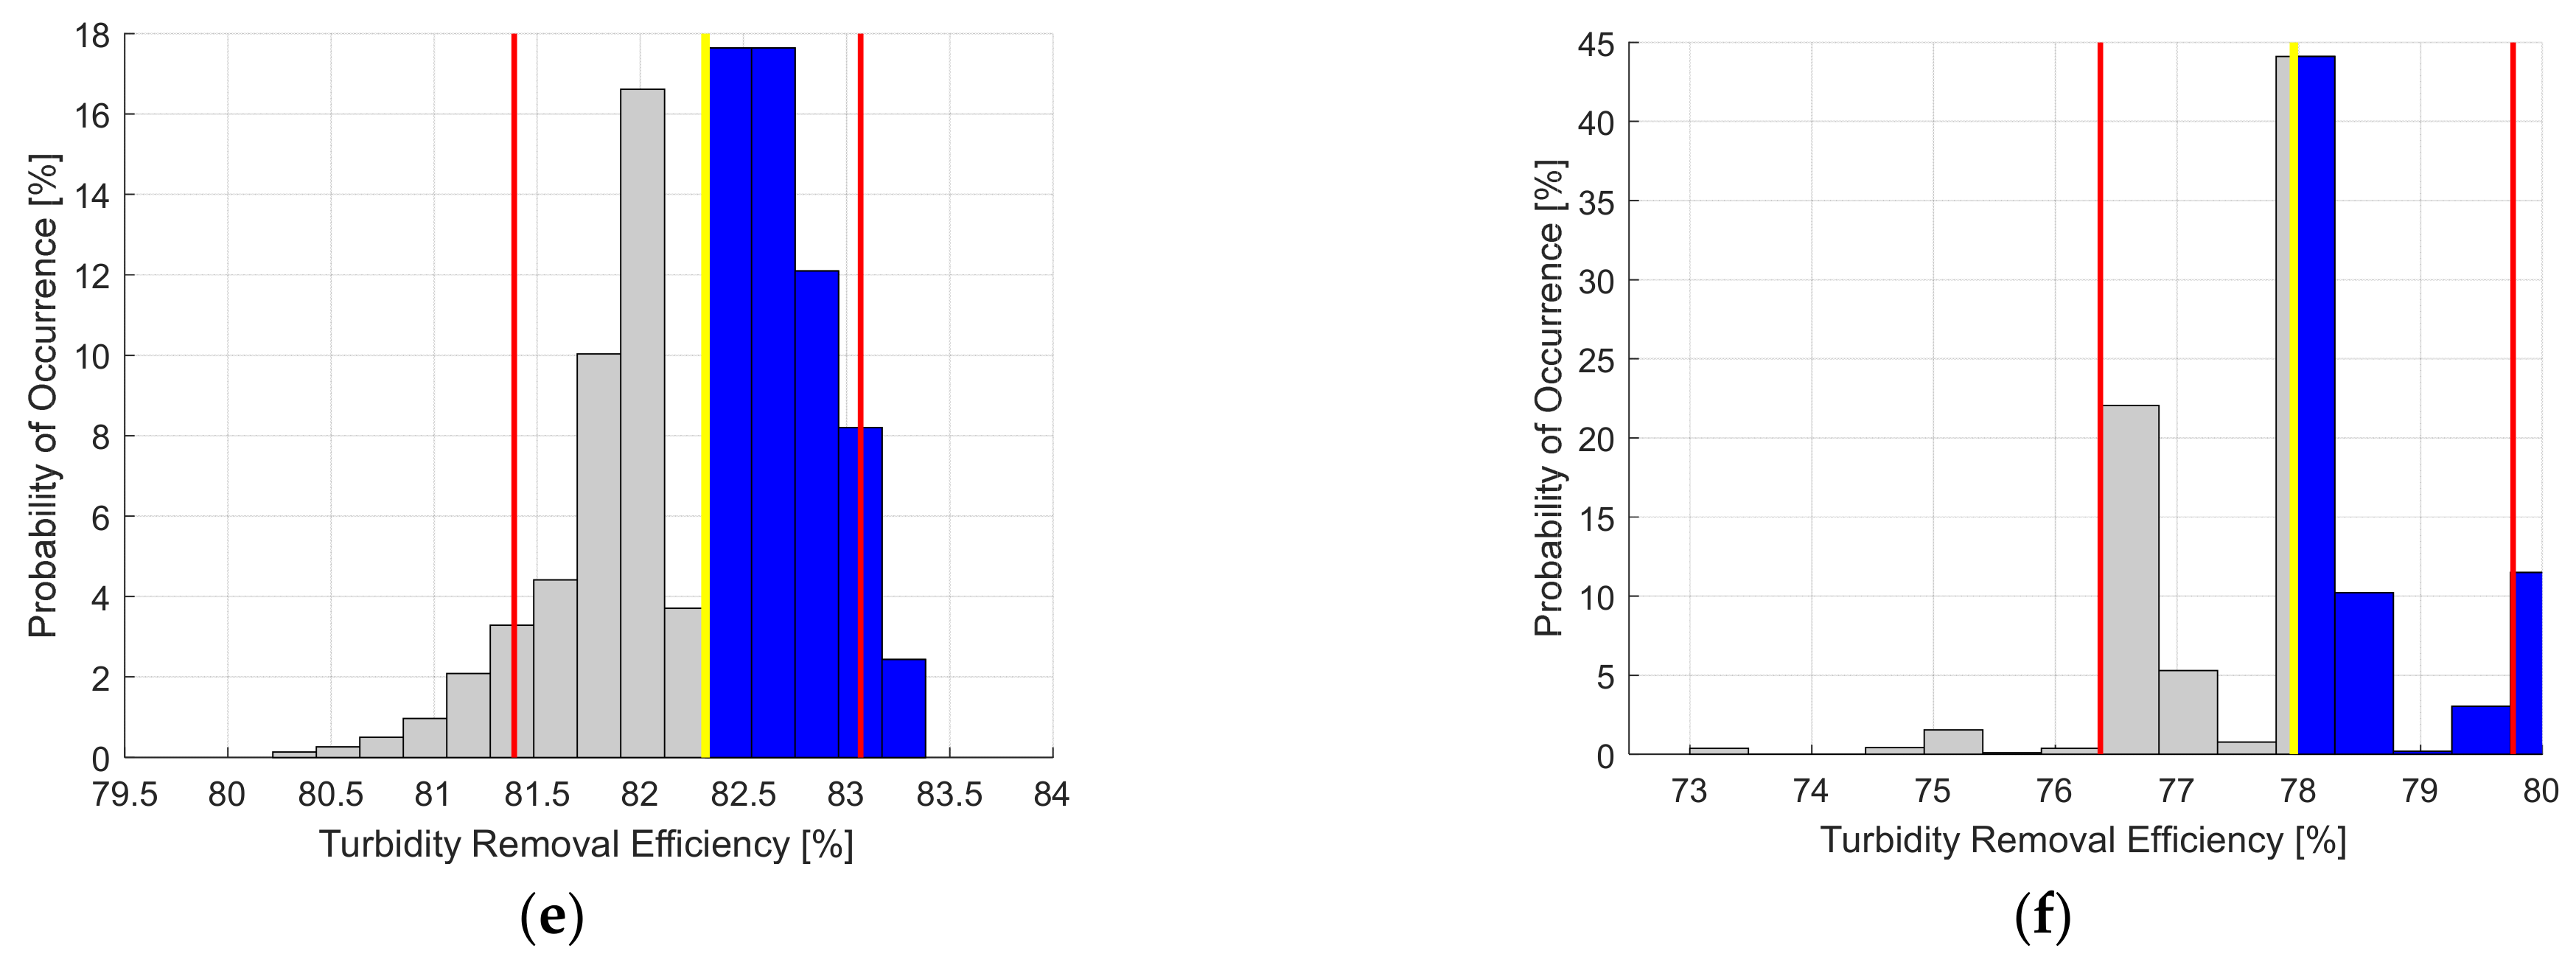
Figure 5, Figure 6, Figure 7 and Figure 8 graphically show the behavior of the probability density function of E f for each configuration. In Figure 5, Figure 6, Figure 7 and Figure 8, the horizontal axis shows the value of the turbidity removal efficiency, the vertical axis depicts the probability of occurrence, red vertical lines represent the confidence interval limits, yellow vertical lines show the value of turbidity removal efficiency in the deterministic analysis, and the blue highlighted area represents the probability that the turbidity removal efficiency will be higher than its deterministic value. Figure 5, Figure 6, Figure 7 and Figure 8 verify the data dispersion around the expected value. The proposed model allows designers to plan efficient HCTFs, save financial resources, and make water treatment plants more efficient. Furthermore, the probabilistic analysis performed in this paper allows us to verify the efficiency of the HCTF after its length is defined, under variations in the operating variables.

5. Conclusions

This paper proposes a model to predict the optimal length in a helically coiled tube flocculator (HCTF) to support an alternative, sustainable, and rational water clarification system. An optimal length was obtained for the six configurations evaluated in this study. An expected range for the optimal length was proposed based on the experimental data from previous studies. In all cases, the optimal length obtained by the proposed model was within the expected range.
Furthermore, a comparative analysis between deterministic and probabilistic approaches was performed, allowing an understanding of how turbidity removal efficiency is affected when hydraulic parameters vary after length has been defined. The behavior of the probability density function of the turbidity removal efficiency for each configuration allows the verification of dispersion around the expected value for the four tested scenarios.
The results demonstrate the robustness of the alternative clarification system composed of an HCTF and a conventional decanter system. After determining the optimal flocculator length, the process efficiency remains within a range of values considered acceptable, even when significant variations occur in dimensional hydraulic parameters G and Q. For a relative standard deviation (RSD) of 20% (worst-case scenario evaluated), process efficiency variations between 1.3% and 5.2% were observed.
The purpose of these findings is to bolster the development of an alternative water clarification system consisting of an HCTF. They show that the optimal length model and probabilistic assessment can serve as promising tools for the creation of novel water and wastewater treatment units and the enhancement of existing ones.

Author Contributions

Conceptualization, D.S.O. and C.B.D.; methodology, D.S.O. and C.B.D.; software, D.S.O. and C.B.D.; validation, D.S.O. and C.B.D.; formal analysis, D.S.O. and C.B.D.; investigation, D.S.O. and C.B.D.; writing—original draft preparation, D.S.O. and C.B.D.; writing—review and editing, D.S.O. and C.B.D.; project administration, D.S.O. and C.B.D.; funding acquisition, D.S.O. and C.B.D. All authors have read and agreed to the published version of the manuscript.

Funding

APC was supported by the Foundation for Research Support of Espírito Santo (FAPES 18/2023-59579.895.19732.05022024), and National Council for Scientific and Technological Development (CNPq).

Institutional Review Board Statement

Not applicable.

Informed Consent Statement

Not applicable.

Data Availability Statement

The data presented in this study are available on request from the corresponding author.

Acknowledgments

The authors thank the Foundation for Research Support of Espírito Santo (FAPES), Federal Institute of Espírito Santo (IFES) and National Council for Scientific and Technological Development (CNPq).

Conflicts of Interest

The authors declare no conflict of interest.

References

  1. ONU. Progress on Drinking Water, Sanitation and Hygiene; World Health Organization (WHO): Geneva, Switzerland; United Nations Children’s Fund (UNICEF): New York, NY, USA, 2017. [Google Scholar]
  2. Prüss-Ustün, A.; Corvalán, C. Preventing Disease through Healthy Environments: A Global Assessment of the Burden of Disease from Environmental Risks; World Health Organization: Geneva, Switzerland, 2016. [Google Scholar]
  3. Menicucci, T.; D’Albuquerque, R. Sanitation Policy Vis-à-Vis Health Policy: Intersections, Discrepancies, and Their Effects; Sanitation as a public policy: A perspective from the challenges of the Brazilian Unified Health System (SUS); Fiocruz Strategic Studies Center: Rio de Janeiro, Brazil, 2018. (In Portuguese) [Google Scholar]
  4. Fiorentini, V. Use of Tannin in the Water Treatment Process as an Enhancement in Environmental Management System. Master’s Thesis, Federal University of Santa Maria, Santa Maria, Brazil, 2005. (In Portuguese). [Google Scholar]
  5. Fitzhugh, T.W.; Richter, B.D. Quenching Urban Thirst: Growing Cities and Their Impacts on Freshwater Ecosystems. BioScience 2004, 54, 741–754. [Google Scholar] [CrossRef]
  6. Prathna, T.C.; Sharma, S.K.; Kennedy, M. Nanoparticles in household level water treatment: An overview. Sep. Purif. Technol. 2018, 199, 260–270. [Google Scholar]
  7. Zhang, Y.; Sivakumar, M.; Yang, S.; Enever, K.; Ramezanianpour, M. Application of solar energy in water treatment processes: A review. Desalination 2018, 428, 116–145. [Google Scholar] [CrossRef]
  8. Kasaeian, A.; Rajaee, F.; Yan, W.-M. Osmotic desalination by solar energy: A critical review. Renew. Energy 2019, 134, 1473–1490. [Google Scholar] [CrossRef]
  9. Qi, H.; Huang, Q.; Hung, Y.-C. Effectiveness of electrolyzed oxidizing water treatment in removing pesticide residues and its effect on produce quality. Food Chem. 2018, 239, 561–568. [Google Scholar] [CrossRef]
  10. Mekonen, S.; Argaw, R.; Simanesew, A.; Houbraken, M.; Senaeve, D.; Ambelu, A.; Spanoghe, P. Pesticide residues in drinking water and associated risk to consumers in Ethiopia. Chemosphere 2016, 162, 252–260. [Google Scholar] [CrossRef]
  11. Chibowski, E.; Szcześ, A. Magnetic water treatment–A review of the latest approaches. Chemosphere 2018, 203, 54–67. [Google Scholar] [CrossRef]
  12. Latva, M.; Inkinen, J.; Rämö, J.; Kaunisto, T.; Mäkinen, R.; Ahonen, M.; Matilainen, J.; Pehkonen, S. Studies on the magnetic water treatment in new pilot scale drinking water system and in old existing real-life water system. J. Water Process Eng. 2016, 9, 215–224. [Google Scholar] [CrossRef]
  13. Chew, C.M.; Aroua, M.K.; Hussain, M.A. Advanced process control for ultrafiltration membrane water treatment system. J. Clean. Prod. 2018, 179, 63–80. [Google Scholar] [CrossRef]
  14. Wei, Y.; Zhang, Y.; Gao, X.; Ma, Z.; Wang, X.; Gao, C. Multilayered graphene oxide membranes for water treatment: A review. Carbon 2018, 139, 964–981. [Google Scholar] [CrossRef]
  15. Saleem, H.; Trabzon, L.; Kilic, A.; Zaidi, S.J. Recent advances in nanofibrous membranes: Production and applications in water treatment and desalination. Desalination 2020, 478, 114178. [Google Scholar] [CrossRef]
  16. Hylling, O.; Fini, M.N.; Ellegaard-Jensen, L.; Muff, J.; Madsen, H.T.; Aamand, J.; Hansen, L.H. A novel hybrid concept for implementation in drinking water treatment targets micropollutant removal by combining membrane filtration with biodegradation. Sci. Total Environ. 2019, 694, 133710. [Google Scholar] [CrossRef]
  17. Holt, P.K.; Barton, G.W.; Mitchell, C.A. The future for electrocoagulation as a localised water treatment technology. Chemosphere 2005, 59, 355–367. [Google Scholar] [CrossRef]
  18. Padmaja, K.; Cherukuri, J.; Reddy, M.A. A comparative study of the efficiency of chemical coagulation and electrocoagulation methods in the treatment of pharmaceutical effluent. J. Water Process Eng. 2020, 34, 101153. [Google Scholar] [CrossRef]
  19. Grohmann, A.; Reiter, M.; Wiesmann, U. New flocculation units with high efficiency. Water Sci. Technol. 1981, 13, 567–573. [Google Scholar]
  20. Carissimi, E.; Rubio, J. The flocs generator reactor–FGR: A new basis for flocculation and solid–liquid separation. Int. J. Miner. Process. 2005, 75, 237–247. [Google Scholar] [CrossRef]
  21. Carissimi, E.; Rubio, J. Characterization of the high kinetic energy dissipation of the Flocs Generator Reactor (FGR). Int. J. Miner. Process. 2007, 85, 41–49. [Google Scholar] [CrossRef]
  22. Sartori, M.; Danieli, O.; Edmilson, T.; Rauen; Neyval, W., Jr. CFD modelling of helically coiled tubes for velocity gradient assessment. J. Braz. Soc. Mech. Sci. Eng. 2015, 37, 187–198. [Google Scholar] [CrossRef]
  23. Oliveira, D.S.; Teixeira, E.C. Hydrodynamic characterization and flocculation process in helically coiled tube flocculators: An evaluation through streamlines. Int. J. Environ. Sci. Technol. 2017, 14, 2561–2574. [Google Scholar] [CrossRef]
  24. Oliveira, D.S.; Teixeira, E.C. Experimental evaluation of helically coiled tube flocculators for turbidity removal in drinking water treatment units. Water SA 2017, 43, 378–386. [Google Scholar] [CrossRef]
  25. Oliveira, D.S.; Teixeira, E.C.; Donadel, C.B. Novel approaches for predicting efficiency in helically coiled tube flocculators using regression models and artificial neural networks. Water Environ. J. 2019, 34, 550–562. [Google Scholar] [CrossRef]
  26. Ramesh, E.; Jalali, A. Machine-learning based multi-objective optimization of helically coiled tube flocculators for water treatment. Chem. Eng. Res. Des. 2023, 197, 931–944. [Google Scholar] [CrossRef]
  27. Bilde, K.G.; Hærvig, J.; Sørensen, K. On the design of compact hydraulic pipe flocculators using CFD-PBE. Chem. Eng. Res. Des. 2023, 194, 151–162. [Google Scholar] [CrossRef]
  28. Edzwald, J.K. Water Quality & Treatment: A Handbook on Drinking Water, 6th ed.; AWW Association; McGraw-Hill: New York, NY, USA, 2011. [Google Scholar]
Figure 1. Representative schematic of the experimental apparatus used.
Sustainability 16 02172 g001
Figure 2. Representative scheme of the decanter.
Sustainability 16 02172 g002
Figure 3. Schematic representation of an HCTF (front view).
Sustainability 16 02172 g003
Figure 4. Representative scheme of the concave downward trend of E f .
Sustainability 16 02172 g004
Figure 5. Probability density function of E f for scenario 1 (RSD = 5%) for configurations (a) #1, (b) #2, (c) #3, (d) #4, (e) #5, and (f) #6, at their optimal length.
Sustainability 16 02172 g005
Figure 6. Probability density function of E f for scenario 2 (RSD = 10%) for configurations (a) #1, (b) #2, (c) #3, (d) #4, (e) #5, and (f) #6, at their optimal length.
Sustainability 16 02172 g006aSustainability 16 02172 g006b
Figure 7. Probability density function of E f for scenario 3 (RSD = 15%) for configurations (a) #1, (b) #2, (c) #3, (d) #4, (e) #5, and (f) #6, at their optimal length.
Sustainability 16 02172 g007aSustainability 16 02172 g007b
Figure 8. Probability density function of E f for scenario 4 (RSD = 20%) for configurations (a) #1, (b) #2, (c) #3, (d) #4, (e) #5, and (f) #6, at their optimal length.
Sustainability 16 02172 g008
Table 1. Geometric and hydraulic characteristics of the tested HCTFs.
ArrangementConfigurationHCFT d   (m) D   (m) p   (m) L   (m) Q   (10−6 m³s−1)
#1#1#10.00950.11350.00222.6316.7
#25.26
#310.53
#415.80
#521.07
#626.31
#731.58
#836.84
#2#90.00950.11350.00222.6333.3
#105.26
#1110.53
#1215.80
#1321.07
#1426.31
#1531.58
#1636.84
#2#3#170.01270.11670.00272.9616.7
#185.92
#198.88
#2011.84
#2114.80
#2217.76
#2320.72
#2423.68
#4#250.01270.11670.00272.9633.3
#265.92
#278.88
#2811.84
#2914.80
#3017.76
#3120.72
#3223.68
#3#5#330.01590.11990.00321.8933.3
#343.79
#355.68
#367.58
#379.47
#3811.37
#3913.26
#4015.16
#6#410.01590.11990.00321.8966.7
#423.79
#435.68
#447.58
#459.47
#4611.37
#4713.26
#4815.16
Reference: Oliveira and Teixeira [24]—Adapted.
Table 2. Dimensionless parameters used in mathematical and statistical analyses.
ParameterTypeBasic Equation
Efficiency- E f ( % ) = 1 r e m a i n i n g   t u r b i d i t y i n i t i a l   t u r b i d i t y × 100
Reynolds NumberHydraulic R e = ρ · v · d μ
Camp NumberHydraulic C a = G . T = ρ · g · h F μ · T · V Q
p / L Geometrical p / L
D / d Geometrical D / d
Reference: Oliveira, Teixeira [25]—Adapted.
Table 3. Increasing/decreasing test of the first-order derivative.
Interval Sign   of   E f
] 0 , + c 4 p c 10 [ +
] + c 4 p c 10 , + [
Table 4. Optimal length analysis for configurations #1 to #6.
ConfigurationOptimal Length
Obtained from the Proposed Model (Red Dot in Graphical Representation Column)Expected Range (Gray Shading in Graphical Representation Column)Graphical Representation
#1 5.0 m0–5.3 mSustainability 16 02172 i001
#2 4.8 m2.6 m–10.5 mSustainability 16 02172 i002
#3 5.8 m3.0 m–8.9 mSustainability 16 02172 i003
#4 5.9 m3.0 m–8.9 mSustainability 16 02172 i004
#5 5.8 m5.7 m–9.5 mSustainability 16 02172 i005
#6 6.2 m5.7 m–9.5 mSustainability 16 02172 i006
Table 5. Comparative analysis between deterministic and probabilistic approaches for configurations #1 to #6 at their optimal length—scenario 1 (RSD = 5%).
ConfigurationTurbidity Removal Efficiency
Deterministic AnalysisProbabilistic Approach
RangeProbability of the Occurrence of a Turbidity Removal Efficiency Higher than Its Deterministic Value
#1 85.2%85.0–85.5% (Δ = 0.5%)42.9%
#2 81.4%80.8–81.8% (Δ = 1.0%)36.5%
#3 85.1%84.8–85.2% (Δ = 0.4%)45.6%
#4 82.3%81.9–82.7% (Δ = 0.8%)44.3%
#5 82.3%82.0–82.6% (Δ = 0.6%)40.2%
#6 78.0%77.4–78.5% (Δ = 1.1%)41.4%
Table 6. Comparative analysis between deterministic and probabilistic approaches for configurations #1 to #6 at their optimal length—scenario 2 (RSD = 10%).
ConfigurationTurbidity Removal Efficiency
Deterministic AnalysisProbabilistic Approach
RangeProbability of the Occurrence of a Turbidity Removal Efficiency Higher Than Its Deterministic Value
#1 85.2%84.7–85.7% (Δ = 1.0%)44.4%
#2 81.4%80.2–82.1% (Δ = 1.9%)42.2%
#3 85.1%84.7–85.5% (Δ = 0.8%)36.0%
#4 82.3%81.3–82.9% (Δ = 1.6%)39.9%
#5 82.3%81.7–82.8% (Δ = 1.1%)37.6%
#6 78.0%76.5–79.3% (Δ = 2.8%)55.9%
Table 7. Comparative analysis between deterministic and probabilistic approaches for configurations #1 to #6 at their optimal length—scenario 3 (RSD = 15%).
ConfigurationTurbidity Removal Efficiency
Deterministic AnalysisProbabilistic Approach
RangeProbability of the Occurrence of a Turbidity Removal Efficiency Higher Than Its Deterministic Value
#1 85.2%84.4–85.9% (Δ = 1.5%)47.5%
#2 81.4%79.5–83.0% (Δ = 3.5%)53.9%
#3 85.1%84.5–85.5% (Δ = 1.0%)40.6%
#4 82.3%81.1–83.3% (Δ = 2.2%)46.6%
#5 82.3%81.4–83.1% (Δ = 1.7%)50.2%
#6 78.0%76.4–79.8% (Δ = 3.4%)33.7%
Table 8. Comparative analysis between deterministic and probabilistic approaches for configurations #1 to #6 at their optimal length—scenario 4 (RSD = 20%).
ConfigurationTurbidity Removal Efficiency
Deterministic AnalysisProbabilistic Approach
RangeProbability of the Occurrence of a Turbidity Removal Efficiency Higher Than Its Deterministic Value
#1 85.2%84.2–86.0% (Δ = 1.8%)45.2%
#2 81.4%78.3–83.5% (Δ = 5.2%)49.5%
#3 85.1%84.2–85.5% (Δ = 1.3%)37.8%
#4 82.3%80.5–83.6% (Δ = 3.1%)49.2%
#5 82.3%81.0–83.3% (Δ = 2.3%)48.3%
#6 78.0%75.5–79.8% (Δ = 4.3%)41.5%
Disclaimer/Publisher’s Note: The statements, opinions and data contained in all publications are solely those of the individual author(s) and contributor(s) and not of MDPI and/or the editor(s). MDPI and/or the editor(s) disclaim responsibility for any injury to people or property resulting from any ideas, methods, instructions or products referred to in the content.

