Article

Design of Concrete Block Paving in Home Zone Traffic Circle Areas

by
Stanisław Majer
1,*,
Alicja Sołowczuk
1 and
Marek Kurnatowski
2
1
Department of Construction and Road Engineering, West Pomeranian University of Technology in Szczecin, 71-311 Szczecin, Poland
2
Department of Sanitary Engineering, West Pomeranian University of Technology in Szczecin, 71-311 Szczecin, Poland
*
Author to whom correspondence should be addressed.
Sustainability 2024, 16(5), 1973; https://doi.org/10.3390/su16051973
Submission received: 1 February 2024 / Revised: 20 February 2024 / Accepted: 23 February 2024 / Published: 27 February 2024
(This article belongs to the Special Issue Sustainability in Pavement Materials and Design)

Abstract

:
Contemporary street space upgrade or regeneration projects tend to include setting up home zones that are located in large city suburbs, smaller towns or spas. These home zones feature one-way streets, merging of a pavement and carriageway into one level surface and various traffic calming measures (TCM), including speed tables and traffic circles (TC). Concrete paving blocks are the preferred surfacing material. As part of this study, traffic surveys were carried out in a small seaside spa in Poland to determine the accelerations and decelerations of vehicles passing through four traffic circles that have different central island heights and different streetscape characteristics. A visual assessment of the pavement condition was also carried out. The pavement deformation changes were analysed using 3D models derived on the basis of the terrestrial laser scanning data obtained with the Trimble SX10 scanning total station. The existing pavement structure was analysed as part of this study. Next, the areas that require strengthening were identified based on subsidence and horizontal forces analyses, with the latter calculated from the observed decelerations and accelerations of the passing vehicles. Finally, design guidelines are given for concrete block surfacing in high traffic impact locations.

1. Introduction

In recent years, Municipal Parking Systems have been implemented in Poland with an increasing frequency. They are located in appropriately selected neighbourhoods of large cities, in smaller towns and, last but most frequently, in small spa towns or villages. The problems of urban traffic management strategies and paid parking management strategies have been studied by various researchers, including [1,2,3]. The designation of new parking spaces involves posting a number of the required traffic signs. The associated cost, covering design, installation and maintenance could be a consideration, in particular when planning such parking in small spa towns and villages [4]. This being so, the authorities may choose, for economic reasons, to implement home zones (HZ) instead. There, parking is only allowed in appropriately marked places, thus limiting the number of the required signs [5,6]. Worthwhile to note at this point are other benefits of a home zone implementation, which include increased traffic safety and reduced driving speeds resulting in less pollution and road traffic noise [7,8]. Various traffic calming measures are considered in home zone design, including vertical and horizontal deflections [9,10,11,12,13], changes to the existing traffic management system [14,15,16] and merging of paths and carriageways into one level surface with appropriately designed surfacing.
In designing the traffic-calming measures, much attention is paid to traffic safety and their environmental and public health impacts [8]. There are also many studies that analyse the effectiveness of various TCM in home zone areas. The analysed traffic-calming measures include speed humps and speed tables [14,15,16,17], chicanes and traffic circles (TC) [5]. Attention has also been paid to the road surroundings [18]. The effects of repeating speed humps or speed tables along the way and the related slowed driving lengths have also been also analysed [15,16,19,20,21,22]. On the other hand, there are no reports on pavement condition surveys on traffic-calming measures in operation or a determination of variations in pavement distress before and after traffic-calming measures. Noteworthy, the study carried out by Loprencipe et al. [15] showed the importance of taking into account the relevant factors including driving comfort, speed table geometry and driving dynamics in the traffic-calming design process. Since home zone traffic-calming schemes are designed to slow down traffic to about 20 km/h [6,10,11,12,13], we should check the relevance of the respective geometric and dynamic parameters of vertical deflections for deformations and other types of pavement distress that may be found in the area. This represents a research gap in the research on home zone traffic-calming.
In home zones, road pavements are generally designed for passenger car traffic. Commercial and municipal service vehicles are expected to appear only sporadically but more often than public transport vehicles, which are expected only in extraordinary situations. Thus, the lowest traffic class is generally adopted for these pavements in the Polish road classification system referred to as KR1 [12,23]. The currently applied design guidelines do not give any specific requirements for the design of pavements at vertical traffic deflections, as might be expected taking into account the high magnitudes of dynamic actions imposed by vehicles passing high central islands ∆h at higher-than-allowed speeds. According to Zapata et al. [24], environmental factors should also be taken into account in pavement design, including precipitation, temperature, cyclic freezing and the depth of the groundwater table under the pavement. However, these conditions are the same as before, within and past the traffic circle on the two streets under analysis. Thus, there must be some other relevant factors responsible for the noted variation in pavement deformations and distress at traffic circles.
Considering the large number of factors that may be taken into account, we checked for the applicability of the principles of Total Quality Management (TQM) [25] and Ishikawa’s heuristic method [26,27,28] known for its seven basic quality tools. The applicability of the former method in road engineering was investigated, and it was verified as appropriate, in particular, for traffic-related analyses [29].
Pavement condition assessment in traffic-calming zones is yet another issue related to the road pavement design at vertical deflections. This concerns, in particular, pavement distress and surface deformations at speed tables. The terrestrial laser scanning (TLS) method, i.e., a pavement condition survey method using a scanning total station, has been widely used in this application in recent years [30,31,32,33]. The terrestrial laser scanning survey data are logged as a 3D model, allowing for a highly accurate assessment of the pavement condition, including depths of surface damage and deformation [30,31,32]. Azam et al. [30] and Beshr et al. [32] also used this method to measure the joint gaps, ravelling, cracking, edge spalling and other types of pavement distress. Their study demonstrated that the terrestrial laser scanning technique may be effectively used in place of the so-far-used visual pavement condition survey methods, saving much time and effort.
The above review reveals a significant research gap in the area of pavement design and strengthening required due to the following:
Increased dynamic loading at vertical deflections,
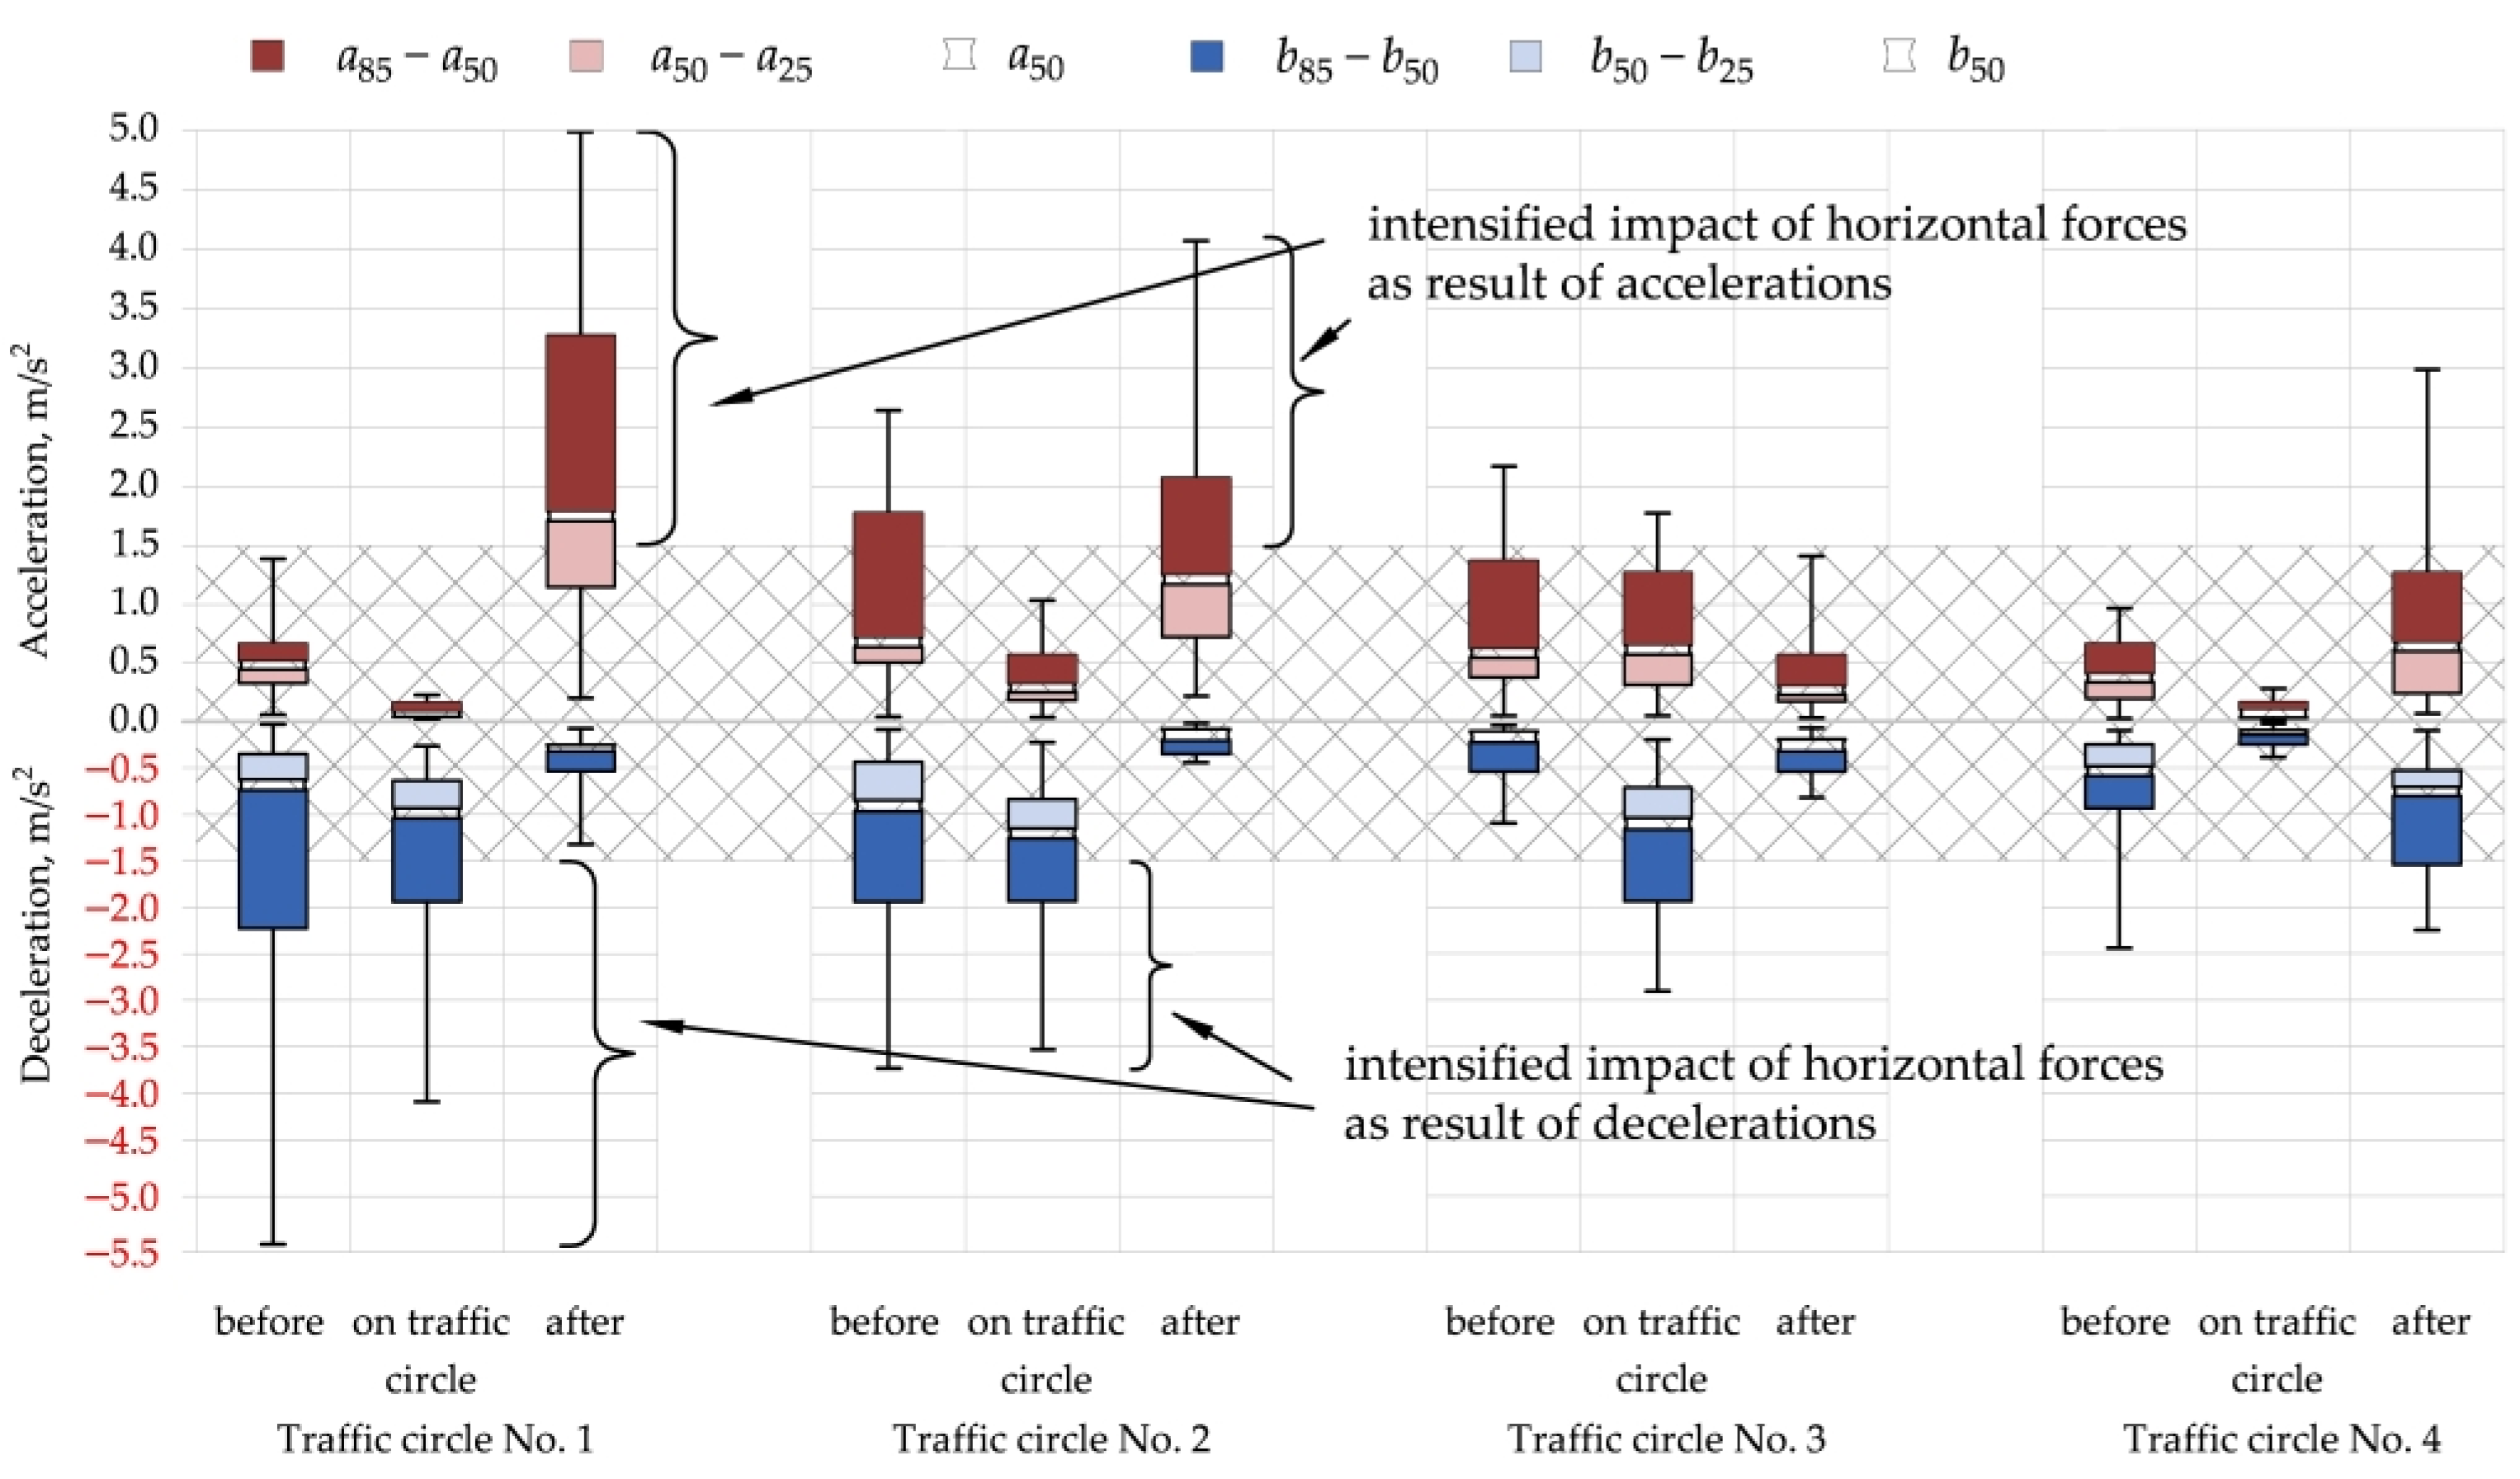
Higher horizontal forces caused by decelerations and accelerations, whose magnitudes depend on the driving habits and tempers of drivers.
These aim to avoid the progressing deterioration of pavements in these locations. The second research gap concerns a lack of raised central island height determination guidelines for home zone traffic circles that should take into account the streetscape characteristics, traffic composition, street function and turning movements in one-way street junctions. These research gaps were taken into account in setting the study goals defined by the following research hypotheses:
Research Hypothesis 1. 
Is there a relationship between the pavement deformation location and magnitude of its parameters (surface area p, depth g, distance l) on the one hand and traffic parameters (v85, vav, vmax), deceleration b85, bav, bmax and acceleration a85, aav, amax or central island difference of level central island Δh?
Research Hypothesis 2. 
Is it possible to determine the extent of higher impact of traffic parameters based on the processed terrestrial laser scanning models DM3D and determine a change to the pavement structure on this basis?
This article, in turn, proposes a sustainable pavement design approach to home zone traffic circle areas. Focus is placed on the assessment of traffic conditions, condition of pavement and environmental factors after twenty years of pavement operation in a home zone area to support a sustainable pavement design process. The article is divided into sections, of which Section 2 gives the study assumptions, and Section 3 presents the obtained results, which are discussed in Section 4. Section 5 presents the final conclusions and proposes pavement structure design with due consideration of the relevant sustainability factors characterising the area around the traffic circle.
The research method used in this study is presented in Figure 1.

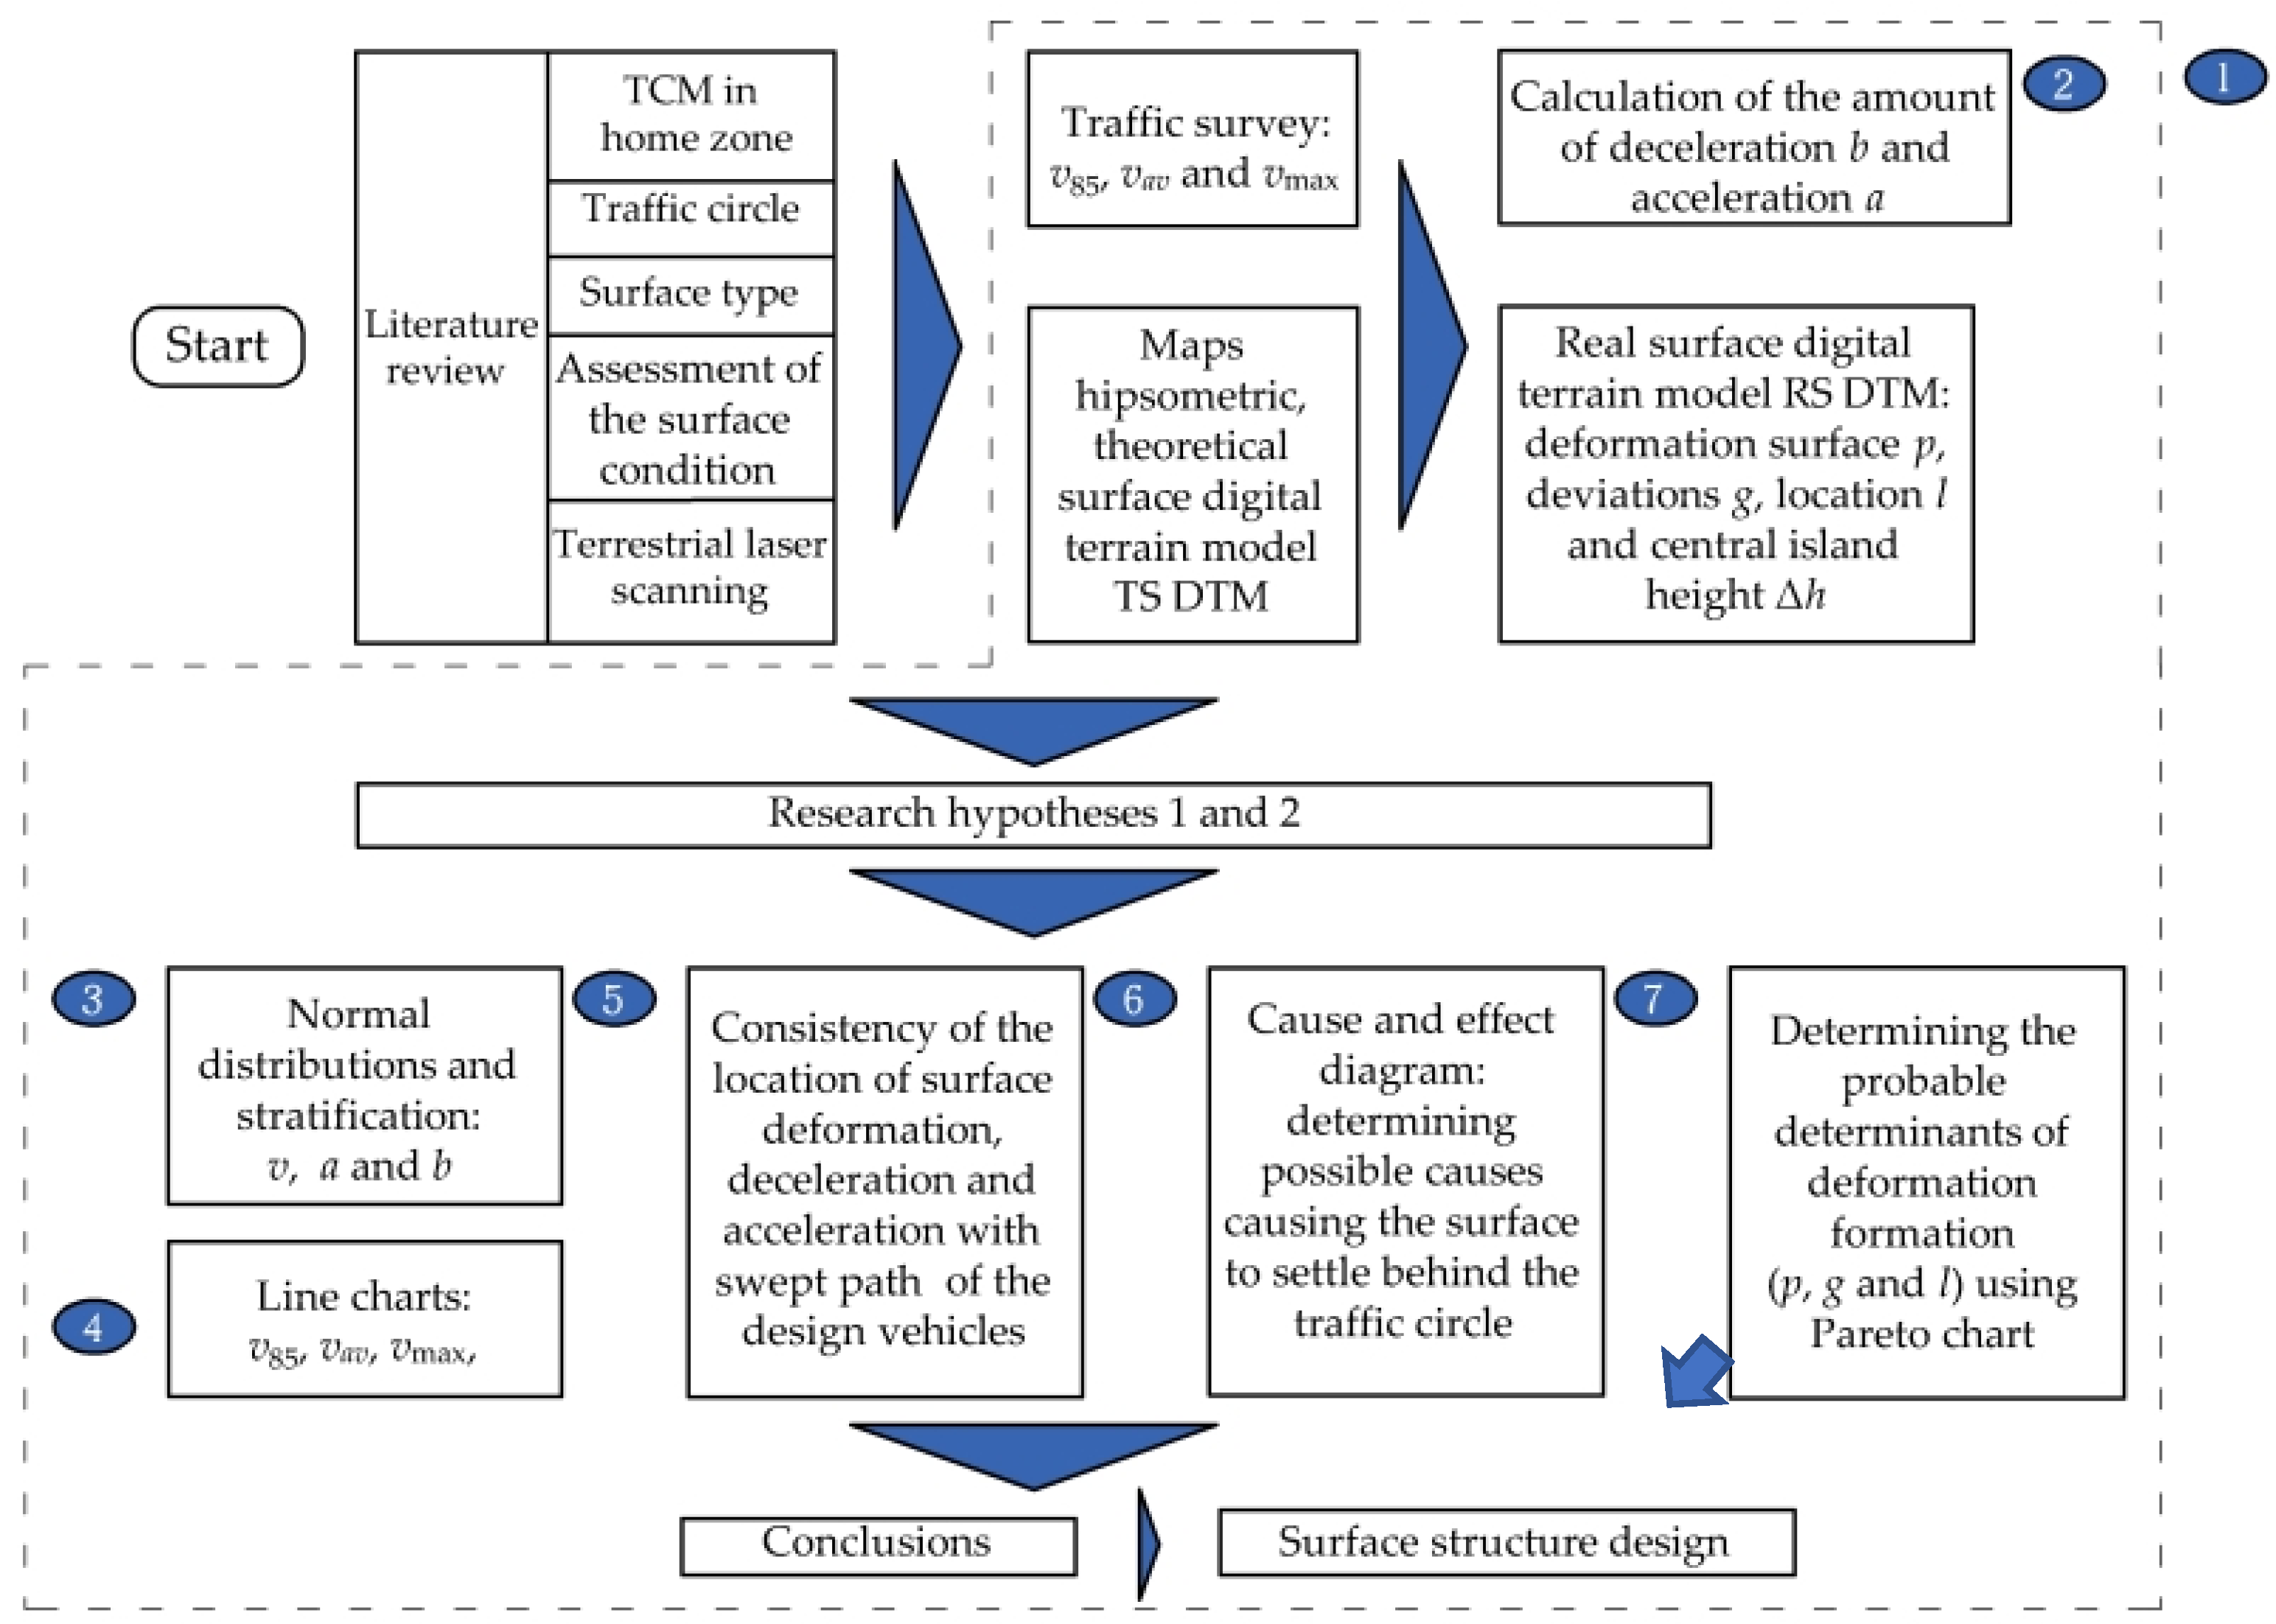
2. Materials and Methodology
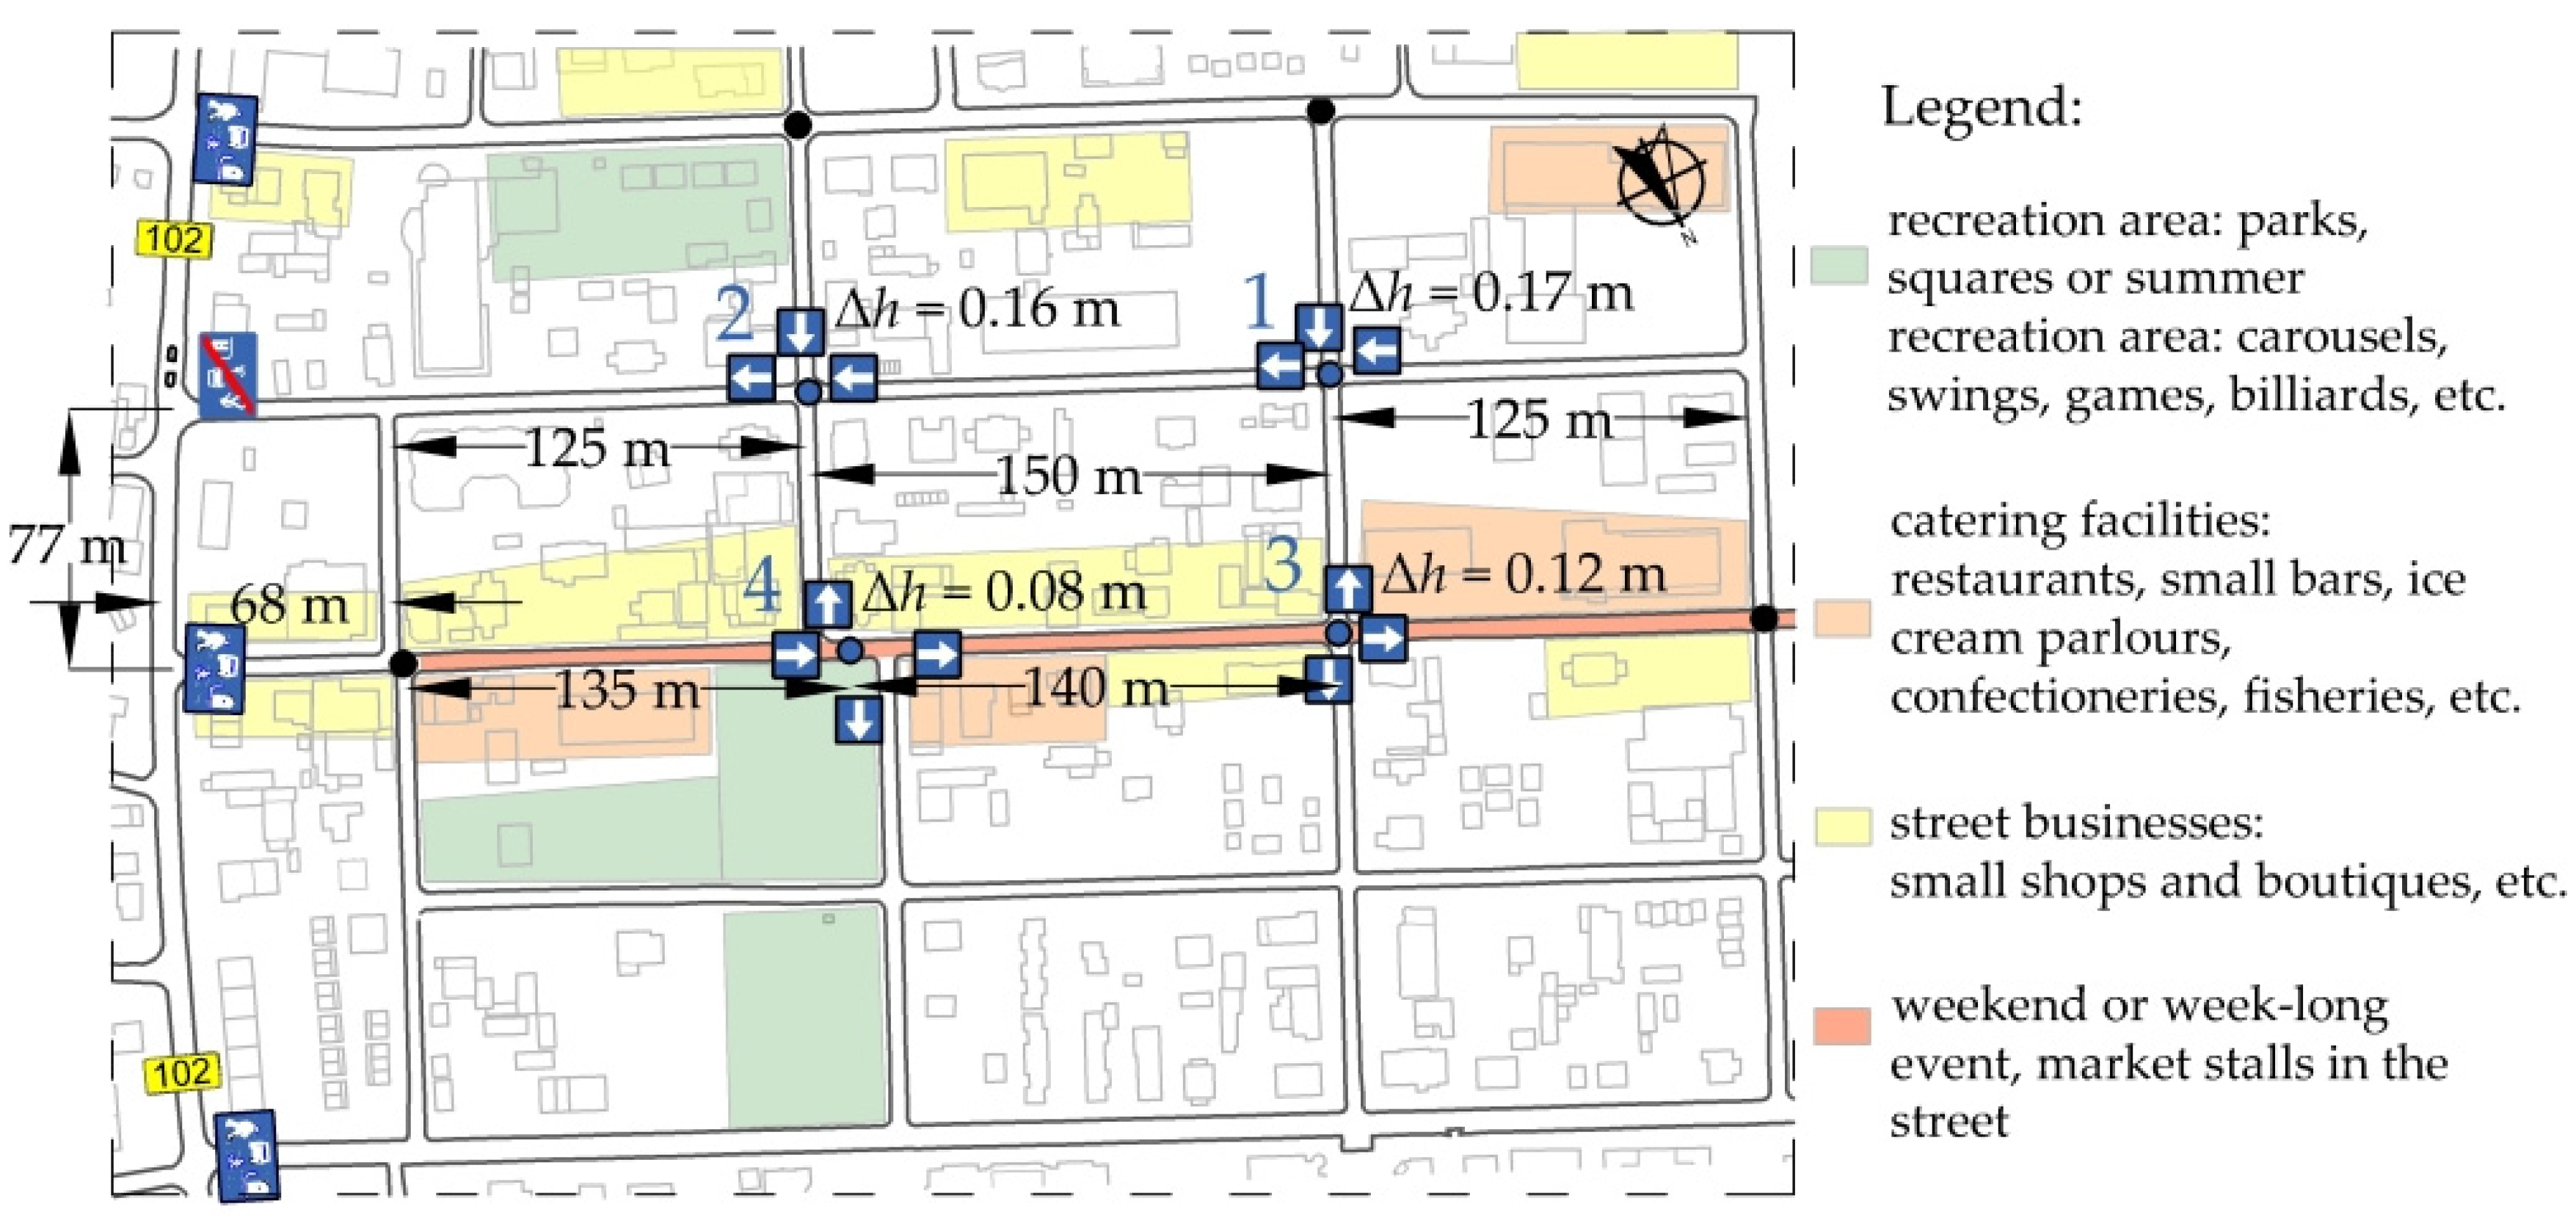
2.1. Study Area

As a preparation for the study on the effect of the installed traffic circle on pavement deformations and distress in home zone areas, we analysed a few home zones established over a dozen years ago in Wolin and Międzywodzie, Poland, and pre-selected fourteen traffic circles for further analyses in this study. Based on a detailed analysis covering the central island level difference of the pre-selected traffic circles, traffic conditions, location of the junctions down the street and visual pavement condition assessment, four traffic circles were chosen for further analyses, all located in the seaside spa village of Międzywodzie. These traffic circles were located within a close distance from each other, and they had similar subsurface and traffic conditions. There has been no major maintenance carried out on any of these traffic circles in the twenty-year period of service. This ensured the consistency of the input data for analysing the effects of the central island ∆h parameter on the surface condition around the traffic circles under analysis. The only difference between them was the central island ∆h value. This variation in central island ∆h was related to differences in street functions, streetscape character and location on one-way streets. The locations of the four traffic circles chosen for analyses are shown in Figure 2. Their numbers increase in the order of increasing central island ∆h. All the analysed streets and traffic circles had concrete block paving designed for the lowest traffic duty class, as appropriate for very low traffic volumes observed there. In addition, the streetscape differences are marked in colour in Figure 2.
On TC–1 and TC–2, the designed central island ∆h value also took into account the approach section’s length and the street length past the traffic circle (Figure 2), as these parameters may influence the drivers’ perception. Also, in this case, the greater ∆h value was probably related to the street function. In this home zone, the analysed area is the only outbound street, lined with private homes and small holiday houses. The parking lane is generally occupied by holidaymakers’ cars in summer. Beyond the summer period, the parking lanes are empty most of the time, and this lack of side obstructions provokes drivers to exceed the home zone’s speed limit.
As regards the central island ∆h values of TC–3 and TC–4, the designers considered the high-profile location and recreational function of this street, serving as the main promenade of Międzywodzie (Figure 2). Consequently, they designed these traffic circles with much lower central island ∆h values. In summer, the parking lanes are occupied by lots of cars, and beyond summer, cars generally stop only at public buildings or year-round-open holiday houses or health resorts.
The traffic duty class and the resulting pavement design were determined assuming that the street would be used by heavy commercial vehicles, municipal service vehicles and a small number of trucks with trailers heading mainly to construction sites emerging in growing numbers in this rapidly developing spa village. Load imposed by coaches transporting children to summer camps, although less frequent that the above vehicle types, were also taken into account. The KR1 traffic duty class was finally selected for the pavement design, as per the Polish pavement design system [23,34], taking into account the above-described traffic characteristics and the seaside environmental impact. The KR1 class assumes a traffic loading of N100 < 0.09 million standard axles of 100 kN per lane throughout the design service life. The designed concrete block pavement consisted of 8 cm concrete blocks laid on a 3 cm thick 1:4 cement–sand bedding, 20–37 cm thick macadam roadbase and 15 cm thick cement-bound subbase layer. A piped storm drainage system, as might be expected for a home zone area, was not designed in this case. Therefore, taking advantage of a highly permeable subgrade composed of sand, concrete grid paving slabs were placed in the parking lanes instead of conventional road gullies.

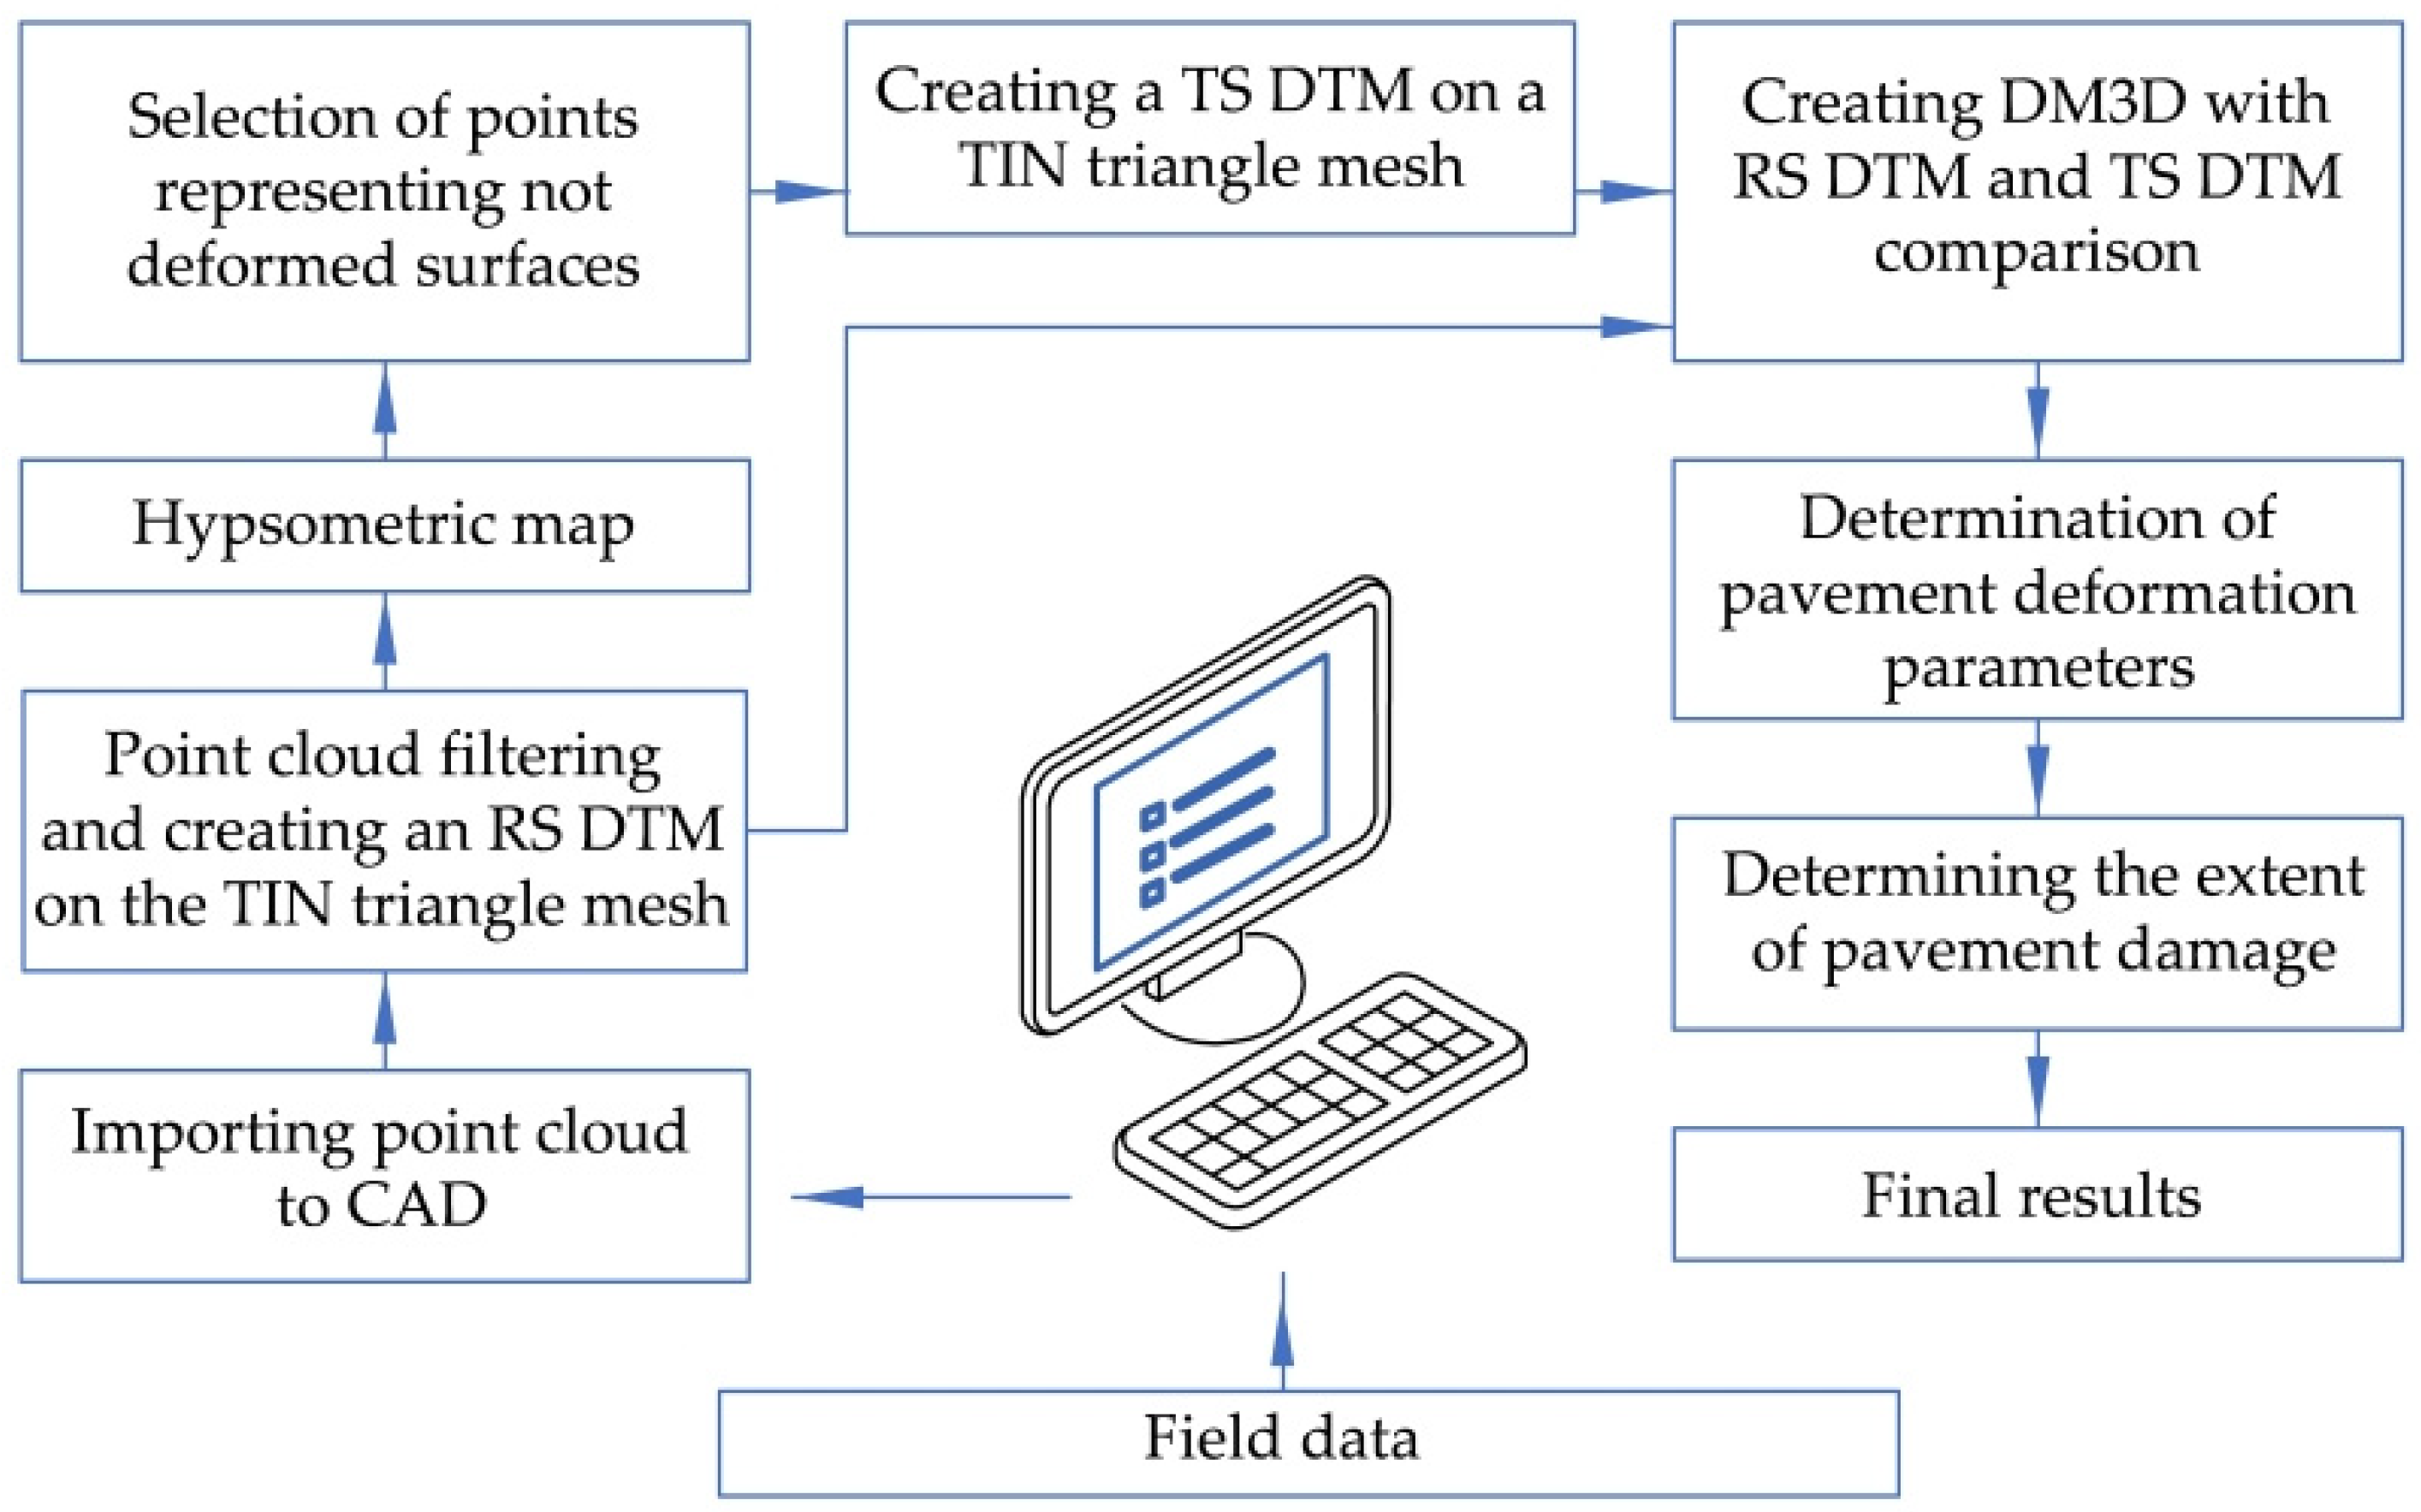
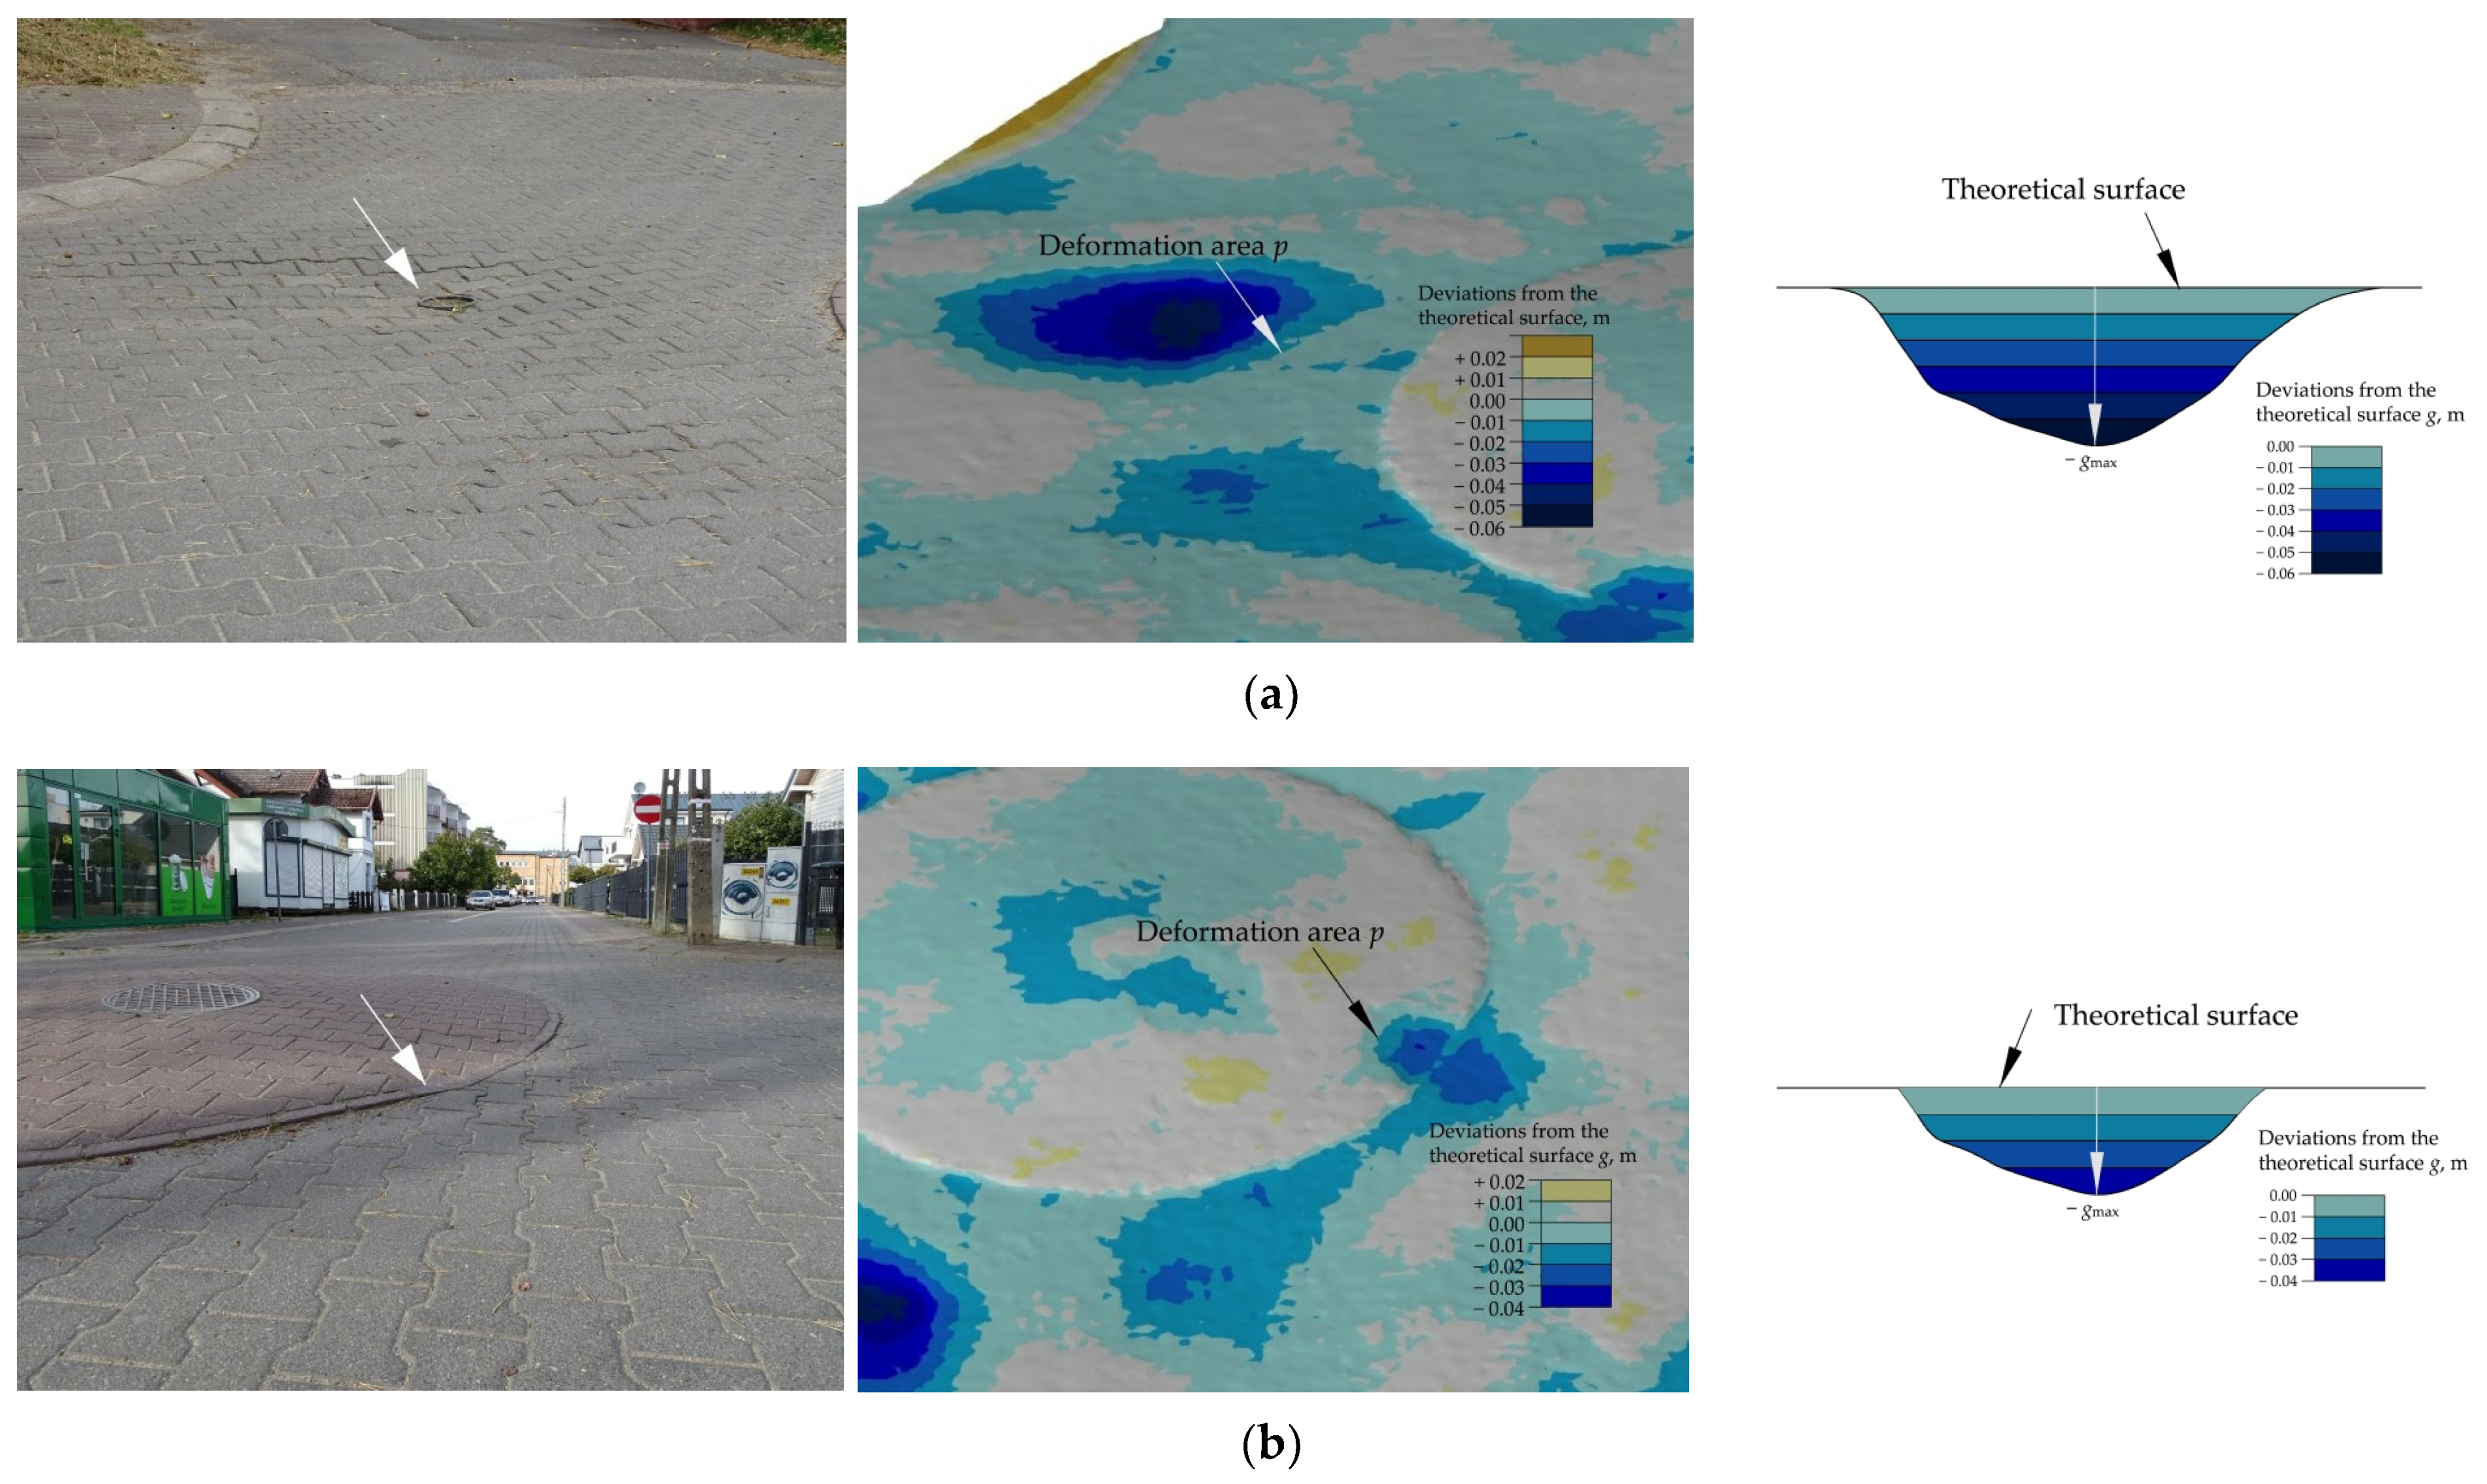
2.2. Road Surface Deformation Measurement Using 3D Scanning Method

The Trimble SX10 scanning total station was used to measure the geometrical parameters of streets and junctions and the pavement conditions. This instrument offers a 3D positioning accuracy of up to 1.5 mm [35]. The surface scanning used the control points of the local coordinate systems. For each of the traffic circles under analysis, a separate x, y and z coordinate system was set up. The positions of the respective scanner stations were determined using the angular–linear space resection method to a 0.001 m accuracy. Each scan of the respective traffic circle surfaces was obtained from two scanner stations positioned symmetrically about the central island (Figure 3). The purpose was to obtain an accurate representation of the x, y and z coordinates at the central island edges and at pavement deformations which were not represented in the scan obtained from a single station. The most probable cause of these inadequacies is vehicle and pedestrian traffic during total station measurements. Figure 3a shows one of the applied total station layouts. The scanning survey covered the circular traffic junction area and a ca. 10 m length of the main legs, measuring from the central island edge.
The point cloud was refined at pavement deformation spots and at the interfaces of the modelled surfaces. Trimble Business Center TBC version 2023.10, software was used for the post-processing of the obtained field data. Points representing foreign objects were filtered out, followed by sampling to finally obtain a grid of triangles of a 5 cm average side length. The sampled point cloud was used to generate the Real Surface Digital Terrain Model (RS DTM) in a Triangulated Irregular Network (TIN) structure. This model, typically called, in short, RS DTM, was used in the subsequent analyses of this study. Figure 4 presents the sequence of actions, including cloud point analysis, hypsometric map generation, estimation of deformations and other pavement distresses.
Figure 5a shows a hypsometric map of the street section under analysis, generated on the basis of RS DTM.
In addition, a theoretical surface model TS DTM was also defined using selected evenly distributed points, representing the analysed surface. The points used for this purpose were selected from areas where no deformations had been identified. TS DTM was defined for the traffic circle assuming a symmetrical geometry of the central island and maximum actual elevation of the central island centre. The central island edge point elevations were taken from measurements, leaving out any points located in deformation spots. RS DTM and TS DTM models were then superimposed to get a 3D model of local pavement deformations (DM3D). Figure 5a shows a traffic circle No. 1 hypsometric map. A one-way crossfall can be seen on the main road while the approach legs have two-way crossfalls. Pavement deformation spots are marked in Figure 5a with black rectangles. Pavement deformations designated No. 1 and No. 4 are located at gas valve manholes, and deformation No. 2 is located at a sewer manhole. The other deformations shown in Figure 5a are not related to underground infrastructure locations. Figure 5b shows the deviations of RS DTM (Figure 5a) from TS DTM based on DM3D. As per the legend of Figure 5b, bluish colours represent areas located below the theoretical surface, while yellowish and reddish colours represent the areas located above it. The analysis of the distribution of various pavement deformations showed that their locations coincided with the vehicle wheel paths and, thus, should be associated with higher horizontal forces acting at these locations. The thick dashed line in Figure 5b designates parking lane areas which were excluded from the further surface subsidence analyses. Figure 5b also shows li zones defined for the analysed junctions for the determination of pavement deformations and traffic impact factors, including accelerations and decelerations of vehicles navigating the central island, measured in the traffic flow direction.
Figure 6 shows an example of a pavement deformation spot. The subsequent examples show various deformations and other pavement distresses located before, within and past the traffic circles, i.e., places exposed to higher accelerations and decelerations. In the analysed traffic circles, the most frequently observed problem was the subsidence of the pavement, often accompanied by the spalling or chipping of the central island kerb. In TC–1 and TC–2, some shallow cavities were also observed on a few concrete paving blocks located in the middle of the central island on the approach side, accompanied by scratches caused by vehicles driving on the raised surface.

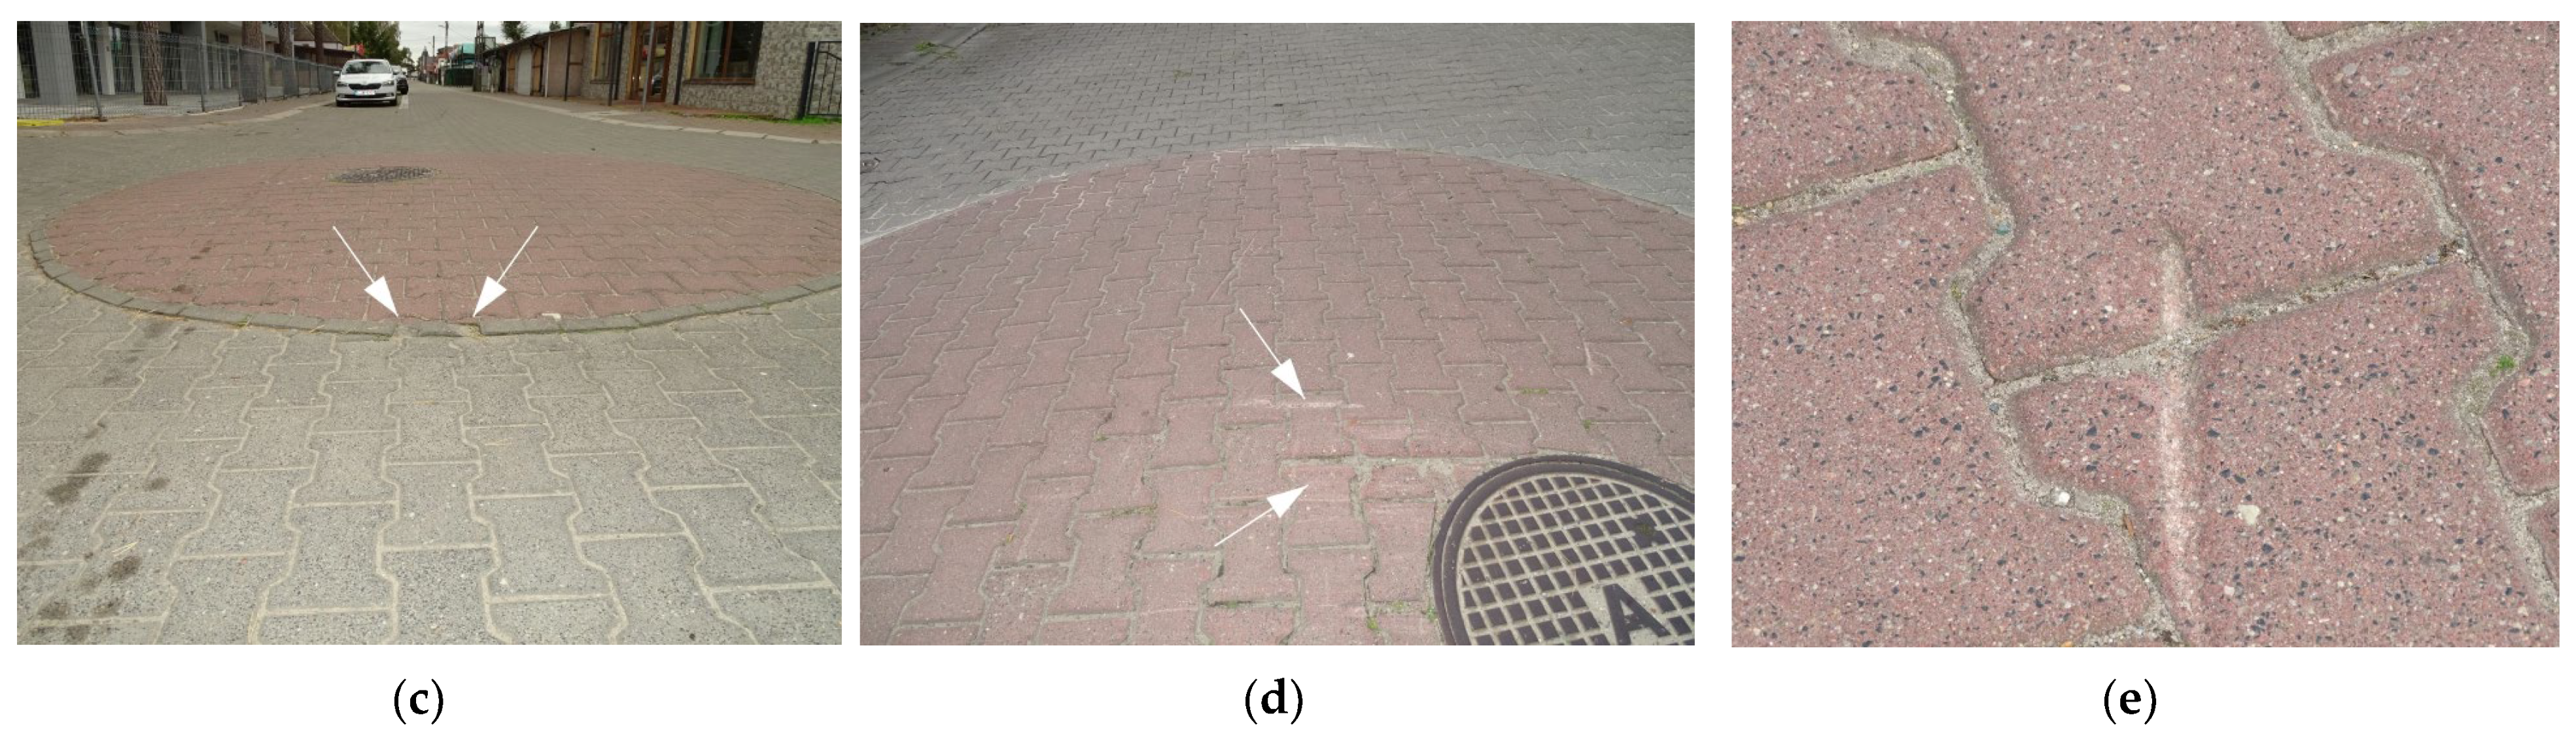
2.3. Traffic Volume and Speed Surveys

Traffic surveys including simultaneous traffic volume and speed measurements were conducted along the passage through a traffic circle. The instrumentation used for these surveys consisted of a few time-synchronized SR4 traffic detection devices (Figure 7) mounted along the way on traffic signposts. Since these were all one-way streets, the vehicle speeds were measured in one direction only. Taking into account the positions of parking bollards before and past the traffic circle and all-round orientation of SR4 devices, speeds were measured at the same places on all the analysed traffic circles, within a 1 m tolerance. This ensured the comparability of the data used in the subsequent analyses. The traffic surveys were carried out in autumn at low traffic volumes and with hardly any vehicles occupying the parking lane. The surveys lasted a few hours each and were discontinued when the number of speed records exceeded 100. The measured hourly traffic volumes did not exceed 30 veh./h. In view of the above, a free traffic flow situation can be assumed [36]. In addition, for comparison purposes, free-flow traffic speed measurements were taken on a straight section between two adjacent traffic circles, as per the recommendations of [37,38]. During the free-flow speed measurements, there were no vehicles parked in the parking lane on the analysed section. Without side obstacles in place, it was the drivers’ driving style and temper that determined the driving speed in this section [22]. Only three speed parameters were used in further analyses: v85, vav and vmax. The decelerations and accelerations were calculated based on the obtained results.

2.4. Horizontal Forces Estimation

Accelerations and decelerations of passenger cars passing through a traffic circle were estimated for the purposes of pavement damage and deformation analysis in consideration of the dynamic characteristics of a vehicle passing through a raised central island. The maximum, average and 85th percentile values were estimated as the next step of this analysis. This method allowed us to ignore the vehicle’s weight in the horizontal force calculations, as the accelerations and decelerations concerned the same vehicle in each case [37,38]. Next, ranges of acceleration (amax, a85, aav) and deceleration (bmax, b85, bav) were determined for each of the analysed traffic circles. The deceleration/acceleration distribution patterns were then related to the site location, severity of pavement distress and pavement deformation data obtained with the relevant DM3D models described in Section 2 above.
The obtained decelerations and accelerations were to be compared, later on, with the corresponding data obtained on the straight street section located between the adjacent traffic circles in order to identify high traffic impact locations imposed by vehicles passing through the subsequent traffic circles on their way down the street. The latter decelerations and accelerations did not exceed 0.75 m/s2. Based on the analysis of the studies and findings described in [37,38], high traffic impact spots, i.e., the places where higher horizontal forces are imposed on the pavement by the passing vehicles, were identified where two-times higher accelerations and decelerations were noted, as compared to the straight in-between section.

3. Results

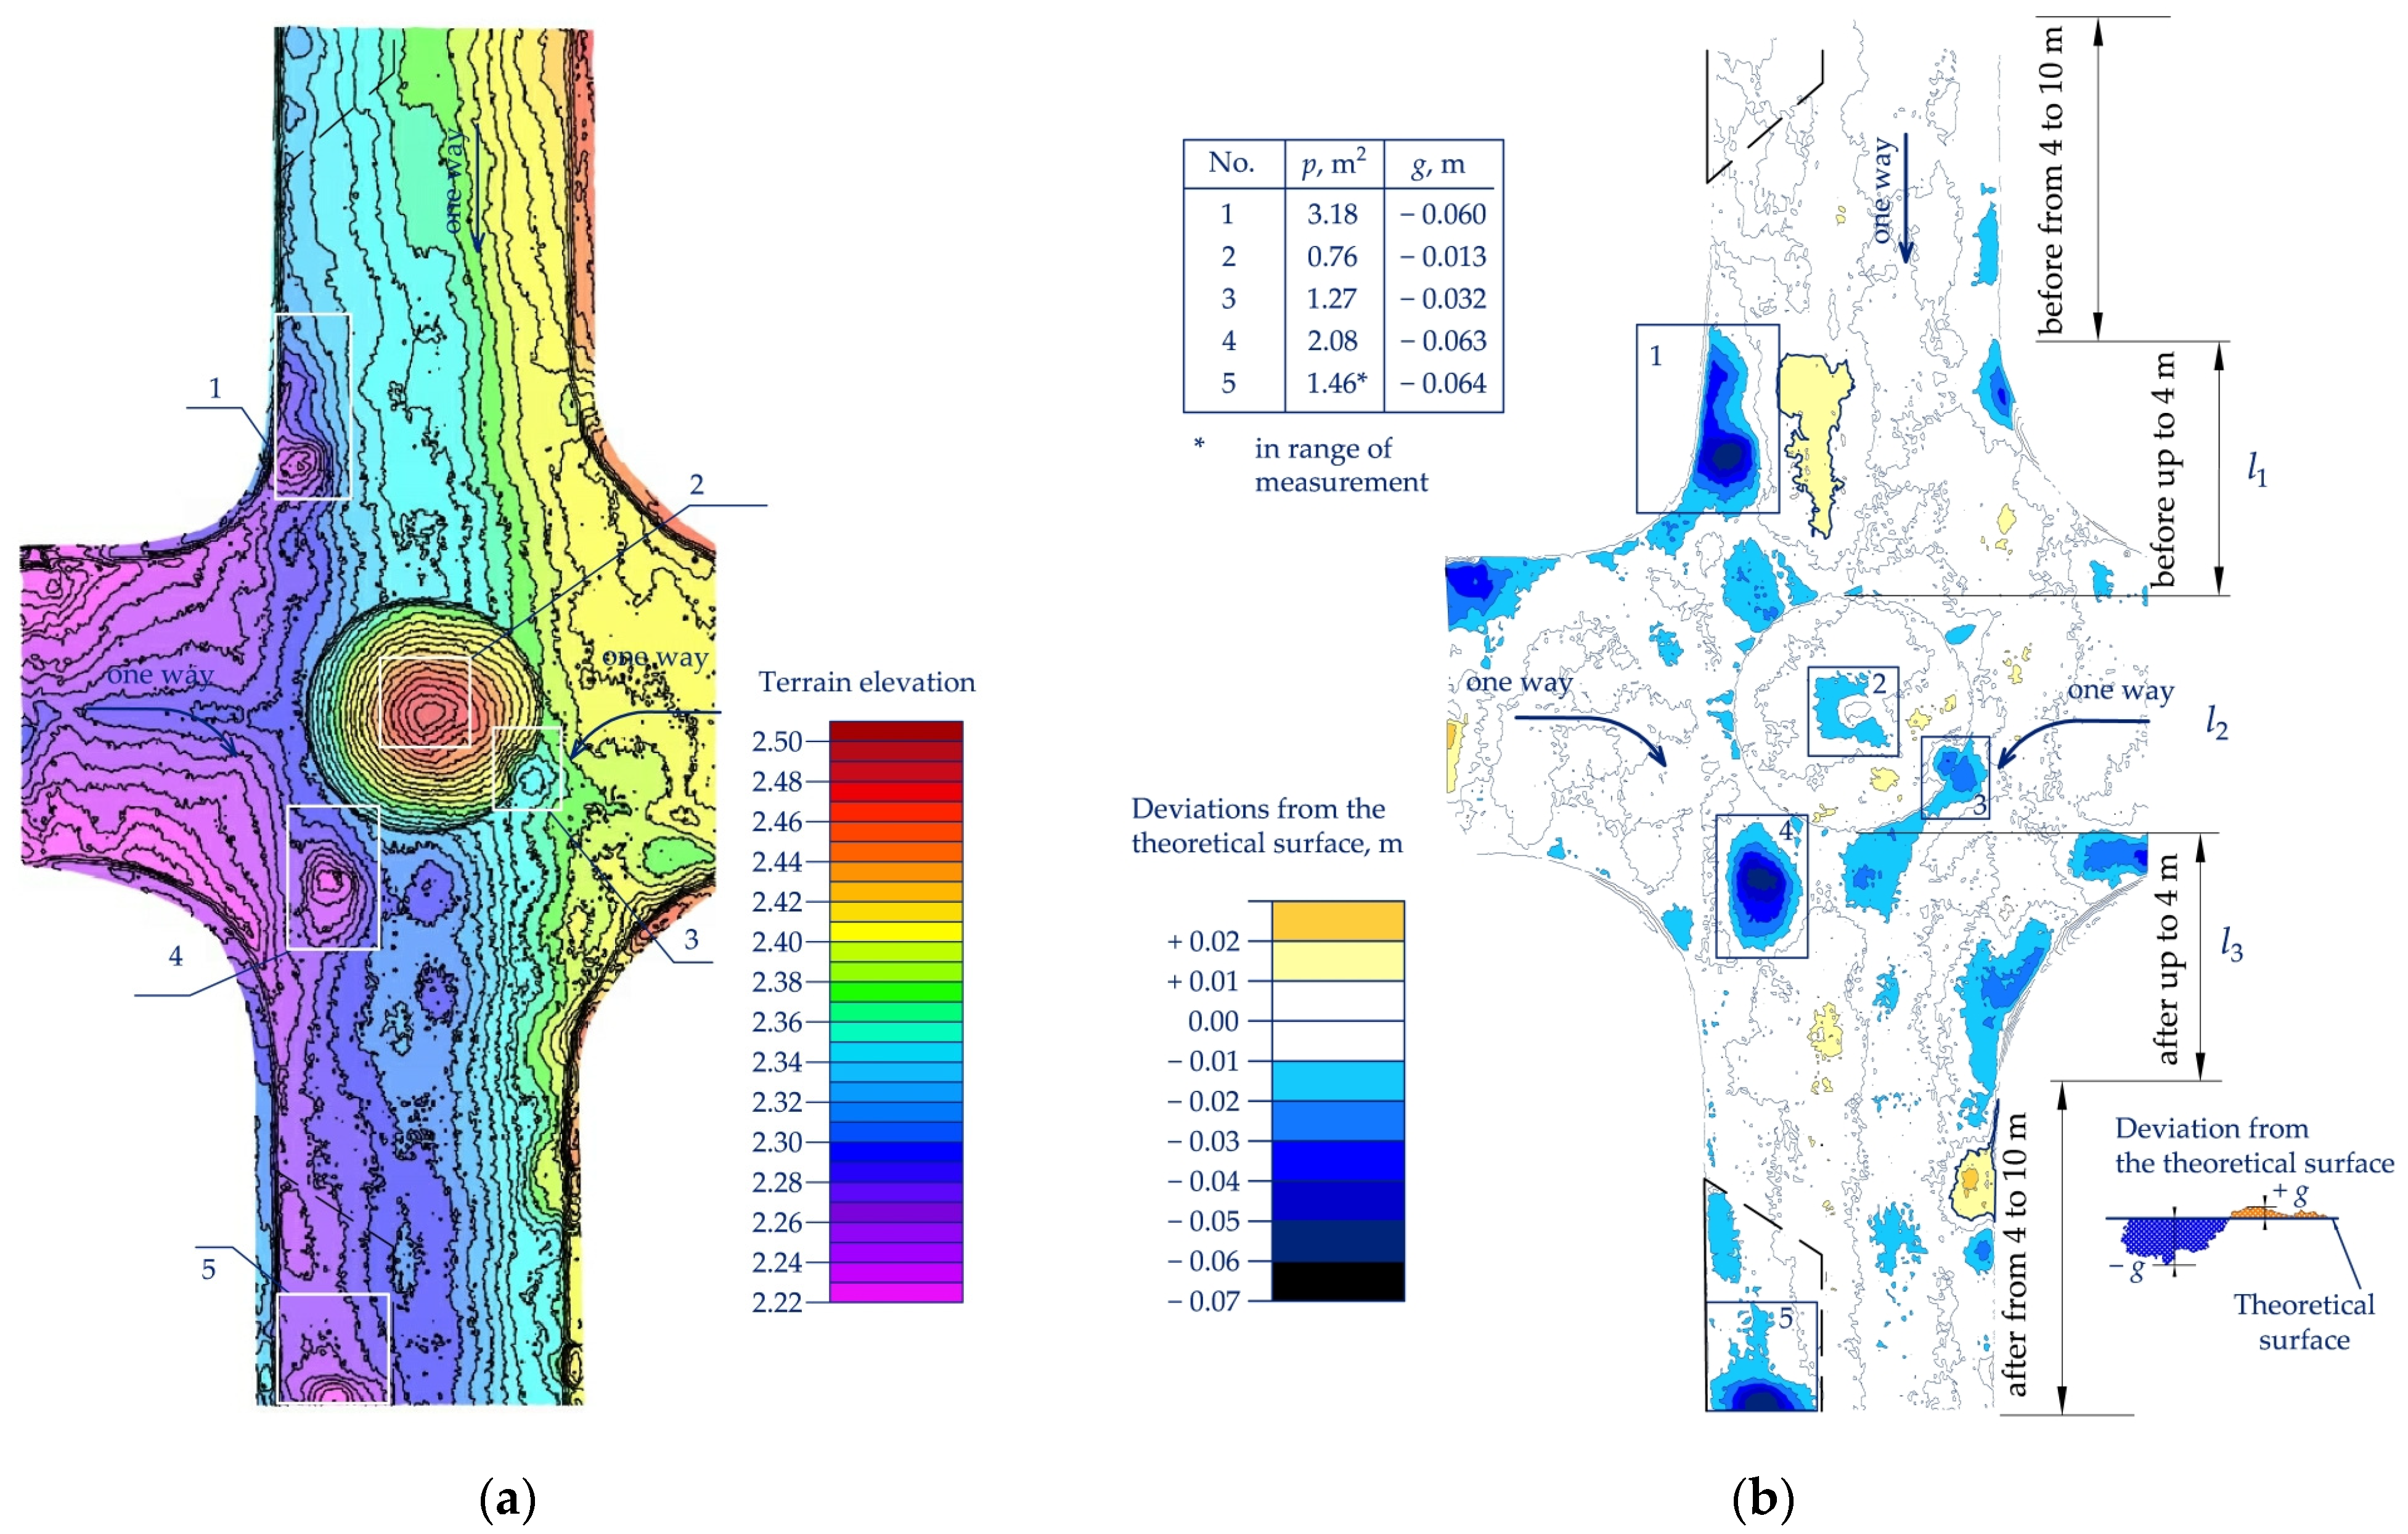
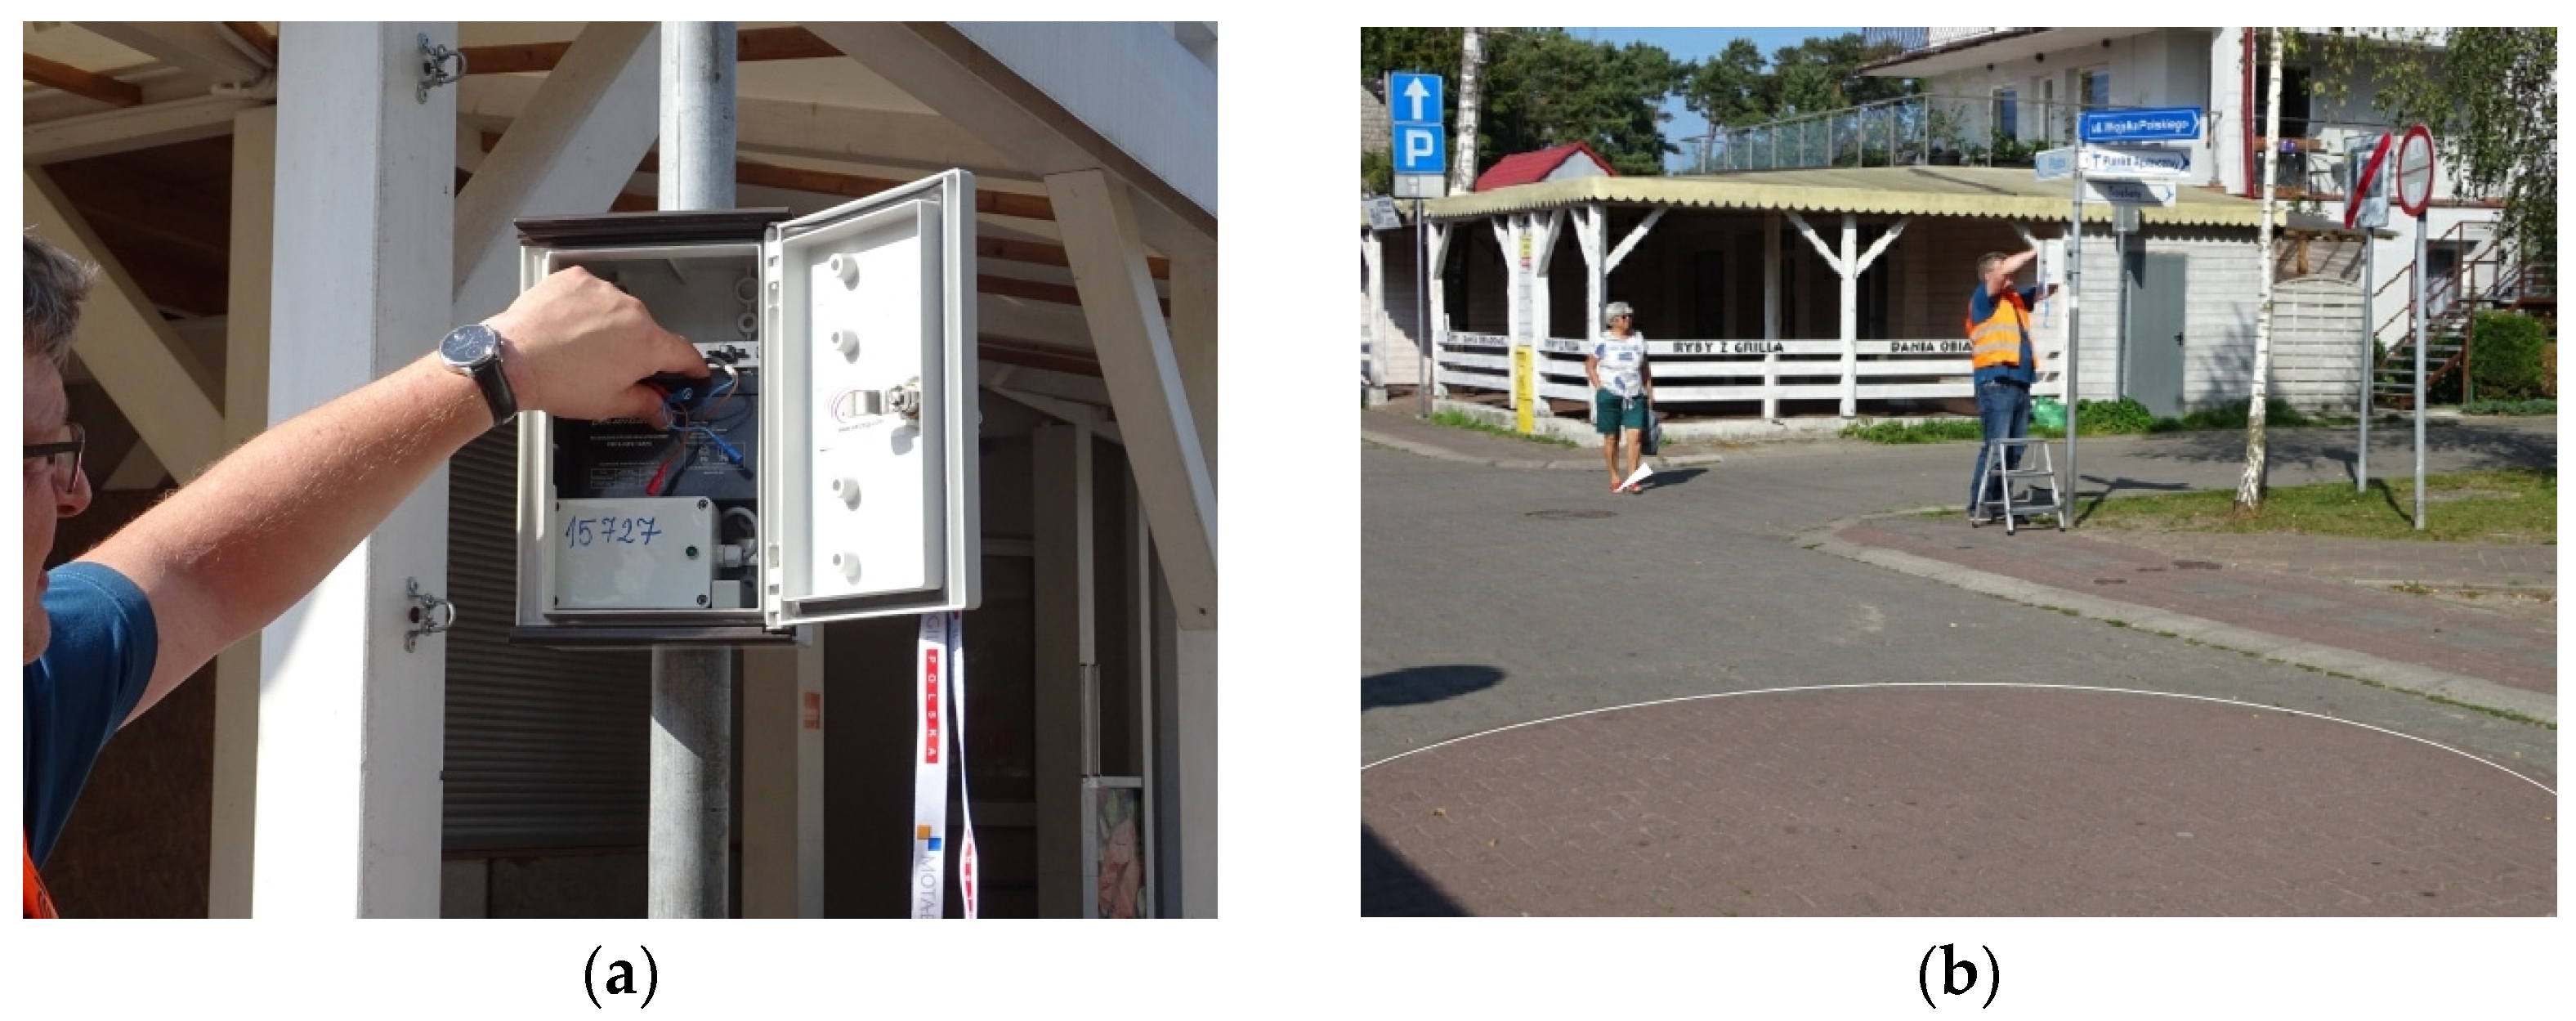
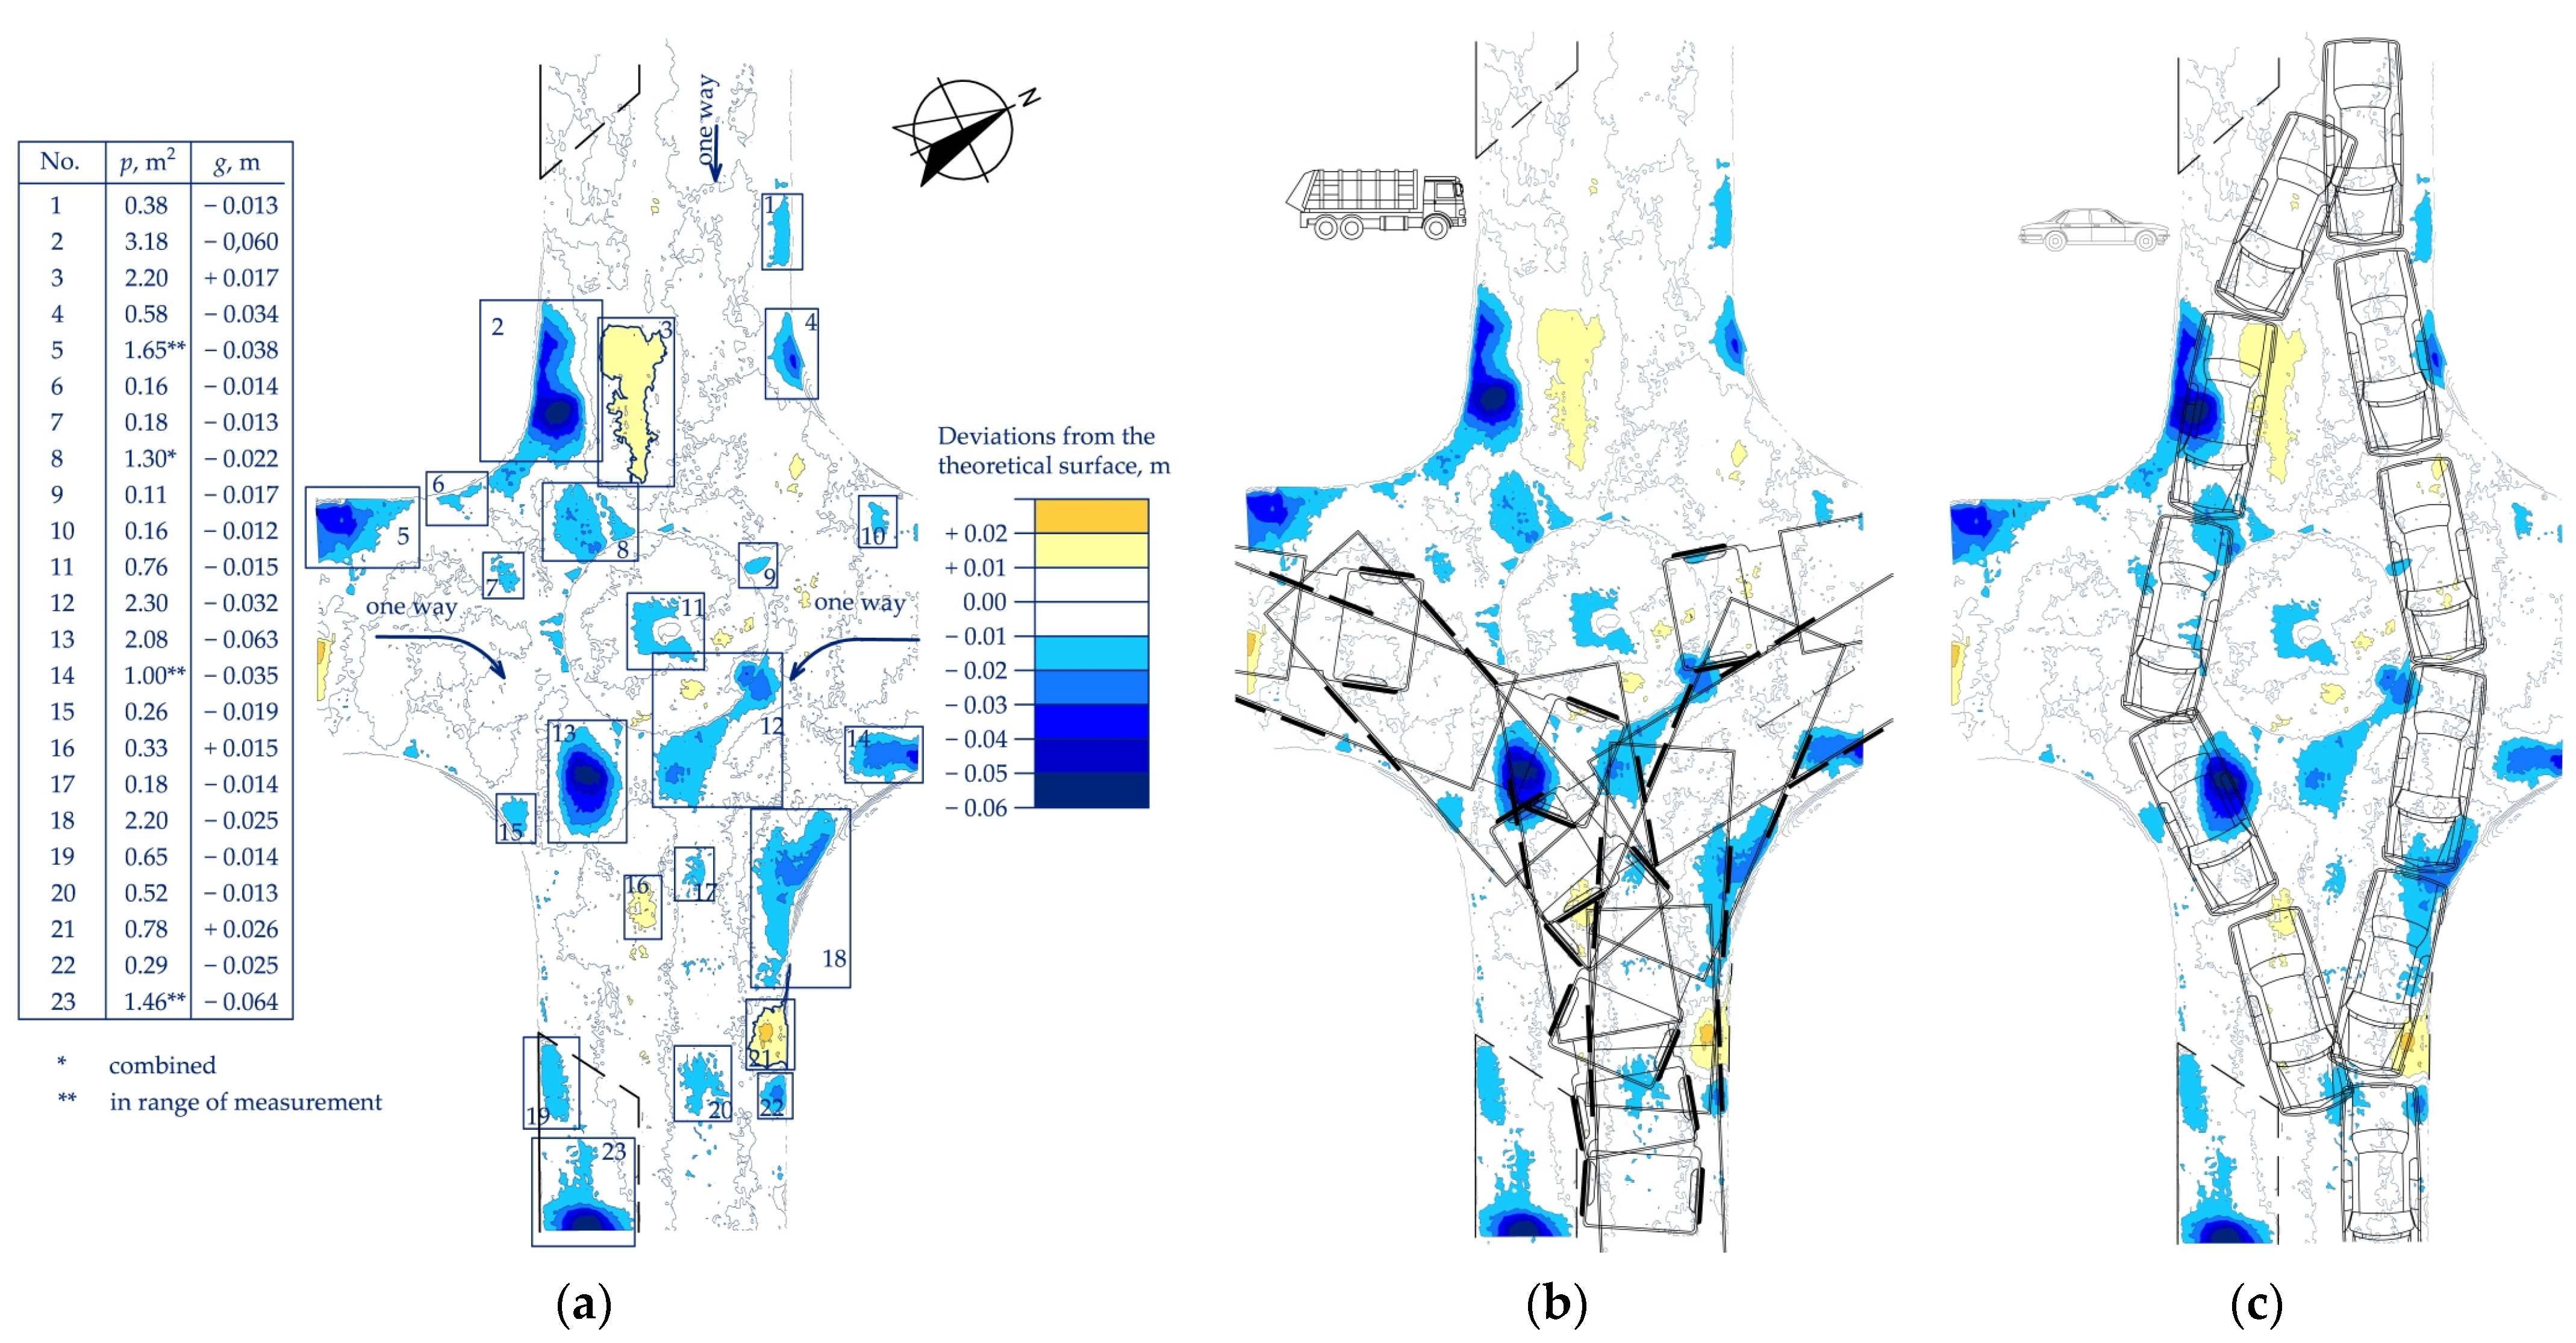
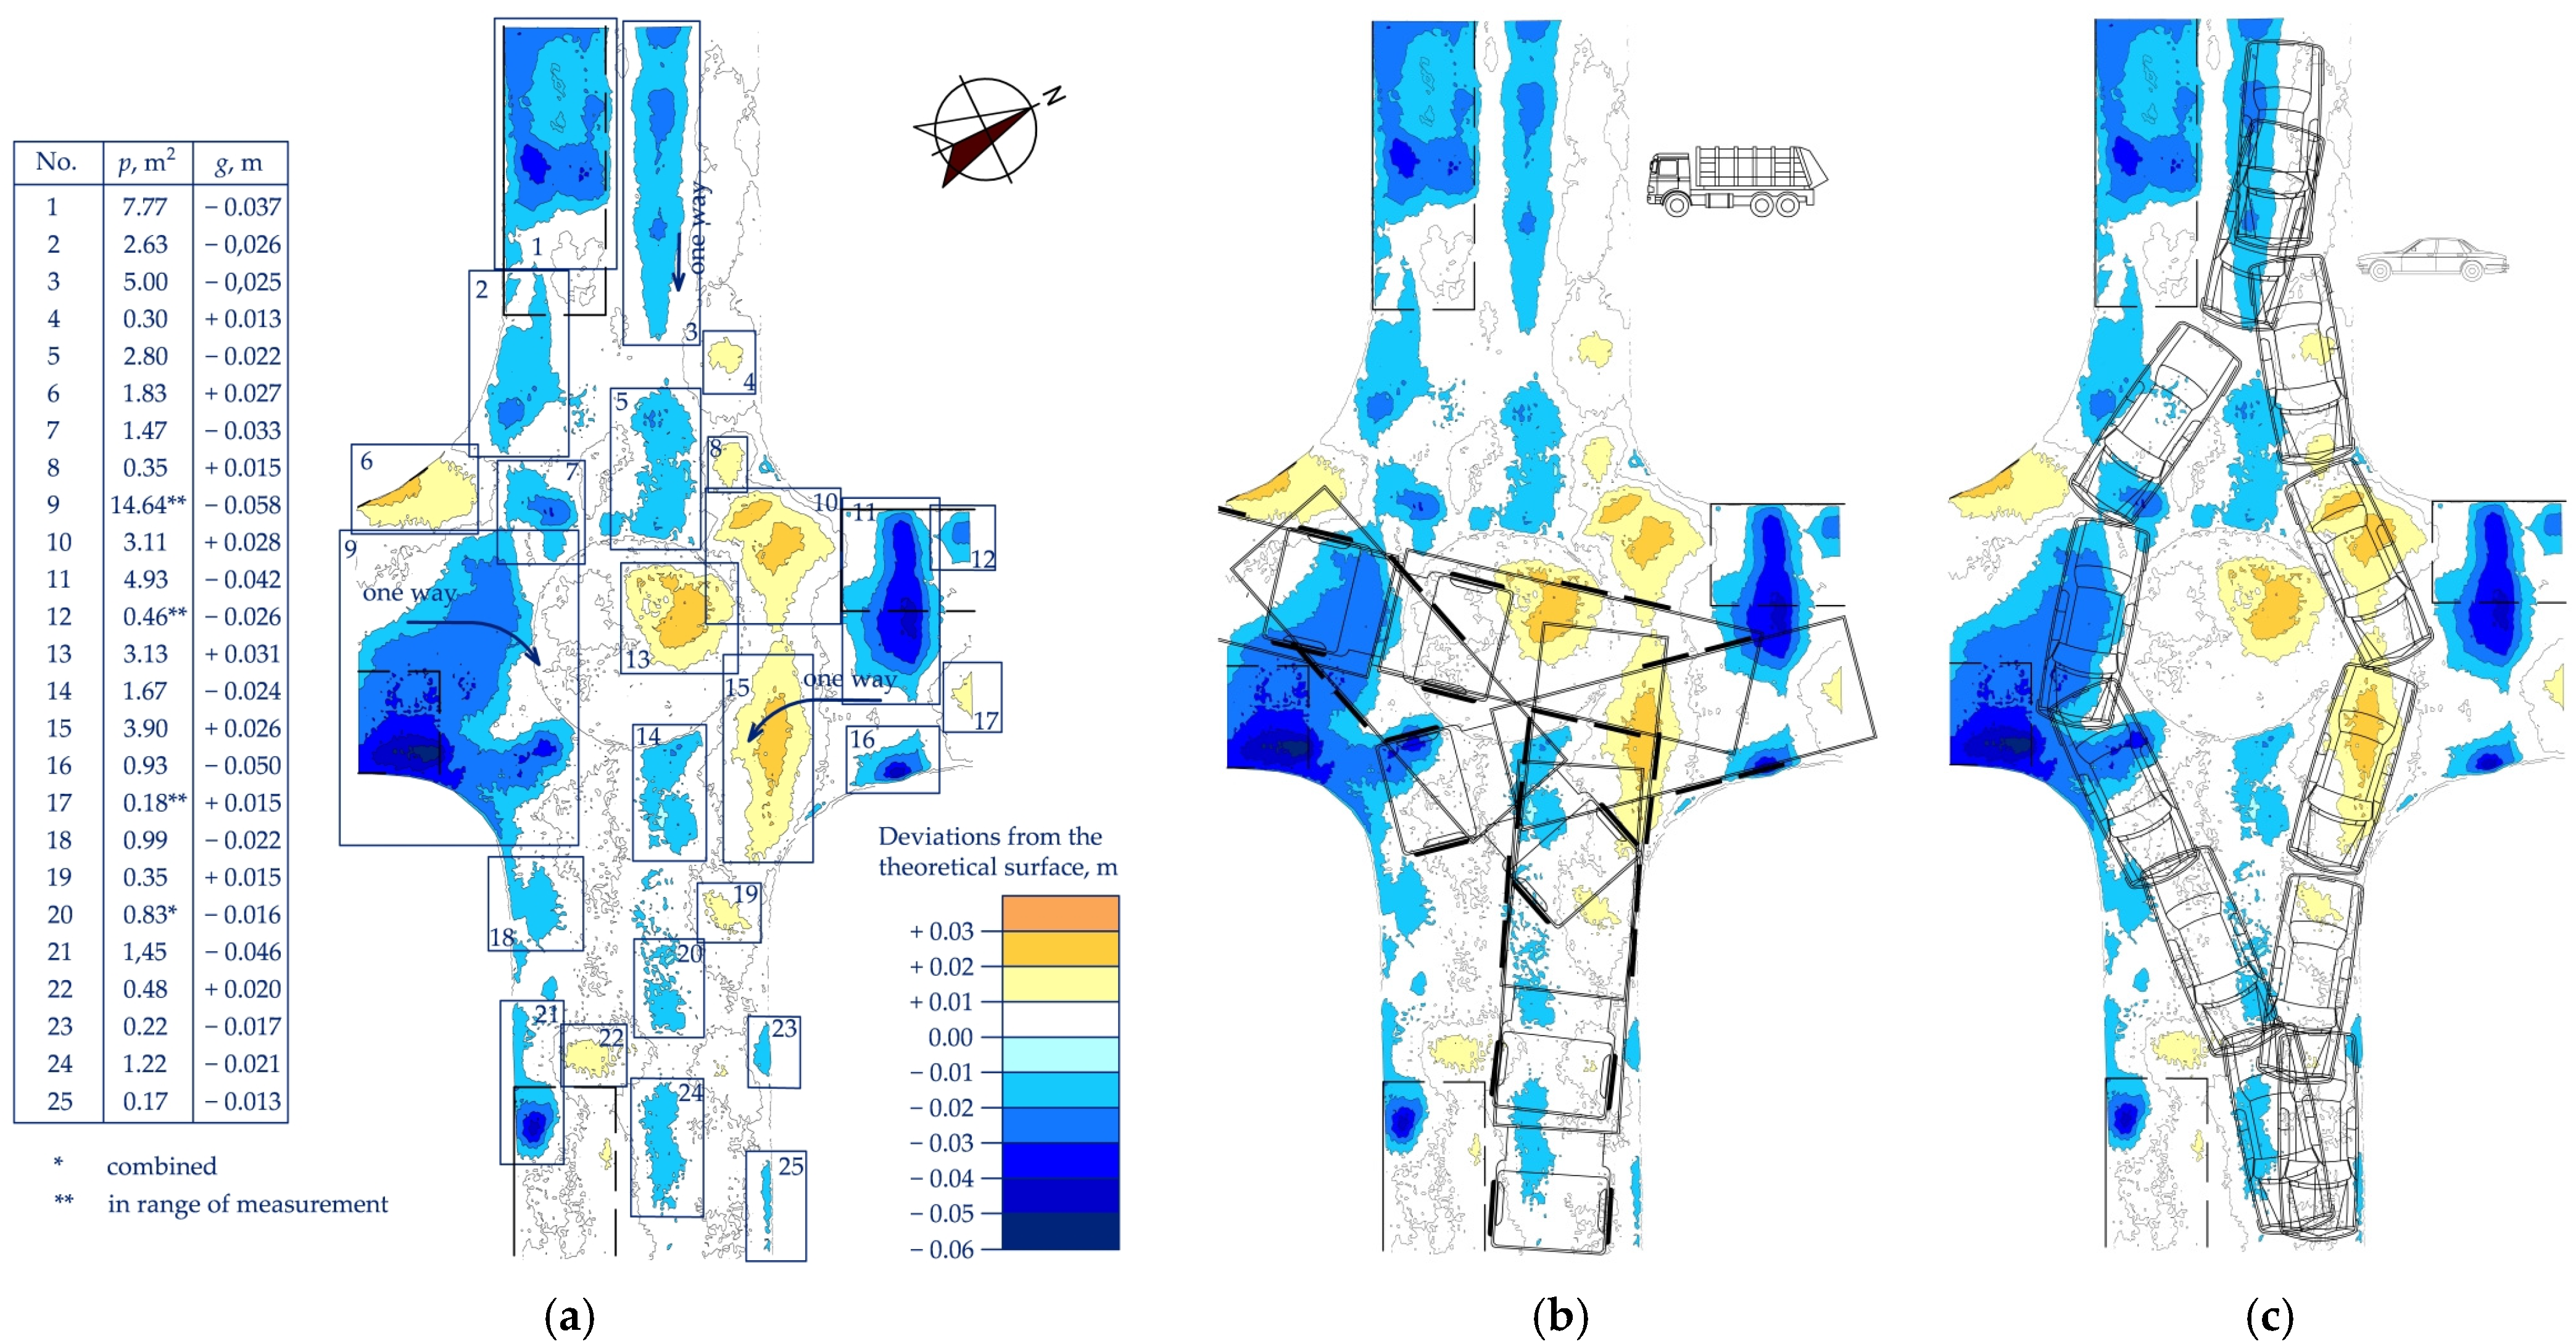
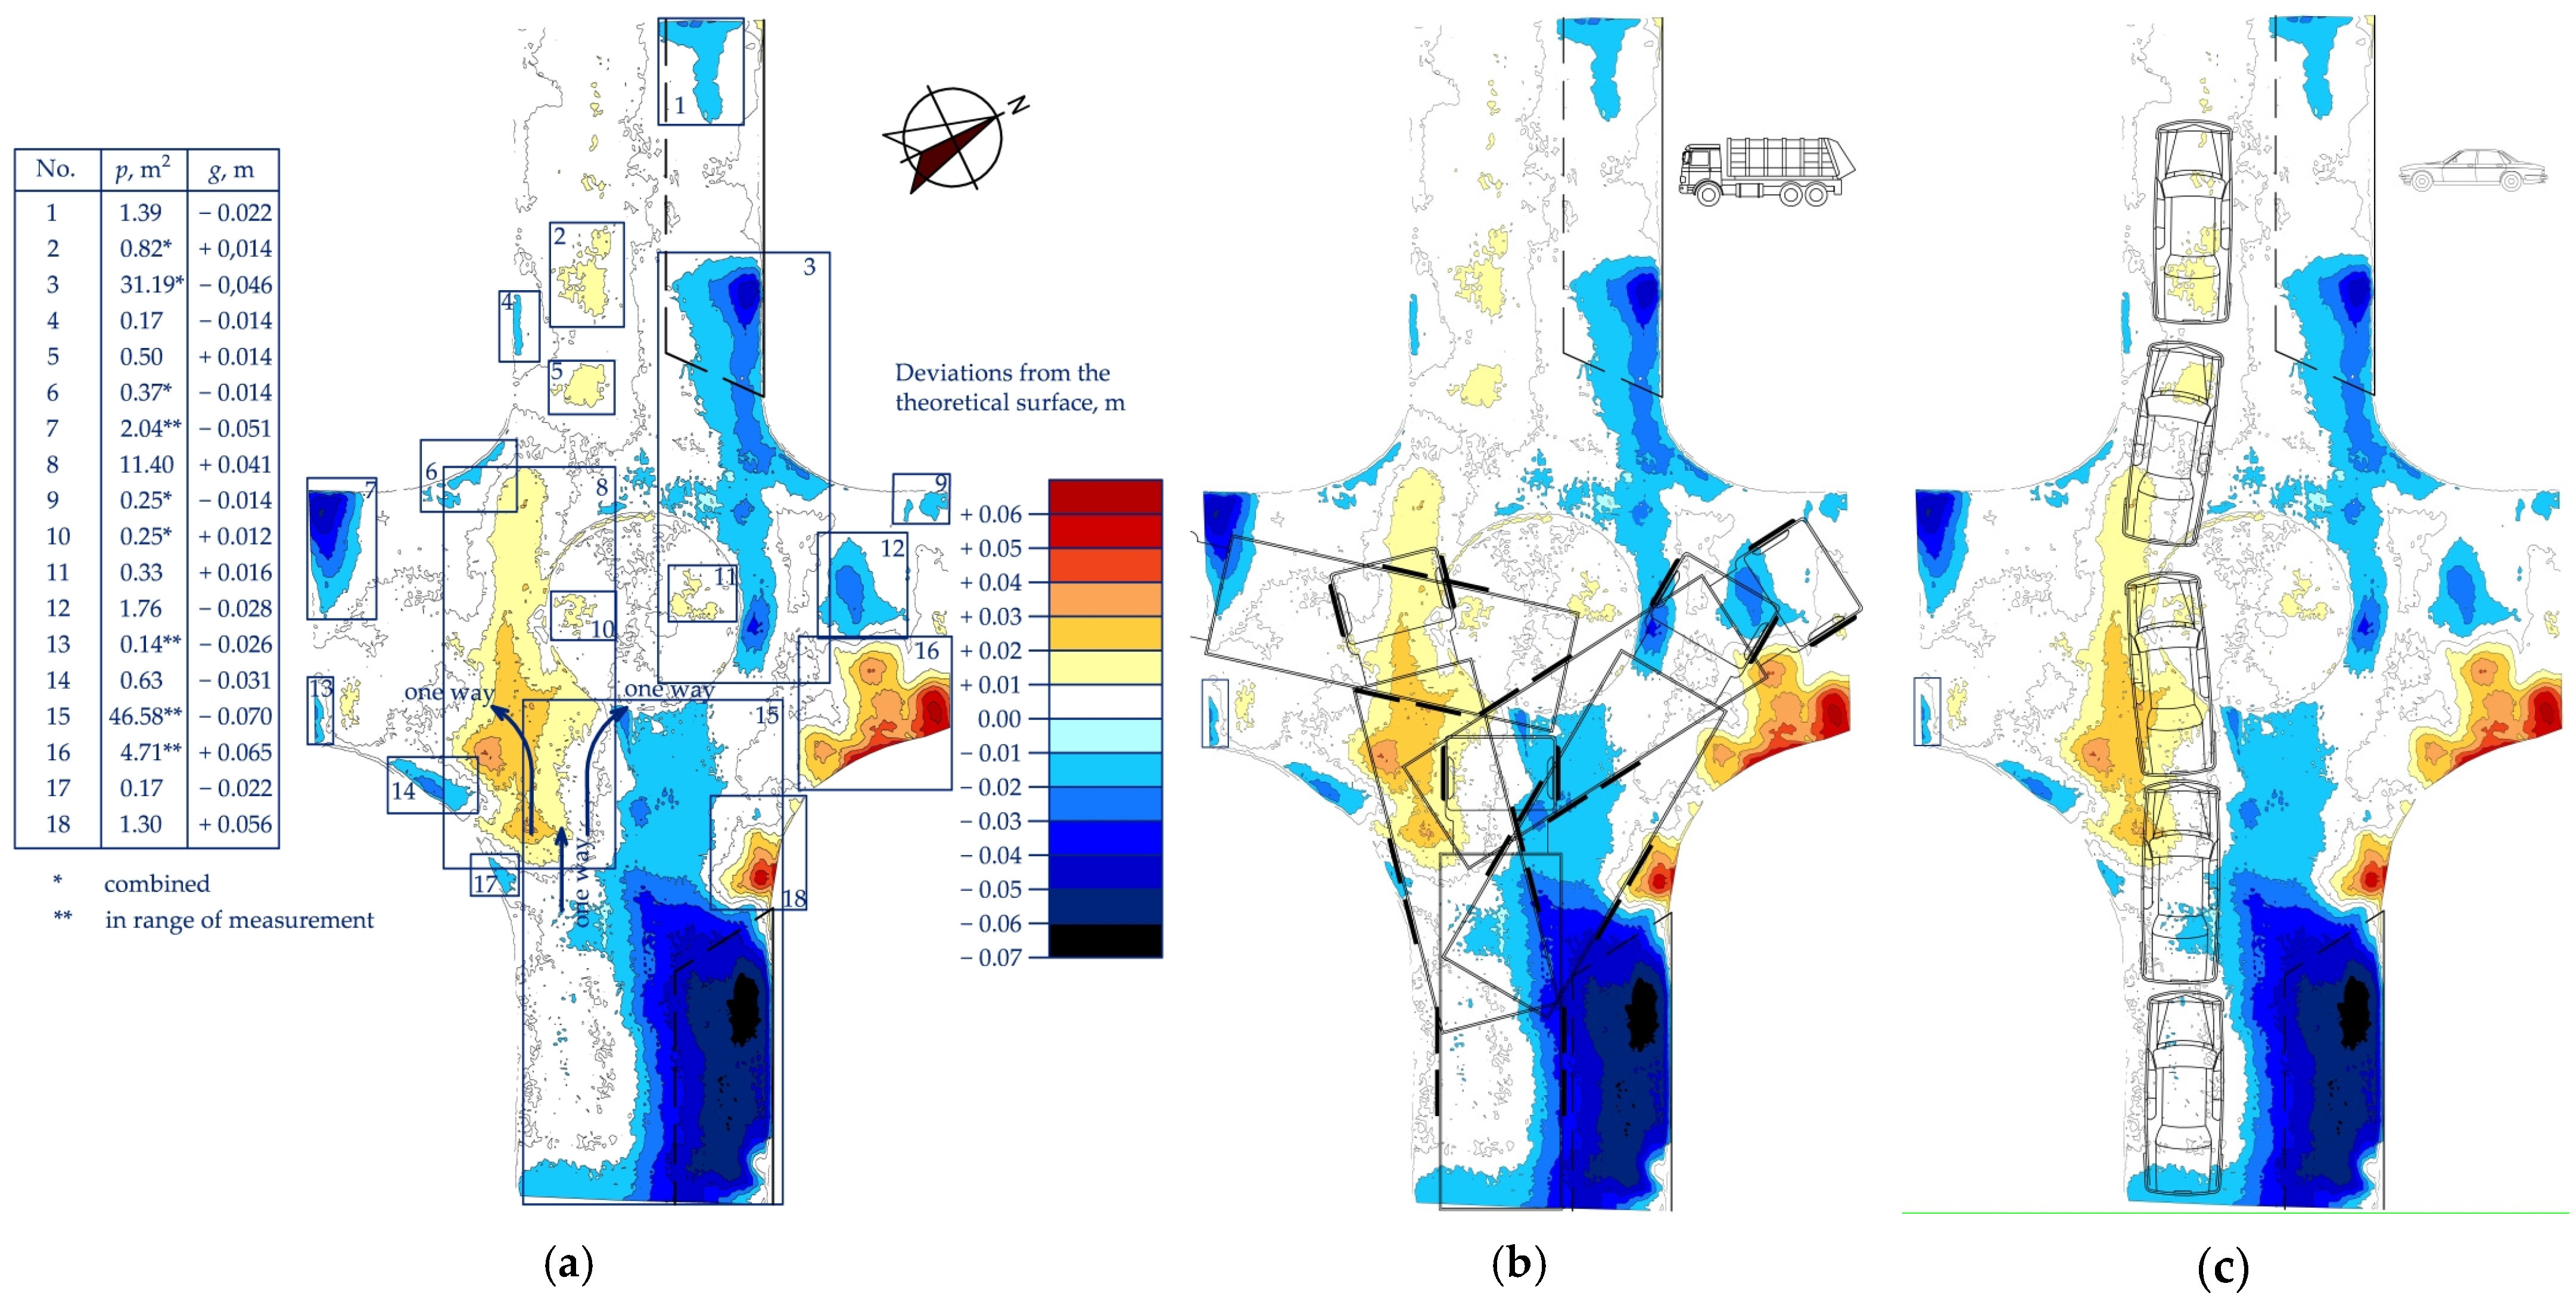
3.1. DM3D Models Representing the Deviations of the Real Surface from the Theoretical Surface and the Swept Paths of the Selected Design Vehicles

Figure 8 shows a DM3D model representing the deviations of the actual surface from the theoretical surface for TC–1. Figure 8a shows the subsidence spot locations and the related basic parameters. Subsidence spots located in parking lanes were left out from the subsequent analyses (Figure 8a—e.g., subsidence spots No. 19 and 23). Figure 8b, in turn, shows swept paths of municipal vehicles and passenger cars, respectively. The pavement deformations distribution patterns show, in most cases, coincidence of these deformations with the vehicle wheel paths. This allows us to conclude that the former are most probably related to higher horizontal forces acting on the pavement at the respective locations. Passenger cars heading straight ahead drive to the right or to the left of the central island, depending on the distance to the nearest vehicles standing in the respective parking lanes.
Figure 9 shows similar subsidence/wheel path coincidence analyses carried out for TC–2. In the case of TC–2, the parking lanes were located on the junction legs, very close to the junction. Only on the southern exit leg did the parking lane start 10 m past the side approach leg limit. Therefore, in TC–2, the design vehicle’s swept paths were adapted to the traffic lane area. Similar to TC–1, also in TC–2, the driving style characteristics depended on the presence of vehicles in the parking lanes.
During the surveys, the drivers tended to drive to the right of the central island (Figure 10a). Note, however, that subsidence was not always related to the vehicles driving through the junction, their acceleration or braking. The subsidence spots No. 1, 9, 11, 12 and 21 shown in Figure 9 are located on parking lanes with a concrete grid pavement. These areas were filtered out as being irrelevant for this study. Figure 10b shows a picture of the pavement near subsidence spot No. 9 after rainfall. The elevation data show that this subsidence may be attributed to the decreased strength or drainage capacity of the permeable pavement in question after over twenty years of operation.
Figure 11 presents the same analyses performed for TC–3. In the case of TC–3, the parking lanes on the side leg are spaced away from the junction.
This is different from the main street approach and exit legs where vehicles park very close to the junction (Figure 12), narrowing the available drive-through width to the traffic lane only. This also makes the drivers to choose driving to the left of the central island. Subsidence spot No. 1 is located entirely on the parking lane with a concrete grid slab pavement, and subsidence spots No. 3 and No. 15 encroach on it (Figure 12). Note that the parking lane is located on the main promenade of Międzywodzie, and, thus, it is used round the year. This, in combination with the surface water penetration into the subbase, has led to the observed severe subsidence. Subsidence was the only distress noted in the TC–3 area.
Figure 13 presents the output of the analyses carried out for TC–4.
This junction has the side legs staggered in relation to the central island axis, and the parking lanes are spaced away from the junction limits. The main street parking lanes are also spaced away, so they are not shown in Figure 13. On TC–4, the whole carriageway width is available to the allowed junctions’ movements. During the surveys, we noted that all the drivers aiming straight ahead chose to drive to the left of the central island, and only right-turning vehicles exiting through the eastern exit chose driving to the right of the island. TC–4 featured the smallest central island ∆h value. Subsidence spots No. 1, No. 2 and No. 4 and deformation Nos. 8–13 were excluded from the subsequent analyses as they were located more than 4 m away from the central island edge. Deformations were the only pavement distress noted in the TC–4 area.
The above subsidence location and design vehicle’s swept path analyses show a high consistency among the factors in consideration, thus supporting Research Hypotheses 1 and 2 concerning the coincidence between the subsidence spot locations, wheel paths and the expected increased traffic impact zones. The subsidence spots were larger and deeper when located close to central island, i.e., about 4 m from its edge and were significantly greater on central islands featuring a greater difference in the level central island ∆h.

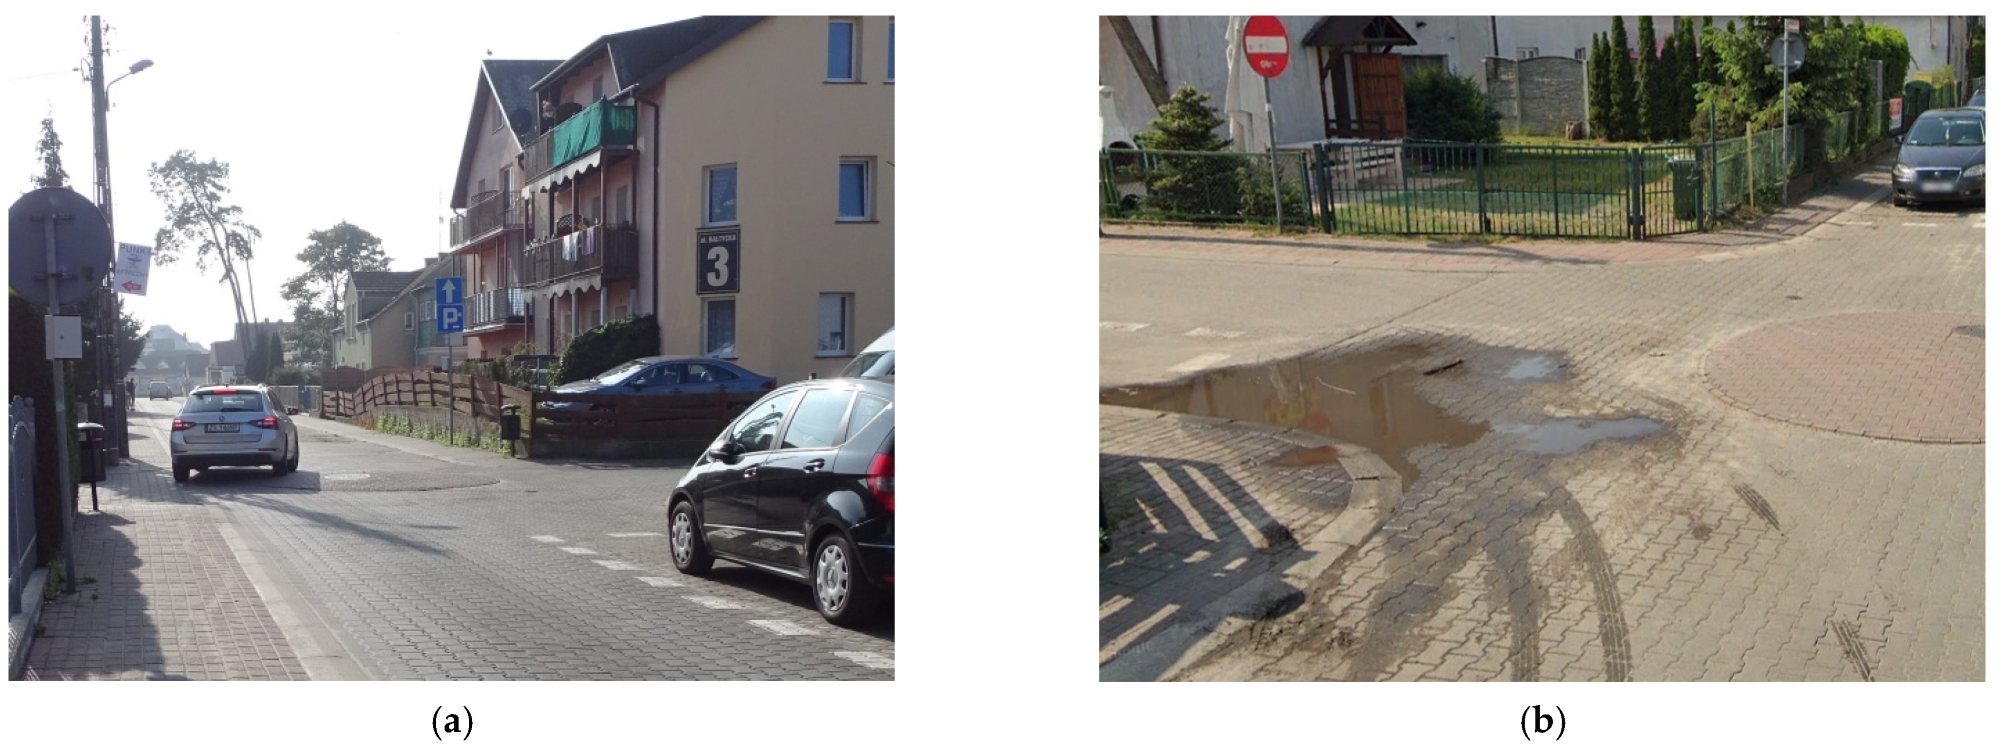
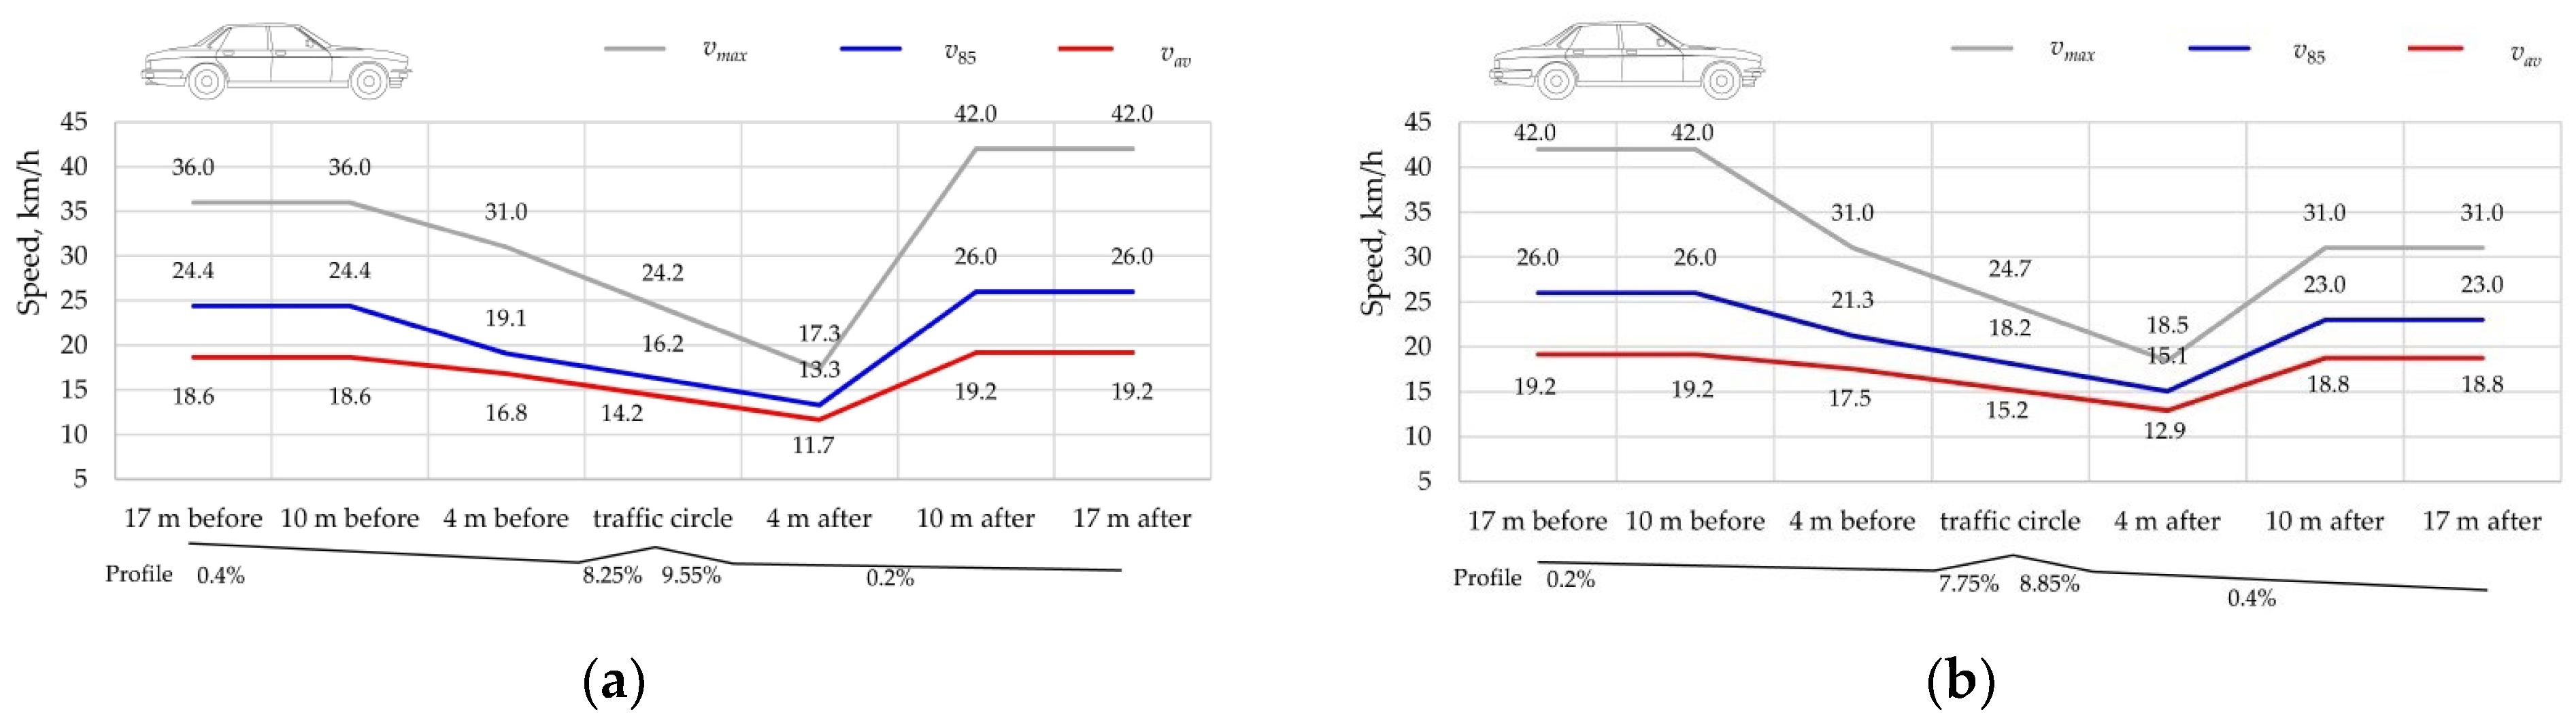
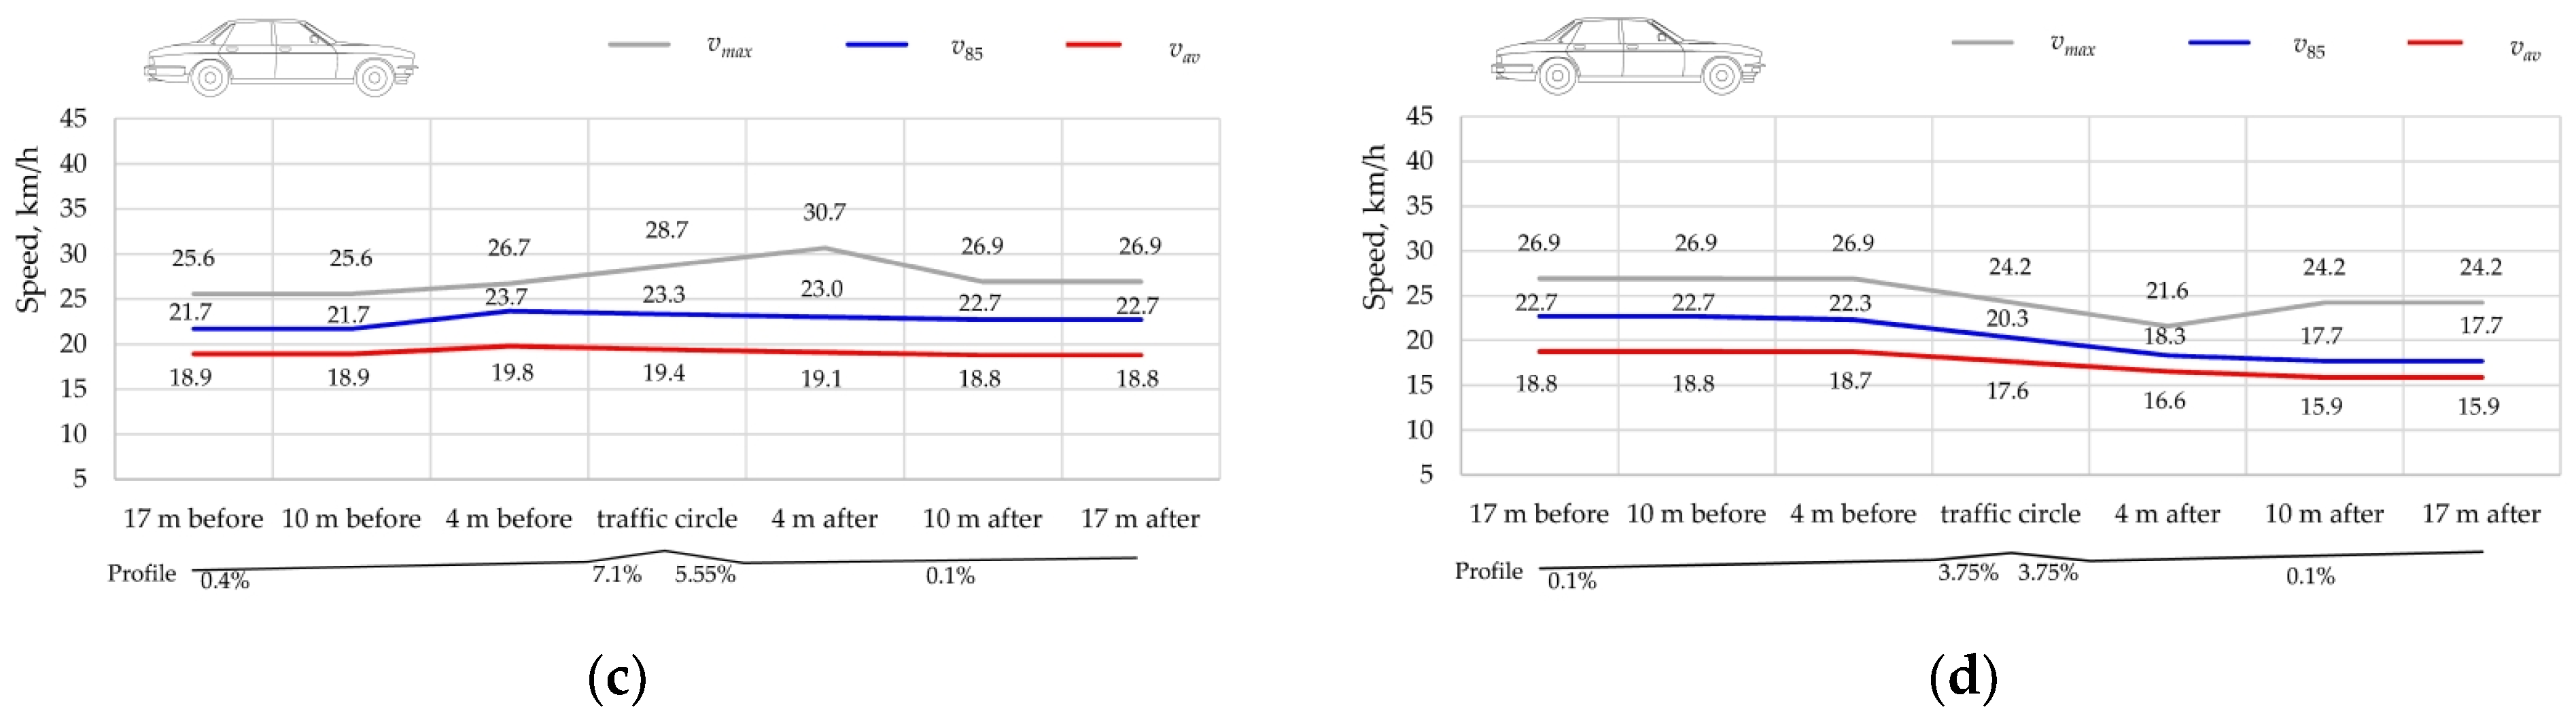
3.2. Passenger Car Observations during the Surveys

The characteristic phases of vehicle movement through traffic circle were observed for shorter and longer passenger cars. The driving characteristics depended not only on the vehicle ground clearance and the driving path through the central island but also on the vehicle type and the driver’s temper. Lower speeds guaranteed smooth passage through the central island, while higher speeds could result in hitting the pavement by the vehicle chassis. Thus, these observations confirm the findings of earlier studies [39] that raised areas (Figure 14) make drivers slow down in the approach section (Figure 14) and accelerate as soon as the front wheels have left the ramp, which causes the rear wheels to subsequently hit the pavement. This repeated action may have caused the pavement deformation in these places.
The driving speed through the central island also depended on the traffic circle location, pedestrian traffic volume, parking lane occupancy situation and, last but not least, the difference in levels between the raised central island and the surrounding pavement surface designated central island ∆h. A few drivers were observed to drive much higher above the home zone speed limit. This speeding was related to the driving style and temper of the drivers concerned [22]. Other relevant factors included an empty parking lane ahead and the 10 km/h allowance stipulated in the Polish highway code [6] to allow for instrument inaccuracy and human error on the part of drivers.
Differences in driving through traffic circles were noted during the surveys. The manner of navigating the traffic circle probably depended on the occupancy of the parking lanes located before and past the traffic circle. Therefore, the driving trajectory through traffic circle was also observed, bearing in mind the already identified subsidence spot locations. Passenger cars driving to the left of the central island tended to accelerate rapidly right after passing the central island (Figure 15 and Figure 16). In turn, the drivers who chose to drive to the right of the central island accelerated past the traffic circle or while still on the central island, or they hit the brakes after the central island depending on the parking lane occupancy situation (Figure 15 and Figure 16). Figure 15 and Figure 16 show the accelerations (marked in green) and decelerations (marked in orange) that exceeded at least twice the speeds of straight-ahead driving (see Section 2 above). The established subsidence spots were arbitrarily marked in blue (see Section 3).
Driving style variations were not observed on the TC–3 and TC–4 located on the main promenade of Międzywodzie. These two traffic circles featured lower central island ∆h values (Figure 17 and Figure 18). The speeds in this case were lower and more stable due to pedestrians walking all over the street; dropping into street food outlets, boutiques and shops; or going in and out of the year-round-open spa facilities and heath resorts. Due to small central island ∆h values, neither rapid acceleration nor braking was observed on TC–3 and TC–4. Slightly higher decelerations were noted only on TC–3, most probably due to the carriageway width narrowed by the vehicles parked in the parking lane past the traffic circle at the year-round-open spa facilities located there (Figure 17).
These observations also support research hypotheses 1 and 2 concerning higher impacts of the vehicle wheels acting on the pavement surface, especially on traffic circles having higher central island ∆h values. The deceleration and acceleration variation ranges were also related to the presence of parking lanes and their occupancy rates. This could well justify an interdisciplinary approach to the traffic circle design in home zone areas, paying attention to the following:
-
Parking lane locations on the respective junction legs,
-
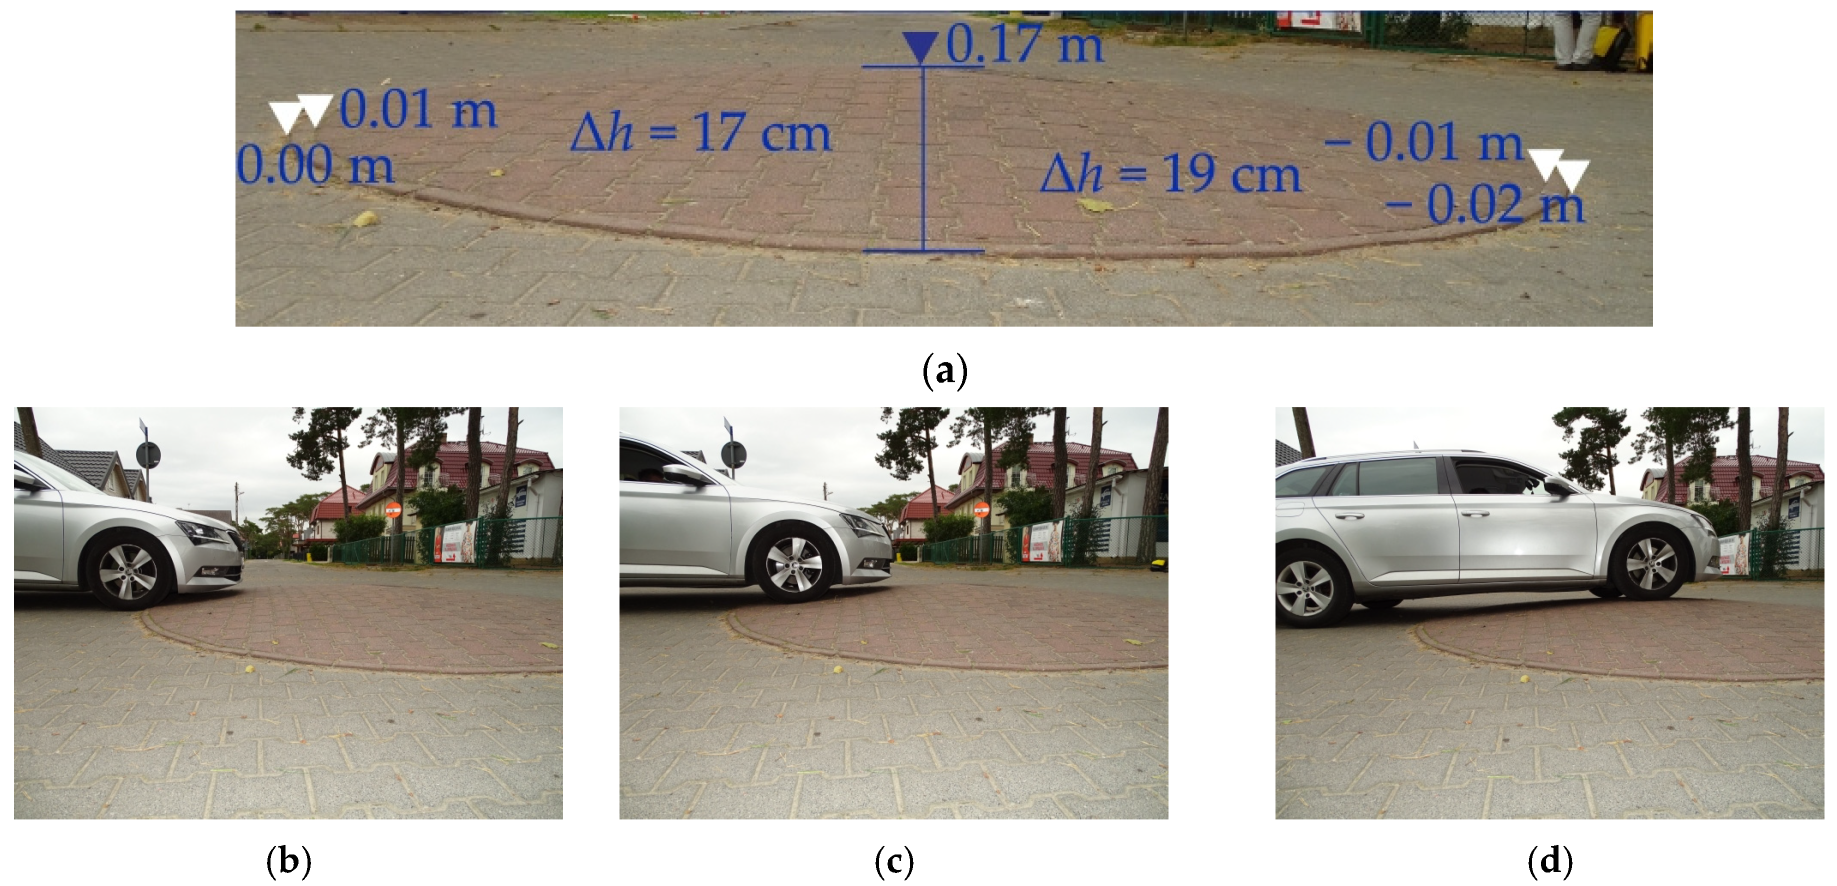
Junction streetscape and appropriate central island ∆h value,
-
Turning movements planned for the junction in question, including design vehicle’s swept path analysis,
-
Pavement structure design appropriate to the outcome of the above analyses.

3.3. Traffic Survey Results

As initially planned, the vehicle speeds were measured using synchronised traffic detectors. These detectors were sited along the way of travel down the street. The detectors were located 17 m, 10 m and 4 m from the central island axis in both ways, i.e., in the approach and departure sections. Having in hand these speed data, it was now possible to calculate the decelerations and accelerations for each observed vehicle. Statistical analyses were carried out for all the speed and deceleration/acceleration data populations, as required in the second and third elements of the applied heuristic method (see Figure 14, Figure 15, Figure 16, Figure 17 and Figure 18). The finally obtained speed distribution parameters are represented on the linear graphs shown in Figure 19.
The deceleration/acceleration cumulative distribution functions were drawn and are shown in Figure 20. The accelerations and decelerations that can be observed from Figure 20 are for TC–1 and TC–2, i.e., the traffic circles featuring higher central island ∆h values were, in some cases, greater than normally assumed in the pavement design process. While these were singular cases, speeds higher than the 20 km/h limit could cause considerably higher dynamic impacts on the pavement over the twenty years of operation. In Figure 20, the deceleration and acceleration variations are marked in blue to highlight the variation in the horizontal forces acting on the pavement. On the other hand, the deceleration and acceleration ranges observed on TC–3 and TC–4, located on the main promenade of Międzywodzie, were smaller than the values normally adopted for pavement design purposes. A visual comparison of deceleration and acceleration areas between TC–2 and TC–3 may give a false impression of their similarity, and, actually, the maximum values are much greater in TC–2, which could explain the much greater number of subsidence and other pavement distress spots identified there. The obtained deceleration and acceleration distribution parameters are compiled in Table 1 below.
Figure 21 shows accelerations and decelerations calculated for three zones in the traffic flow direction on the way through the analysed traffic circles and the basic pavement subsidence parameters. For the purposes of pavement subsidence analysis, the subsidence spot areas were summed up where subsidence was attributed to the insufficient strength of the pavement structure for highly variable horizontal forces acting on very short sections before, on and after the central island. On TC–3 and TC–4, the observed subsidence of the permeable concrete grid paving could have some bearing on these subsidence spots due to excessive moisture content in the subgrade. As a result, the subsidence areas in TC–3 and TC–4 coincide with the observed smaller deceleration/acceleration variations to a similar extent as the subsidence areas in TC–1 and TC–2. In turn, the maximum subsidence depths were found to be in correspondence with the deceleration/acceleration variations on the analysed traffic circles in the order corresponding to increasing central island ∆h. These observations could be deemed to finally confirm research hypotheses 1 and 2.
Figure 22, in turn, shows the study data. The highest deceleration and acceleration differences were observed before and after the central island, respectively, which were clearly related to the traffic conditions other than in the straight-line section of the street used for comparison. The maximum decelerations and accelerations were −5.5 m/s2 and 5.0 m/s2, respectively. The deceleration/acceleration data given in Figure 22 were compared with the corresponding data obtained in free-flow traffic conditions on a 150 m long section between TC–1 and TC–2 (Figure 2). As the maximum decelerations/accelerations on this straight-line section did not exceed 0.75 m/s2, two-times higher values were taken as the limits of the cross-hatched area marked in Figure 22. The obtained deceleration/acceleration values indicate much higher horizontal forces induced in the high traffic impact areas, as compared to free flow traffic The impact of these forces on the pavement condition could be considerable. This approach to higher traffic impact determination, including horizontal forces in particular, was proposed in some earlier studies on the subject [37,38,40,41,42]. The traffic surveys carried out as part of this study were limited to passenger car speeds, which are not considered in the structural design of road pavements. That said, this approach is still deemed appropriate for the purposes of our study due to the high dynamic impacts of the vertical and horizontal forces induced by them. The vertical forces generated in similar situations at speed tables were measured by Loprencipe et al. [15], who used accelerometers fitted on the test vehicles. Tests of this kind were not carried out as part of this study, and the vertical force values were adopted on a like-for-like basis. The horizontal forces, in turn, were calculated for each passenger car observed during the survey. A comparison of the obtained deceleration/acceleration values indicates that horizontal forces should not be left out in pavement design wherever their impact plays a major role, such as areas right at vertical deflections. An accumulation of these residual stresses over time may lead to premature pavement deterioration [37,38,40,41,42].
The acceleration/deceleration’s normal distribution stratifications in the traffic flow direction are represented in Figure 15, Figure 16, Figure 17 and Figure 18. The most severe pavement subsidence spots are also indicated there.

4. Discussion

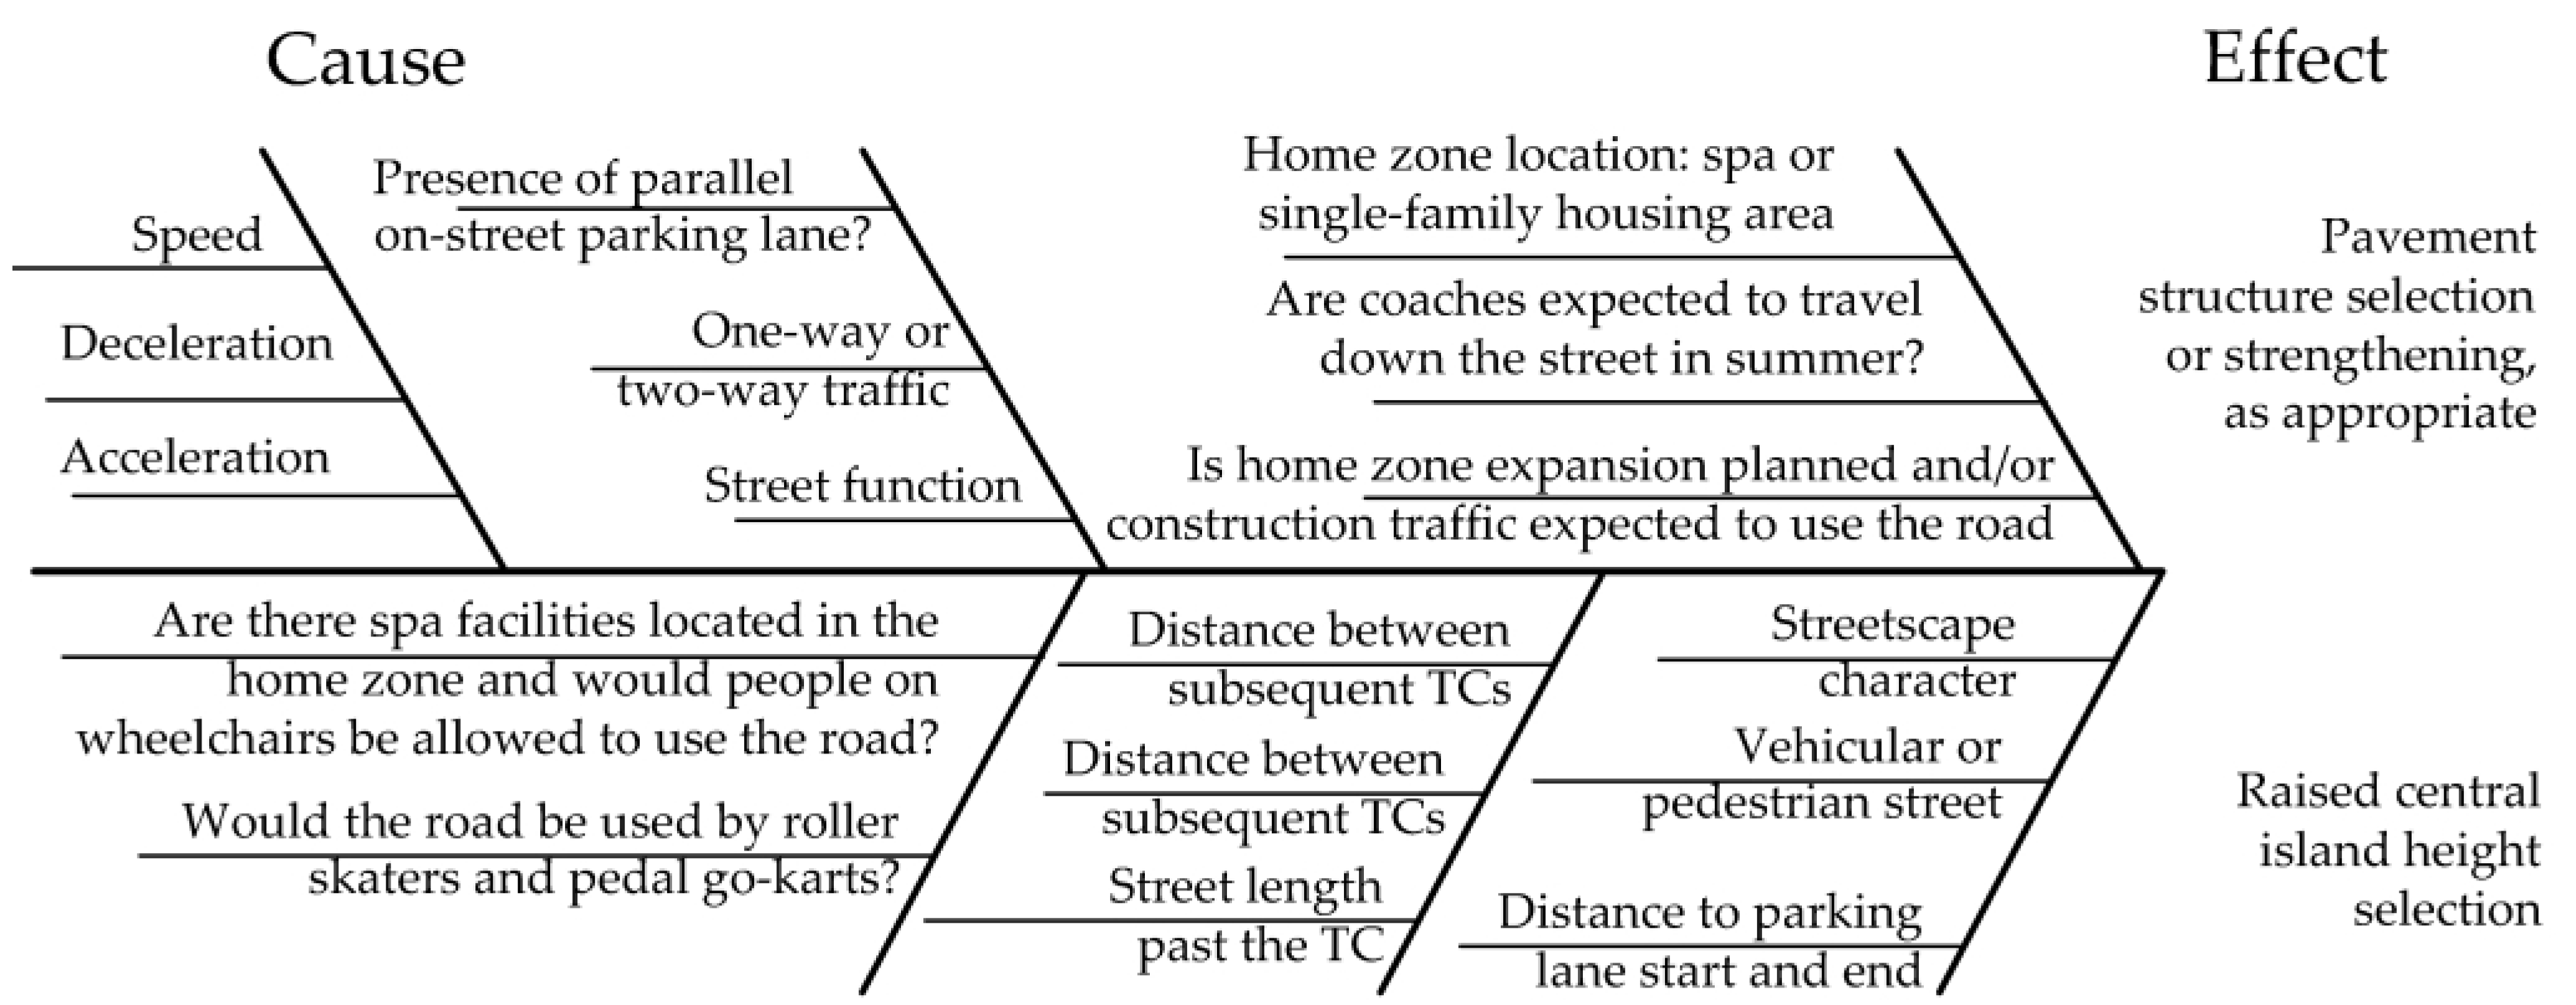
4.1. Cause and Effect Analysis Using the Cause and Effect Diagram and Pareto Chart

With the traffic survey and TLS data (Section 3) in hand, we can now try to determine the causes of the higher traffic impact on the pavement condition 20 years after the home zone implementation. The main causes of pavement deterioration which are inferred from Figure 15, Figure 16, Figure 17, Figure 18, Figure 21 and Figure 22 include the following (Figure 23): driving much higher above the home zone speed limit in a one-way street beyond the summer period, as previously reported by Majer and Sołowczuk [5], and a higher load impact of traffic in the immediate vicinity of a traffic circle due to deceleration and acceleration at different central island ∆h values. In choosing the central island ∆h values, home zone designers take into account the street function (vehicular or pedestrian street), surrounding streetscape, whether roller skating or pedal go-karting is allowed, the central island ∆h limit (as given in the code) and whether it is a one-way or two-way street. The other relevant factors include the presence of an on-street parallel parking lane, the distance between subsequent traffic circles with no side obstacles or vehicles parked in the parallel on-street parking lane and the home zone exit section length. Figure 23 shows some considerations relevant to the central island ∆h and pavement structure design.
A Pareto chart is the next heuristic method element (Figure 24). In this study, we used a Pareto chart to analyse various determinants relevant to the central island ∆h value chosen in the design depending on the home zone public space characteristics (Figure 24a). Analysing the determinants considered in choosing the central island ∆h value, we would like to draw attention to the following (Figure 24a—determinants from 1 to 9):
-
The combined effect of the street function (Figure 2), in this case a street designed for vehicular traffic (1), with due consideration of the streetscape characteristics around the traffic circle (2) and the length of the section between the analysed traffic circles with no side obstacles, such as cars present in the parallel on-street parking lane (3);
-
The combined effect of driving much higher above the home zone speed limit in a one-way street beyond the season (4), as reported by Majer and Sołowczuk [5], and a short terminal section of the street at the home zone exit (5);
-
High-profile characteristic of the street (Figure 2), where in this case, the main promenade is lined with numerous food outlets, boutiques and shops (6);
-
Side obstacles installed at the parking lane’s beginning and end (7) (concrete flowerbeds, vegetated splitter islands, etc.);
-
Allowed roller skating or riding pedal go-karts in home zones located in spa areas (8);
-
The recommended central island ∆h limit (9).
Secondly, the Pareto chart determines the impact of selected determinants on the defined bearing of the selected determinants of the traffic duty class adopted in the pavement design. This, in turn, has a bearing on the pavement deterioration over the twenty years of operation, as confirmed in this study (see Section 3). Figure 24b shows a Pareto chart defining the bearing of the respective determinants on traffic duty class adopted for the analysed spa home zone. The determinant marked in pink is related to deceleration. In the analysed case there are other determinants relevant to the traffic duty class central island height greater than standard, designated ∆hbigger or the standard central island height designated ∆hstandard. In the former case of ∆hbigger, the relevant determinants include the following (Figure 24b—determinants from A to G):
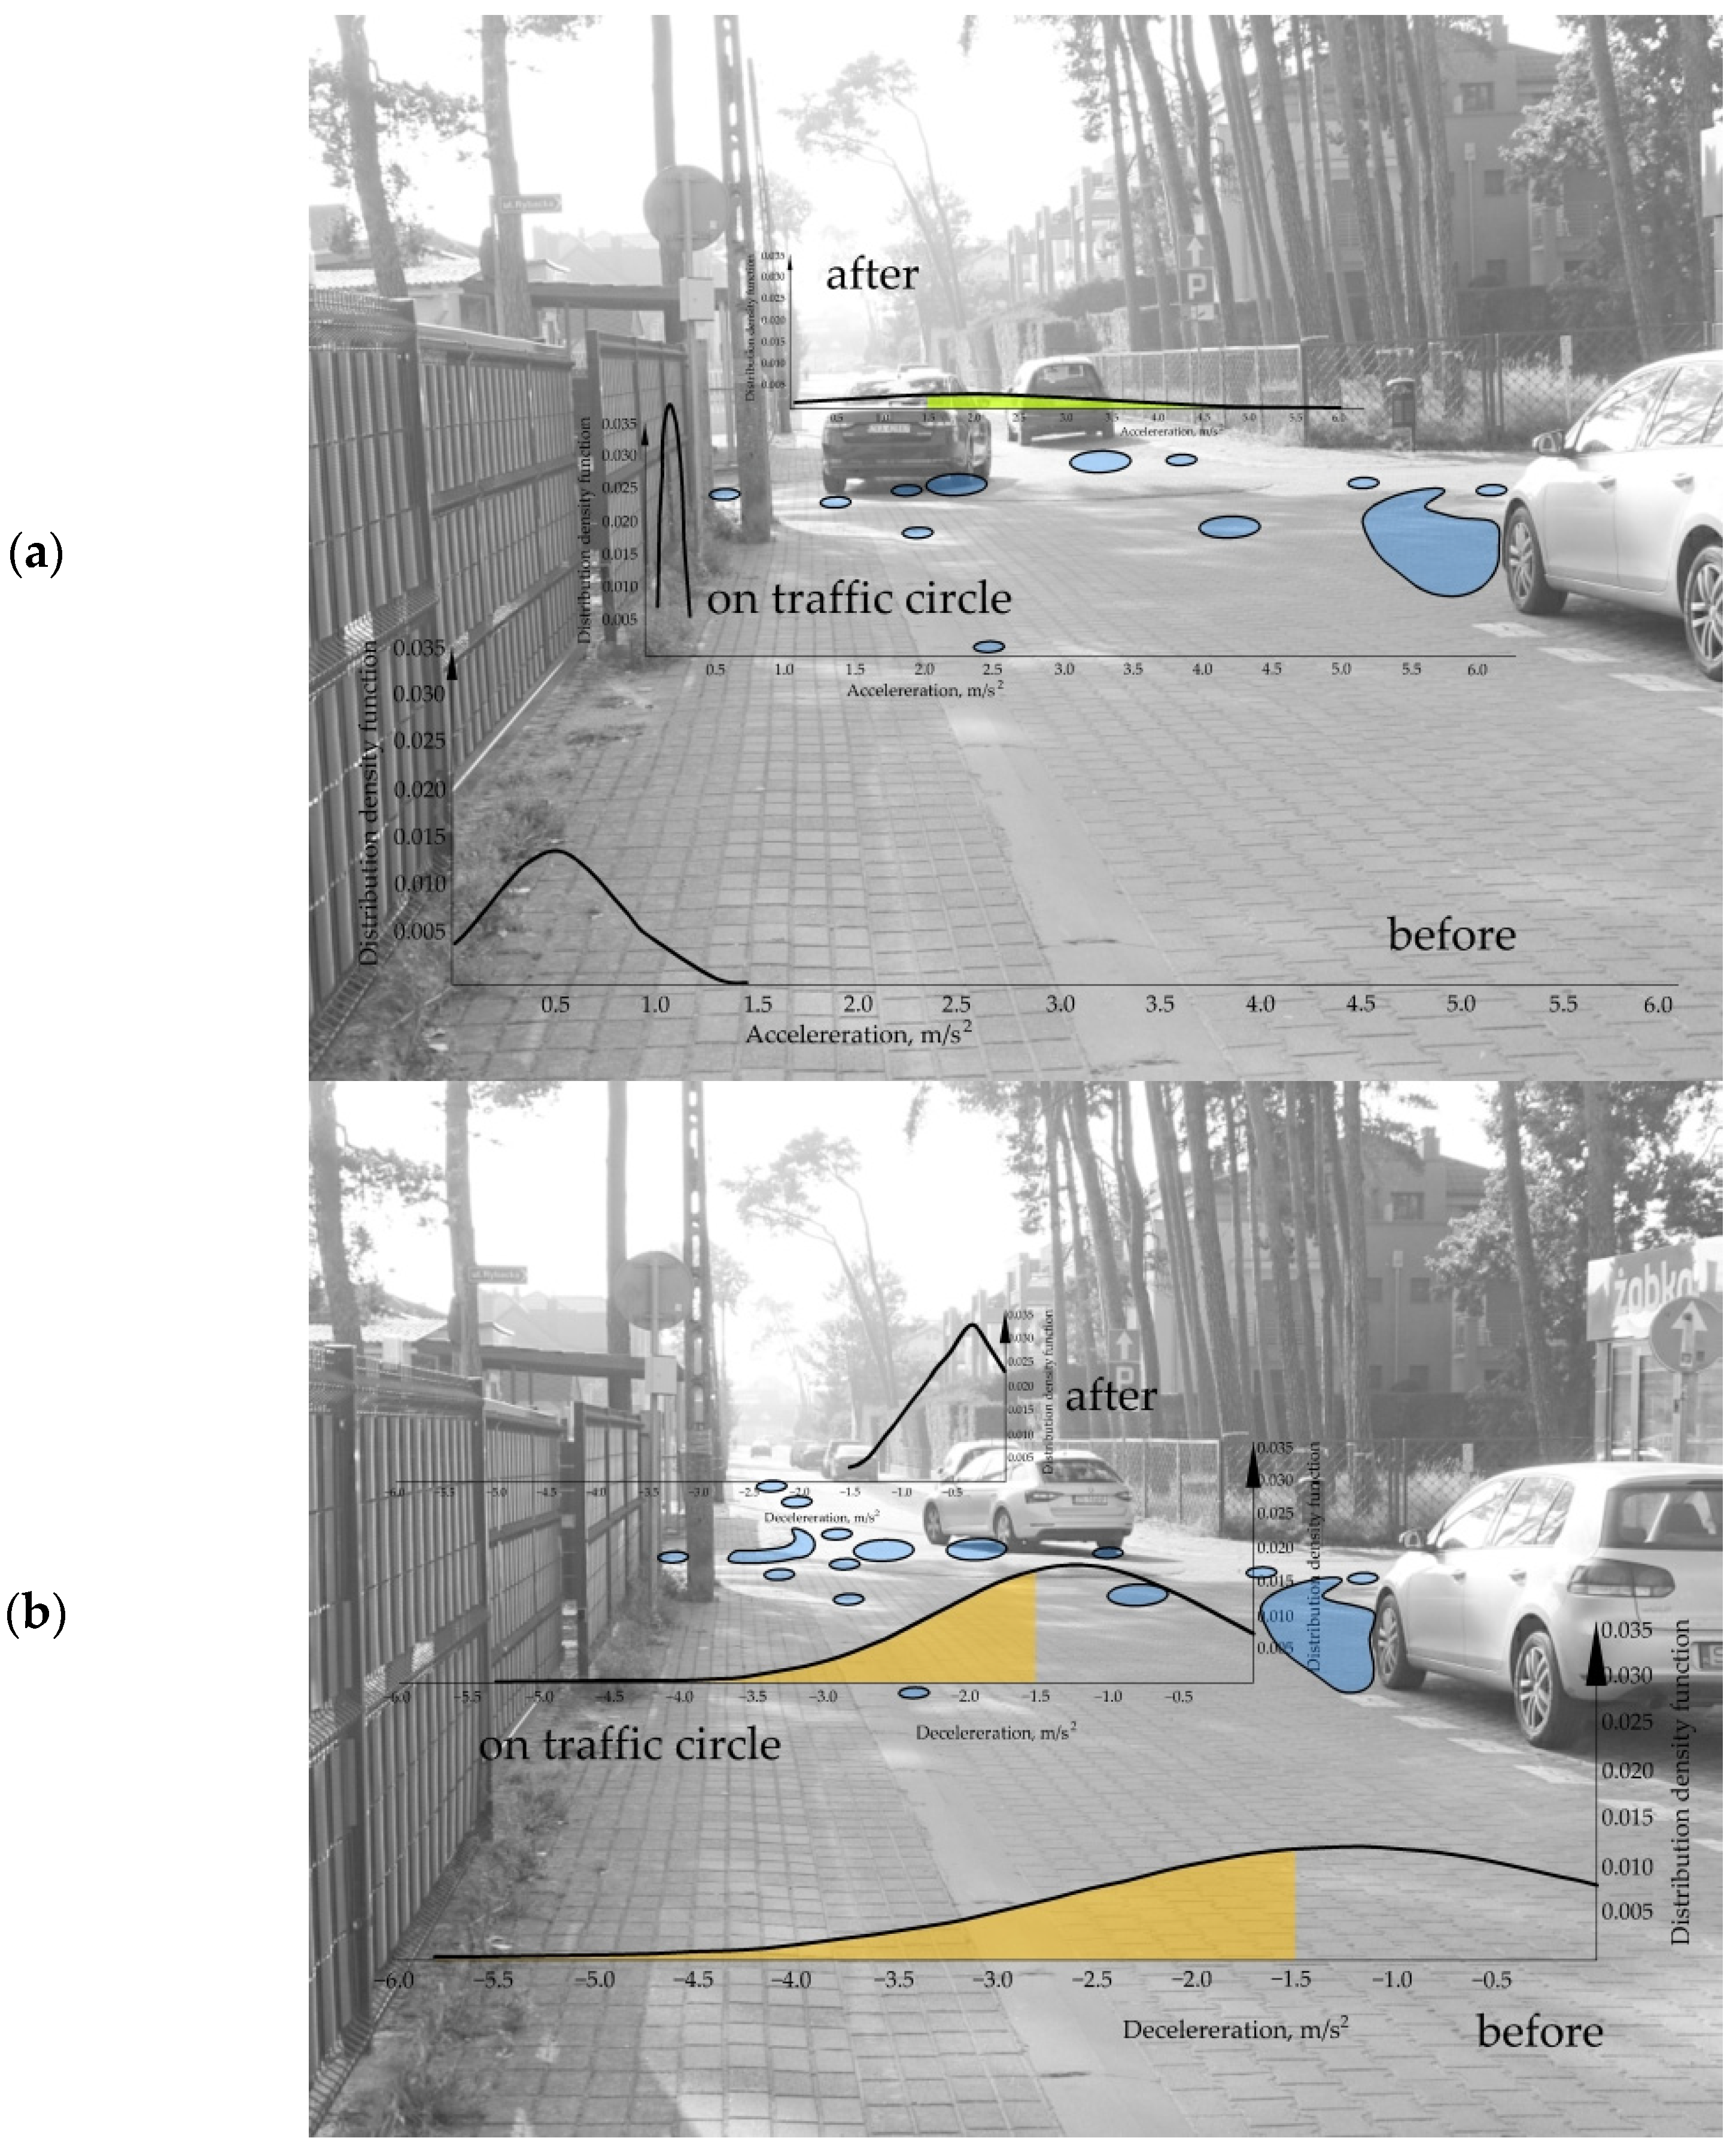
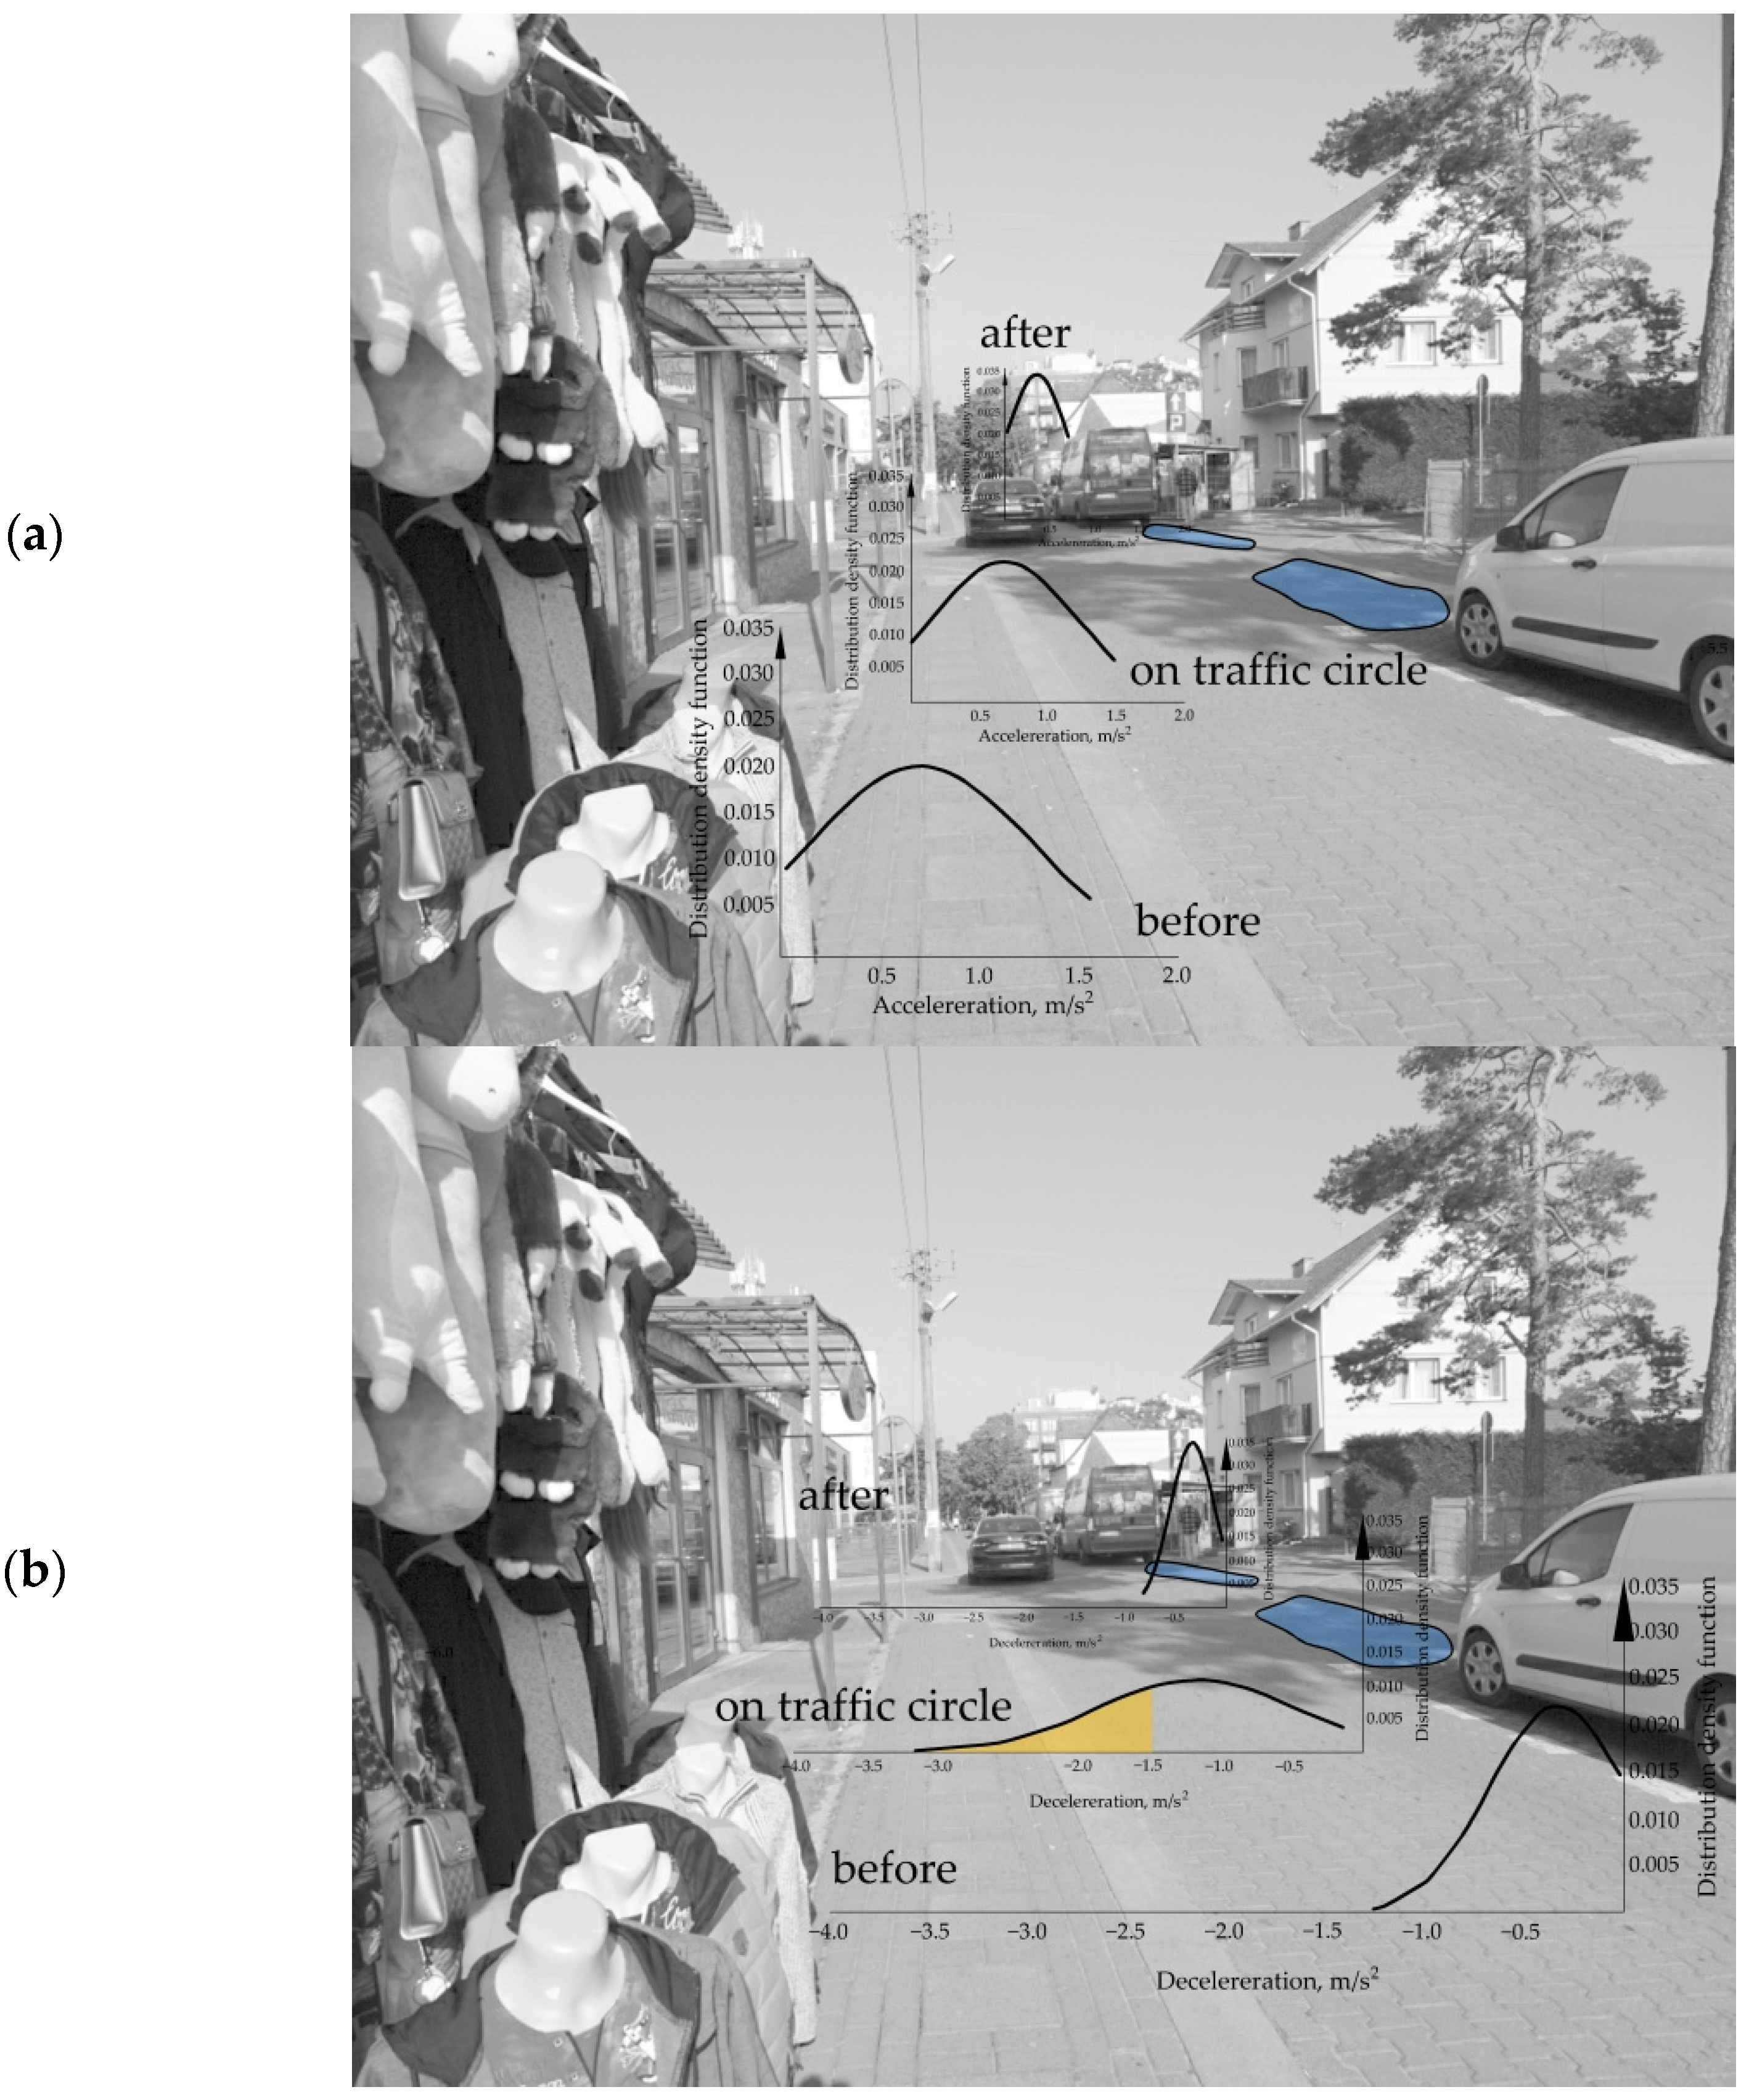
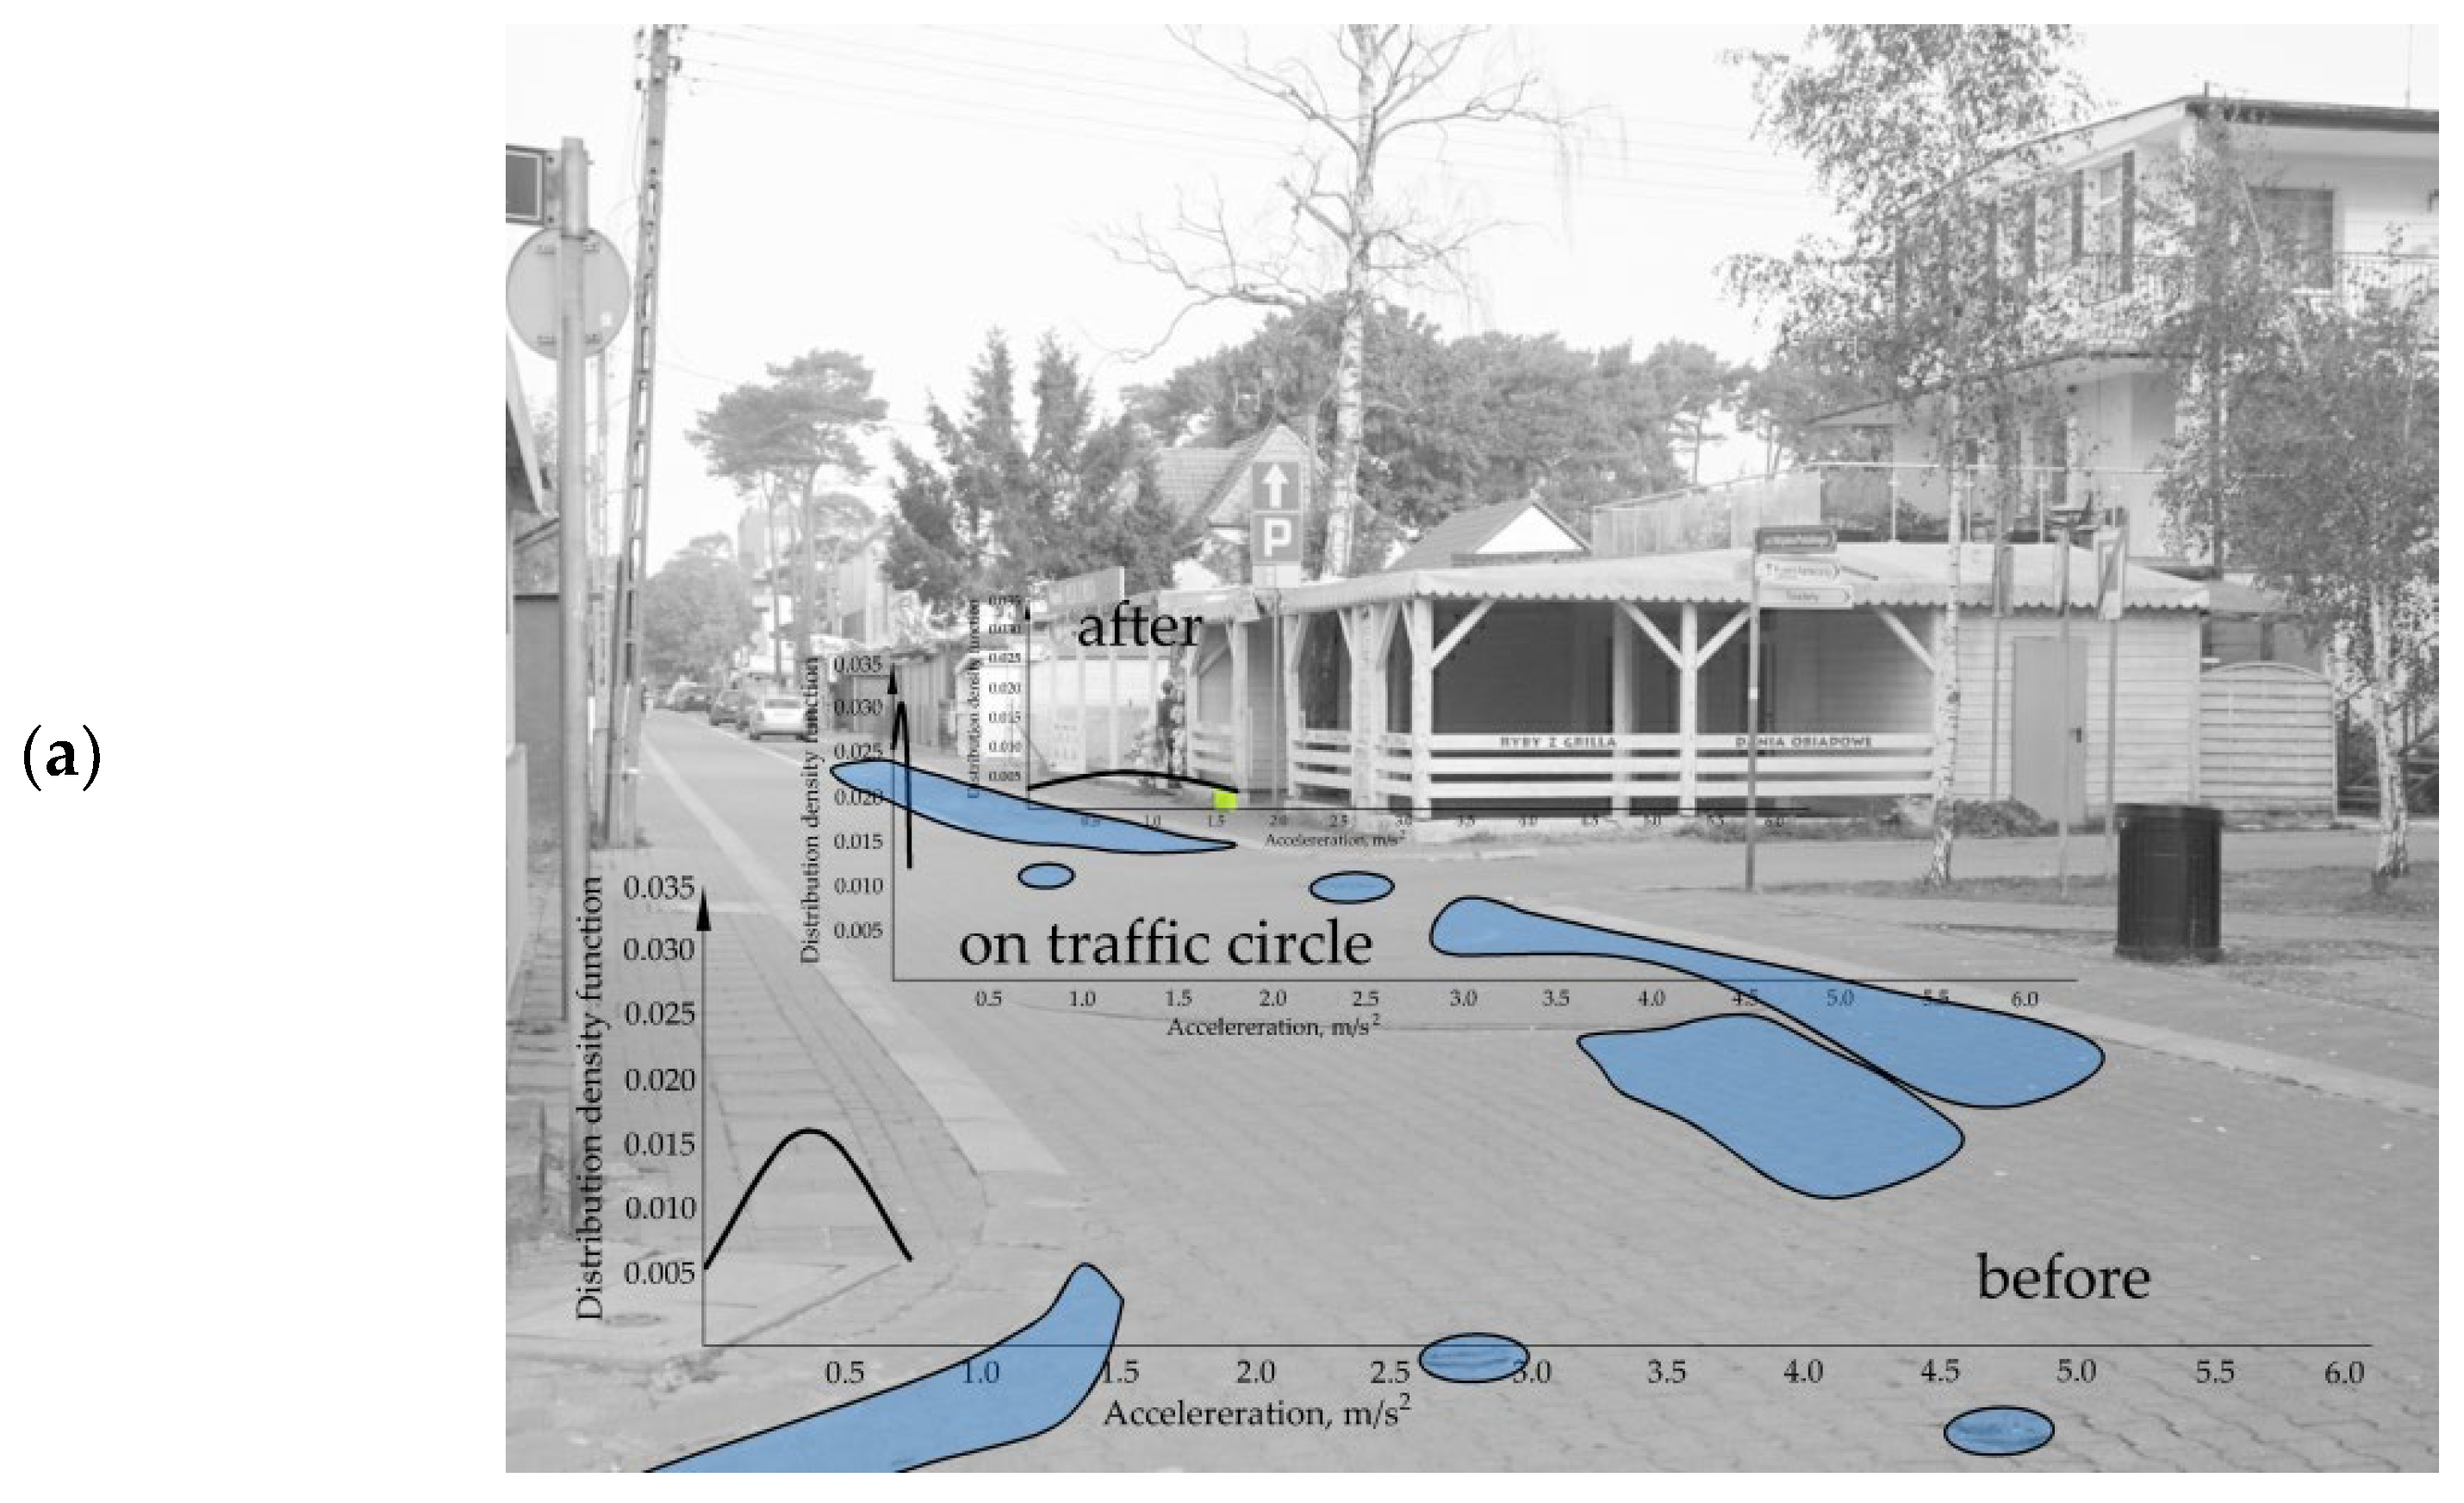
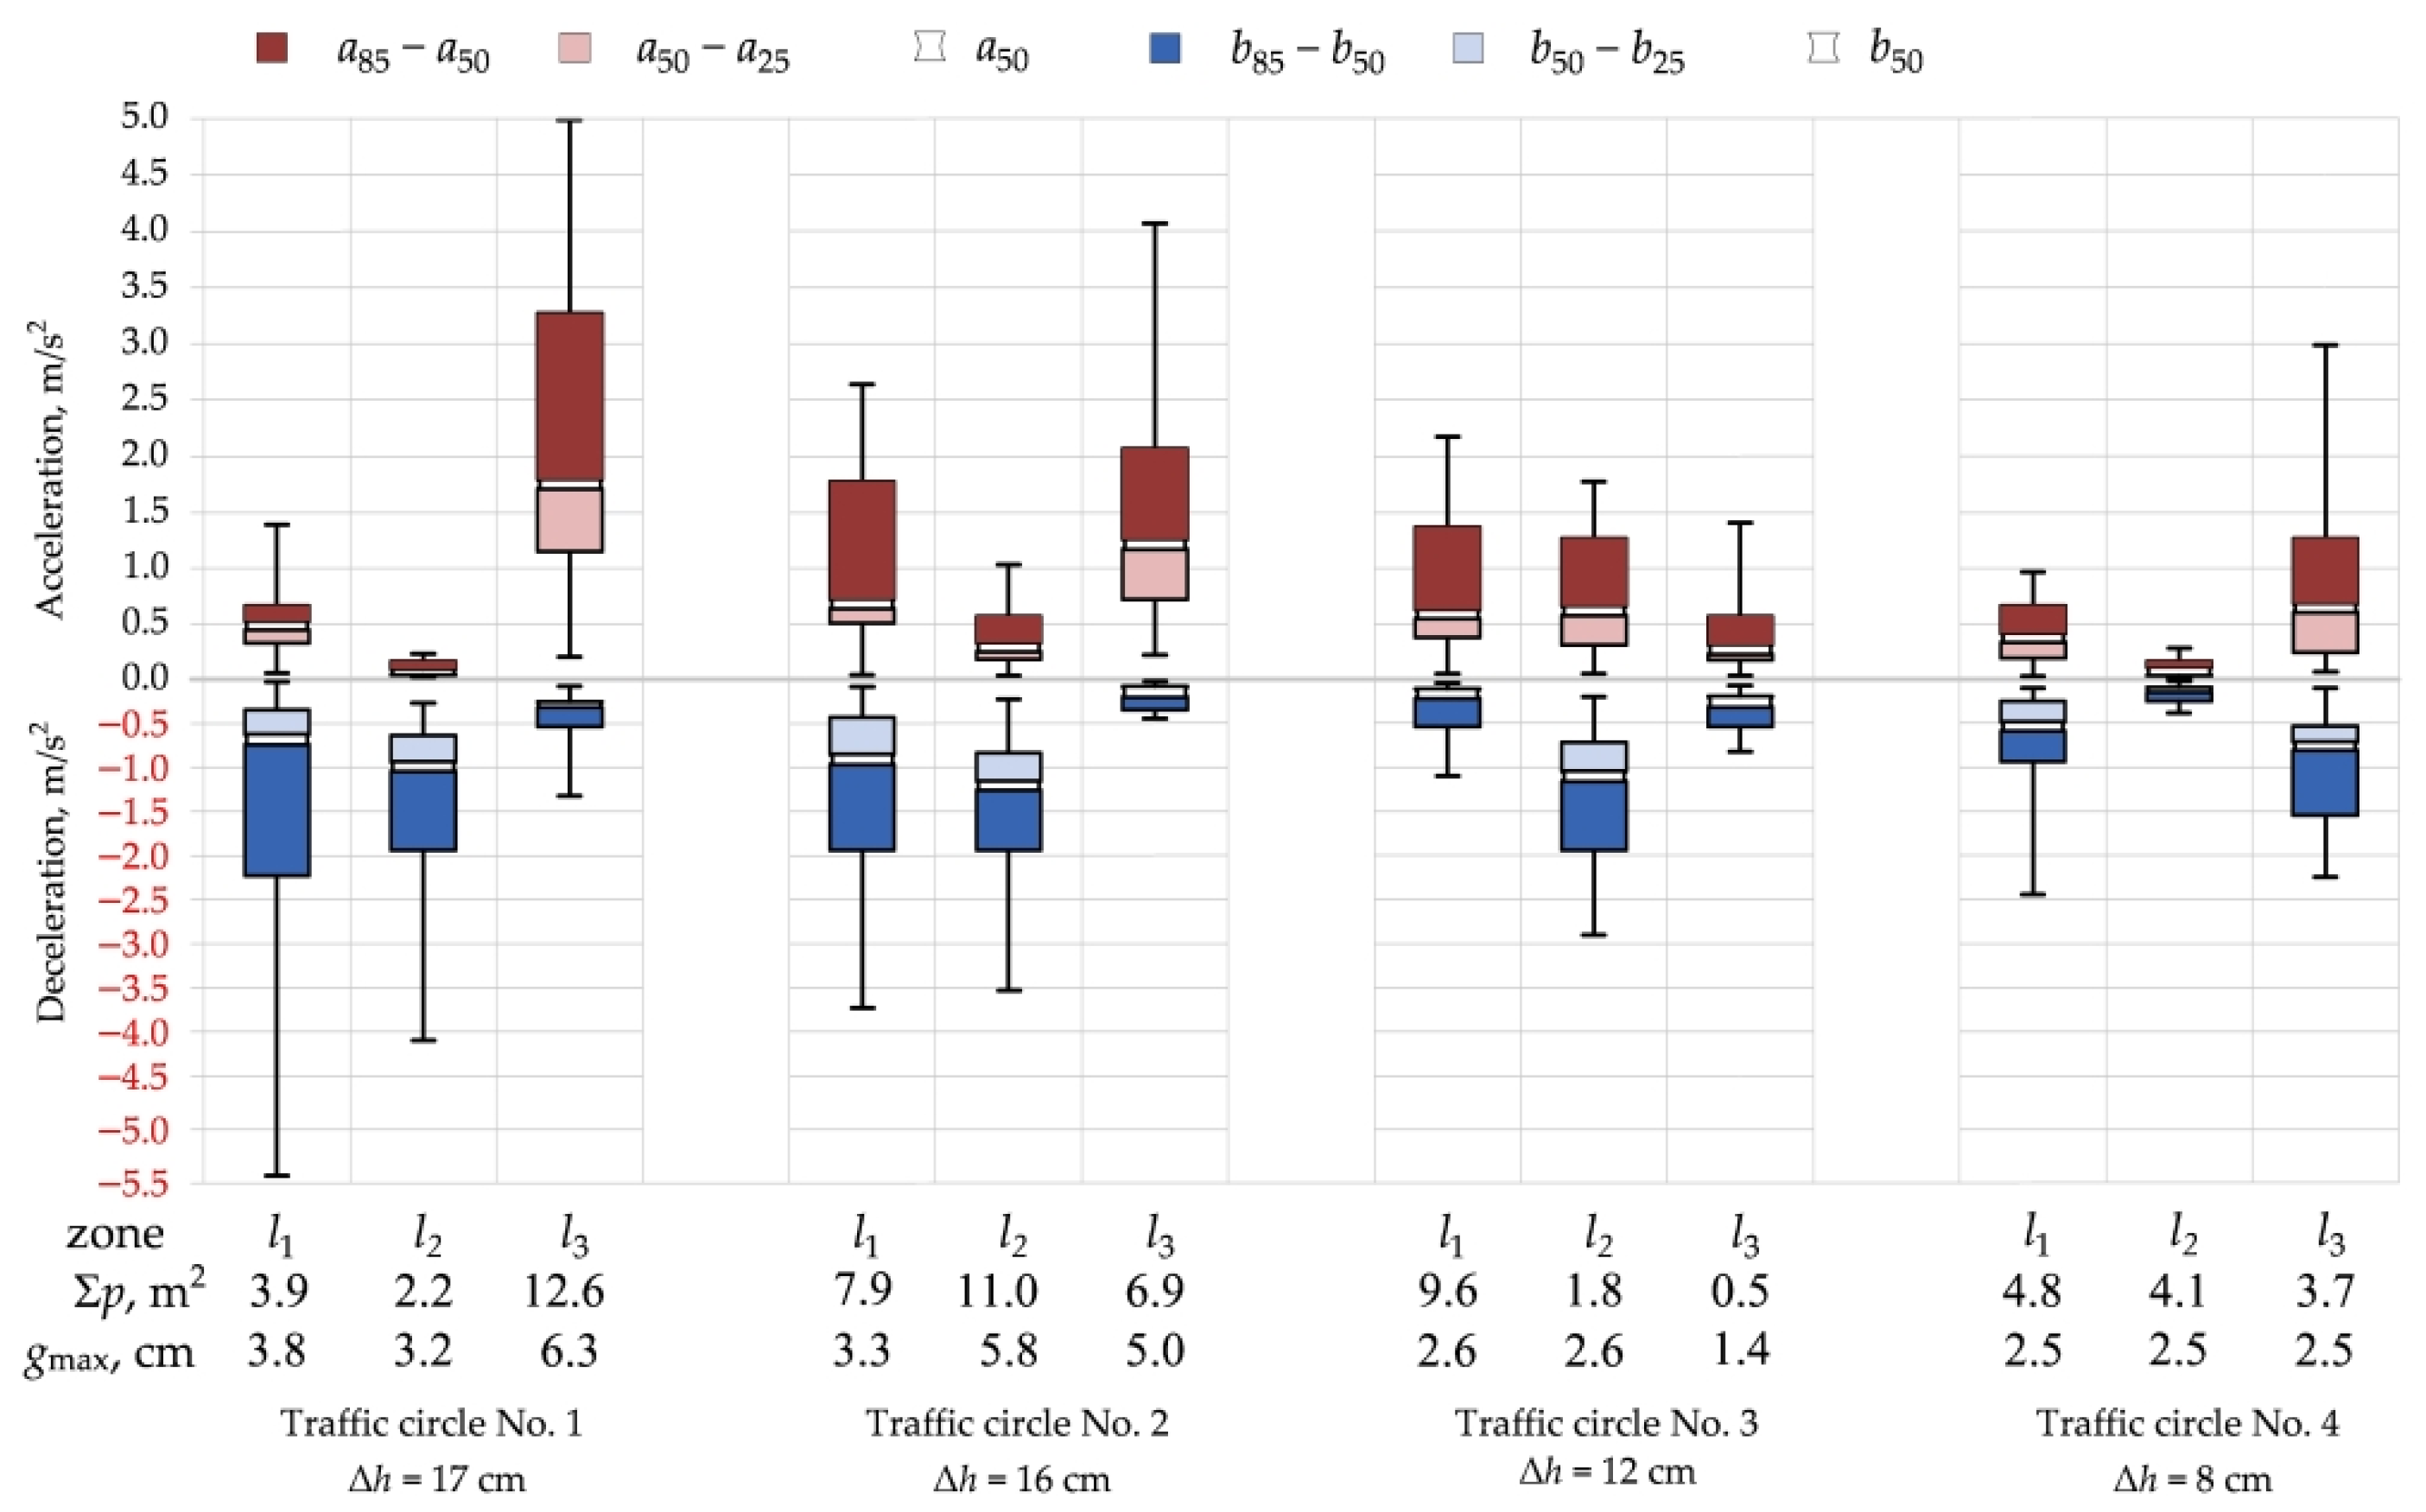
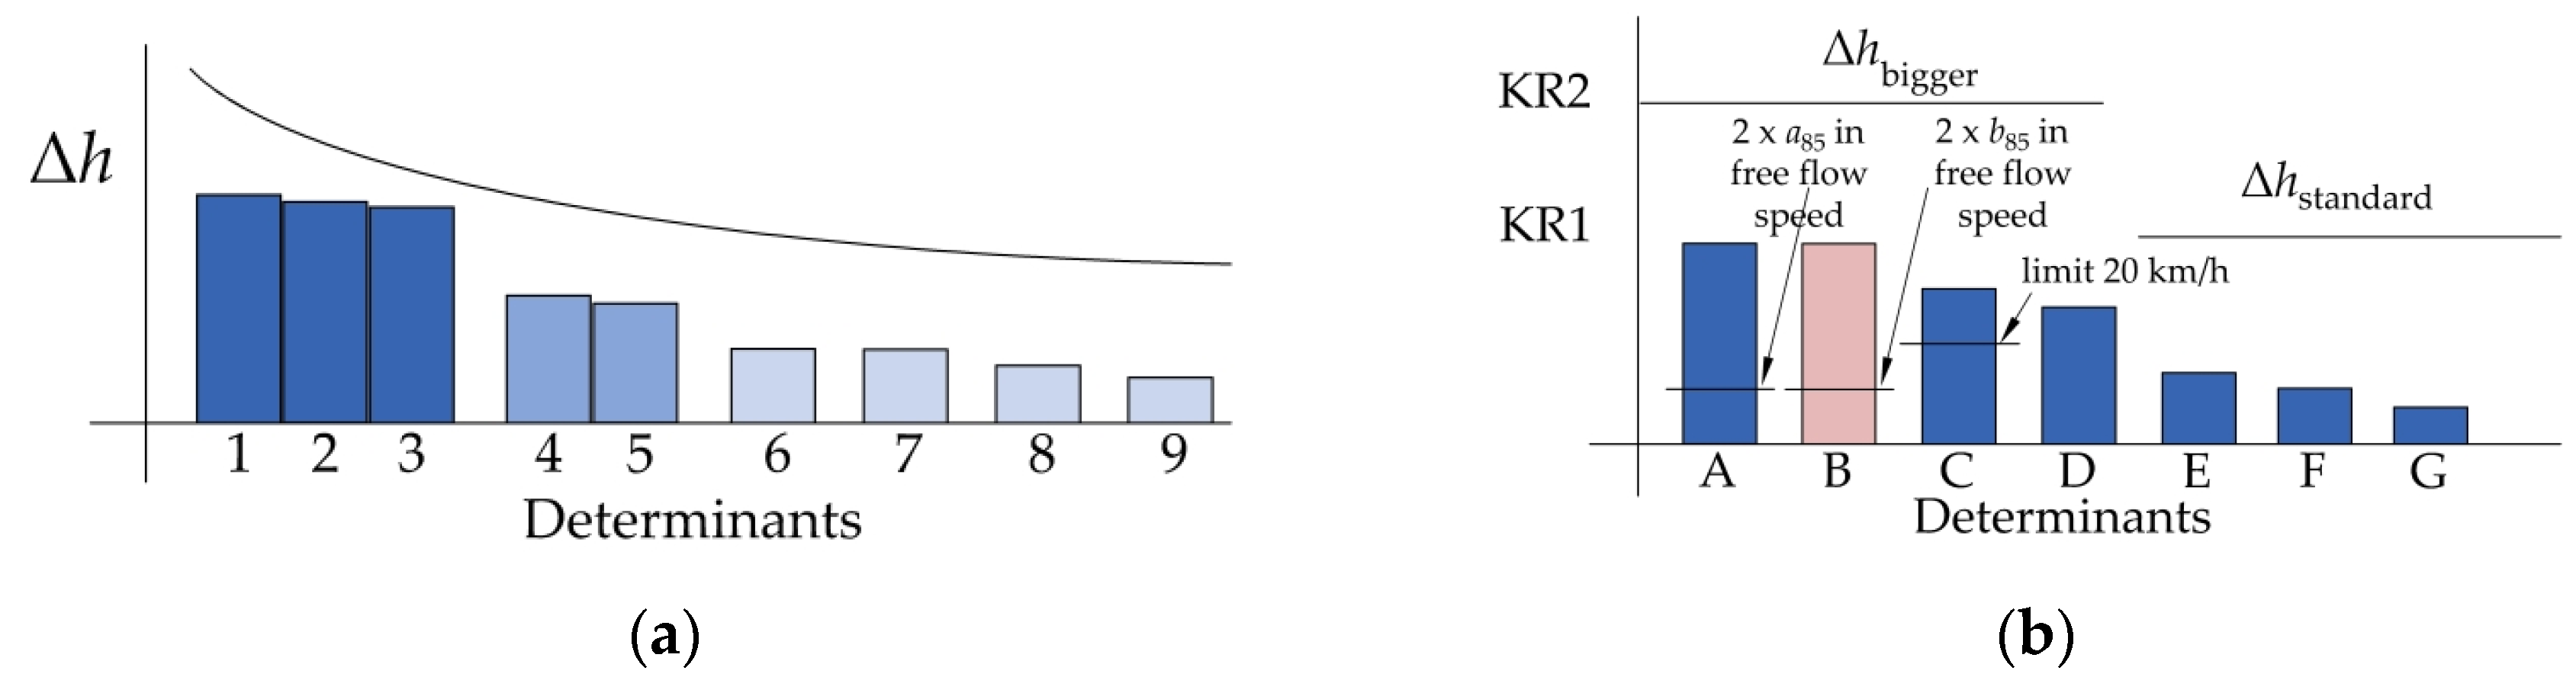
  • Increased traffic impact on the road surface around a traffic circle, in relation to acceleration, at different central island ∆h values;
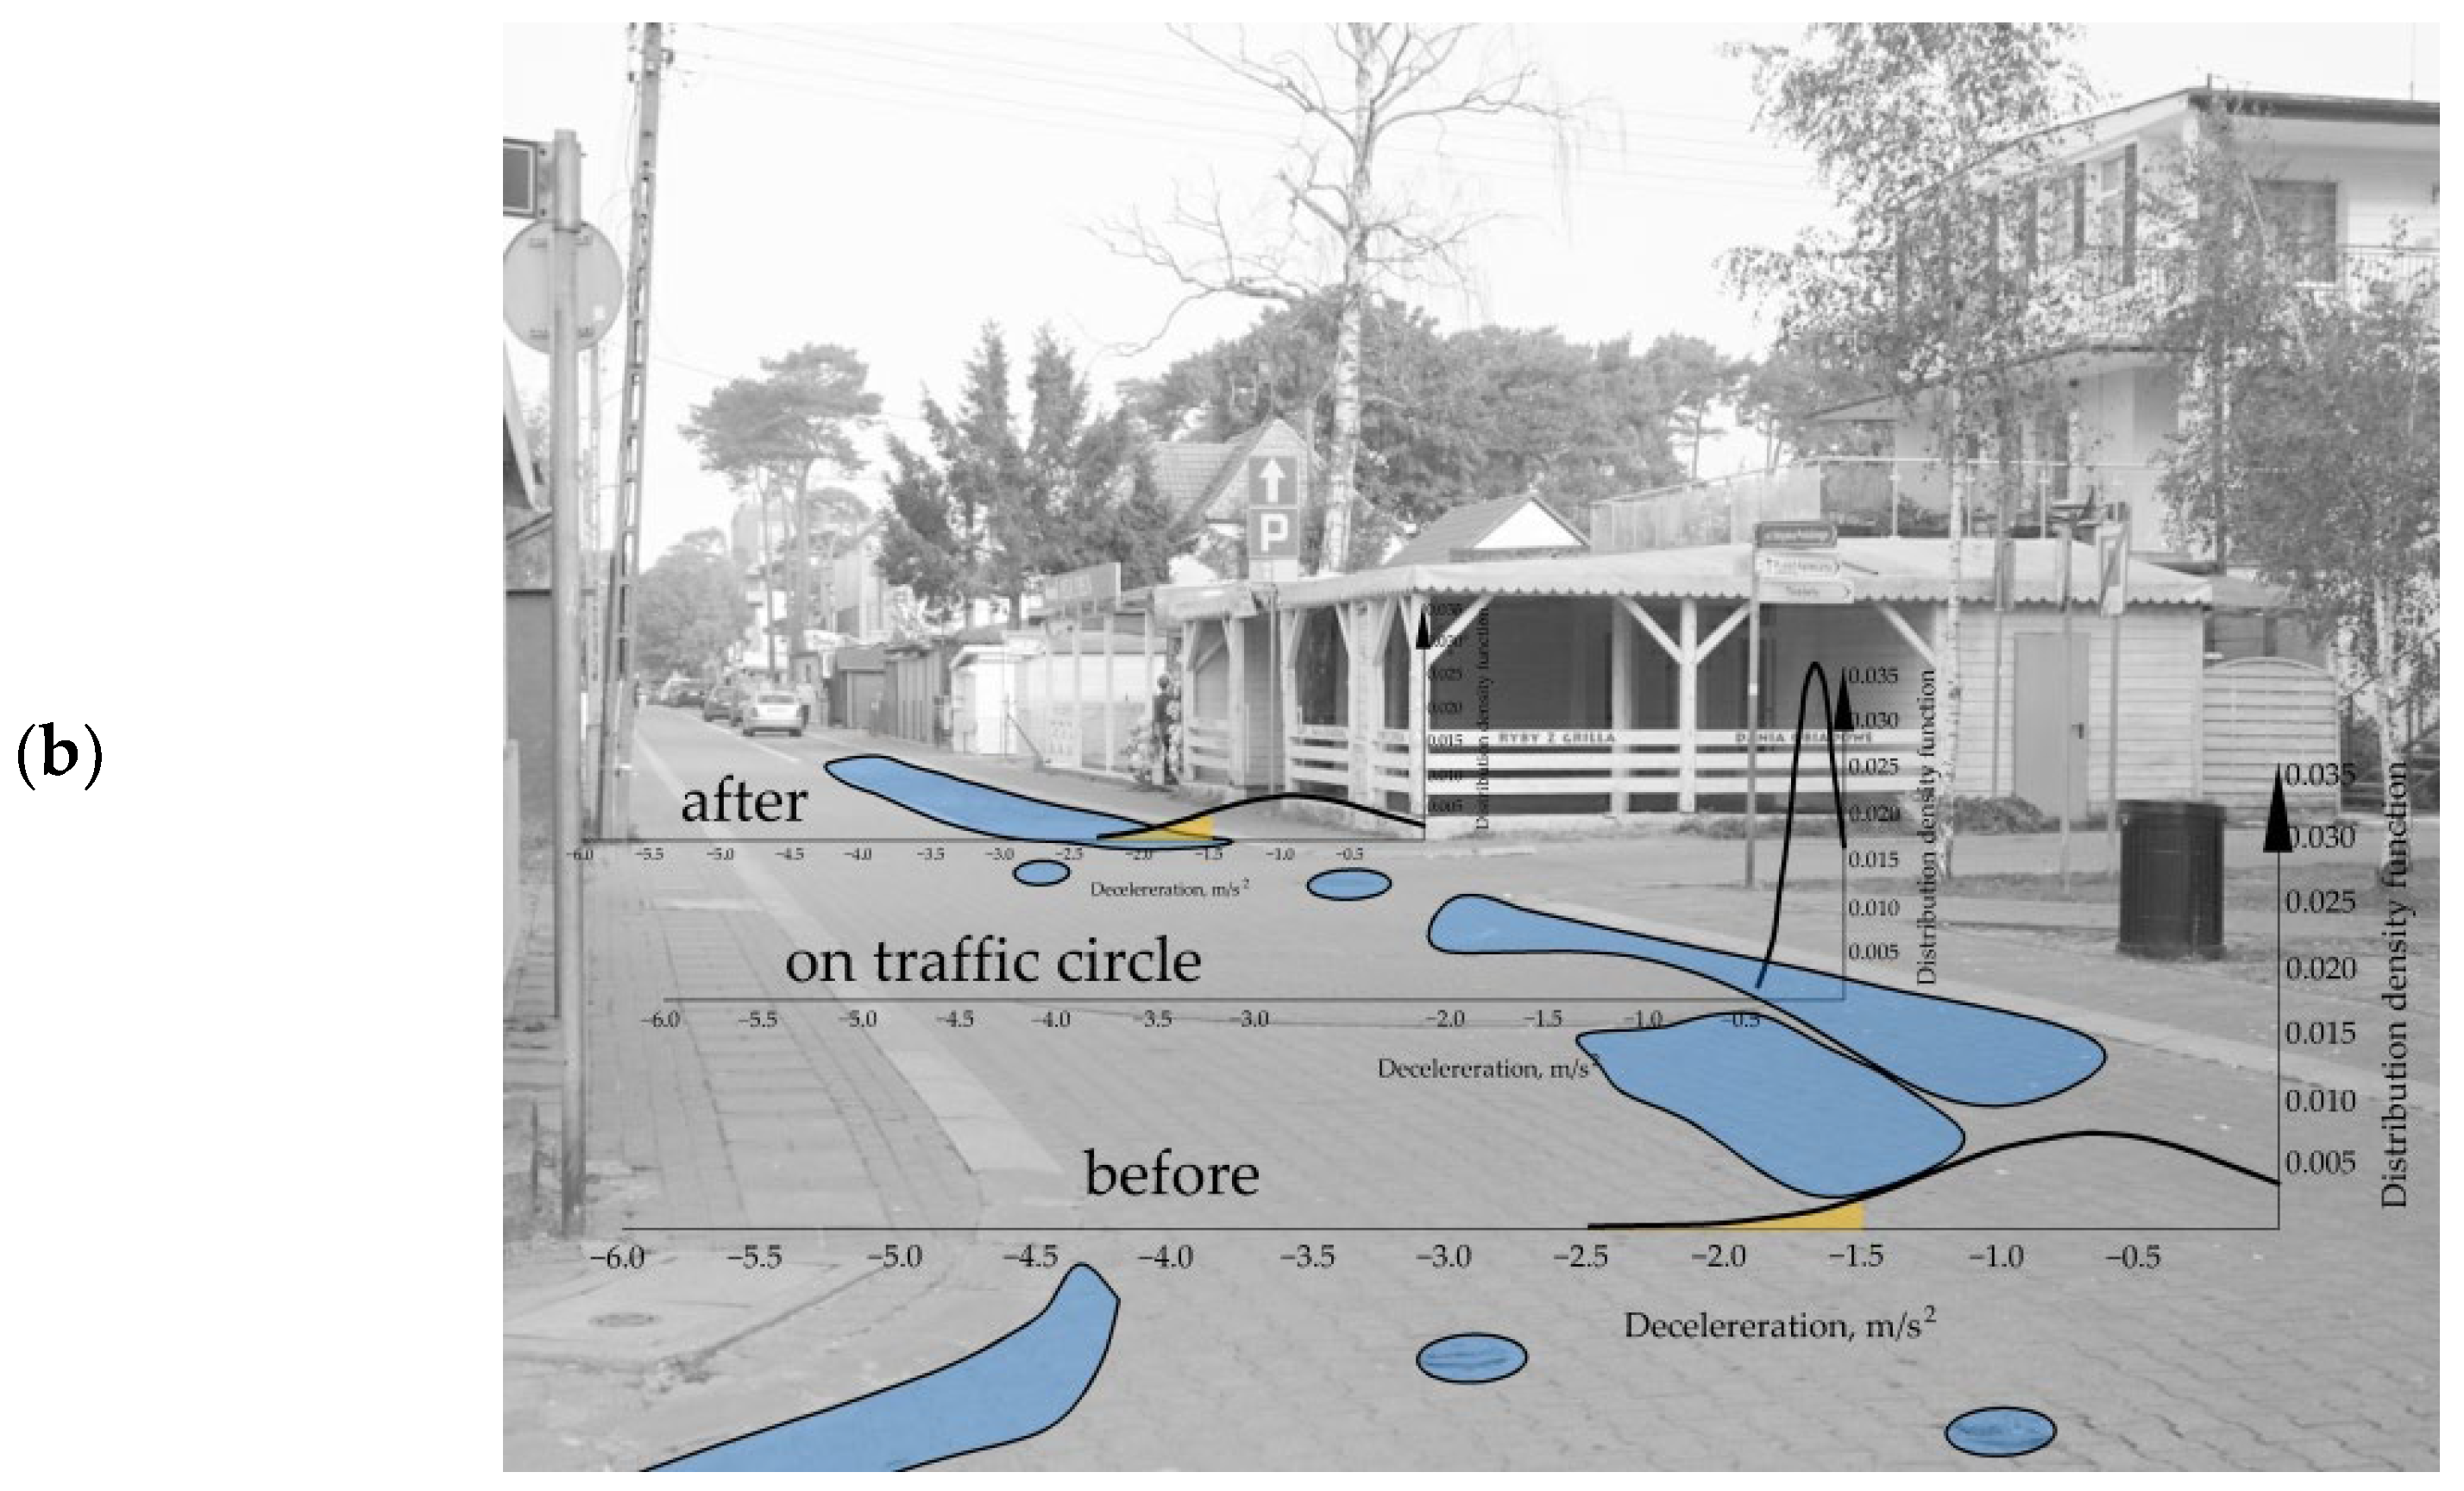
  • Increased traffic impact on the road surface around a traffic circle expressed by decelerations depending on central island ∆h;
  • Driving at speeds much higher than the home zone speed limit on a one-way street in periods beyond the season, as confirmed by Majer [5];
  • Presence of parallel on-street parking lanes, which narrow down the apparent carriageway width when occupied by vehicles at the beginning or end, thus considerably influencing vehicle decelerations or accelerations.
    In the latter case of ∆hstandard, the determinants relevant to the traffic duty class adopted for pedestrian street pavement include the following:
  • Placement of side obstacles, such as concrete planters, positioned at the parking lane’s beginning or end, which may narrow down the apparent carriageway width and make drivers change their driving style, resulting in slightly greater decelerations;
  • Weak subgrade, requiring strengthening of the lower layers;
  • Draining problems requiring incorporation of additional layers in the pavement structure.

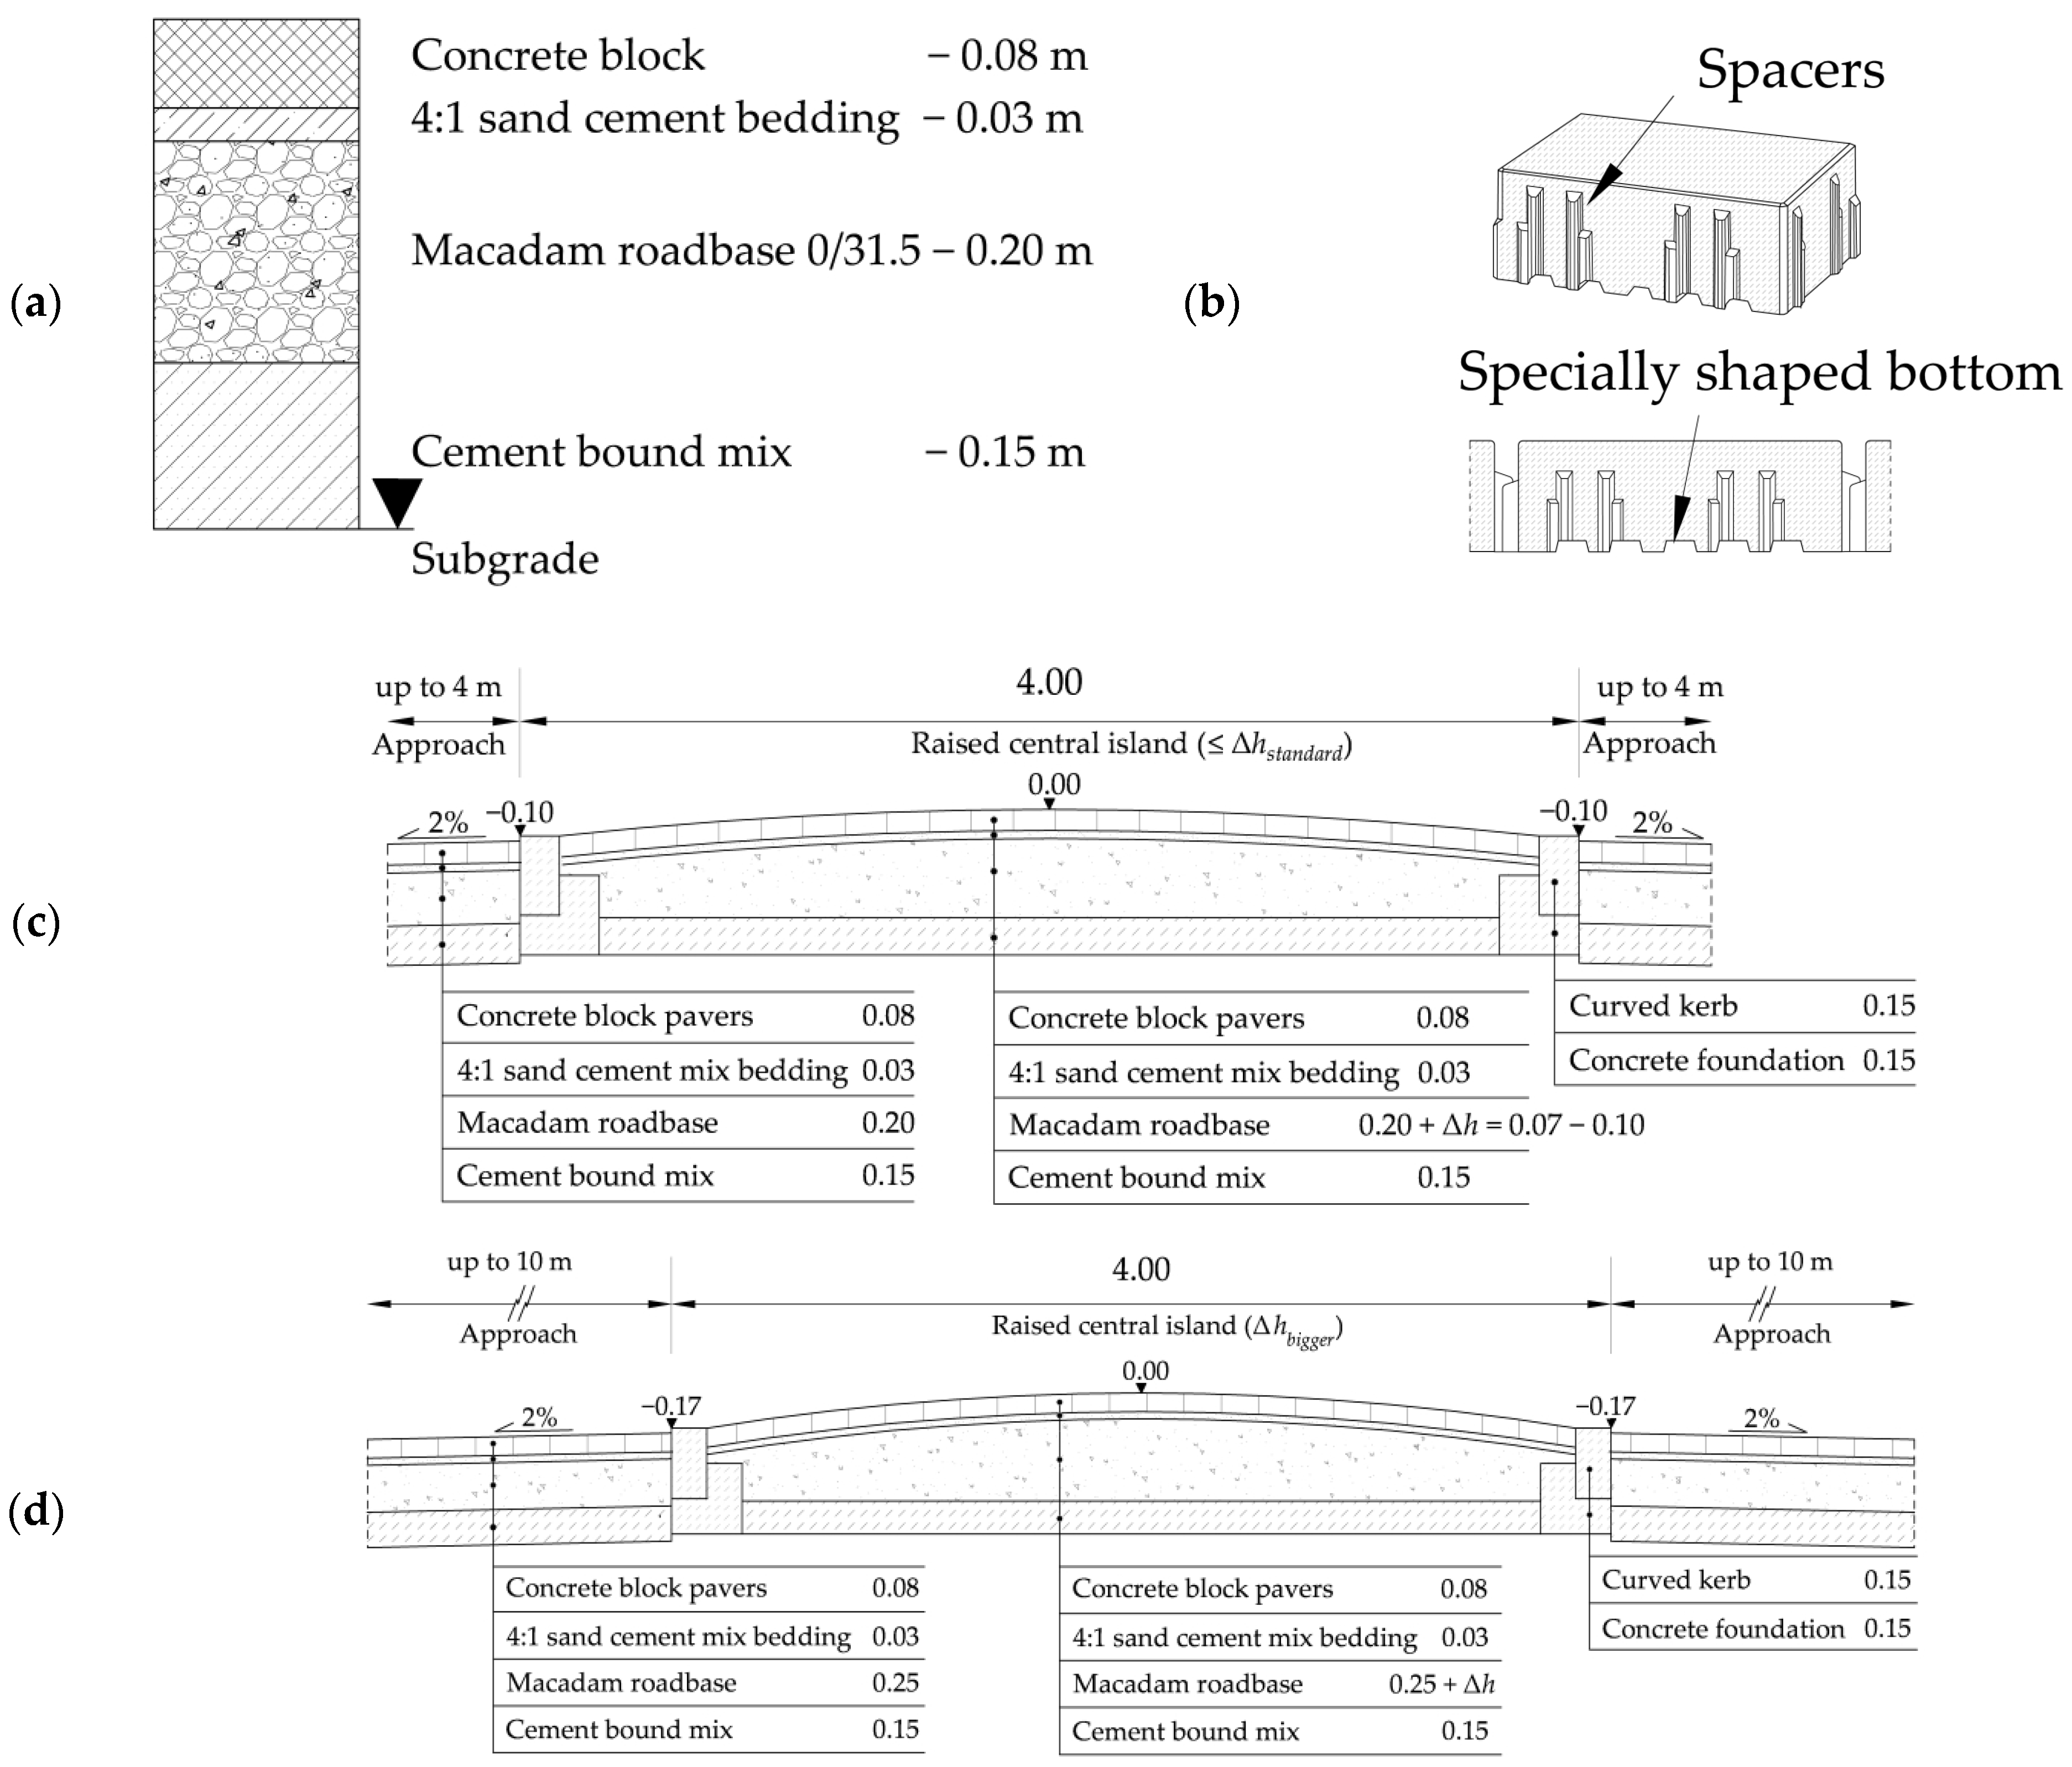
4.2. Design of Road Pavements and Their Interfaces

Home zone pavements are designed assuming prevalence of passenger car traffic. Commercial and municipal service vehicles are expected to come only sporadically yet more often than public transport vehicles expected only in extraordinary situations. Low-traffic duty classes are adopted as a result, based on the assumed total traffic load expressed by the number of standard axles of N100 < 90,000 [23,34]. Concrete block paving is considered the option of choice for home zone pavements due to its aesthetically pleasing appearance and functionality. A variety of shapes and colours allows for obtaining various matching patterns. On specific parts of the carriageway, such as on-street parking lanes, permeable surfacing may also be used. In the case of surfaces used on traffic lanes, the authors recommend the use of interlocking paver blocks. When laid, these blocks constrain each other, preventing displacement by horizontal forces or rotation. H-shaped and zig-zag are the most common interlocking paver block styles. Rectangular or square pavers may also be used in this application, as long as they have spacers on their sides and a specially shaped bottom. These features make the block sink into the underlying bedding [43]. For road paving, the pavers must be at least 8 cm thick. Joints between pavers should be filled with 0/2 natural sand containing a max. of 5% fine particles and a max. of 15% oversize particles. Pavers are laid on a 4:1 sand–cement mix bedding of a min. of 14 MPa 28-day compressive strength. For permeable pavements, 0/5 or 2/5 mixes are recommended for bedding material. The most popular roadbase materials include 0/31.5, 0/45 or 0/63 continuously graded aggregates. C3/4 hydraulically bound mixtures are also used. Also, a 15 to 25 cm subbase is placed if required to strengthen weak subgrade and where the frost-susceptibility of the soil is an issue. A typical home zone pavement for traffic characteristics, as described in this article, is shown in Figure 25.
Raised central islands induce the dynamic effects acting on pavements. Typically, a KR1 pavement structure is used except for the macadam roadbase layer, which is designed to be thicker through the central island ∆h (Figure 25c). The traffic impact analysis described in this article reveals the need for a higher traffic class pavement where raised central islands of ∆h > ∆hstandard are installed on streets. Pavements of increased strength, i.e., design for a higher traffic duty class, should be designed for junction areas, extending at least 4 m on the junction legs (Figure 25d). This length should preferably be increased up to 10 m when dealing with one-way legs, central island ∆h > ∆hstandard and vehicles driving faster than the home zone speed limit (Figure 22). The increased strength of a pavement may be achieved by adopting a higher, i.e., KR2, traffic duty class or by increasing the roadbase thickness by a min. of 5 cm (Figure 25d). A raised central island should be edged with curved kerbs laid on a 15 cm thick C12/15 or C16/20 concrete bed.

5. Conclusions

The following conclusions may be drawn as an outcome of the above-described analyses:
-
Sustainable pavement design for spa home zone areas should take into account the following:
The street function,
Traffic circle surrounding streetscape,
Pedestrian traffic characteristics (whether or not wheelchairs, roller skating or pedal go-karts will be allowed on the carriageway).
-
The height of the central island ∆h should be adjusted accordingly. The guidance provided by the relevant design guidelines and research publications is limited to recommending the height of speed humps located in normal streets. Traffic circles including a raised central island designed for home zone locations are rarely found in the existing road systems. Therefore, this article postulates to take the above factors into consideration when determining the raised central island height.
-
If coaches transporting holidaymakers or spa guests are expected or expansion projects are planned in the spa, according to the authors, a higher traffic duty class should be adopted in sustainable home zone design, especially on streets including raised central islands and central island ∆h >hstandard. The above-mentioned factors have not been taken into account in the relevant design guidelines and publications that have been published so far. This problem is tackled in this article for the first time and is set in a broader context of the sustainable design of junctions located in home zone areas.
-
The pavement deterioration survey and horizontal forces calculations (based on the measured decelerations and accelerations) showed that a higher-than-standard traffic duty class should be adopted in the design of pavements in home zones located in spa areas. This higher duty class (adopted for raised central island junctions on one-way streets) should take into account the dynamic effects imposed by vehicles passing through uneven raised surfaces for both straight-through and turning movements from the side legs. These conclusions are formulated for the first time based on the swept path and pavement condition comparative analyses carried out as part of this study. There is no mention in the available design guidelines and research publications of a higher duty class requirement for pavements at raised traffic circles in home zones, which could be recommended due to a higher proportion of turning movements on one-way streets typically found in these areas.
-
The placement of additional side obstacle markings the on-street parking lane’s beginning and end is also recommended for these locations where the traffic conditions change throughout the year, in order to make drivers slow down in periods when the lanes are more or less empty, i.e., beyond the season.
Summing up, some limitations of this research must be mentioned, as it is the first time that the need for two different pavement structures is postulated in a research paper. The surveys were carried out on four traffic circles, differing in terms of the ∆h value, surrounding streetscape and traffic characteristics on the analysed one-way streets. Therefore, considering that the available design guidelines do not comprehensively cover the problems of sustainable home zone design, the scope of research should be gradually expanded in future studies and analyses in this area of study.

Author Contributions

Conceptualization, S.M., A.S. and M.K.; methodology, S.M.; software, S.M. and M.K.; validation, S.M., A.S. and M.K.; formal analysis, S.M.; data curation, S.M. and M.K.; writing—original draft preparation, S.M., A.S. and M.K.; writing—review and editing, S.M.; visualization, S.M., A.S. and M.K.; supervision, S.M.; project administration, S.M. All authors have read and agreed to the published version of the manuscript.

Funding

This research received no external funding.

Institutional Review Board Statement

Not applicable.

Informed Consent Statement

Not applicable.

Data Availability Statement

The data presented in this study are available in the article.

Acknowledgments

The authors would like to thank Marcin Jóźwiak and the employees of the Public Roads Authority in Kamień Pomorski for their assistance during the traffic surveys carried out as part of this study and for providing us with the information on the home zone conversion project in Międzywodzie.

Conflicts of Interest

The authors declare that they have no known competing financial interests or personal relationships that could have appeared to influence the work reported in this paper.

References

  1. Mei, Z.; Feng, C.; Kong, L.; Zhang, L.; Chen, J. Assessment of different parking pricing strategies: A simulation-based analysis. Sustainability 2020, 12, 2056. [Google Scholar] [CrossRef]
  2. Mingardo, G.; van Wee, B.; Rye, T. Urban parking policy in Europe: A conceptualization of past and possible future trends. Transp. Res. Part A Policy Pract. 2015, 74, 268–281. [Google Scholar] [CrossRef]
  3. VanHoose, K.; de Gante, A.R.; Bertolini, L.; Kinigadner, J.; Büttner, B. From temporary arrangements to permanent change: Assessing the transitional capacity of city street experiments. J. Urban Mobil. 2022, 2, 100015. [Google Scholar] [CrossRef]
  4. Jones, P.; Hervik, A. Restraining car traffic in European cities: An emerging role for road pricing. Transp. Res. Part A Policy Pract. 1992, 26, 133–145. [Google Scholar] [CrossRef]
  5. Majer, S.; Sołowczuk, A. Traffic Circle—An Example of Sustainable Home Zone Design. Sustainability 2023, 15, 16751. [Google Scholar] [CrossRef]
  6. Ustawa—Prawo o Ruchu Drogowym, Dziennik Ustaw z Dnia 20 Czerwca 1997 Nr 98 Poz. 602, z Późn. Zm. Available online: https://isap.sejm.gov.pl/isap.nsf/DocDetails.xsp?id=wdu19970980602 (accessed on 2 November 2023). (In Polish)
  7. Jazcilevich, A.; Vázquez, J.M.M.; Ramírez, P.L.; Pérez, I.R. Economic-environmental analysis of traffic-calming devices. Transp. Res. Part D Transp. Environ. 2015, 36, 86–95. [Google Scholar] [CrossRef]
  8. Lee, G.; Joo, S.; Oh, C.; Choi, K. An evaluation framework for traffic calming measures in residential areas. Transp. Res. Part D Transp. Environ. 2013, 25, 68–76. [Google Scholar] [CrossRef]
  9. National Association of City Transportation Officials. Urban Street Design Guide; National Association of City Transportation Officials: Washington, DC, USA, 2013. [Google Scholar]
  10. Vejdirektoratet-Vejregeludvalget. Urban Traffic Areas—Part 7—Speed Reducers; Vejdirektoratet-Vejregeludvalget: Copenhagen, Denmark, 1991. [Google Scholar]
  11. Devon County Council Engineering & Planning Department. Traffic Calming Guidelines; Devon County Council Engineering & Planning Department: Devon, UK, 1992.
  12. East Ayrshire, Strathclyde Regional Council. Roads Development Guide; East Ayrshire, Strathclyde Regional Council: London, UK, 2010.
  13. Road and Transportation Research Association. Directives for the Design of Urban Roads. RASt 06; Road and Transportation Research Association, Working Group Highway Design, FGSV: Köln, Germany, 2006. [Google Scholar]
  14. Faheem, H. Suitability of existing traffic calming measures for use on some highways in Egypt. In Proceedings of the 9th International Conference on Civil and Architecture Engineering, Cairo, Egypt, 29–31 May 2012. [Google Scholar] [CrossRef]
  15. Loprencipe, G.; Moretti, L.; Pantuso, A.; Banfi, E. Raised pedestrian crossings: Analysis of their characteristics on a road network and geometric sizing proposal. Appl. Sci. 2019, 9, 2844. [Google Scholar] [CrossRef]
  16. Pérez-Acebo, H.; Ziółkowski, R.; Linares-Unamunzaga, A.; Gonzalo-Orden, H. A Series of Vertical Deflections, a Promising Traffic Calming Measure: Analysis and Recommendations for Spacing. Appl. Sci. 2020, 10, 3368. [Google Scholar] [CrossRef]
  17. Distefano, N.; Leonardi, S. Evaluation of the benefits of traffic calming on vehicle speed reduction. Civ. Eng. Archit. 2019, 7, 200–214. [Google Scholar] [CrossRef]
  18. Balant, M.; Lep, M. Comprehensive traffic calming as a key element of sustainable urban mobility plans-impacts of a neighbourhood redesign in Ljutomer. Sustainability 2020, 12, 8143. [Google Scholar] [CrossRef]
  19. Wirksamkeit Geschwindigkeitsdämpfender Maßnahmen Außerorts; Hessisches Landesamt für Straßen- und Verkehrswesen: Hessen, Germany. 1997. Available online: https://docplayer.org/57666796-Wirksamkeit-geschwindigkeitsdaempfender-massnahmen.html (accessed on 2 August 2020).
  20. Rokade, S.; Kumar, R.; Rokade, K.; Dubey, S.; Vijayawargiya, V. Assessment of effectiveness of vertical deflection type traffic calming measures and development of speed prediction models in urban perspective. Int. J. Civ. Eng. Technol. (IJCIET) 2017, 8, 1135–1146. Available online: https://iaeme.com/MasterAdmin/Journal_uploads/IJCIET/VOLUME_8_ISSUE_5/IJCIET_08_05_120.pdf (accessed on 14 June 2023).
  21. Mohammadipour, A.; Archilla, A.R.; Papacostas, C.S.; Alavi, S.H. Pedestrian (RPC) Influence on Speed Reduction. In Proceedings of the Transportation Research Board (TRB) 91st Annual Meeting, Washington, DC, USA, 22–26 January 2012; Available online: https://www.researchgate.net/publication/273687736_Pedestrian_RPC_Influence_on_Speed_Reduction (accessed on 14 May 2023).
  22. Ziółkowski, R. Zachowania Kierowców Pojazdów w Otoczeniu Środków Uspokojenia Ruchu w Warunkach Miejskich. Habilitation Thesis, Oficyna Wydawnicza Politechniki Białostockiej, Białystok, Poland, 2022. (In Polish). [Google Scholar]
  23. Gaca, S.; Alenowicz, J.; Dołżycki, B.; Jaskuła, P.; Mackiewicz, P.; Stienss, M.; Szydło, A. Katalog Typowych Konstrukcji Nawierzchni Jezdni Przeznaczonych do Ruchu Bardzo Lekkiego Oraz Innych Elementów Dróg WR-D-63; Ministerstwo Infrastruktury: Warsaw, Poland, 2022. (In Polish)
  24. Zapata, C.E.; Andrei, D.; Witczak, M.W.; Houston, W.N. Incorporation of Environmental Effects in Pavement Design. Road Mater. Pavement Des. 2007, 8, 667–693. [Google Scholar] [CrossRef]
  25. Juran, J.M.; Gryna, F.M. Juran’s Quality Control Handbook, 6th ed.; McGraw-Hill: New York, NY, USA, 2010. [Google Scholar]
  26. Ishikawa, K.; Loftus, J.H. Introduction to Quality Control, 3rd ed.; 3A Corporation: Tokyo, Japan, 1990. [Google Scholar]
  27. Ishikawa, K. Introduction to Quality Control; Taylor & Francis: Philadelphia, PA, USA, 1990. [Google Scholar]
  28. Ishikawa, K. What is Total Quality Control? The Japanese Way; Prentice-Hall Direct: Lansing, MI, USA, 1985. [Google Scholar]
  29. Majer, S.; Sołowczuk, A. Traffic calming measures and their slowing effect on the pedestrian refuge approach sections. Sustainability 2023, 15, 15265. [Google Scholar] [CrossRef]
  30. Azam, A.; Alshehri, A.H.; Alharthai, M.; El-Banna, M.M.; Yosri, A.M.; Beshr, A.A.A. Applications of Terrestrial Laser Scanner in Detecting Pavement Surface Defects. Processes 2023, 11, 1370. [Google Scholar] [CrossRef]
  31. Kim, M.-K.; Sohn, H.; Chang, C.-C. Localization and Quantification of Concrete Spalling Defects Using Terrestrial Laser Scanning. J. Comput. Civ. Eng. 2015, 29, 04014086. [Google Scholar] [CrossRef]
  32. Beshr, A.A.A.; Heneash, O.G.; Fawzy, H.E.-D.; El-Banna, M.M. Condition assessment of rigid pavement using terrestrial laser scanner observations. Int. J. Pavement Eng. 2021, 23, 4248–4259. [Google Scholar] [CrossRef]
  33. Feng, Z.; El Issaoui, A.; Lehtomäki, M.; Ingman, M.; Kaartinen, H.; Kukko, A.; Savela, J.; Hyyppä, H.; Hyyppä, J. Pavement Distress Detection Using Terrestrial Laser Scanning Point Clouds—Accuracy Evaluation and Algorithm Comparison. ISPRS Open J. Photogramm. Remote Sens. 2021, 3, 100010. [Google Scholar] [CrossRef]
  34. GDDP. Katalog Typowych Konstrukcji Nawierzchni Podatnych i Półsztywnych; Generalna Dyrekcja Dróg Publicznych GDDP: Warsaw, Poland, 1997. (In Polish) [Google Scholar]
  35. Trimble Inc. Trimble SX10 Technical Data Sheet; Trimble Inc.: Westminster, CO, USA, 2017. [Google Scholar]
  36. Transportation Research Board. Highway Capacity Manual 2000; Transportation Research Board, The National Academies: Washington, DC, USA, 2000. [Google Scholar]
  37. Majer, S.; Sołowczuk, A. Road surface degradation reasons in case of bus isles and bus stops. In Proceedings of the Seventh International Scientific Conference on International Combustion Engines and Vehicles—MOTAUTO, Sofia, Bulgaria, 18–20 October 2000; Volume 2, pp. 122–128. [Google Scholar]
  38. Gardas, P.; Sołowczuk, A. Estimation of the necessary length of strengthening the pavement structure in the vicinity of a bus stop on the basis of tests carried out in a selected city. Roads Bridges-Drogi Mosty 2022, 21, 39–61. [Google Scholar] [CrossRef]
  39. Government Publications Sale Office, Sun Alliance House. Traffic Management Guidelines; Government Publications Sale Office, Sun Alliance House: Dublin, Ireland, 2014.
  40. Boile, M.; Narayanan, P.; Ozbay, K. Impact of Buses on Highway Infrastructure: Case Study for New Jersey State. Transp. Res. Rec. J. Transp. Res. Board 2003, 1841, 32–40. [Google Scholar] [CrossRef]
  41. Dreyer, W.; Steyn, W. Evaluation of the effect of deteriorating riding quality on bus-pavement interaction. J. S. Afr. Inst. Civ. Eng. 2015, 57, 2–8. [Google Scholar] [CrossRef]
  42. Fekpe, E. Pavement Damage from Transit Buses and Motor Coaches; Energy, Transportation and Environment Division, Battelle Memorial Institute: Columbus, OH, USA, 2003. [Google Scholar]
  43. Lithonplus GmbH & Co. KG. Profilhandbuch; Lithonplus GmbH & Co. KG: Lingenfeld, Germany, 2016. [Google Scholar]
Figure 1. Adopted stages of the research: 1—heuristic method flow chart; 2—check sheets; 3—normal distribution and stratification; 4—control charts; 5—scatter diagrams; 6—cause and effect diagram; 7—Pareto charts. Source: own work.
Sustainability 16 01973 g001
Figure 2. Schematic representation of the study area showing its basic parameters. Source: own work.
Sustainability 16 01973 g002
Figure 3. Trimble SX10 scanning total station used for the terrestrial laser scanning survey carried out as part of this study. (a) Total station location near traffic circle No. 4; (b) selected phases of the total station and 3D scanning operation, i.e., 360° rotation; (c) selected phases of the total station and 3D scanning operation, i.e., 180° tilt; (d) point cloud, as displayed on the controller screen. Source: own work.
Sustainability 16 01973 g003
Figure 4. Terrestrial laser scanning data analysis method used in this study. Source: own work.
Sustainability 16 01973 g004
Figure 5. A hyspometric map sample and DM3D model including selected pavement deformation spots: (a) hypsometric map; (b) model DM3D. Source: own work.
Sustainability 16 01973 g005
Figure 6. Pavement deterioration example: (a) subsidence past the traffic circle around a gas valve manhole; (b) subsidence at the central island edge, (c) central island perimeter kerb chipping and spalling; (d) shallow cavities in the central island area; (e) scratched block pavers. Source: own work.
Sustainability 16 01973 g006aSustainability 16 01973 g006b
Figure 7. SR4 traffic detectors for simultaneous volume and speed measurement: (a) hooking up the memory card and battery; (b) hanging of SR4 on a traffic signpost located past the circle island under analysis. Source: own work.
Sustainability 16 01973 g007
Figure 8. DM3D model generated for TC–1: (a) DM3D model and pavement deformation parameters; (b) municipal vehicles’ swept paths; (c) passenger cars’ swept paths. Source: own work.
Sustainability 16 01973 g008
Figure 9. DM3D model generated for TC-2: (a) DM3D model and pavement deformation parameters; (b) municipal vehicle cars’ swept paths; (c) passenger cars’ swept paths. Source: own work.
Sustainability 16 01973 g009
Figure 10. Traffic circle No. 2: (a) passages to the right of the central island, found to be the most frequent during the survey (source: own work); (b) image of the pavement after rainfall (source: Google Earth).
Sustainability 16 01973 g010
Figure 11. DM3D model generated for TC–3: (a) DM3D model and pavement deformation parameters; (b) municipal vehicles’ swept paths; (c) passenger cars’ swept paths. Source: own work.
Sustainability 16 01973 g011
Figure 12. Traffic circle No. 3: (a) closely parked vehicle on the approach leg (source: Google Earth); (b) closely parked vehicle on the exit leg (source: own work).
Sustainability 16 01973 g012
Figure 13. DM3D model generated for TC–4: (a) DM3D model and pavement deformation parameters; (b) municipal vehicles’ swept paths; (c) passenger cars’ swept paths. Source: own work.
Sustainability 16 01973 g013
Figure 14. Traffic circle approach phases: (a) central island profile; (b) the moment of driving onto the central island; (c) driving up the ramp; (d) the moment of passing the central island apex. Source: own work.
Sustainability 16 01973 g014
Figure 15. Visualization of Gaussian curve acceleration and deceleration on TC–1: (a) acceleration distribution; (b) deceleration distribution. Source: own work.
Sustainability 16 01973 g015
Figure 16. Visualization of Gaussian curve acceleration and deceleration on TC–2: (a) acceleration distribution; (b) deceleration distribution. Source: own work.
Sustainability 16 01973 g016
Figure 17. Visualization of Gaussian curve acceleration and deceleration on TC–3: (a) acceleration distribution; (b) deceleration distribution. Source: own work.
Sustainability 16 01973 g017
Figure 18. Visualization of Gaussian curve acceleration and deceleration on TC–4: (a) acceleration distribution; (b) deceleration distribution. Source: own work.
Sustainability 16 01973 g018aSustainability 16 01973 g018b
Figure 19. Speed profiles in the traffic flow direction and carriageway centreline elevations: (a) TC–1; (b) TC–2; (c) TC–3; (d) TC–4. Source: own work.
Sustainability 16 01973 g019aSustainability 16 01973 g019b
Figure 20. Illustrative deceleration/acceleration cumulative distribution functions. Source: own work.
Sustainability 16 01973 g020
Figure 21. Box plot of data measured. Source: own work.
Sustainability 16 01973 g021
Figure 22. Box plot analysing needed structural strengthening of pavements. Source: own work.
Sustainability 16 01973 g022
Figure 23. Cause and effect diagram—selected home zone sustainability determinants for spa locations, taking into account the central island ∆h and pavement structure design. Source: own work.
Sustainability 16 01973 g023
Figure 24. Possible Pareto chart interpretations determining what bearing the selected determinants have on the following: (a) central island ∆h value adopted in the design; (b) traffic duty class used to design the pavement structure. Source: own work.
Sustainability 16 01973 g024
Figure 25. Road pavement design proposed for home zones including raised central island: (a) baseline pavement design for sections between traffic circles; (b) recommended concrete block pavers style; (c) pavement on raised central island of ∆h ≤ ∆hstandard (KR1 class); (d) pavement strengthening on account of increased traffic loading at ∆h > ∆hstandard (KR2 class or thicker roadbase). Source: own work.
Sustainability 16 01973 g025
Table 1. Deceleration and acceleration distribution parameters. Source: own work.
Location SymbolDeceleration, m/s2SymbolAcceleration, m/s2
No. 1No. 2No. 3No. 4No. 1No. 2No. 3No. 4
beforebmax−5.5 *−3.5−1.2−2.4amax1.42.72.21.0
b85−2.3−2.0−0.6−1.0a850.71.81.40.7
bav−1.2−1.1−0.3−1.0aav0.50.90.70.4
on traffic circlebmax−4.0−3.7−2.8−0.4amax0.31.01.80.3
b85−2.0−2.0−2.0−0.3a850.20.61.30.2
bav−1.2−1.3−1.2−0.4aav0.10.40.70.1
afterbmax−1.3−0.4−0.8−2.2amax5.04.11.43.0
b85−0.6−0.4−0.6−1.6a853.52.10.61.3
bav−0.4−0.2−0.3−0.9aav1.91.30.40.8
* Negative deceleration values are highlighted in red.
Disclaimer/Publisher’s Note: The statements, opinions and data contained in all publications are solely those of the individual author(s) and contributor(s) and not of MDPI and/or the editor(s). MDPI and/or the editor(s) disclaim responsibility for any injury to people or property resulting from any ideas, methods, instructions or products referred to in the content.

