

Assessment of EU Bio-Based Economy Sectors Based on Environmental, Socioeconomic, and Technical Indicators


Abstract
1. Introduction
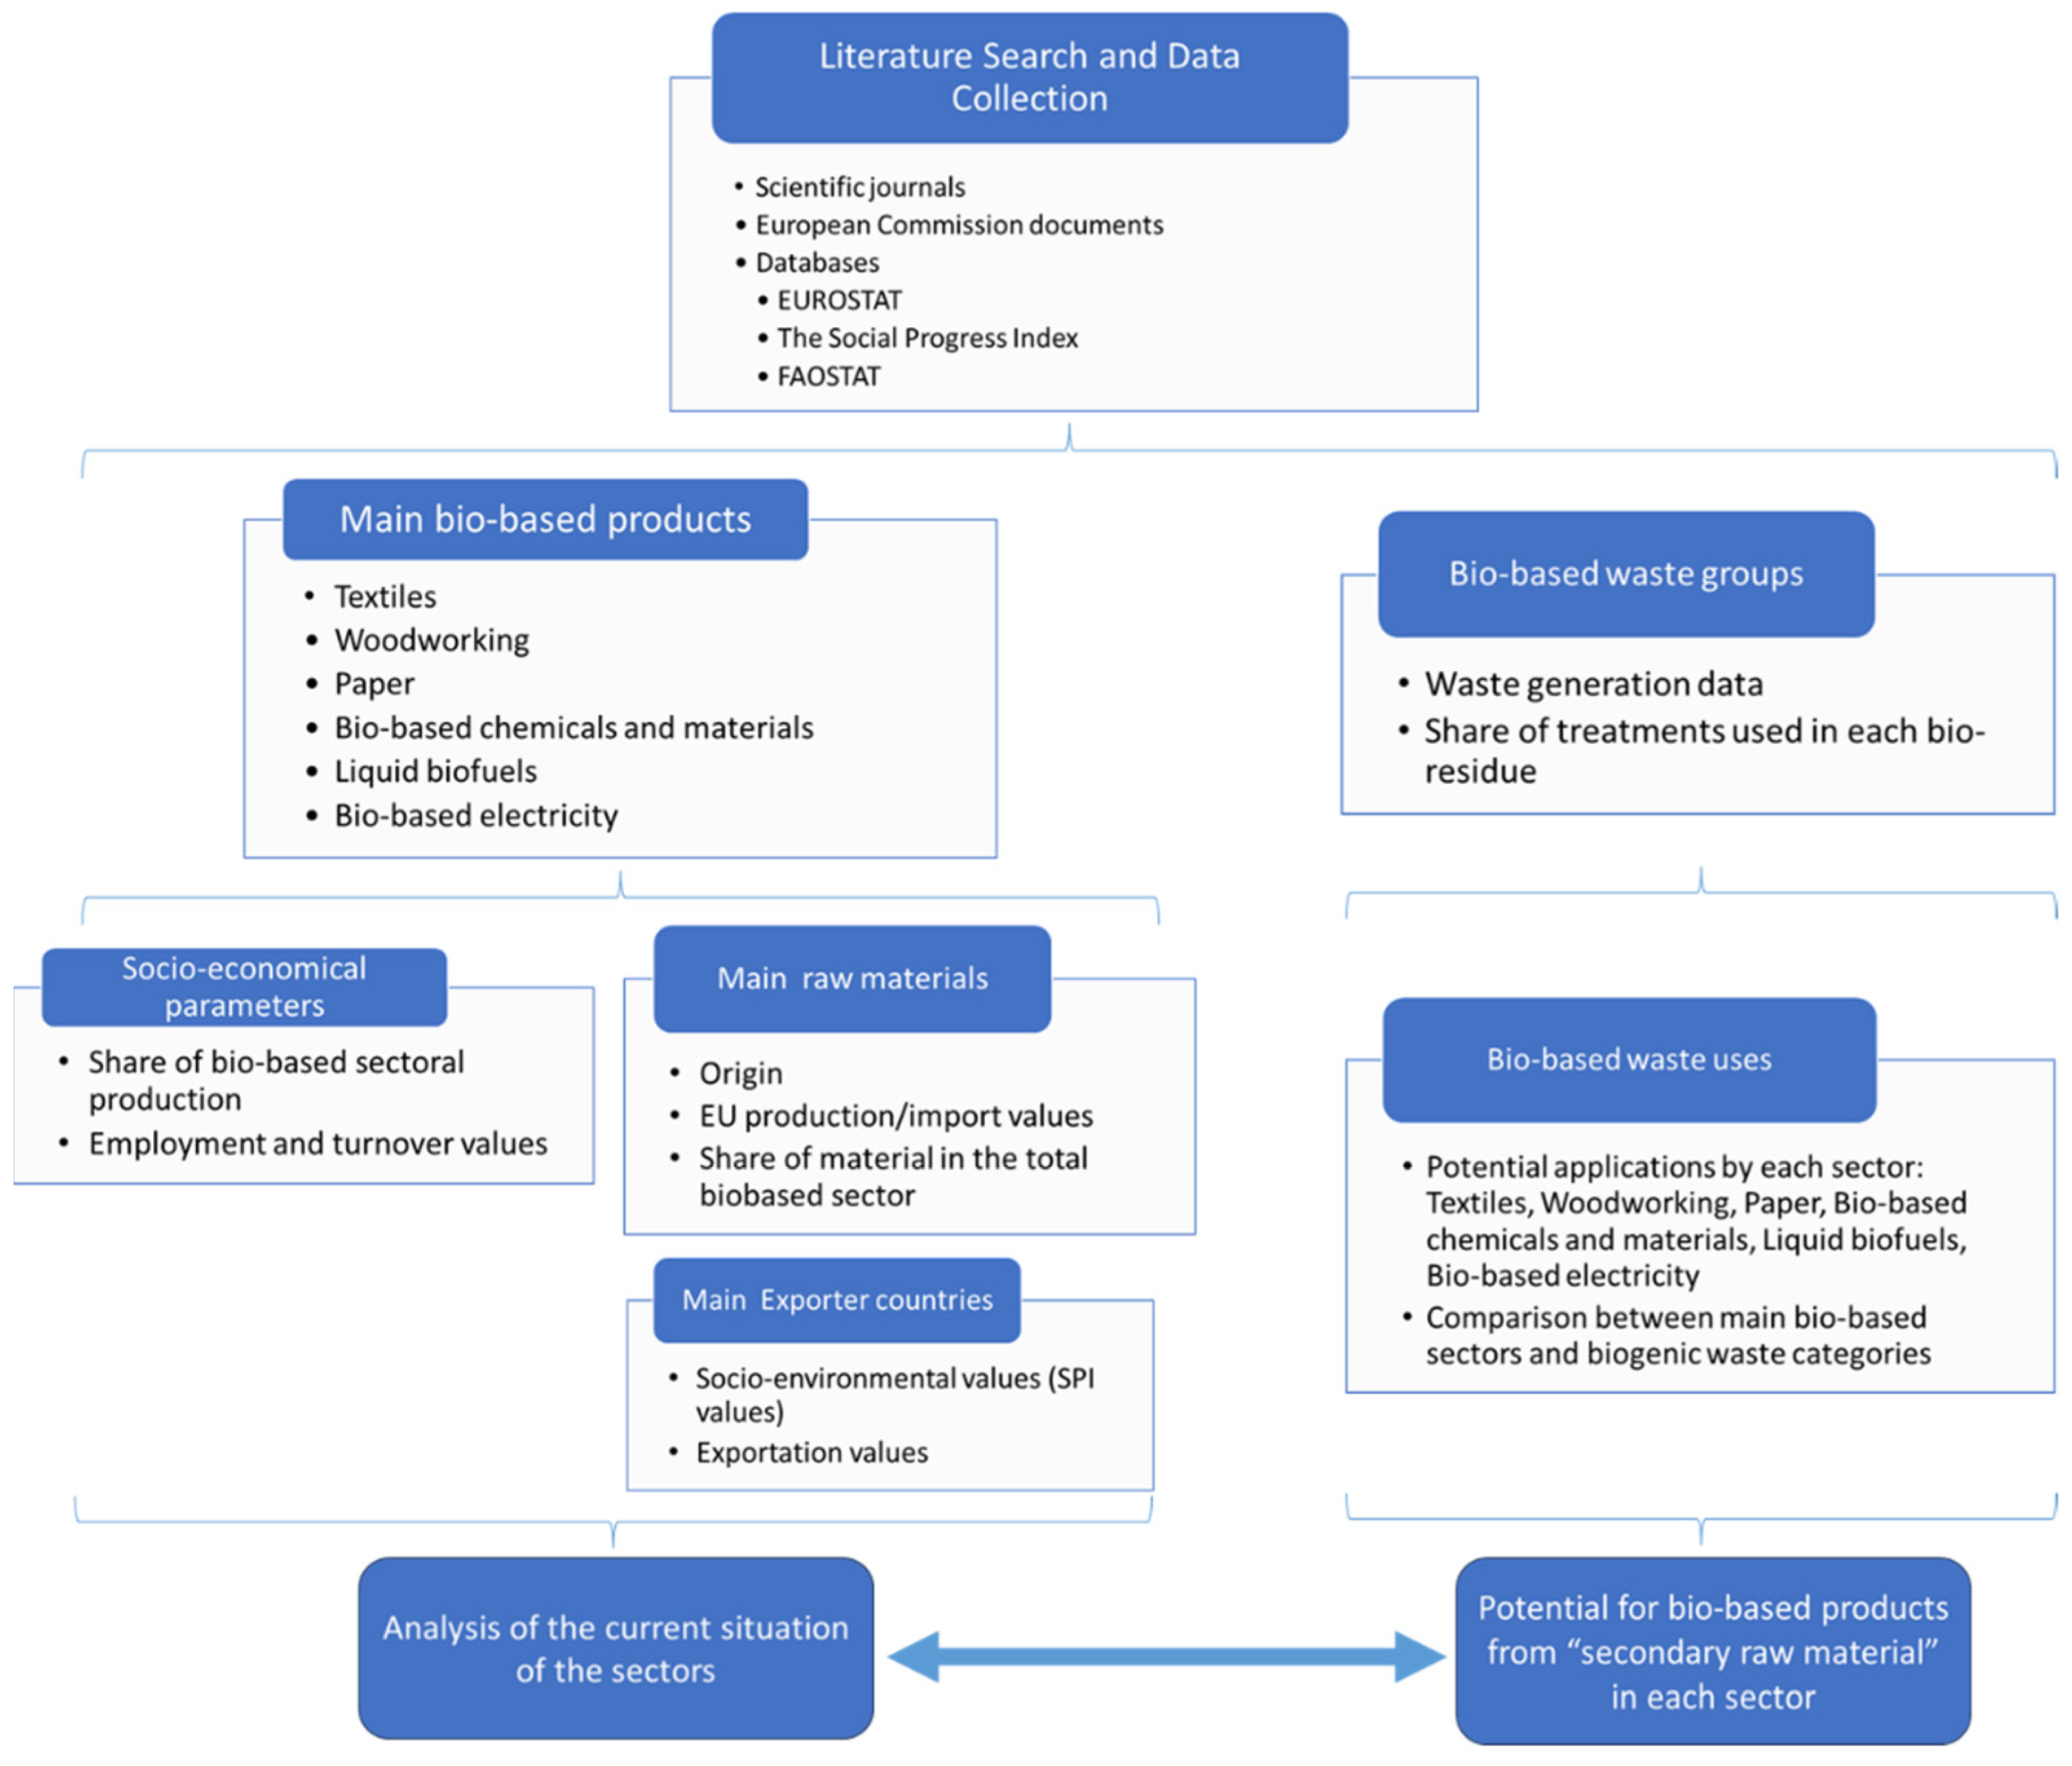
2. Methodology
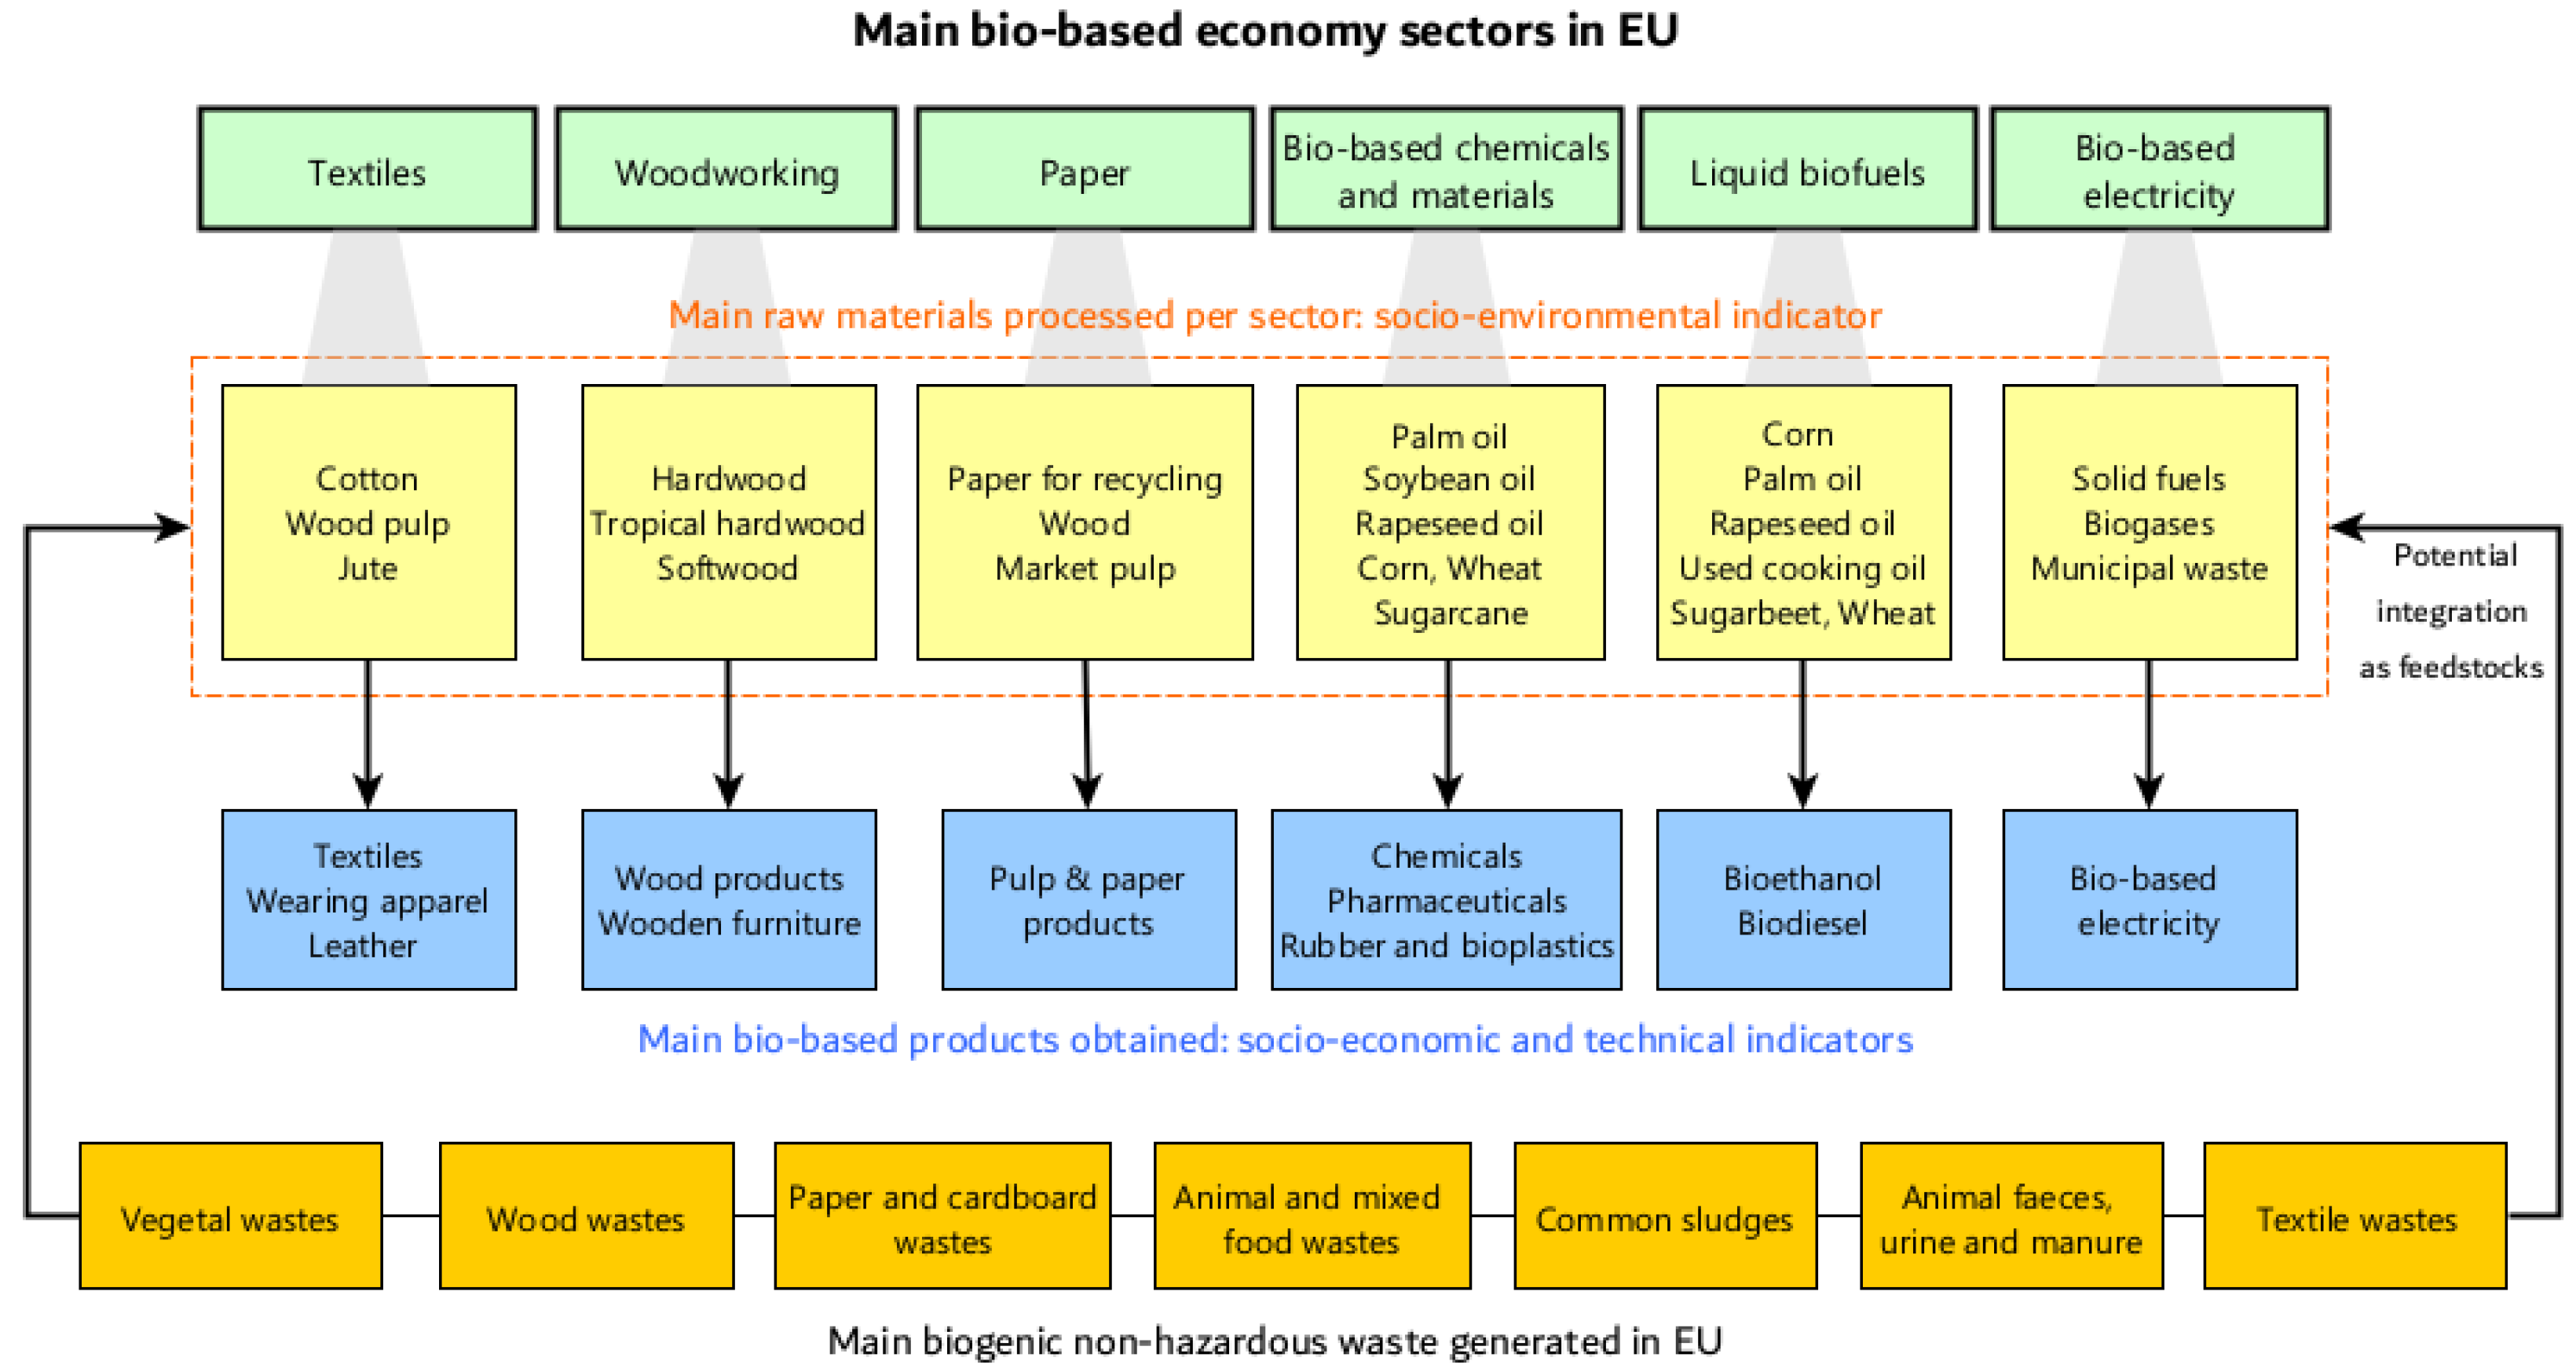
2.1. Methodology for the Analysis of the Current Situation of the Main Bio-Based Economy Sectors
- The share of bio-based sectoral production, employment, and turnover values.
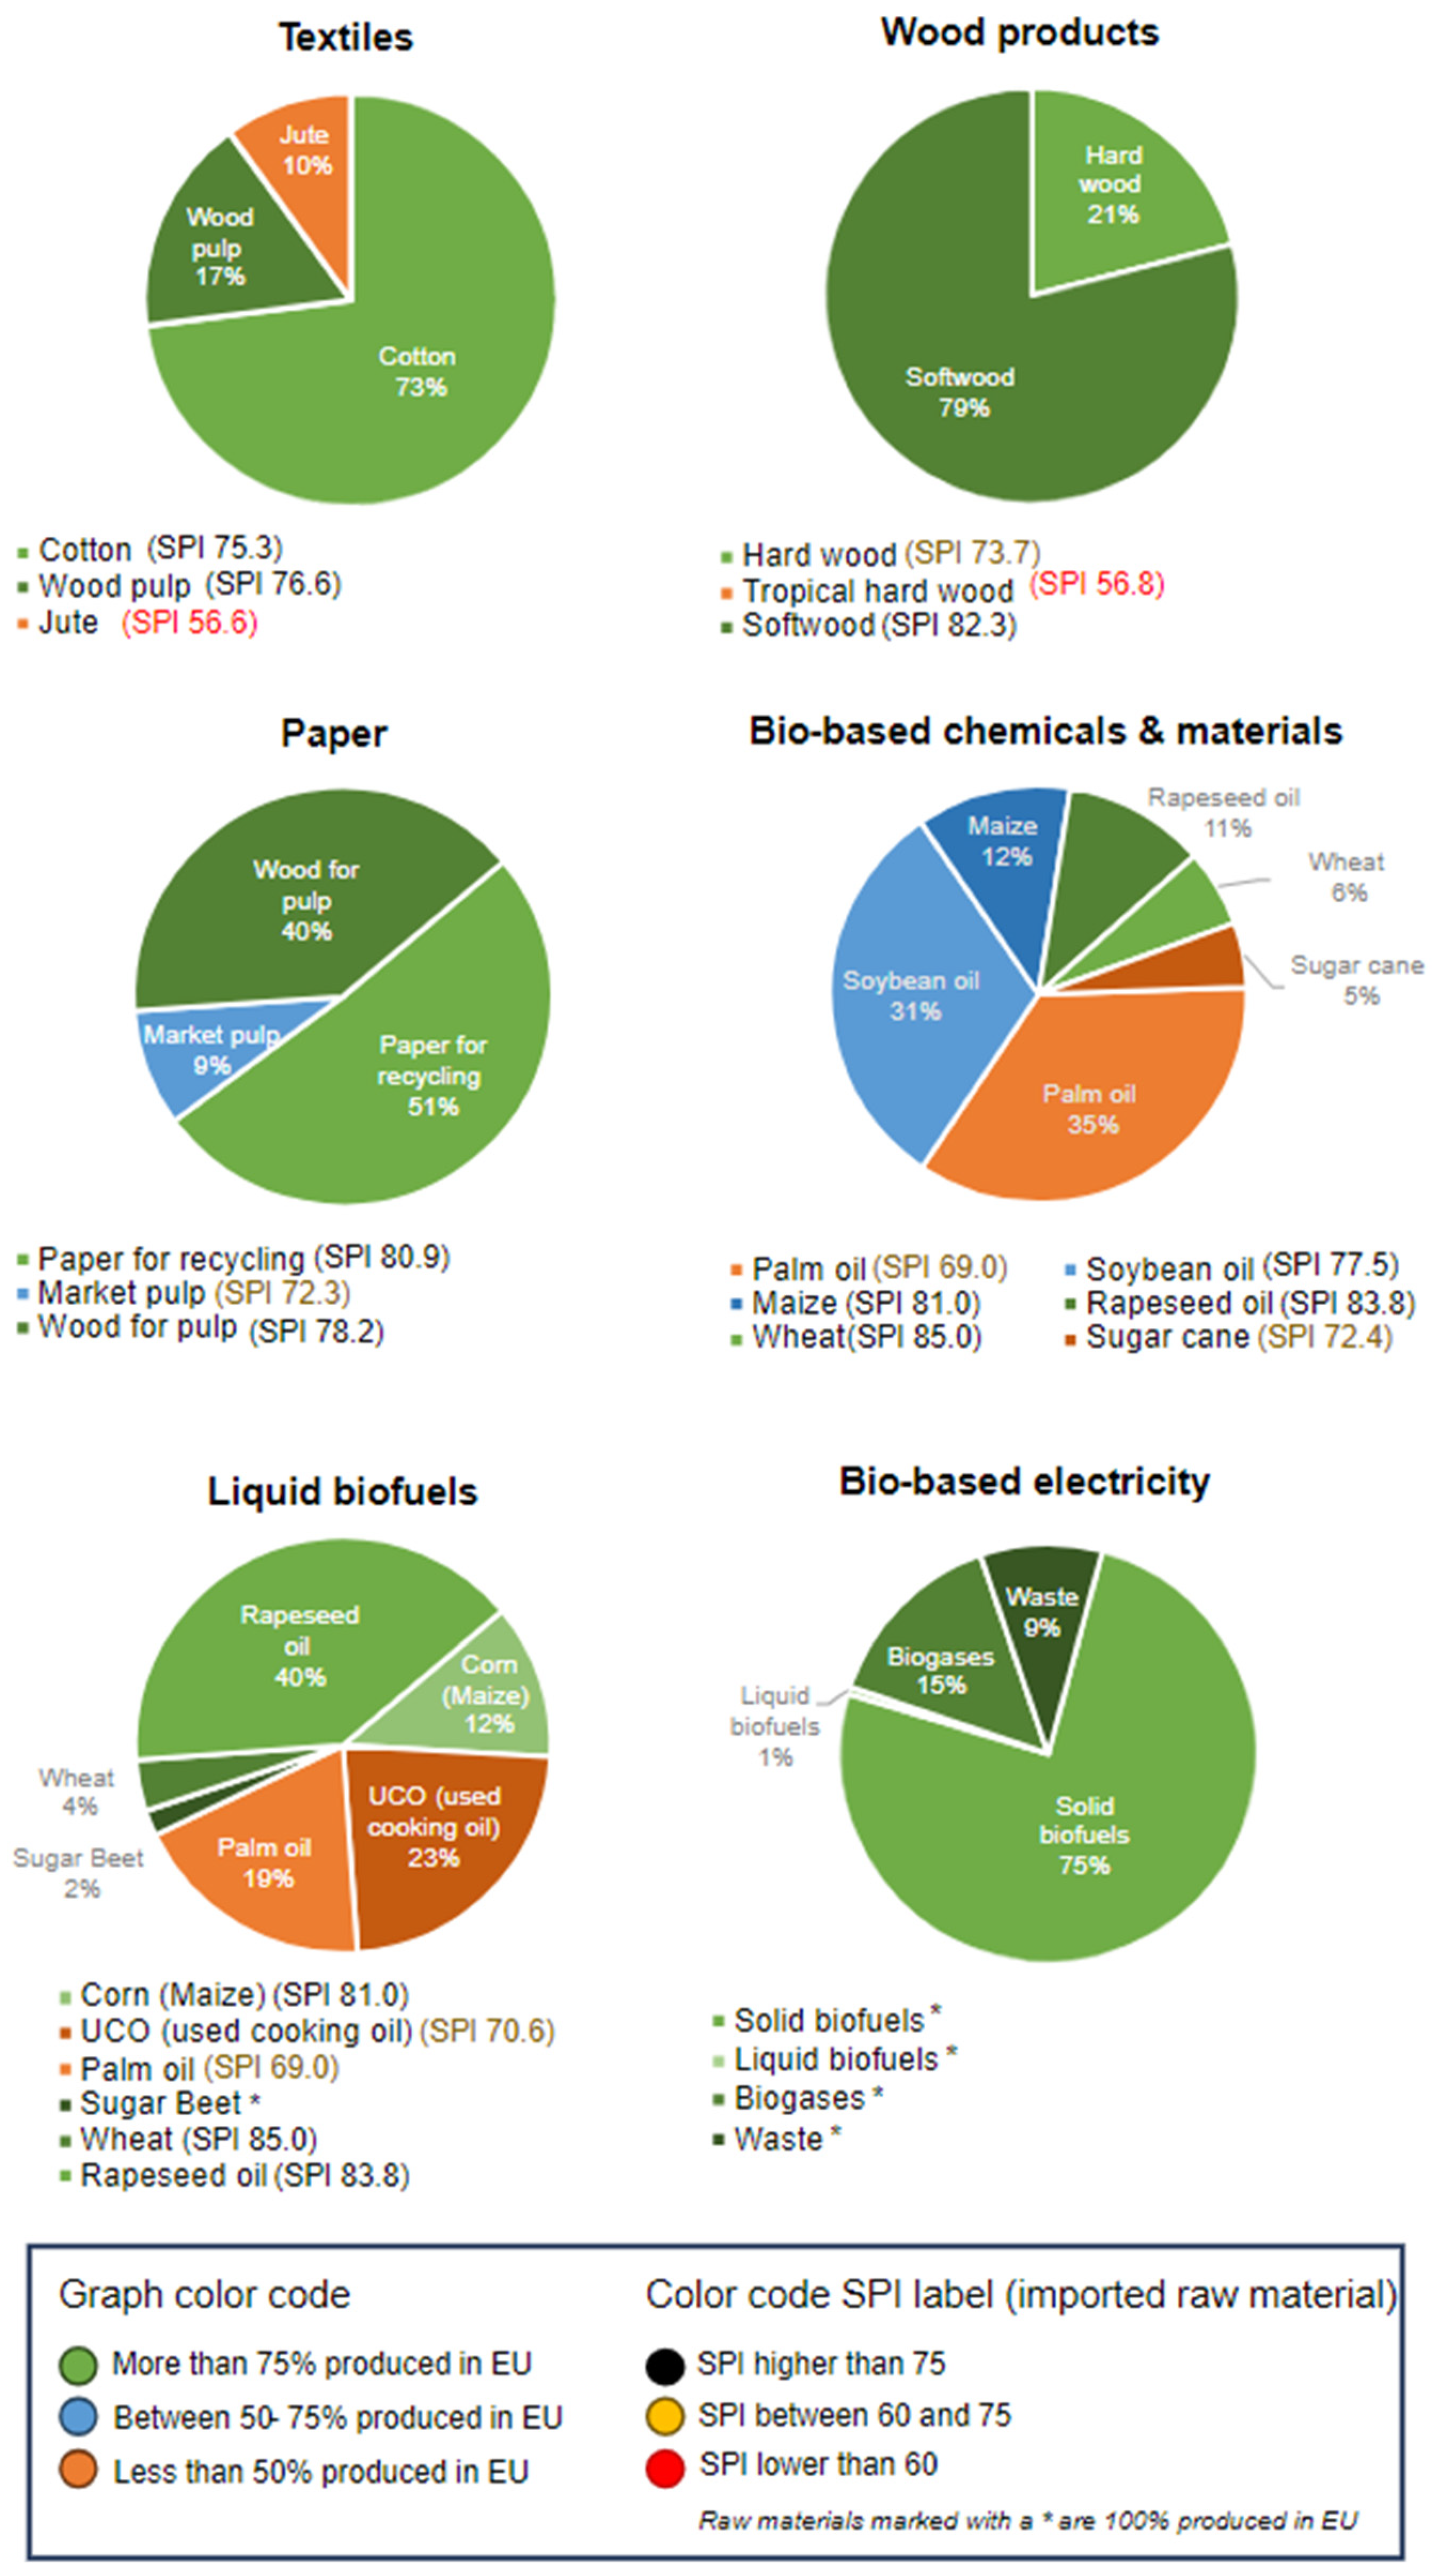
- Raw materials in the bio-based value chains and their origins.
- Effects from a social and environmental point of view.
- PVm is the value of the SPI, corresponding to the analyzed material, m, that has been produced exclusively within the EU.
- EUV is the average SPI value of the 27 EU members.
- P% is the percentage of production, within the EU, of the material m being analyzed in relation to the total available, which is the sum of the tonnes produced of that material and the tonnes imported into the EU (excluding internal trade).
- IVm is the value of the social index of the analyzed material, m, which has been consumed in the EU and which is imported.
- Ex,m is the quantity of the analyzed material, m, exported to the EU by one of the three main exporters, x.
- EVx is the value in the SPI of the exporting country, x.
- I%m is the percentage of importation of the material, m, which is being analyzed in relation to the total available (imports + internal production).
- CVm is the value of the SPI of the analyzed raw material, m, consumed in the EU.
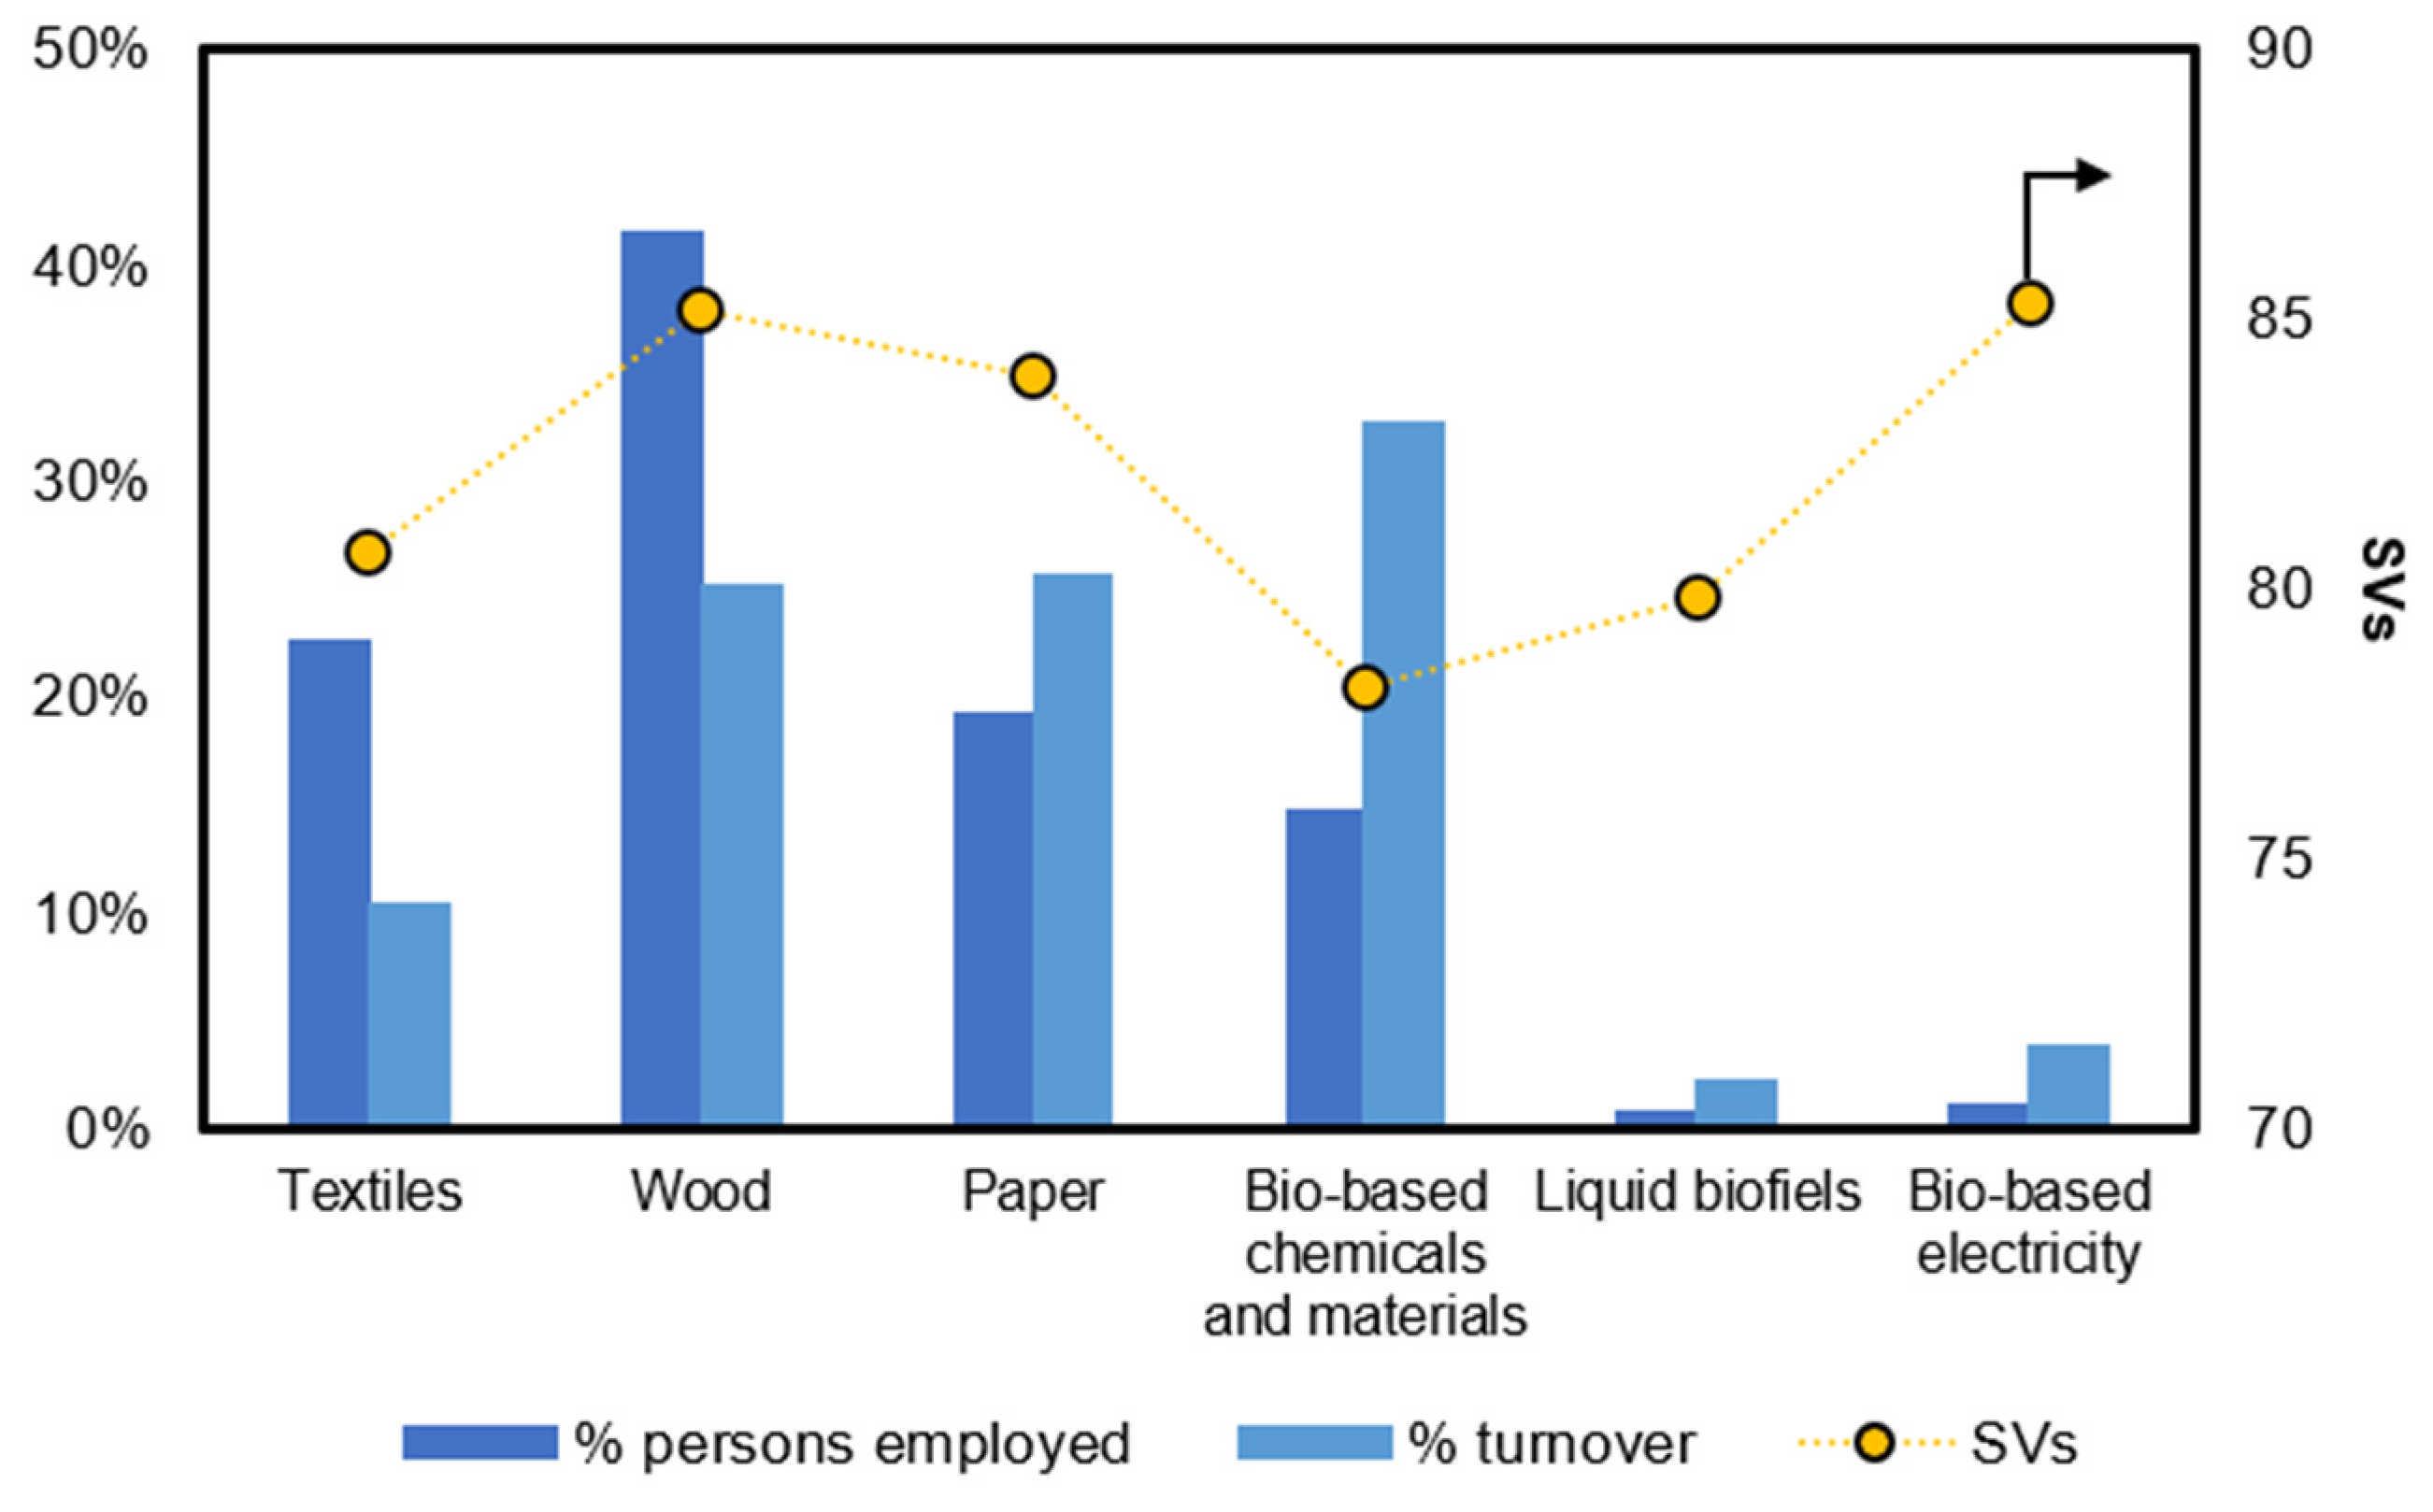
- SVs is the value of the SPI of the sector, s, under analysis.
- MS%m is the share of material m in the total bio-based sector studied, represented by the three main bio-based materials.
2.2. Methodology for Assessing the Potential for Bio-Based Products from Secondary Raw Materials
3. Analysis of the Current Situation of the Sectors That Make up the Bio-Based Economy
3.1. Sector: Textiles and Textile Products
3.2. Sector: Wood Products and Furniture
- Supporting rural areas by helping maintain employment and generating wealth.
- Contributing to the goal of a low-carbon bioeconomy through the carbon storage properties of wood and its fractions.
- Promoting sustainability through reusability and recyclability; for example, sawmill by-products like shavings and sawdust are transformed into wood-based panels.
- Enabling the repurposing of wood-based materials as energy sources at the end of their useful lives.
- Supply problems due to unaffordable prices resulting from competition with the (often subsidized) bioenergy industry and countries with low production costs.
- A labor shortage as a consequence of the aging workforce and the reluctance of young people to enter the sector.
- The widespread use of formaldehyde (classified as a carcinogenic compound)-based adhesives on wood panels such as fiberboards and plywood.
3.3. Paper and Paper Products
- Energy self-sufficiency.
- A significant reduction in net CO2 emissions by generating over half of its primary energy from biomass.
- A paper recycling rate exceeding 70%.
- High consumption of raw materials and energy, with high capital costs and long investment cycles.
- A decline in the consumption of some paper products as a result of digitization.
- An increase in exports, but tariff barriers and protectionist subsidies for rival goods create an uneven playing field.
- Supply issues arising from the growing demand for bioenergy companies.
- Economic disadvantages compared to other competitors due to rising energy prices.
3.4. Bio-Based Chemicals, Pharmaceuticals, Rubber, and Plastics
- Bio-based chemicals (excl. biofuels) (NACE Code 20)—8%.
- Bio-based pharmaceuticals (NACE Code 21)—49%.
- Rubber and bio-based plastics (NACE Code 22)—4%.
3.5. Liquid Biofuels
- Solid biofuels (fuelwood, wood residues, wood pellets, animal waste, vegetal material, etc.): this category comprises solid, non-fossil organic matter of biological origin (e.g., biomass) that can be used as fuel for heat or electricity production.
- Liquid biofuels (bio-gasoline, biodiesel, bio-jet kerosene, etc.): this group includes all liquid fuels produced from biomass and/or the biodegradable fraction of waste. These are suitable for blending with fossil-derived liquid fuels or replacing them.
- Biogases (from anaerobic fermentation and thermal processes): These gases are primarily composed of methane and carbon dioxide produced through the anaerobic digestion of biomass or thermal processes using biomass, including biomass from waste.
- First-generation biofuels: produced from primary food crops such as corn, sugarcane, palm oil, among others.
- Second-generation biofuels: produced from non-food crops, agricultural residues, the organic part of municipal solid waste, and forest and agricultural residues.
- Third-generation biofuels: biofuel production routes that are in the early stages of research and development or are significantly distant from commercialization (e.g., biofuels from algae, hydrogen from biomass, etc.).
3.6. Bio-Based Electricity
4. Potential for Bio-Based Products from “Secondary Raw Materials”
4.1. Biowaste Suitable as Raw Material
4.2. Potential of These Alternative Raw Materials in the EU Bioeconomy
5. Discussion
5.1. Reflections on the SVs, Employment, and Turnover
- Increase the production of raw materials within the EU.
- Substitute raw material suppliers with countries with a better SPI or foster actions to positively impact said countries in terms of socio-environmental aspects (see Figure 3), leading to the increase of their SPI and more fair living and working conditions in the raw material supply chains.
- Increase the proportion (MS%) of raw materials with better socio-environmental indicators.
- Substitute raw materials with lower associated SPI for raw materials with higher SPI values.
- Use biowaste as raw material and promote the development of novel, circular supply chains based on secondary raw materials, rather than virgin ones.
- For the particular case of UCO, favor the internally produced streams of this type of biowaste, which currently rely on imports of more than 50%.
- Paper: This sector has a high SV, as well as good employment and turnover figures, all this while presenting the highest bio-based product output.
- Wood products and furniture: As mentioned above, the wood products and furniture sector has the highest SV of all sectors, as well as very good figures in the socioeconomic parameters studied; however, its bio-based output share can be further increased.
- Textiles and textile products: Although this sector does not show poor results in terms of socioeconomic parameters, there is room for improvement in SV (impacted by a rather high raw material dependency), especially in the bio-based output share.
- Bio-based chemicals, pharmaceuticals, rubber, and plastics: Although, in socioeconomic terms, the sector shows very good figures, especially in terms of turnover, its SV and bio-based output share are rather low. This evidences a high dependency on the importation of raw materials, low circularity, and the dominance of fossil-based building blocks in most chemical formulations and production processes.
- Liquid biofuels: This sector has a very high bio-based product output share, but its SV and final contribution to the generation of employment and turnover in the EU is currently very low compared to the other sectors. Important to mention is the fact that the liquid transportation fuels sector is going through a transition in which electrification plays a major role in urban mobility and the biggest push for biofuels’ developments targets sectors that are difficult to decarbonize, such as aviation, heavy road transport (trucks), and marine transportation.
5.2. Reflections on the Use of Biowaste as a Raw Material
- Prioritize the reintegration of biowastes generated within the sector responsible for their production. For instance, whenever feasible, the textile sector should make use of its own generated textile waste and common sludges.
- Prioritize the utilization of wood waste in the wood and furniture products sector, given the limited variety of waste types that the sector can effectively employ.
- Prioritize the incorporation of biowaste as raw materials in sectors with a lower bio-based product output share and SV, such as the bio-based chemicals, pharmaceuticals, rubber, and plastics or textiles and textile products sectors.
6. Conclusions
- Paper.
- Wood products and furniture.
- Textiles and textile products.
- Bio-based chemicals, pharmaceuticals, rubber, and plastics.
- Liquid biofuels.
- Boost the production of the main raw materials in the EU or replace imported raw materials with others produced in the EU.
- Substitute current raw material suppliers with others from countries with better socio-environmental practices (translated from a higher SPI).
- Raise the share of raw materials with a higher SPI and/or replace lower-SPI raw materials with better alternatives.
- Utilize biowaste generated in the EU as raw materials in circular value chains.
- Emphasize the reintegration of biowaste within the sector responsible for its production.
- Prioritize the use of wood waste in the wood and furniture products sector.
- Prioritize the incorporation of biowaste as raw materials in sectors with a lower bio-based product output and poorer socio-environmental indicators (as represented by the SV in this study).
- Actively promote internal (EU) and global actions to improve the social and environmental aspects that impact the social progress index (SPI) of countries. This translates into better working, living, and environmental conditions to produce the needed raw materials.
- Demand-side policy barriers, in particular the lack of development in the promotion of bio-based products (incentives, taxation, market support, standards and product specifications, etc.).
- Stakeholder perception barriers as a result of the lack of stakeholder awareness of bio-based products, as well as a lack of communication about the benefits of bio-based products.
- Investment barriers due to factors such as the absence of visible tangible products, successful product outcomes, and lengthy return on investment periods, as well as various regulatory barriers.
Author Contributions
Funding
Institutional Review Board Statement
Informed Consent Statement
Data Availability Statement
Conflicts of Interest
References
- European Commission. Innovating for Sustainable Growth: A Bioeconomy for Europe; European Commission: Luxembourg, 2012. [Google Scholar]
- European Commission. EU Bioeconomy Strategy Progress Report; European Commission: Luxembourg, 2022. [Google Scholar]
- Social Progress Imperative Social Progress Index. Available online: https://www.socialprogress.org/global-index-2022overview/ (accessed on 5 July 2023).
- Deckers, J.; Manshoven, S.; Fogh, L. The Role of Bio-Based Textile Fibres in a Circular and Sustainable Textiles System; European Environment Agency: Copenhagen, Denmark, 2023.
- Textile Exchange. Preferred Fiber & Materials; Textile Exchange: Lamesa, TX, USA, 2022. [Google Scholar]
- CEPI. KEY STATISTICS 2022, European Pulp & Paper Industry; CEPI: Brussels, Belgium, 2023. [Google Scholar]
- Spekreijse, J.; Lammens, T.; Parisi, C.; Ronzon, T.; Vis, M. Insights into the European Market for Bio-Based Chemicals; Publications Office of the European Union: Luxembourg, 2019. [Google Scholar] [CrossRef]
- Porc, O.; Hark, N.; Carus, M.; Carrez, D. European Bioeconomy in Figures; nova-Institute for Ecology and Innovation: Hürth, Germany, 2022. [Google Scholar]
- Flach, B.; Lieberz, S.; Bolla, S. Biofuels Annual; USDA: Washington, DC, USA, 2022.
- FAOSTAT. FAOSTAT Database. Available online: https://www.fao.org/faostat/en/#data (accessed on 5 July 2023).
- JRC and the Nova-Institute Jobs and Wealth in the European Union Bioeconomy (Biomass Producing and Converting Sectors). Available online: https://datam.jrc.ec.europa.eu/datam/mashup/BIOECONOMICS/index.html (accessed on 4 July 2023).
- European Commission. List of NACE Codes. Available online: https://ec.europa.eu/competition/mergers/cases/index/nace_all.html (accessed on 18 September 2023).
- European Commission. Forest-Based Industries. Available online: https://single-market-economy.ec.europa.eu/sectors/raw-materials/related-industries/forest-based-industries_en (accessed on 1 August 2023).
- European Commission. Woodworking. Available online: https://single-market-economy.ec.europa.eu/sectors/raw-materials/related-industries/forest-based-industries/woodworking_en (accessed on 1 August 2023).
- Forest-Based Sector Technology Platform Woodworking Industry. Available online: https://www.forestplatform.org/about-the-sector/woodworking-and-furniture-industries/ (accessed on 1 August 2023).
- European Commission. Furniture Industry. Available online: https://single-market-economy.ec.europa.eu/sectors/raw-materials/related-industries/forest-based-industries/furniture-industry_en (accessed on 1 August 2023).
- European Commission. Pulp and Paper Industry. Available online: https://single-market-economy.ec.europa.eu/sectors/raw-materials/related-industries/forest-based-industries/pulp-and-paper-industry_en (accessed on 27 September 2023).
- arjowiggins—Recycled Papers Recycled Paper Manufacture. Available online: https://recycled-papers.co.uk/ (accessed on 2 August 2023).
- Van Ewijk, S.; Stegemann, J.A.; Ekins, P. Global Life Cycle Paper Flows, Recycling Metrics, and Material Efficiency. J. Ind. Ecol. 2018, 22, 686–693. [Google Scholar] [CrossRef]
- Nong, G.-z.; Xing, D.-y.; Li, Y.j.; Zhu, T.; Wu, J.-l.; Gan, W.-x.; Wang, S.-f.; Li, X.-r. Recycle Cooking Wood Chips with the Residue Liquid Removed out of Lignin by Calcification for Increasing Pulp Yield and Reducing Waste Water Discharge. J. Clean. Prod. 2020, 277, 124028. [Google Scholar] [CrossRef]
- Teng, S.; Khong, K.W.; Che Ha, N. Palm Oil and Its Environmental Impacts: A Big Data Analytics Study. J. Clean. Prod. 2020, 274, 122901. [Google Scholar] [CrossRef]
- Meijaard, E.; Brooks, T.M.; Carlson, K.M.; Slade, E.M.; Garcia-Ulloa, J.; Gaveau, D.L.; Huay Lee, J.S.; Santika, T.; Juffe-Bignoli, D.; Sheil, D.; et al. The Environmental Impacts of Palm Oil in Context. Nat. Plants 2020, 6, 1418–1426. [Google Scholar] [CrossRef] [PubMed]
- Carlson, K.M.; Garrett, R.D. Environmental Impacts of Tropical Soybean and Palm Oil Crops. In Oxford Research-Environmetal Science; Oxford University Press: Oxford, UK, 2018. [Google Scholar]
- Cheng, H.T. Key Sustainability Issues in the Palm Oil Sector: A Discussion Paper for Multi-Stakeholders Consultations (Commissioned by the World Bank Group); The World Bank: Washington, DC, USA, 2010. [Google Scholar]
- UNICEF. Palm Oil and Children in Indonesia Exploring the Sector’s Impact on Children’s Rights; UNICEF: New York, NY, USA, 2016. [Google Scholar]
- Eurostat Glossary: Biofuels. Available online: https://ec.europa.eu/eurostat/statistics-explained/index.php?title=Glossary:Biofuels (accessed on 7 August 2023).
- European Commission, Joint Research Centre, Institute for Energy and Transport, Sustainable Transport Unit; Marelli, L.; Padella, M.; Edwards, R.; Moro, A.; Kousoulidou, M.; Giuntoli, J.; Baxter, D.; Vorkapic, V.; Agosti, A. Directorate-General for Internal Policies Policy Department B: Structural and Cohesion Policies Transport and Tourism the Impact of Biofuels on Transport and The Environment, and Their Connection with Agricultural Development in Europe Study; Policy Department B: Structural and Cohesion Policies European Parliament: Brussels, Belgium, 2015. [Google Scholar]
- European Commission. Biofuels. Available online: https://energy.ec.europa.eu/topics/renewable-energy/bioenergy/biofuels_en (accessed on 7 August 2023).
- Duch Guillot, J. Biofuel: ¿Solución o Problema Añadido al Cambio Climático? European Parliament: Strasbourg, France, 2008. [Google Scholar]
- European Council Infographic—How Is EU Electricity Produced and Sold? Available online: https://www.consilium.europa.eu/en/infographics/how-is-eu-electricity-produced-and-sold/#:~:text=A%20sunburst%20chart%20showing%20the,Gas%3A19.6%25 (accessed on 19 September 2023).
- Statistics Canada Standard International Energy Product Classification (SIEC). Available online: https://www150.statcan.gc.ca/n1/pub/57-602-g/2015001/ann/anng-eng.htm (accessed on 12 December 2023).
- Eurostat Generation of Waste by Waste Category, Hazardousness and NACE. Available online: https://ec.europa.eu/eurostat/databrowser/view/ENV_WASGEN__custom_6493462/default/table?lang=en (accessed on 25 September 2023).
- Eurostat Treatment of Waste by Waste Category, Hazardousness and Waste Management Operations. Available online: https://ec.europa.eu/eurostat/databrowser/view/env_wastrt/default/table?lang=en (accessed on 22 January 2024).
- Kircher, M.; Aranda, E.; Athanasios, P.; Radojcic-Rednovnikov, I.; Romantschuk, M.; Ryberg, M.; Schock, G.; Shilev, S.; Stanescu, M.D.; Stankeviciute, J. Treatment and Valorization of Bio-Waste in the EU. EFB Bioecon. J. 2023, 3, 100051. [Google Scholar] [CrossRef]
- George, N.; Debroy, A.; Bhat, S.; Singh, S.; Bindal, S. Biowaste to Bioplastics: An Ecofriendly Approach for a Sustainable Future. J. Appl. Biotechnol. Rep. 2021, 8, 221–233. [Google Scholar] [CrossRef]
- Rahimi, M.; Rosman, M.; Husna, I.; Nurulannisa, A.; Amira, A.; Mohd, I.; Noor, S.; Alias, R.; Nur, N.; Nik, I.; et al. APS Proceedings Volume 3—Health & Lifestyle Innovation_Wast-Plas: An Innovation of Bioplastic from Paper & Fruit Waste for Various Applications; Academica Press Solutions: Washington, DC, USA, 2023; Volume 3, ISBN 9786299753612. [Google Scholar]
- Johannes, A.Z.; Pingak, R.K.; Sutaji, H.I.; Bukit, M. A Preliminary Study of Bioplastic Composites Based on Carbon Materials from Paper Waste and Corn Waste. J. Phys. Conf. Ser. 2021, 2017, 012004. [Google Scholar] [CrossRef]
- Bansal, N.; Tewari, R.; Soni, R.; Soni, S.K. Production of Cellulases from Aspergillus Niger NS-2 in Solid State Fermentation on Agricultural and Kitchen Waste Residues. Waste Manag. 2012, 32, 1341–1346. [Google Scholar] [CrossRef] [PubMed]
- Vea, E.B.; Romeo, D.; Thomsen, M. Biowaste Valorisation in a Future Circular Bioeconomy. Procedia CIRP 2018, 69, 591–596. [Google Scholar] [CrossRef]
- Espro, A.; Paone, E.; Mauriello, F.; Gotti, R.; Uliassi, E.; Laura Bolognesi, M.; Rodríguez-Padrón, D.; Lugue, R. Sustainable Production of Pharmaceutical, Nutraceutical and Bioactive Compounds from Biomass and Waste. Chem. Soc. Rev. 2021. [Google Scholar] [CrossRef]
- Madeddu, C.; Roda-Serrat, M.C.; Christensen, K.V.; Rime, B.E.; Massimiliano, E. A Biocascade Approach Towards the Recovery of High-Value Natural Products from Biowaste: State-of-Art and Future Trends. Waste Biomass Valorization 2020, 50, 11191–11207. [Google Scholar] [CrossRef]
- Cho, E.J.; Trinh, L.T.P.; Song, Y.; Lee, Y.G.; Bae, H.J. Bioconversion of Biomass Waste into High Value Chemicals. Bioresour. Technol. 2020, 298, 122386. [Google Scholar] [CrossRef] [PubMed]
- Tawfik, A.; Eraky, M.; Alhajeri, N.S.; Osman, A.I.; Rooney, D.W. Cultivation of Microalgae on Liquid Anaerobic Digestate for Depollution, Biofuels and Cosmetics: A Review. Environ. Chem. Lett. 2022, 20, 3631–3656. [Google Scholar] [CrossRef]
- Malhotra, M.; Aboudi, K.; Pisharody, L.; Singh, A.; Banu, J.R.; Bhatia, S.K.; Varjani, S.; Kumar, S.; González-Fernández, C.; Kumar, S.; et al. Biorefinery of Anaerobic Digestate in a Circular Bioeconomy: Opportunities, Challenges and Perspectives. Renew. Sustain. Energy Rev. 2022, 166, 112642. [Google Scholar] [CrossRef]
- Phruksaphithak, N.; Kaewnun, C.; Sompong, O.-T. Bacterial Cellulose Production and Applications. Eng. Health Stud. 2019, 13, 1–7. [Google Scholar]
- Kumar, V.; Pathak, P.; Bhardwaj, N.K. Waste Paper: An Underutilized but Promising Source for Nanocellulose Mining. Waste Manag. 2020, 102, 281–303. [Google Scholar] [CrossRef]
- Saravanan, A.; Karishma, S.; Senthil Kumar, P.; Rangasamy, G. A Review on Regeneration of Biowaste into Bio-Products and Bioenergy: Life Cycle Assessment and Circular Economy. Fuel 2023, 338, 127221. [Google Scholar] [CrossRef]
- Hussain, Z.; Sajjad, W.; Khan, T.; Wahid, F. Production of Bacterial Cellulose from Industrial Wastes: A Review. Cellulose 2019, 26, 2895–2911. [Google Scholar] [CrossRef]
- Forest Bio Facts Man-Made Bio-Based Fibre Products. Available online: https://forestbiofacts.com/man-made-bio-based-fibre-products/ (accessed on 25 September 2023).
- Lahiri, A.; Daniel, S.; Kanthapazham, R.; Vanaraj, R.; Thambidurai, A.; Peter, L.S. A Critical Review on Food Waste Management for the Production of Materials and Biofuel. J. Hazard. Mater. Adv. 2023, 10, 100266. [Google Scholar] [CrossRef]
- Swain, A.; Oraon, R.; Bauddh, K.; Kumar, M. Biowaste Valorization for Production of Bacterial Cellulose and Its Multifarious Applications Contributing to Environmental Sustainability. Environ. Sustain. 2022, 5, 51–63. [Google Scholar] [CrossRef]
- Choi, S.M.; Rao, K.M.; Zo, S.M.; Shin, E.J.; Han, S.S. Bacterial Cellulose and Its Applications. Polymers 2022, 14, 1080. [Google Scholar] [CrossRef]
- Pathak, S.; Saxena, P.; Ray, A.K.; Großmann, H.; Kleinert, R. Irradiation Based Clean and Energy Efficient Thermochemical Conversion of Biowaste into Paper. J. Clean. Prod. 2019, 233, 893–902. [Google Scholar] [CrossRef]
- Gonzalo, A.; Bimbela, F.; Sánchez, J.L.; Labidi, J.; Marín, F.; Arauzo, J. Evaluation of Different Agricultural Residues as Raw Materials for Pulp and Paper Production Using a Semichemical Process. J. Clean. Prod. 2017, 156, 184–193. [Google Scholar] [CrossRef]
- Kaur, D.; Bhardwaj, N.K.; Lohchab, R.K. Prospects of Rice Straw as a Raw Material for Paper Making. Waste Manag. 2017, 60, 127–139. [Google Scholar] [CrossRef]
- Vasudevan, P.; Sharma, S.; Kumar, A. Liquid Fuel from Biomass: An Overview; CSIR: New Delhi, India, 2005; Volume 64. [Google Scholar]
- Sarkar, N.; Ghosh, S.K.; Bannerjee, S.; Aikat, K. Bioethanol Production from Agricultural Wastes: An Overview. Renew. Energy 2012, 37, 19–27. [Google Scholar] [CrossRef]
- Pietarinen, S.P.; Willför, S.M.; Ahotupa, M.O.; Hemming, J.E.; Holmbom, B.R. Knotwood and Bark Extracts: Strong Antioxidants from Waste Materials. J. Wood Sci. 2006, 52, 436–444. [Google Scholar] [CrossRef]
- Adegoke, K.A.; Adesina, O.O.; Okon-Akan, O.A.; Adegoke, O.R.; Olabintan, A.B.; Ajala, O.A.; Olagoke, H.; Maxakato, N.W.; Bello, O.S. Sawdust-Biomass Based Materials for Sequestration of Organic and Inorganic Pollutants and Potential for Engineering Applications. Curr. Res. Green. Sustain. Chem. 2022, 5, 100274. [Google Scholar] [CrossRef]
- Mallakpour, S.; Sirous, F.; Hussain, C.M. Sawdust, a Versatile, Inexpensive, Readily Available Bio-Waste: From Mother Earth to Valuable Materials for Sustainable Remediation Technologies. Adv. Colloid. Interface Sci. 2021, 295, 102492. [Google Scholar] [CrossRef] [PubMed]
- Yadav, K.R.; Sharma, R.K.; Kothari, R.M. Bioconversion of Eucalyptus Bark Waste into Soil Conditioner. Bioresour. Technol. 2002, 81, 163–165. [Google Scholar] [CrossRef] [PubMed]
- Wenig, C.; Dunlop, J.W.C.; Hehemeyer-Cürten, J.; Reppe, F.J.; Horbelt, N.; Krauthausen, K.; Fratzl, P.; Eder, M. Advanced Materials Design Based on Waste Wood and Bark. Philos. Trans. R. Soc. A Math. Phys. Eng. Sci. 2021, 379, 20200345. [Google Scholar] [CrossRef] [PubMed]
- M’Hamdi, A.I.; Kandri, N.I.; Zerouale, A.; Blumberga, D.; Gusca, J. Life Cycle Assessment of Paper Production from Treated Wood. Energy Procedia 2017, 128, 461–468. [Google Scholar] [CrossRef]
- Haile, A.; Gelebo, G.G.; Tesfaye, T.; Mengie, W.; Mebrate, M.A.; Abuhay, A.; Limeneh, D.Y. Pulp and Paper Mill Wastes: Utilizations and Prospects for High Value-Added Biomaterials. Bioresour. Bioprocess. 2021, 8, 35. [Google Scholar] [CrossRef]
- Garcia, C.A.; Hora, G. State-of-the-Art of Waste Wood Supply Chain in Germany and Selected European Countries. Waste Manag. 2017, 70, 189–197. [Google Scholar] [CrossRef] [PubMed]
- Mohan, D.; Charles, U.; Pittman, J.R.; Steele, P. Pyrolysis of Wood/Biomass for Bio-Oil: A Critical Review. Energy Fuels 2006, 20, 848–889. [Google Scholar] [CrossRef]
- Safarian, S.; Unnthorsson, R. An Assessment of the Sustainability of Lignocellulosic Bioethanol Production from Wastes in Iceland. Energies 2018, 11, 1493. [Google Scholar] [CrossRef]
- Aryal, P.; Ahmad, W.; Dwivedi, S.; Asadi, N.; Tanksale, A. Syngas Production from Wood and Cardboard Waste. In Advances in Synthesis Gas: Methods, Technologies and Applications; Elsevier: Amsterdam, The Netherlands, 2023; Volume 1, pp. 411–438. [Google Scholar] [CrossRef]
- Al-Battashi, H.; Annamalai, N.; Al-Kindi, S.; Nair, A.S.; Al-Bahry, S.; Verma, J.P.; Sivakumar, N. Production of Bioplastic (Poly-3-Hydroxybutyrate) Using Waste Paper as a Feedstock: Optimization of Enzymatic Hydrolysis and Fermentation Employing Burkholderia Sacchari. J. Clean. Prod. 2019, 214, 236–247. [Google Scholar] [CrossRef]
- Liu, S.; Cui, R.; Ma, Y.; Yu, Q.; Kannegulla, A.; Wu, B.; Fan, H.; Wang, A.X.; Kong, X. Plasmonic Cellulose Textile Fiber from Waste Paper for BPA Sensing by SERS. Spectrochim. Acta A Mol. Biomol. Spectrosc. 2020, 227, 117664. [Google Scholar] [CrossRef]
- Ma, Y.; Hummel, M.; Määttänen, M.; Särkilahti, A.; Harlin, A.; Sixta, H. Upcycling of Waste Paper and Cardboard to Textiles. Green Chem. 2016, 18, 858–866. [Google Scholar] [CrossRef]
- Subhedar, P.B.; Gogate, P.R. Ultrasound-Assisted Bioethanol Production from Waste Newspaper. Ultrason. Sonochem. 2015, 27, 37–45. [Google Scholar] [CrossRef]
- Ravindran, R.; Jaiswal, A.K. Exploitation of Food Industry Waste for High-Value Products. Trends Biotechnol. 2016, 34, 58–69. [Google Scholar] [CrossRef]
- Attia, N.K.; El-Mekkawi, S.A.; Elardy, O.A.; Abdelkader, E.A. Chemical and Rheological Assessment of Produced Biolubricants from Different Vegetable Oils. Fuel 2020, 271, 117578. [Google Scholar] [CrossRef]
- Mahro, B.; Timm, M. Potential of Biowaste from the Food Industry as a Biomass Resource. Eng. Life Sci. 2007, 7, 457–468. [Google Scholar] [CrossRef]
- Singh, D.; Sharma, D.; Soni, S.L.; Inda, C.S.; Sharma, S.; Sharma, P.K.; Jhalani, A. A Comprehensive Review of Biodiesel Production from Waste Cooking Oil and Its Use as Fuel in Compression Ignition Engines: 3rd Generation Cleaner Feedstock. J. Clean. Prod. 2021, 307, 127299. [Google Scholar] [CrossRef]
- Sharma, A.; Kodgire, P.; Kachhwaha, S.S. Biodiesel Production from Waste Cotton-Seed Cooking Oil Using Microwave-Assisted Transesterification: Optimization and Kinetic Modeling. Renew. Sustain. Energy Rev. 2019, 116, 109394. [Google Scholar] [CrossRef]
- Hafid, H.S.; Rahman, N.A.A.; Shah, U.K.M.; Baharuddin, A.S.; Ariff, A.B. Feasibility of Using Kitchen Waste as Future Substrate for Bioethanol Production: A Review. Renew. Sustain. Energy Rev. 2017, 74, 671–686. [Google Scholar] [CrossRef]
- Ku Marsilla, K.I.; Alias, S.A.; Alias, N.F. Potential Biodegradable Product from Dewatered Sludge. In Microbial Fuel Cell (MFC) Applications for Sludge Valorization; Springer: Singapore, 2023. [Google Scholar]
- Vasudevan, M.; Natarajan, N. Towards Achieving Sustainable Bioplastics Production and Nutrient Recovery from Wastewater—A Comprehensive Overview on Polyhydroxybutyrate. Biomass Convers. Biorefin. 2022. [Google Scholar] [CrossRef]
- Liu, F.; Li, J.; Zhang, X.L. Bioplastic Production from Wastewater Sludge and Application. Proc. IOP Conf. Ser. Earth Environ. Sci. Inst. Phys. Publ. 2019, 344, 012071. [Google Scholar] [CrossRef]
- Cecconet, D.; Capodaglio, A.G. Sewage Sludge Biorefinery for Circular Economy. Sustainability 2022, 14, 14841. [Google Scholar] [CrossRef]
- Cucina, M.; De Nisi, P.; Sordi, S.; Adani, F. Sewage Sludge as N-Fertilizers for Crop Production Enabling the Circular Bioeconomy in Agriculture: A Challenge for the New EU Regulation 1009/2019. Sustainability 2021, 13, 13165. [Google Scholar] [CrossRef]
- Awasthi, M.K.; Sarsaiya, S.; Wainaina, S.; Rajendran, K.; Kumar, S.; Quan, W.; Duan, Y.; Awasthi, S.K.; Chen, H.; Pandey, A.; et al. A Critical Review of Organic Manure Biorefinery Models toward Sustainable Circular Bioeconomy: Technological Challenges, Advancements, Innovations, and Future Perspectives. Renew. Sustain. Energy Rev. 2019, 111, 115–131. [Google Scholar] [CrossRef]
- Abdallah, A.M.; Ugolini, F.; Baronti, S.; Maienza, A.; Ungaro, F.; Camilli, F. Assessment of Two Sheep Wool Residues from Textile Industry as Organic Fertilizer in Sunflower and Maize Cultivation. J. Soil Sci. Plant Nutr. 2019, 19, 793–807. [Google Scholar] [CrossRef]
- Hanoğlu, A.; Çay, A.; Yanık, J. Production of Biochars from Textile Fibres through Torrefaction and Their Characterisation. Energy 2019, 166, 664–673. [Google Scholar] [CrossRef]
- Çay, A.; Yanık, J.; Akduman, Ç.; Duman, G.; Ertaş, H. Application of Textile Waste Derived Biochars onto Cotton Fabric for Improved Performance and Functional Properties. J. Clean. Prod. 2020, 251, 119664. [Google Scholar] [CrossRef]
- Homem, N.C.; Amorim, M.T.P. Synthesis of Cellulose Acetate Using as Raw Material Textile Wastes. Mater. Today Proc. 2020, 31, S315–S317. [Google Scholar] [CrossRef]
- Khandaker, S.; Bashar, M.M.; Islam, A.; Hossain, M.T.; Teo, S.H.; Awual, M.R. Sustainable Energy Generation from Textile Biowaste and Its Challenges: A Comprehensive Review. Renew. Sustain. Energy Rev. 2022, 157, 112051. [Google Scholar] [CrossRef]
- Yousef, S.; Eimontas, J.; Striūgas, N.; Tatariants, M.; Abdelnaby, M.A.; Tuckute, S.; Kliucininkas, L. A Sustainable Bioenergy Conversion Strategy for Textile Waste with Self-Catalysts Using Mini-Pyrolysis Plant. Energy Convers. Manag. 2019, 196, 688–704. [Google Scholar] [CrossRef]
- Lee, H.S.; Jung, S.; Lin, K.Y.A.; Kwon, E.E.; Lee, J. Upcycling Textile Waste Using Pyrolysis Process. Sci. Total Environ. 2023, 859, 160393. [Google Scholar] [CrossRef] [PubMed]
- Eriksen, M.H.; Damgaard, C.K.; Christensen, L.H.; McKinnon, D.; Kleveland, K.; Ouacha, M.; Doverfelt, S.; Merta, E.; Arnold, M. Barriers for Utilisation of Biowaste; TemaNord; Nordic Council of Ministers: Copenhagen, Denmark, 2017; ISBN 9789289349062. [Google Scholar]
- European Environment Agency. Bio-Waste in Europe-Turning Challenges into Opportunities; Publications Office of the European Union: Luxembourg, 2020. [CrossRef]
- Vilaboa Díaz, A.; Francisco López, A.; Bello Bugallo, P.M. Analysis of Biowaste-Based Materials in the Construction Sector: Evaluation of Thermal Behaviour and Life Cycle Assessment (LCA). Waste Biomass Valorization 2022, 13, 4983–5004. [Google Scholar] [CrossRef]
- Scialpi, G.; Perrotti, D. The Use of Urban Biowaste and Excavated Soil in the Construction Sector: A Literature Review. Waste Manag. Res. 2022, 40, 262–273. [Google Scholar] [CrossRef]
- NNFCC. Needs and Challenges of Companies in the Bioeconomy in NW Europe; NNFCC: London, UK, 2021. [Google Scholar]
- PlascticsEurope. Plastics—The Facts 2021 an Analysis of European Plastics Production, Demand and Waste Data; PlascticsEurope: Brussels, Belgium, 2021. [Google Scholar]
- European-Bioplastics. Bioplastics Market Data. Available online: https://www.european-bioplastics.org/market/ (accessed on 8 November 2023).
- Pekakis, P.; Tsouti, C.; Valta, K.; Zambrana Vasquez, D.A.; Pérez Alonso, M.; Vaskan, P.; del Busto, F.; Andrikopoulos, P. D1.4: Report on Barriers for Urban Biowaste Valorisation for Biobased Products (State of Play) WP1-Identification of Opportunities and Barriers to Utilisation of Urban Biowaste Sources; European Union: Geneva, Switzerland, 2023. [Google Scholar]
- Almeida, P.V.; Gando-Ferreira, L.M.; Quina, M.J. Biorefinery Perspective for Industrial Potato Peel Management: Technology Readiness Level and Economic Assessment. J. Environ. Chem. Eng. 2023, 11, 110049. [Google Scholar] [CrossRef]
- Ranjbari, M.; Shams Esfandabadi, Z.; Quatraro, F.; Vatanparast, H.; Lam, S.S.; Aghbashlo, M.; Tabatabaei, M. Biomass and Organic Waste Potentials towards Implementing Circular Bioeconomy Platforms: A Systematic Bibliometric Analysis. Fuel 2022, 318, 123585. [Google Scholar] [CrossRef]
- Wojnowska-Baryła, I.; Kulikowska, D.; Bernat, K. Effect of Bio-Based Products on Waste Management. Sustainability 2020, 12, 2088. [Google Scholar] [CrossRef]
- De Jong, E.; Visser, H.A.; Dias, A.S.; Harvey, C.; Gruter, G.J.M. The Road to Bring FDCA and PEF to the Market. Polymers 2022, 14, 943. [Google Scholar] [CrossRef] [PubMed]
- Celep, G.; Tetik, G.D.; Yilmaz, F. Limitations of Textile Recycling: The Reason behind the Development of Alternative Sustainable Fibers. In Next-Generation Textiles; InTech Open: London, UK, 2022. [Google Scholar]
- Bigio, T.; Marziparo, G. The Newest Bio-Based Composites Are Made from Your Garbage. Reinforced Plastics 2022, 66, 100715. [Google Scholar] [CrossRef]
- de Vries, J.G. Industrial Implementation of Chemical Biomass Conversion. Curr. Opin. Green Sustain. Chem. 2023, 39. [Google Scholar] [CrossRef]
- Mascal, M. 5-(Chloromethyl)Furfural (CMF): A Platform for Transforming Cellulose into Commercial Products. ACS Sustain. Chem. 2019, 7, 5588–5601. [Google Scholar] [CrossRef]
- Neto, A.C.; Guimarães, M.J.O.C.; Freire, E. Business Models for Commercial Scale Second-Generation Bioethanol Production. J. Clean. Prod. 2018, 184, 168–178. [Google Scholar] [CrossRef]


| Title | Source Type | Application | Year | Source |
|---|---|---|---|---|
| The Role of Bio-Based Textile Fibres in a Circular and Sustainable Textiles System | Report | Textile sector | 2023 | [4] |
| Preferred Fiber & Materials | Report | Textile sector | 2022 | [5] |
| Key Statistic 2022, European Pulp & Paper Industry | Booklet | Pulp and paper | 2023 | [6] |
| Insights into the European Market for Bio-Based Chemicals | Report | Chemical sector | 2019 | [7] |
| European Bioeconomy in Figures 2008–2019 | Report | Chemical sector | 2022 | [8] |
| European Union: Biofuels Annual | Report | Liquid biofuels sector | 2022 | [9] |
| FAOSTAT | Database | Production and trade, all sectors | - | [10] |
| Social Progress Index | Database | Social and environmental situation, all sectors | 2022 | [3] |
| Jobs and Wealth in the European Union Bioeconomy | Database | Employment, turnover, and bio-based share, all sectors | 2020 | [11] |
| Raw Material | Top Three Non-EU Exporters [10] | Export Share [10] | EVx 1 [3] | Averaged SPI per Raw Material | I%/P% 2 | IVm 3 | PVm 3 | CVm 4 | MS% 5 | SVs 6 |
|---|---|---|---|---|---|---|---|---|---|---|
| Cotton | USA | 47% | 84.65 | 75.33 | 21%/79% | 15.76 | 67.45 | 83.21 | 73% | 80.66 |
| Brazil | 32% | 71.26 | ||||||||
| India | 21% | 60.19 | ||||||||
| Wood pulp | Brazil | 55% | 71.26 | 76.62 | 20%/80% | 15.32 | 68.23 | 83.56 | 17% | |
| USA | 29% | 84.65 | ||||||||
| Uruguay | 16% | 80.27 | ||||||||
| Jute | Bangladesh | 78% | 56.06 | 56.65 | 100%/0% | 56.65 | - | 56.65 | 10% | |
| India | 16% | 60.19 | ||||||||
| URT | 6% | 54.87 |
| Employment, 2020 | Turnover (Million EUR), 2020 | Bio-Based Output Share, 2020 | Turnover (EUR) per Person Employed | |
|---|---|---|---|---|
| Bio-based textiles | 210,968.49 | 26,370.43 | 39.20% | 124,997.01 |
| Bio-based wearing apparel | 318,122.40 | 23,845.14 | 39.80% | 74,955.87 |
| Leather | 194,722.99 | 21,870.28 | 50.40% | 112,314.83 |
| Total | 723,813.88 (sum) | 72,085.85 (sum) | 42% (average) | 99,591.69 (average) |
| Raw Material | Top Three Non-EU Exporters [10] | Export Share [10] | EVx [3] | Averaged SPI per Raw Material | I%/P% | IVm | PVm | CVm | MS% | SVs |
|---|---|---|---|---|---|---|---|---|---|---|
| Hardwood | Russia | 74% | 71.99 | 73.69 | 10%/90% | 7.26 | 76.89 | 84.15 | 21% | 85.17 |
| USA | 14% | 84.65 | ||||||||
| Belarus | 12% | 71.49 | ||||||||
| Tropical hardwood | Papua New Guinea | 39% | 48.12 | 56.79 | 100%/0% | 56.79 | - | 56.79 | 0% | |
| Brazil | 32% | 71.26 | ||||||||
| Solomon Islands | 29% | 52.40 | ||||||||
| Softwood | Norway | 55% | 90.74 | 82.29 | 3%/97% | 2.73 | 82.73 | 85.46 | 79% | |
| Russia | 27% | 71.99 | ||||||||
| Belarus | 18% | 71.49 |
| Employment, 2020 | Turnover (Million EUR), 2020 | Bio-Based Output Share, 2020 | Turnover (EUR) per Person Employed | |
|---|---|---|---|---|
| Wood products | 907,712.22 | 131,359.05 | 100% | 144,714.42 |
| Wooden furniture | 419,396.72 | 42,132.23 | 45.60% | 100,459.13 |
| Total | 1,327,108.94 (sum) | 173,491.28 (sum) | 72.40% (average) | 130,728.74 (average) |
| Raw Material | Consumption | Production | Imports | Exports |
|---|---|---|---|---|
| Integrated pulp | 20.55 | 20.55 | - | - |
| Market pulp | 16.86 | 14.70 | 7.48 | 5.32 |
| Paper for recycling | 47.49 | 52.63 | 2.01 | 7.15 |
| Non-fibrous materials | 11.74 | 11.74 | - | - |
| Total | 96.63 | 99.61 | 9.50 | 12.48 |
| Raw Material | Top Three Non-EU Exporters [10] | Export Share [10] | EVx [3] | Averaged SPI per Raw Material | I%/P% | IVm | PVm | CVm | MS% | SVs | ||
|---|---|---|---|---|---|---|---|---|---|---|---|---|
| Paper for recycling | Other Europe | 85% | 80.23 | 80.87 | 4%/96% | 2.96 | 82.17 | 85.13 | 51% | 83.97 | ||
| North America | 15% | 85.01 | ||||||||||
| Asia | 1% | 66.33 | ||||||||||
| Pulp | Imported Pulp | Latin America | 77% | 69 | 72.31 | 21% | 79% | 15.38 | 67.38 | 82.77 | 49% | |
| North America | 16% | 85.01 | ||||||||||
| Other Europe | 7% | 80.23 | ||||||||||
| Pulp from imported wood | Other Europe | 77% | 80.23 | 78.21 | ||||||||
| Brazil | 12% | 71.26 | ||||||||||
| Russia | 11% | 71.99 | ||||||||||
| Employment, 2020 | Turnover (Million EUR), 2020 | Bio-Based Output Share, 2020 | Turnover (EUR) per Person Employed | |
|---|---|---|---|---|
| Total | 616,636.50 (sum) | 177,034.35 (sum) | 99.50% (average) | 287,096.77 (average) |
| Raw Material | Top Three Non-EU Exporters [10] | Export Share [10] | EVx [3] | Averaged SPI per Raw Material | I%/P% | IVm | PVm | CVm | MS% | SVs | |
|---|---|---|---|---|---|---|---|---|---|---|---|
| Veg. oil | Palm oil | Indonesia | 64% | 66.67 | 69.06 | 100%/0% | 69.06 | - | 69.0 | 35% | 78.18 |
| Malaysia | 34% | 74.08 | |||||||||
| Guatemala | 2% | 60.21 | |||||||||
| Soya bean oil | Argentina | 67% | 78.64 | 77.53 | 28%/72% | 21.71 | 61.41 | 83.12 | 31% | ||
| Brazil | 23% | 71.26 | |||||||||
| USA | 10% | 84.65 | |||||||||
| Rapeseed oil | Canada | 73% | 88.17 | 83.83 | 24%/76% | 20.12 | 64.82 | 84.94 | 11% | ||
| Russia | 19% | 71.99 | |||||||||
| Belarus | 8% | 71.49 | |||||||||
| Sugar/starch | Maize | USA | 53% | 84.65 | 81.01 | 35%/65% | 28.35 | 55.44 | 83.79 | 12% | |
| Argentina | 28% | 78.64 | |||||||||
| Ukraine | 19% | 74.17 | |||||||||
| Wheat | Canada | 63% | 88.17 | 84.96 | 20%/80% | 16.99 | 68.23 | 85.22 | 6% | ||
| Russia | 20% | 71.99 | |||||||||
| Australia | 17% | 87.83 | |||||||||
| Sugarcane | Brazil | 82% | 71.26 | 72.41 | 100%/0% | 72.41 | - | 72.41 | 5% | ||
| Thailand | 10% | 69.8 | |||||||||
| Australia | 8% | 87.83 |
| Employment, 2020 | Turnover (Million EUR), 2020 | Bio-Based Output Share, 2020 | Turnover (EUR) per Person Employed | |
|---|---|---|---|---|
| Bio-based chemicals | 97,803.43 | 38,248.83 | 8% | 391,078.62 |
| Bio-based pharmaceuticals | 314,632.65 | 176,993.44 | 49% | 562,539.97 |
| Rubber and bio-based plastics | 60,510.42 | 10,864.27 | 4% | 179,543.79 |
| Total | 472,946.50 (sum) | 226,106.54 (sum) | 17% (average) | 391,078.62 (average) |
| Raw Material | Top Three Non-EU Exporters [10] | Export Share [10] | EVx [3] | Averaged SPI per Raw Material | I%/P% | IVm | PVm | CVm | MS% | SVs | |
|---|---|---|---|---|---|---|---|---|---|---|---|
| Bioethanol | Sugar beet | - | - | 0%/100% | 0 | 85.29 | 85.29 | 2% | 79.86 | ||
| Wheat | Canada | 63% | 88.17 | 84.96 | 4%/96% | 3.11 | 82.17 | 85.28 | 4% | ||
| Russia | 20% | 71.99 | |||||||||
| Australia | 17% | 87.83 | |||||||||
| Corn | USA | 53% | 84.65 | 81.01 | 19%/81% | 15.40 | 69.08 | 84.48 | 12% | ||
| Argentina | 28% | 78.64 | |||||||||
| Ukraine | 19% | 74.17 | |||||||||
| Biodiesel | Rapeseed oil | Canada | 73% | 88.17 | 83.83 | 5%/95% | 3.85 | 81.37 | 85.22 | 40% | |
| Russia | 19% | 71.99 | |||||||||
| Belarus | 8% | 71.49 | |||||||||
| UCO | China | 52% | 65.74 | 70.59 | 65%/35% | 46.19 | 29.47 | 75.67 | 23% | ||
| Indonesia + Malaysia | 29% | 70.375 | |||||||||
| US | 18% | 84.65 | |||||||||
| Palm oil | Indonesia | 64% | 66.67 | 69.06 | 100%/0% | 69.06 | - | 69.06 | 19% | ||
| Malaysia | 34% | 74.08 | |||||||||
| Guatemala | 2% | 60.21 |
| Employment, 2020 | Turnover (Million EUR), 2020 | Sectoral Bio-Based Output Share, 2020 | Turnover (EUR) per Person Employed | |
|---|---|---|---|---|
| Bioethanol | 10,836.18 | 7214.68 | 5.20% | 665,795.51 |
| Biodiesel | 15,742.61 | 7908.81 | 12.50% | 502,382.39 |
| Total | 26,578.79 (sum) | 15,123.49 (sum) | - | 569,005.96 (average) |
| Section | Division | Group | Class | Product |
|---|---|---|---|---|
| 5 | Biofuels | |||
| 51 | Solid biofuels | |||
| 511 | Fuelwood, wood residues, and by-products | |||
| 5111 | Wood pellets | |||
| 5119 | Other fuelwood, wood residues, and by-products | |||
| 512 | 5120 | Bagasse | ||
| 513 | 5130 | Animal waste | ||
| 514 | 5140 | Black liquor | ||
| 515 | 5150 | Other vegetal material and residues | ||
| 516 | 5160 | Charcoal | ||
| 52 | Liquid biofuels | |||
| 521 | 5210 | Bio-gasoline | ||
| 522 | 5220 | Bio-diesels | ||
| 523 | 5230 | Bio-jet kerosene | ||
| 529 | 5290 | Other liquid biofuels | ||
| 53 | Biogases | |||
| 531 | Biogases from anaerobic fermentation | |||
| 5311 | Landfill gas | |||
| 5312 | Sewage sludge gas | |||
| 5319 | Other biogases from anaerobic fermentation | |||
| 532 | 5320 | Biogases from thermal processes | ||
| 6 | Waste | |||
| 61 | 610 | 6100 | Industrial waste | |
| 62 | 620 | 6200 | Municipal waste |
| Employment, 2020 | Turnover (Million EUR), 2020 | Sectoral Bio-Based Output Share, 2020 | Turnover (EUR) per Person Employed | |
|---|---|---|---|---|
| Bio-based electricity | 36,716 (sum) | 690,629 (average) | - | 215,565 (average) |
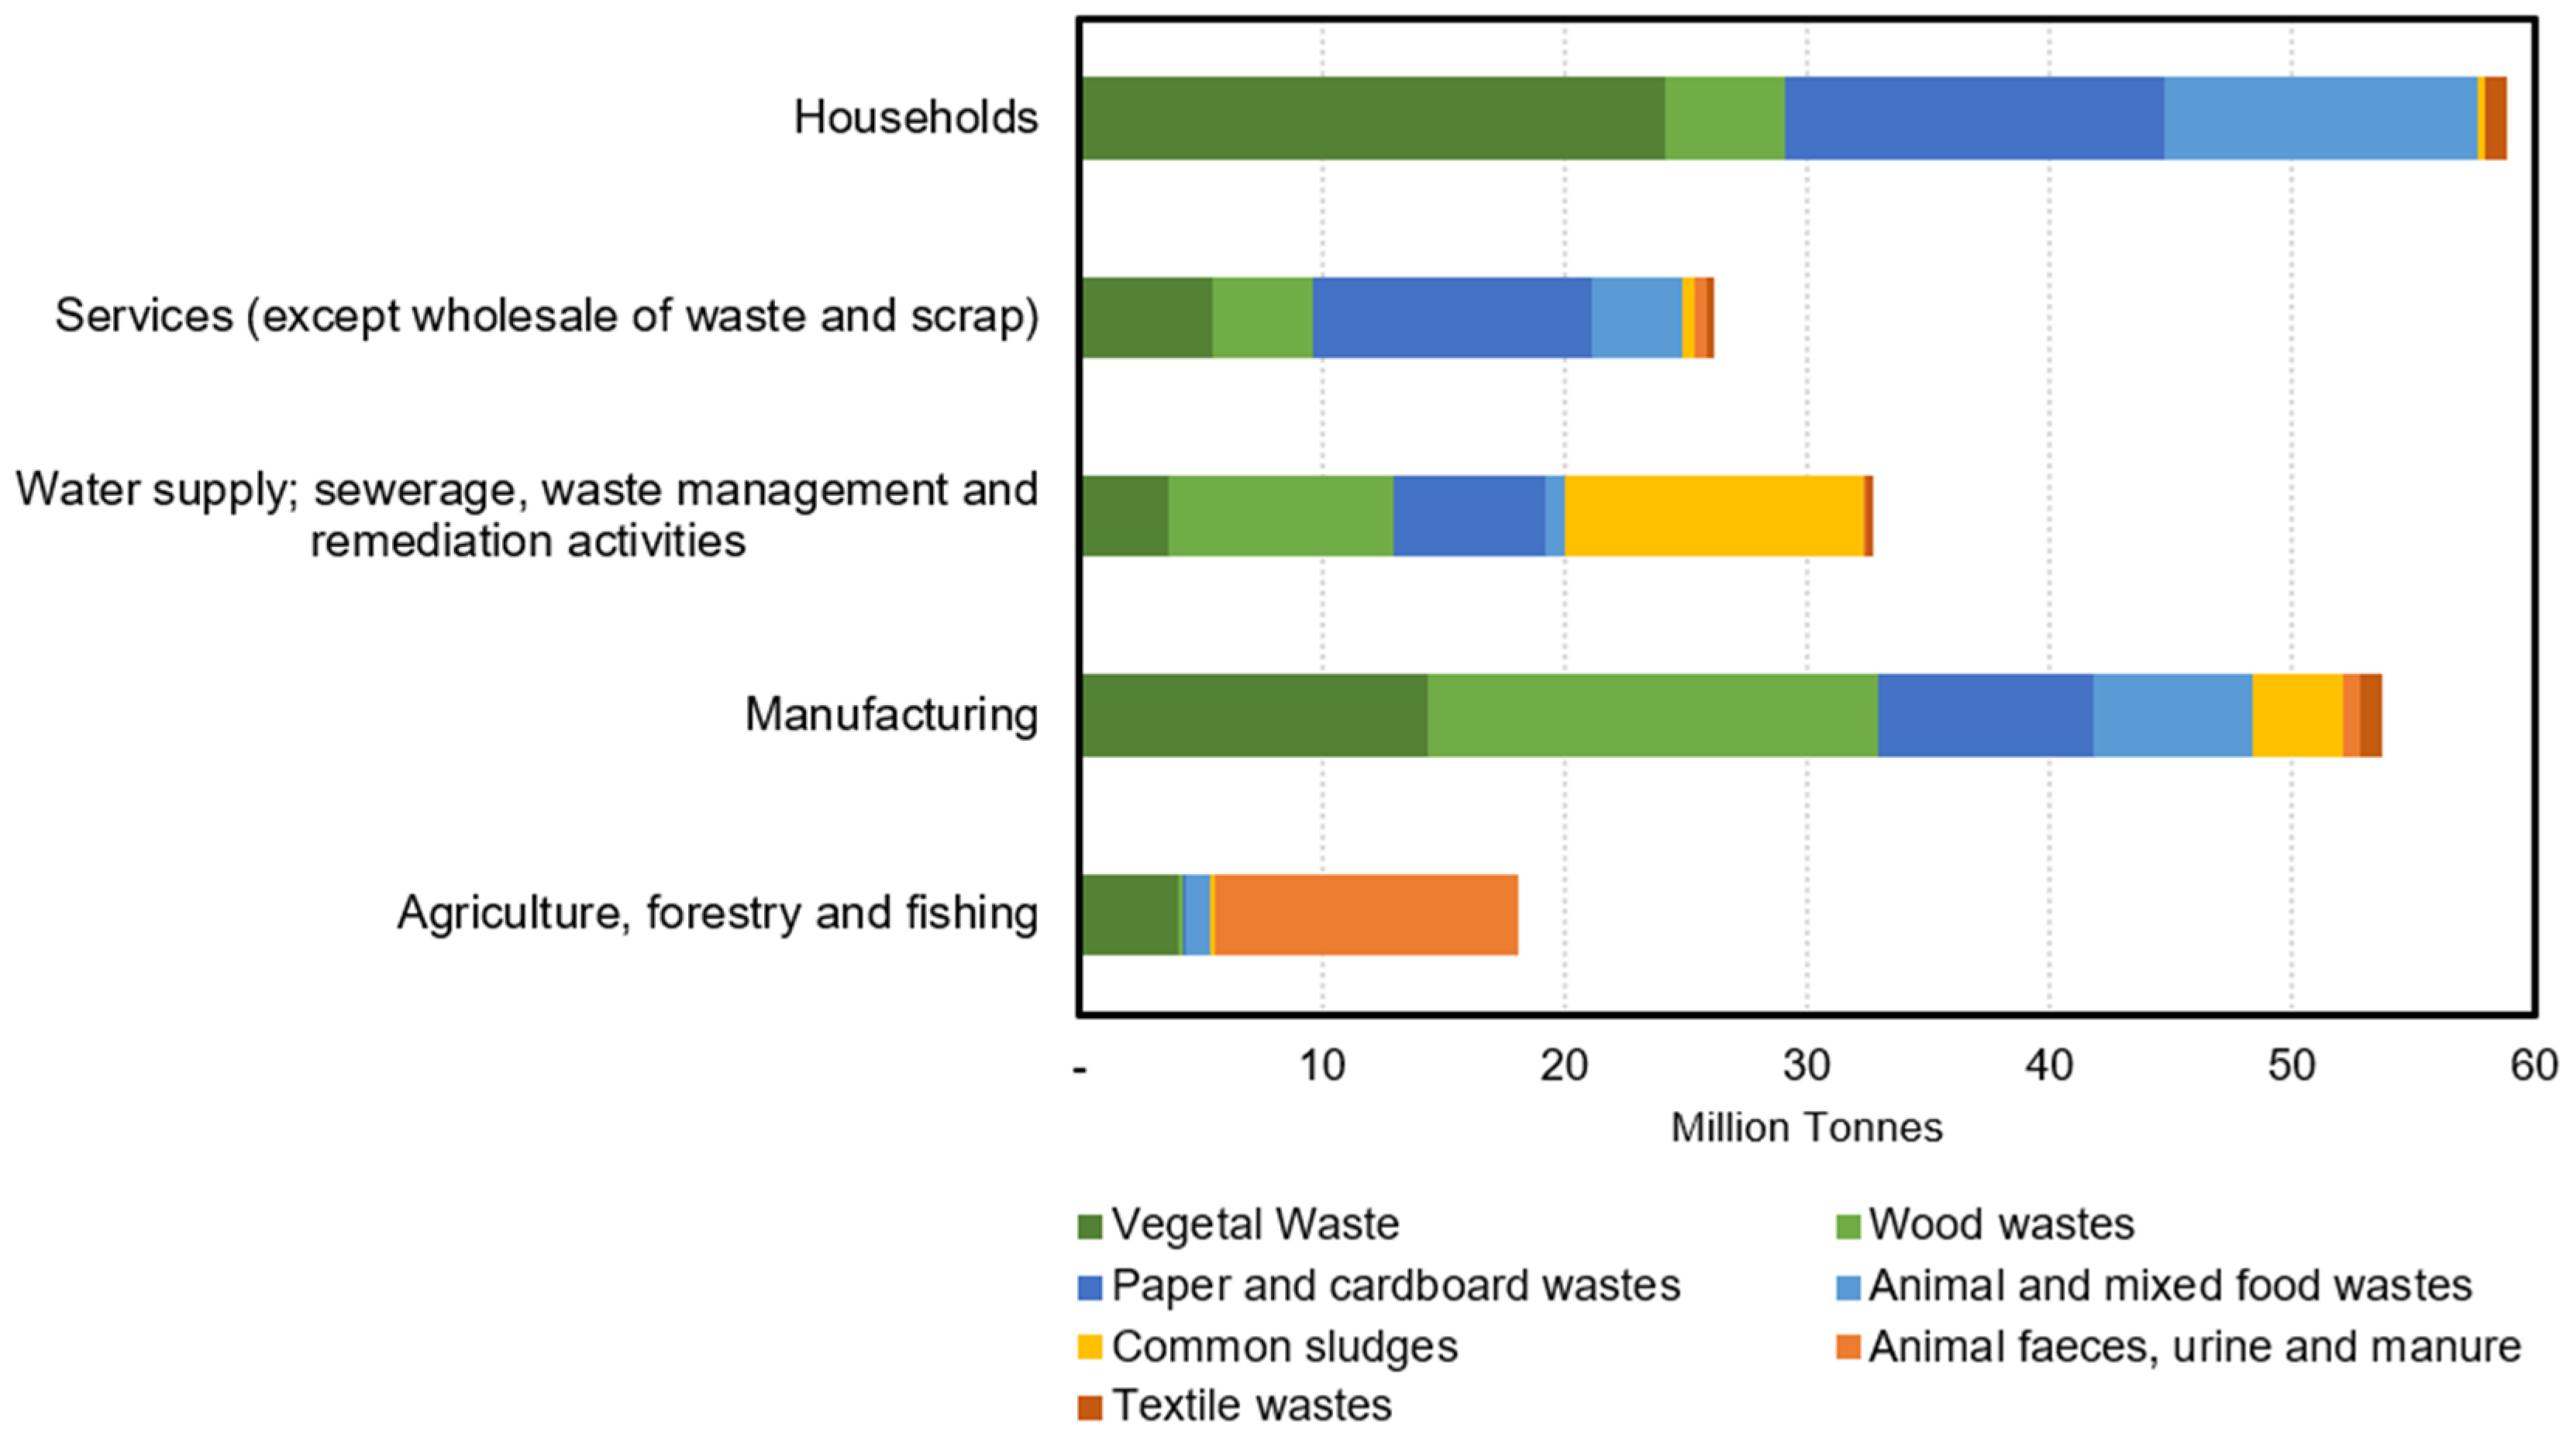
| Non-Hazardous Biogenic Waste | Description | Generation (Tons) | % of Total | Cumulative % |
|---|---|---|---|---|
| Vegetal wastes |
| 53,640,000 | 27% | 27% |
| Wood wastes |
| 46,400,000 | 23% | 50% |
| Paper and cardboard wastes |
| 43,490,000 | 22% | 71% |
| Animal and mixed food waste |
| 25,240,000 | 12% | 84% |
| Common sludges |
| 17,270,000 | 9% | 92% |
| Animal feces, urine, and manure |
| 13,950,000 | 7% | 99% |
| Textile wastes |
| 1,950,000 | 1% | 100% |
| Total | 201,940,000 |
| Type of Waste | Raw Materials | Bio-Based Sector and Applications |
|---|---|---|
| Vegetal wastes |
| Bio-based chemicals, pharmaceuticals, rubber, and plastics [34,35,36,37,38,39,40,41,42,43,44,45,46,47,48] Biomaterials, enzymes, pharmaceuticals, cosmetic ingredients, sugars, natural pigments, biofertilizers, dairy products, food supplements, bioactive compounds, surfactants, cellulosic products, biocompatible compounds, and materials Textile and textile products [45,48,49,50,51,52] Fibers/fabrics, ropes, and overall textiles used in the food industry, biomedical applications, and machinery Paper [45,46,48,51,52,53,54,55] Bacterial cellulose, pulp from biowaste for paper production, and nanocellulose Liquid biofuels/energy [42,43,44,47,56,57] Biogas, bioethanol, biodiesel, hydrogen, bio-oil, biomethane, syngas, and electricity |
| Wood wastes | Sawdust, lignocellulosic residues, bark, wood chips, wood pulp, lumber wastes, plywood waste, particle board, timber, wood and garden waste, and glued or painted wood. | Bio-based chemicals, pharmaceuticals, rubber, and plastics [34,40,42,46,47,58,59,60,61] Biomaterials, enzymes, pharmaceuticals, sugars, chemical products, biofertilizers, adsorbents, soil conditioners, nanocellulose, and biochar Textiles and textile products [49,50,62] Fibers/fabrics and leather-like material Paper [46,63] Bacterial cellulose, pulp from biowaste for paper production, and nanocellulose Wood products and furniture [59,64,65] Wood-based materials, furniture, and building Liquid biofuel/energy [34,47,65,66,67,68] Bioethanol, bio-oil, biogas, and syngas |
| Paper and cardboard wastes | Wastepaper or cardboard | Bio-based chemicals, pharmaceuticals, rubber, and plastics [35,37,47,69] Biomaterials, nanocellulose, and biochar Textiles and textile products [49,70,71] Fibers/fabrics Paper [34,46] Bacterial cellulose, recycled paper, and nanocellulose Liquid biofuel/energy [34,47,67,68,72] Bioethanol, syngas, and electricity |
| Animal and mixed food waste |
| Bio-based chemicals, pharmaceuticals, rubber, and plastics [34,35,39,40,43,44,45,47,69,73,74,75] Biomaterials, enzymes, pharmaceuticals, cosmetic ingredients, chemical products, lubricants, biofertilizers, bioactive compounds, dyes, bacterial cellulose, and biochar Paper [45,51,52] Bacterial cellulose Textiles and textile products [45,51,52,73] Fibers/fabrics and bacterial cellulose Liquid biofuel/energy [34,43,44,47,73,75,76,77,78] Biogas, bioethanol, biodiesel, hydrogen, bio-oil, and biomethane |
| Common sludges |
| Bio-based chemicals, pharmaceuticals, rubber, and plastics [34,35,42,43,44,48,64,79,80,81,82,83] Plastics, pharmaceuticals, cosmetics, sugars, biofertilizer/digestate, biopesticides, enzymes, proteins, solvents, and bacterial cellulose Textiles and textile products [48,51,52,81,82] Fibers/fabrics and bacterial cellulose Paper [48,51,52] Bacterial cellulose Liquid biofuel/energy [34,43,44,82] Biogas, bioethanol, biodiesel, dihydrogen, bio-oil, and biomethane |
| Animal feces, urine, and manure | Manure | Bio-based chemicals, pharmaceuticals, rubber, and plastics [34,43,44,47,84] Biomaterials, pharmaceuticals, cosmetic ingredients, biofertilizers, and biochar Liquid biofuel/energy [43,44,47,84] Biogas, bioethanol, biodiesel, hydrogen, bio-oil, and biomethane |
| Textiles |
| Bio-based chemicals, pharmaceuticals, rubber, and plastics [85,86,87,88] Fertilizers, biochar, and cellulose acetate Textile and textile products [34] Textile recycling Liquid biofuel/energy [89,90,91] Syngas, bio-oil, biogas, bio-alcohol, hydrogen, biodiesel, and electricity |
| Bio-Based Sectors/Biogenic Wastes | Textiles and Textile Products | Wood Products and Furniture | Paper | Bio-Based Chemicals, Pharmaceuticals, Rubber, and Plastics | Bio-Based Electricity |
|---|---|---|---|---|---|
| Animal and mixed food waste | X | - | X | X | X |
| Vegetal wastes | X | - | X | X | X |
| Paper and cardboard wastes | X | - | X | X | X |
| Wood wastes | X | X | X | X | X |
| Common sludges | X | - | X | X | X |
| Animal feces, urine, and manure | - | - | X | X | |
| Textile wastes | X | - | - | X | X |
| Bio-Based Sector | Employment, Shares % * | Turnover, Shares % * | Bio-Based Product Output Share ** |
|---|---|---|---|
| Textiles and textile products | 23% | 10% | 42.20% |
| Wood products and furniture | 41% | 25% | 72.40% |
| Paper | 19% | 26% | 99.50% |
| Bio-based chemicals, pharmaceuticals, rubber, and plastics | 15% | 33% | 19.50% |
| Liquid biofuels | 1% | 2% | 93% |
| Bio-based electricity | 1% | 4% | 5.80% |
Disclaimer/Publisher’s Note: The statements, opinions and data contained in all publications are solely those of the individual author(s) and contributor(s) and not of MDPI and/or the editor(s). MDPI and/or the editor(s) disclaim responsibility for any injury to people or property resulting from any ideas, methods, instructions or products referred to in the content. |
© 2024 by the authors. Licensee MDPI, Basel, Switzerland. This article is an open access article distributed under the terms and conditions of the Creative Commons Attribution (CC BY) license (https://creativecommons.org/licenses/by/4.0/).
Share and Cite
Fernández Ocamica, V.; Bernardes Figueirêdo, M.; Zapata, S.; Bartolomé, C. Assessment of EU Bio-Based Economy Sectors Based on Environmental, Socioeconomic, and Technical Indicators. Sustainability 2024, 16, 1971. https://doi.org/10.3390/su16051971
Fernández Ocamica V, Bernardes Figueirêdo M, Zapata S, Bartolomé C. Assessment of EU Bio-Based Economy Sectors Based on Environmental, Socioeconomic, and Technical Indicators. Sustainability. 2024; 16(5):1971. https://doi.org/10.3390/su16051971
Chicago/Turabian StyleFernández Ocamica, Víctor, Monique Bernardes Figueirêdo, Sebastián Zapata, and Carmen Bartolomé. 2024. "Assessment of EU Bio-Based Economy Sectors Based on Environmental, Socioeconomic, and Technical Indicators" Sustainability 16, no. 5: 1971. https://doi.org/10.3390/su16051971
APA StyleFernández Ocamica, V., Bernardes Figueirêdo, M., Zapata, S., & Bartolomé, C. (2024). Assessment of EU Bio-Based Economy Sectors Based on Environmental, Socioeconomic, and Technical Indicators. Sustainability, 16(5), 1971. https://doi.org/10.3390/su16051971