Article

Modeling the Properties of Sustainable Self-Compacting Concrete Containing Marble and Glass Powder Wastes Using Response Surface Methodology

1
Department of Civil Engineering, Faculty of Sciences of Technology, University of Constantine 1 Mentouri Brothers, Constantine 25000, Algeria
2
Materials and Durability of Constructions Laboratory, Faculty of Sciences of Technology, University of Constantine 1 Mentouri Brothers, Constantine 25000, Algeria
3
Laboratory of Materials Technology and Process Engineering (LTMGP), Faculty of Technology, University of Bejaia, Bejaia 06000, Algeria
4
Mechanics and Civil Engineering Materials Laboratory (L2MGC), University of CY-Paris, Cergy-Pontoise, 95031 Neuville-sur-Oise, France
5
Laboratory of Eco-Materials, Innovations & Applications (EMIA), Civil Engineering Department, University of Djelfa, Djelfa 17000, Algeria
6
Department of Materials Engineering and Construction Processes, Wroclaw University of Science and Technology, Wybrzeze Wyspianskiego 27, 50-370 Wroclaw, Poland
*
Authors to whom correspondence should be addressed.
Sustainability 2024, 16(5), 1972; https://doi.org/10.3390/su16051972
Submission received: 21 December 2023 / Revised: 8 February 2024 / Accepted: 23 February 2024 / Published: 27 February 2024
(This article belongs to the Section Sustainable Materials)

Abstract

:
This study aims to apply the response surface methodology (RSM) to develop a statistical model that predicts and models the performance of both the fresh and hardened properties of self-compacting concrete (SCC). RSM was used to model processes involving three variables: the water/binder ratio, and the percentages of waste marble, and glass powder. Tests, including slump flow diameter, sieve stability, and L-box, were carried out to evaluate the fresh properties of the self-compacting concrete; compressive strength was analyzed at 7, 28, and 90 days. Statistical significance was only observed in the water/binder ratio for both the slump flow and sieve stability tests. Furthermore, these results indicate that the models used in the compressive strength tests demonstrate a high statistical significance for all ages. The findings suggest that incorporating waste marble powder (MP) and glass powder (GP) in SCC necessitates a significant amount of superplasticizer to counteract the workability loss, and it improves the compressive strength of SCC. The coefficients analyzed using the RSM approach validate its effectiveness as a predictive tool for determining the hardened properties of self-compacting concrete.

1. Introduction

With each passing year, there is an increasing amount of waste that ends up in landfills [1]. The use of waste is an attractive alternative to disposal due to the reduction of disposal costs and potential pollution problems or even disposal while conserving resources at the same time [2]. Reusing waste is important from multiple perspectives; it helps conserve non-renewable natural resources, reduces pollution, and aids in saving and recycling energy in production processes [3].
Concrete is the second most widely used material on earth after water [4]. The widespread use of concrete has led to a global depletion of its raw materials [5]. Moreover, the production of concrete accounts for 5–8% of human-caused CO2 emissions [6] and is a significant contributor to the emission of greenhouse gases [7]. Numerous researchers have conducted studies on the utilization of various types of waste as a partial replacement for cement. By mixing cement with waste materials like slag [8], fly ash [9], glass [10], rubber [11], and plastic [12], it is possible to create sustainable concrete with favorable properties [13]. The use of waste materials in the production of concrete has grown increasingly widespread [14]. Recycling materials contribute unique qualities to concrete products, making them more sustainable, and eco-friendly [15].
The conversion of marble into final products produces approximately 30 to 40% by-products in the form of solid waste. As a result, an annual amount of 690,000 to 920,000 tons of marble waste is produced [16]. In 2013, the municipal solid waste stream in the United States contained 10.37 million tons of glass, while the European Union generated 1.5 million tons of glass waste from demolition and renovation [17]. Additionally, countries like New Zealand consume about 250,000 tons of glass annually, with approximately 100,000 tons being disposed of in landfills [18].
Self-compacting concrete (SCC) is a type of concrete that can be compacted without the need for external energy [19], offering numerous economic and technical advantages [20]. It is produced using the same fundamental ingredients as traditional concrete but incorporates significant amounts of superplasticizer additives, and, occasionally, viscosity-modifying additives, to achieve excellent workability [21]. It has recently emerged as one of the most important developments in the construction industry [22]. The cement content of self-compacting concrete (SCC) is relatively high, and the ratio of fine-to-coarse aggregates is more crucial compared to traditional concretes. In addition to cement, fine fillers, such as fly ash, silica fume, glass powder, slag, metakaolin, and marble powder, can be used to increase the paste content [23].
Some wastes, such as glass and marble, have been incorporated into concrete in various ways, including as partial replacements for fine and coarse aggregates. Recently, they have also been explored as a potential supplemental cementitious material (SCM) [18].
Using marble and glass powders in concrete offers advantages such as improved flowability, increased strength, sustainable construction practices, cost efficiency, and enhanced durability. These materials can effectively improve concrete properties, reduce environmental impacts, and contribute to sustainable construction practices [24]. However, the use of mathematical models to predict the different properties of waste-based concretes has become essential to better understand the behavior of these concretes.
One of the most effective mathematical and statistical methods to make predictions is the response surface methodology (RSM) [25], which is used to assess the impact of independent variables on responses by conducting a small number of experiments [26,27].
Many researchers have used the response surface methodology to predict the different properties of self-compacting concrete [25,26,27,28]. The results obtained through the application of the response surface methodology indicate a similarity of approximately 95% to the experimental results [28] which justifies the use of the statistical model to predict the properties of new mixtures with good accuracy [27].
In this context, it is interesting to predict the combined effect of the addition of marble powder and glass powder as partial replacements for cement on the fresh and hardened properties of self-compacting concretes using a statistical modeling approach (namely, the response surface methodology), which has not yet been used before in previous works. An analysis of variance (ANOVA) was used to assess the significance of the models and the different parameters on the response [29].
Therefore, the novelty of this research is the preparation of an accurate model for estimating the properties of fresh, self-compacting concrete mixtures containing marble and glass powder wastes. This was conducted using the response surface methodology.

2. Materials and Methods
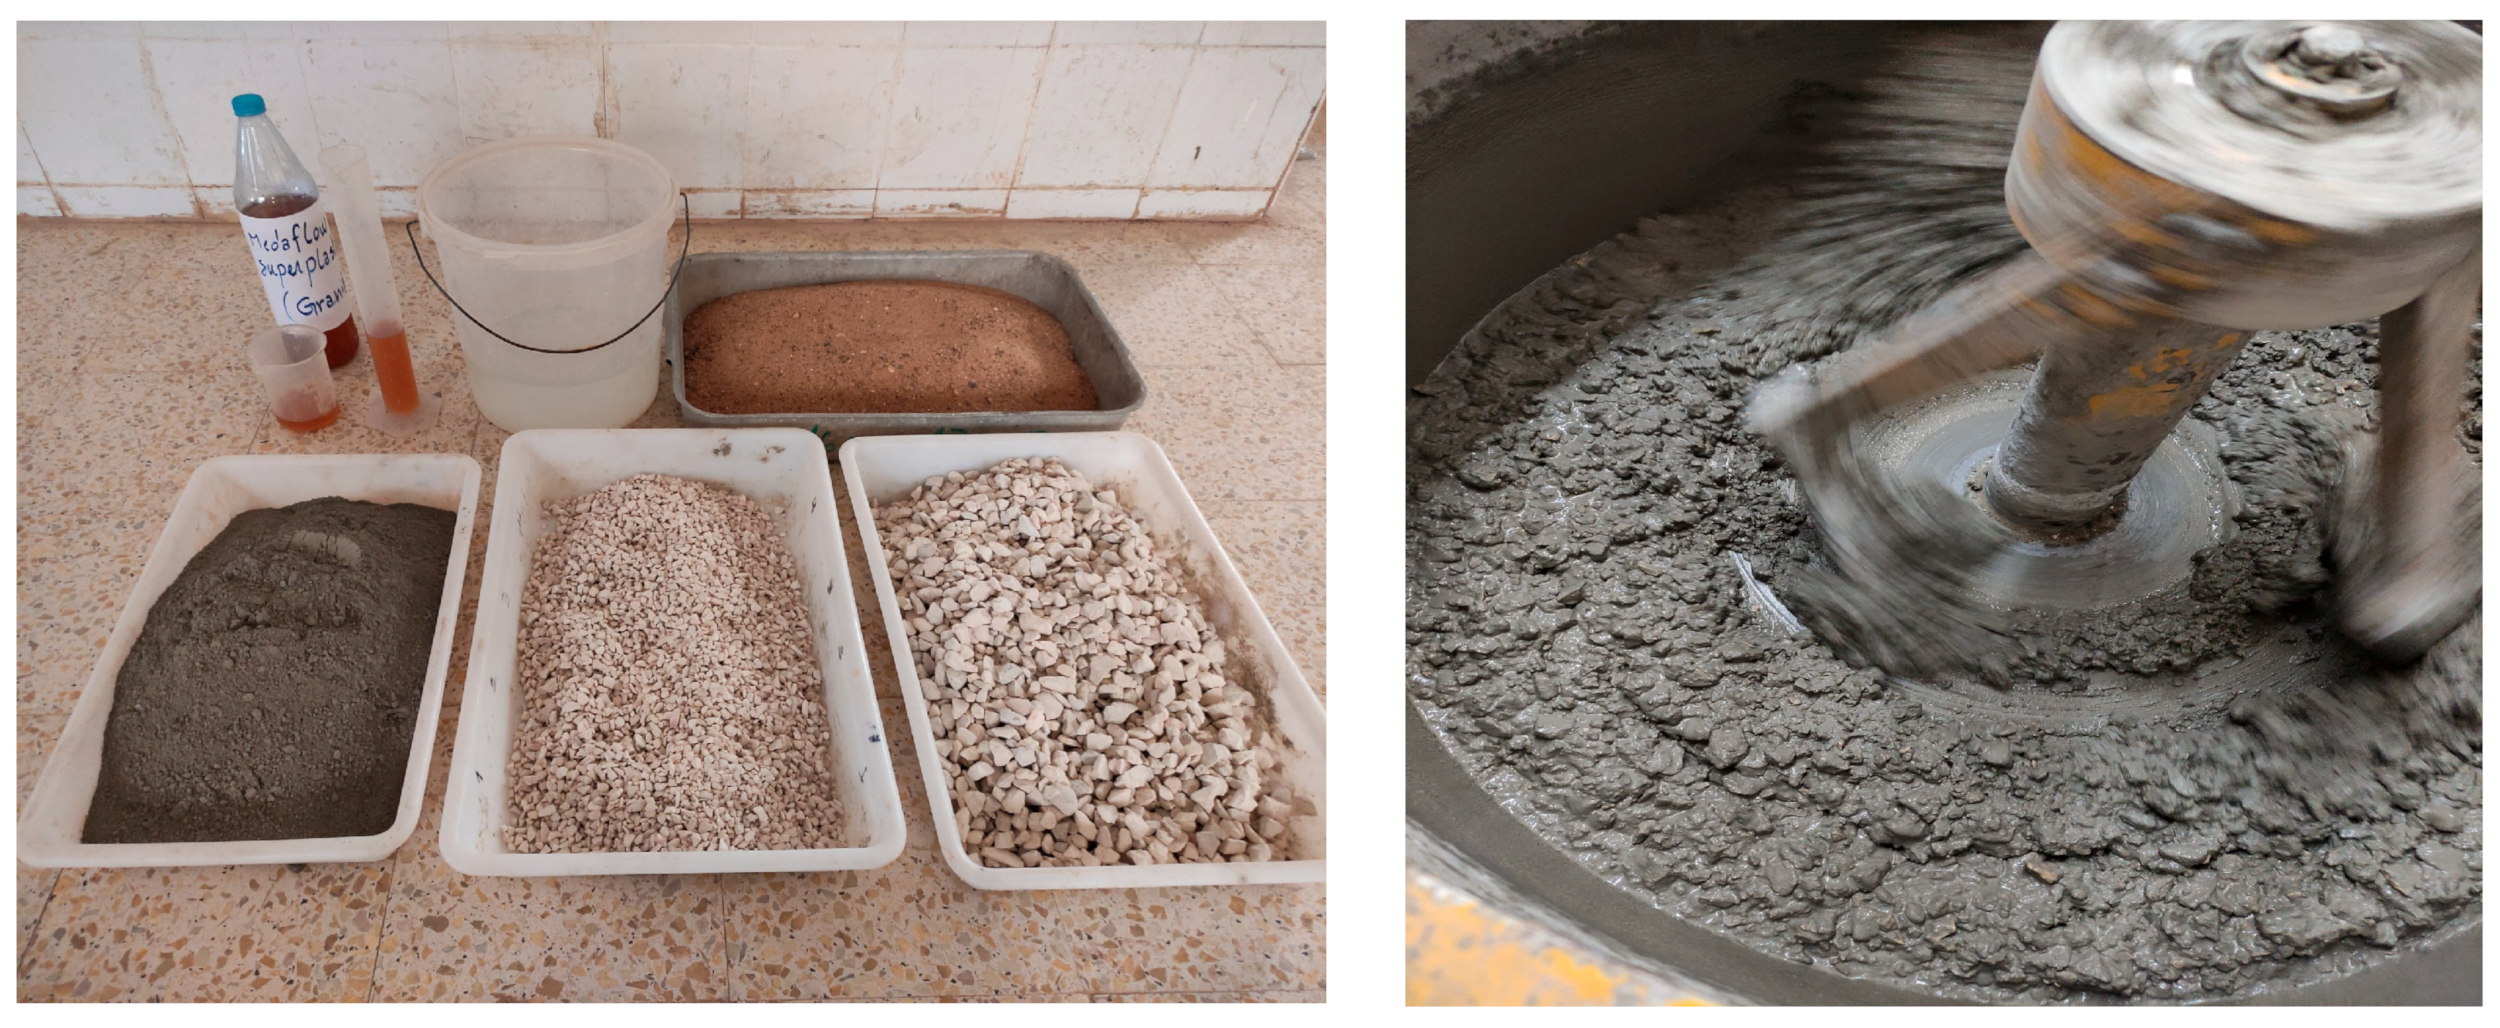
2.1. Materials

The materials used for preparing the concrete mixture were Portland cement, mineral wastes (glass and marble), sand, gravel, and superplasticizer. Portland cement CEM II/B-L 42.5 N was obtained from Lafarge Cement Algeria, in accordance with NF EN 197-1 [30]. It has a fineness of 3917 m2/kg, a compressive strength at 28 days of 46.25 MPa, and a density of 3050 kg/m3. The two mineral additions used for this study were waste marble powder from the National Marble Company of Skikda, Algeria, and waste glass powder from COMAVER Company (Artistic Glass Company) of Ghardaïa, Algeria. Both materials were finely ground and sieved through an 80 µm sieve.
The marble powder had a specific surface area and specific density of 4363 m2/kg and 2720 kg/m3, respectively. The glass powder had a specific surface area of approximately 3260 m2/kg and a specific density of 2485 kg/m3. The chemical characteristics of these powders and the cement are presented in (Table 1).
Oued sand from Oued Messad (80 km southeast of Djelfa) was also used. The sand had a continuous particle size distribution, represented by a grain size curve, falling within the recommended range for concrete. Additionally, the specific density of the sand was 2620 kg/m3, with a fineness modulus of 2.36 and a sand equivalent of 78%.
The (3/8 and 8/12.5 mm) granular fractions of crushed gravel are used in the present study. The specific gravity of the gravels used is 2670 kg/m3.
The admixture used is a liquid admixture of the high water-reducing Superplasticizer (SP) type under the industrial name GRANITEX MEDAFLOW30. It is made from ether polycarboxylates, with a density of 1.07 and a dry extract of 30%.

2.2. Concrete Preparation

The formulation method adopted is the empirical method based on the volume of paste; the dry mix for one cubic meter of concrete (i.e., 1000 L) is equal to the sum of the volumes of the cement paste and the volume of the aggregates [31].
Gravel (G) + Sand (S) + Cement (C) + Air (A) + Water (E) + super plasticizer (Sp) = 1000 L
  • A G/S ratio = 1.
  • A dosage of binder B = 400 kg/m3 (cement + additions)
The superplasticizer ratio (Sp) was used experimentally until we obtained a constant value that made it possible to guarantee the self-compacting of the mixtures used in this study. Several laboratory trials were conducted to determine the optimal mixture proportions for the self-compacting concrete (SCC) for mixture 1, considering the four key factors (ability to fill and flow, resistance to segregation, viscosity) [32].
The following mixing sequence was established: initially, all ingredients were dry-mixed in the concrete mixer for one minute. Then, 70% of the calculated water amount was added to the dry mix and mixed for one minute (see Figure 1). The remaining 30% of water was combined with the superplasticizer admixture and added to the mixer, where it was mixed for 5 min. At this stage, 20% of the water mixed with the superplasticizer was added to the mixer and mixed for 4 min, followed by the addition of the remaining 10%, which was mixed for one minute.
Suitable mix proportions were achieved and fixed for all the rest of mixtures.
Figure 1. Mixtures preparation of SCC.
Sustainability 16 01972 g001

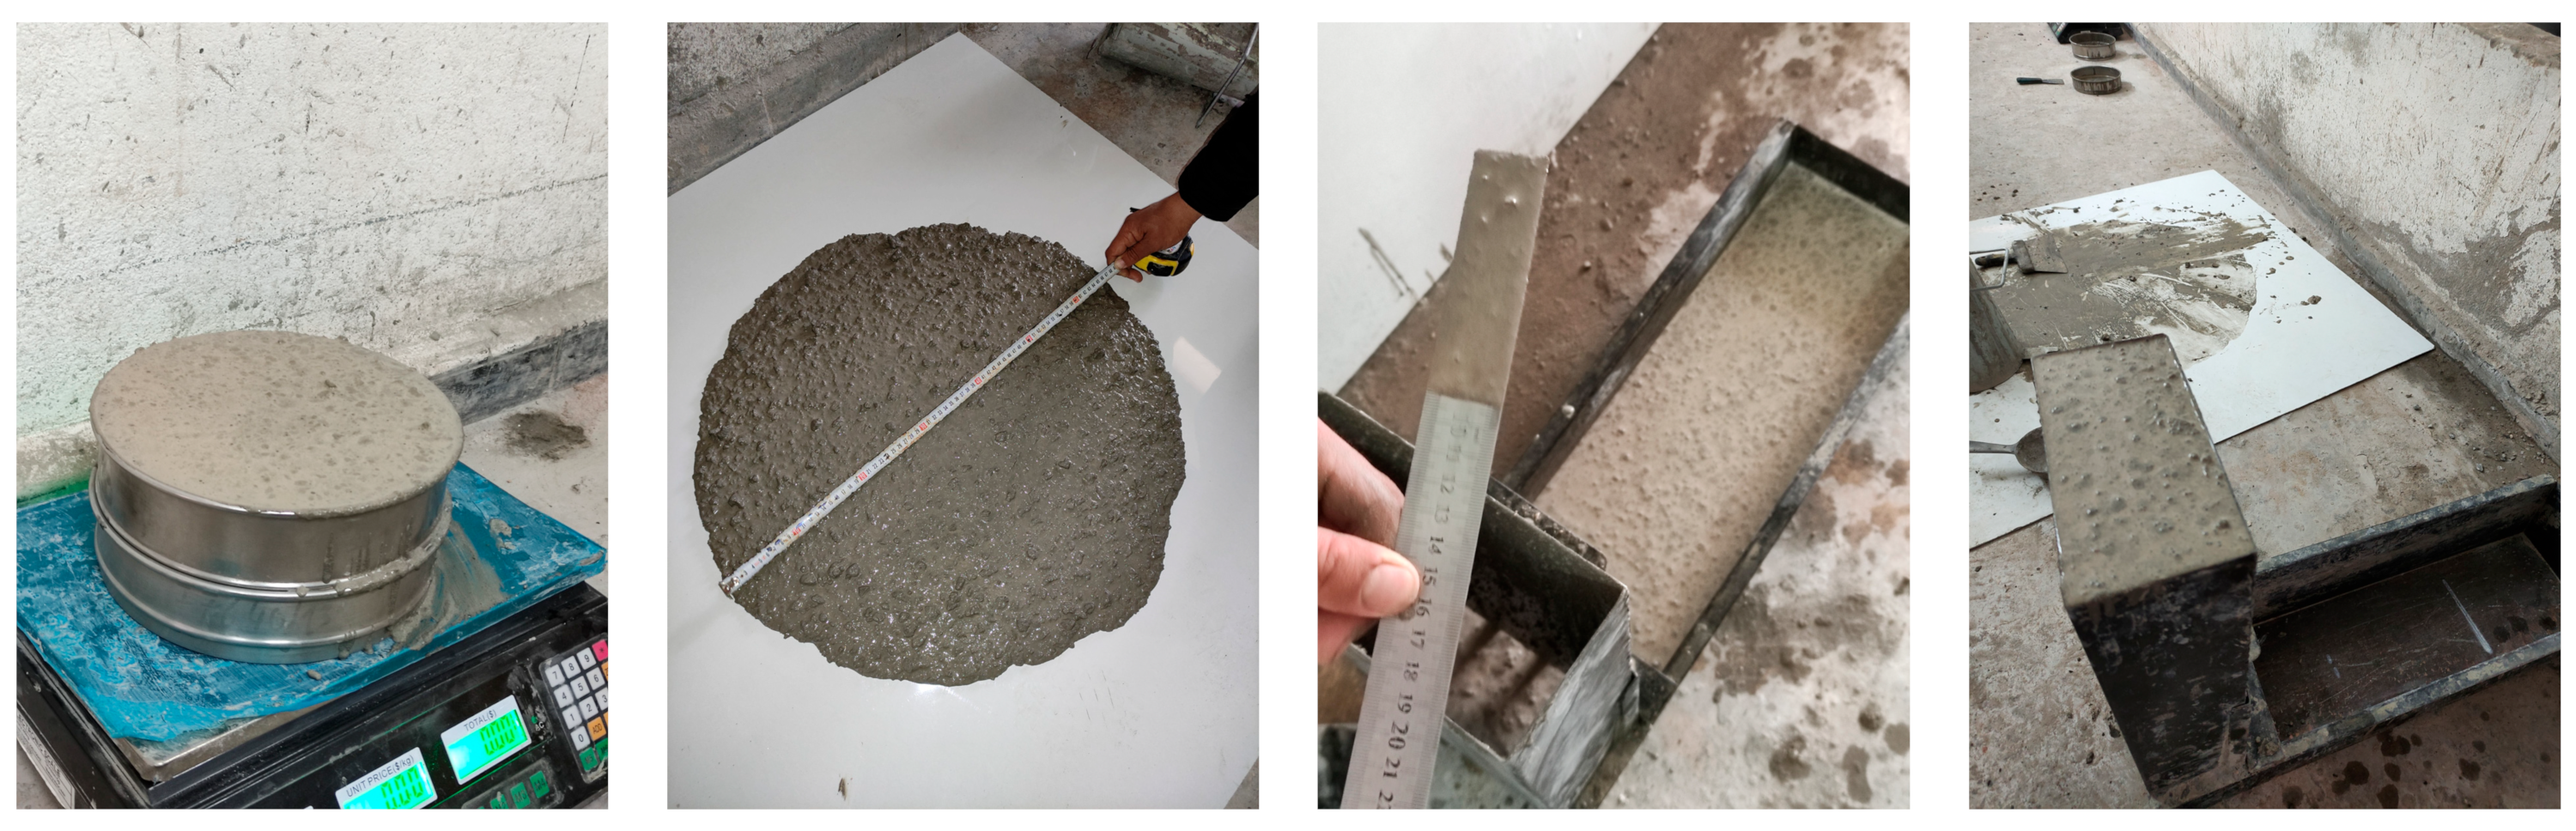
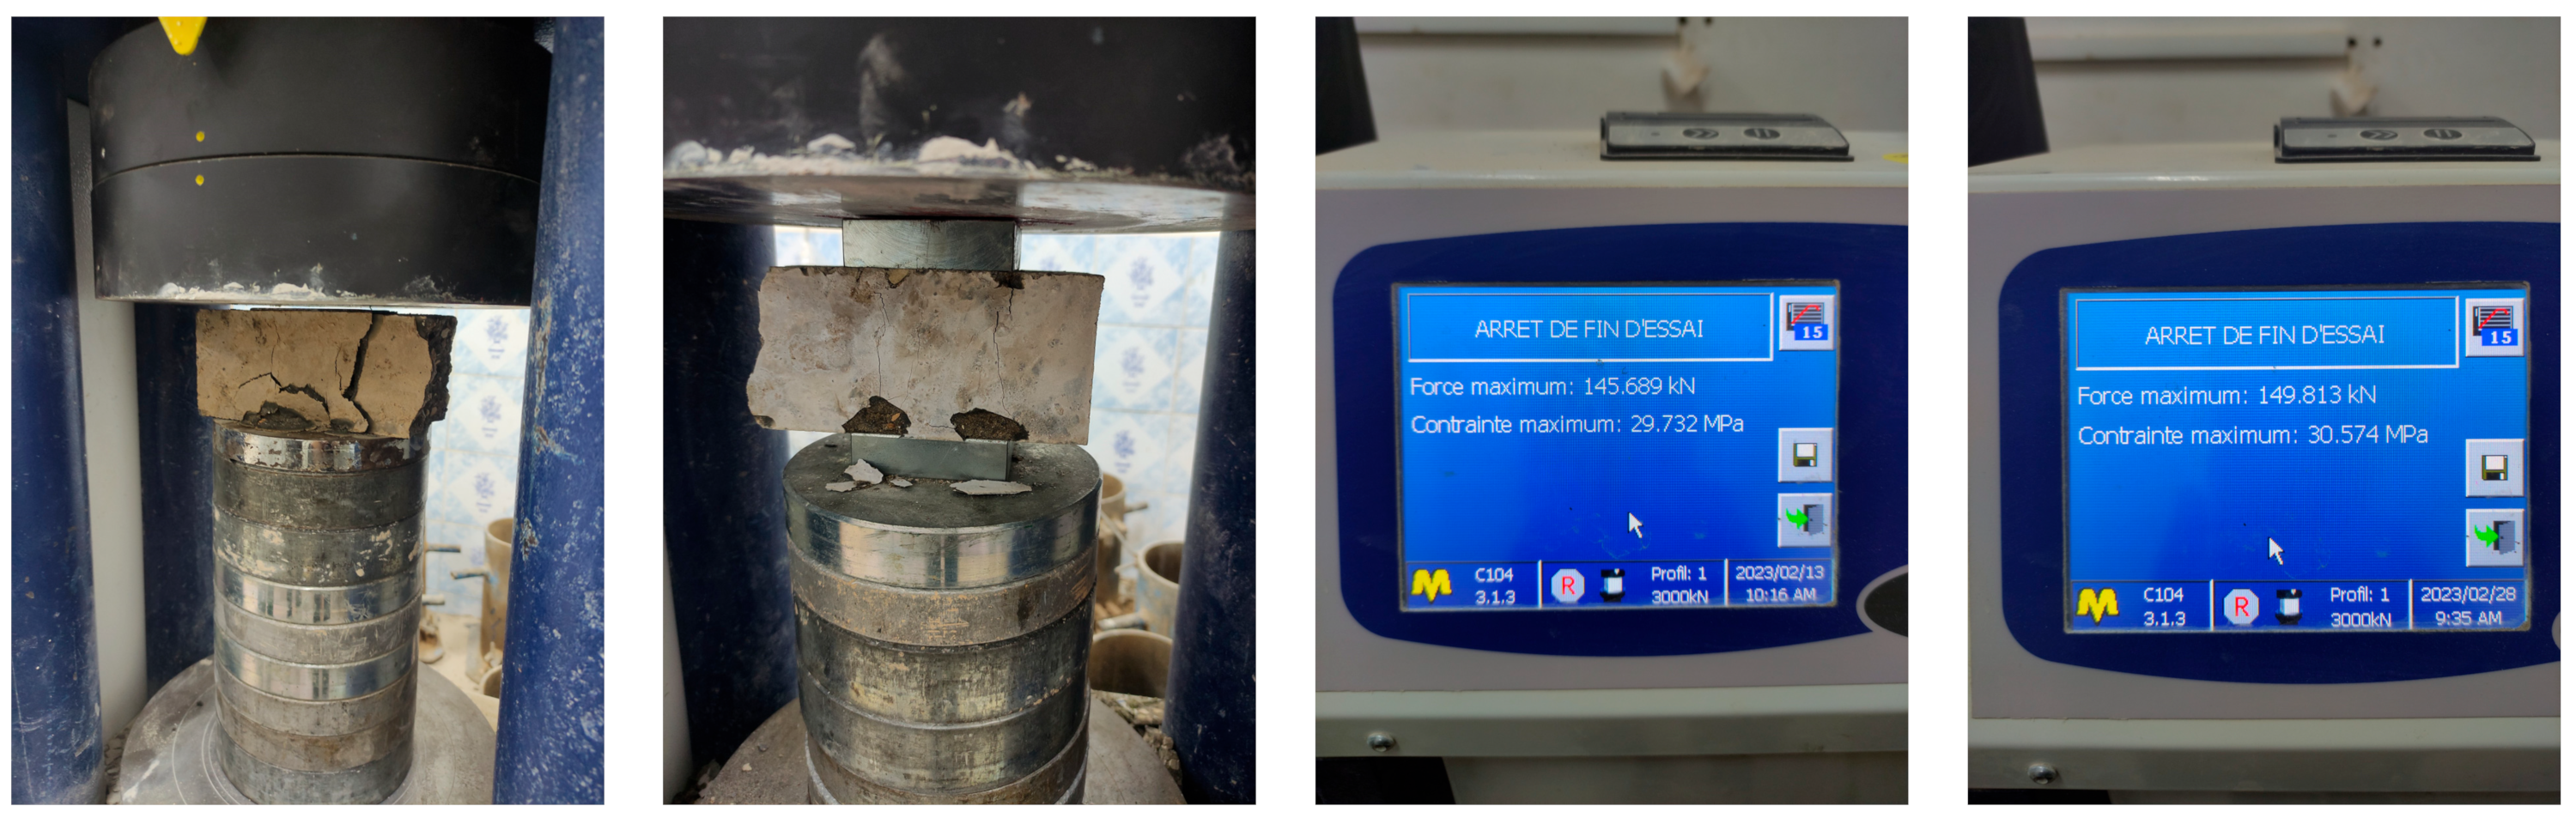
2.3. Experimental Methods

Slump flow test [33]: This evaluation examines the lateral flow characteristics of self-compacting concrete, representing a widely employed test method providing a reliable assessment of its filling capacity. The conventional slump cone, featuring a base diameter of 200 mm, a top diameter of 100 mm, and a height of 300 mm, is utilized in this procedure. Following the filling of the cone with concrete, a vertical lift is performed, allowing the concrete to flow freely. Subsequently, measurements of the concrete’s final diameter in two perpendicular directions are taken, and the average of these diameters is calculated in accordance with EN 12350-8.
The L-box test [34], in accordance with EN 12350-10, serves to evaluate the filling and passing characteristics of self-compacting concrete. The testing apparatus comprises an L-shaped box, as depicted in the figure below. Initially, concrete is deposited into the vertical segment of the box, which possesses dimensions of 600 mm in height and a cross-section of 100 mm by 200 mm. Upon opening a slide gate between the vertical and horizontal segments, the concrete flows through a line of vertical reinforcing bars into the horizontal segment, which is 700 mm long, 200 mm wide, and 150 mm tall. The final concrete depth at the gate and the end of the trough is measured, and the proportional difference is quantified as a blocking ratio H2/H1.
The sieve segregation test [35] evaluates the self-compacting concrete’s resistance to segregation, following the EN 12350-9 standard. In this test, 5 kg of fresh concrete is poured over a 5 mm mesh, and the mass of the mortar passing through the sieve is meticulously recorded. The segregated portion is then expressed as a percentage of the material that successfully passes through the sieve, as per the specifications outlined in EN 12350-9.
Compressive strength [36] was measured using a hydraulic press of type 65-L11M2 according to the EN 12390-3 standard.

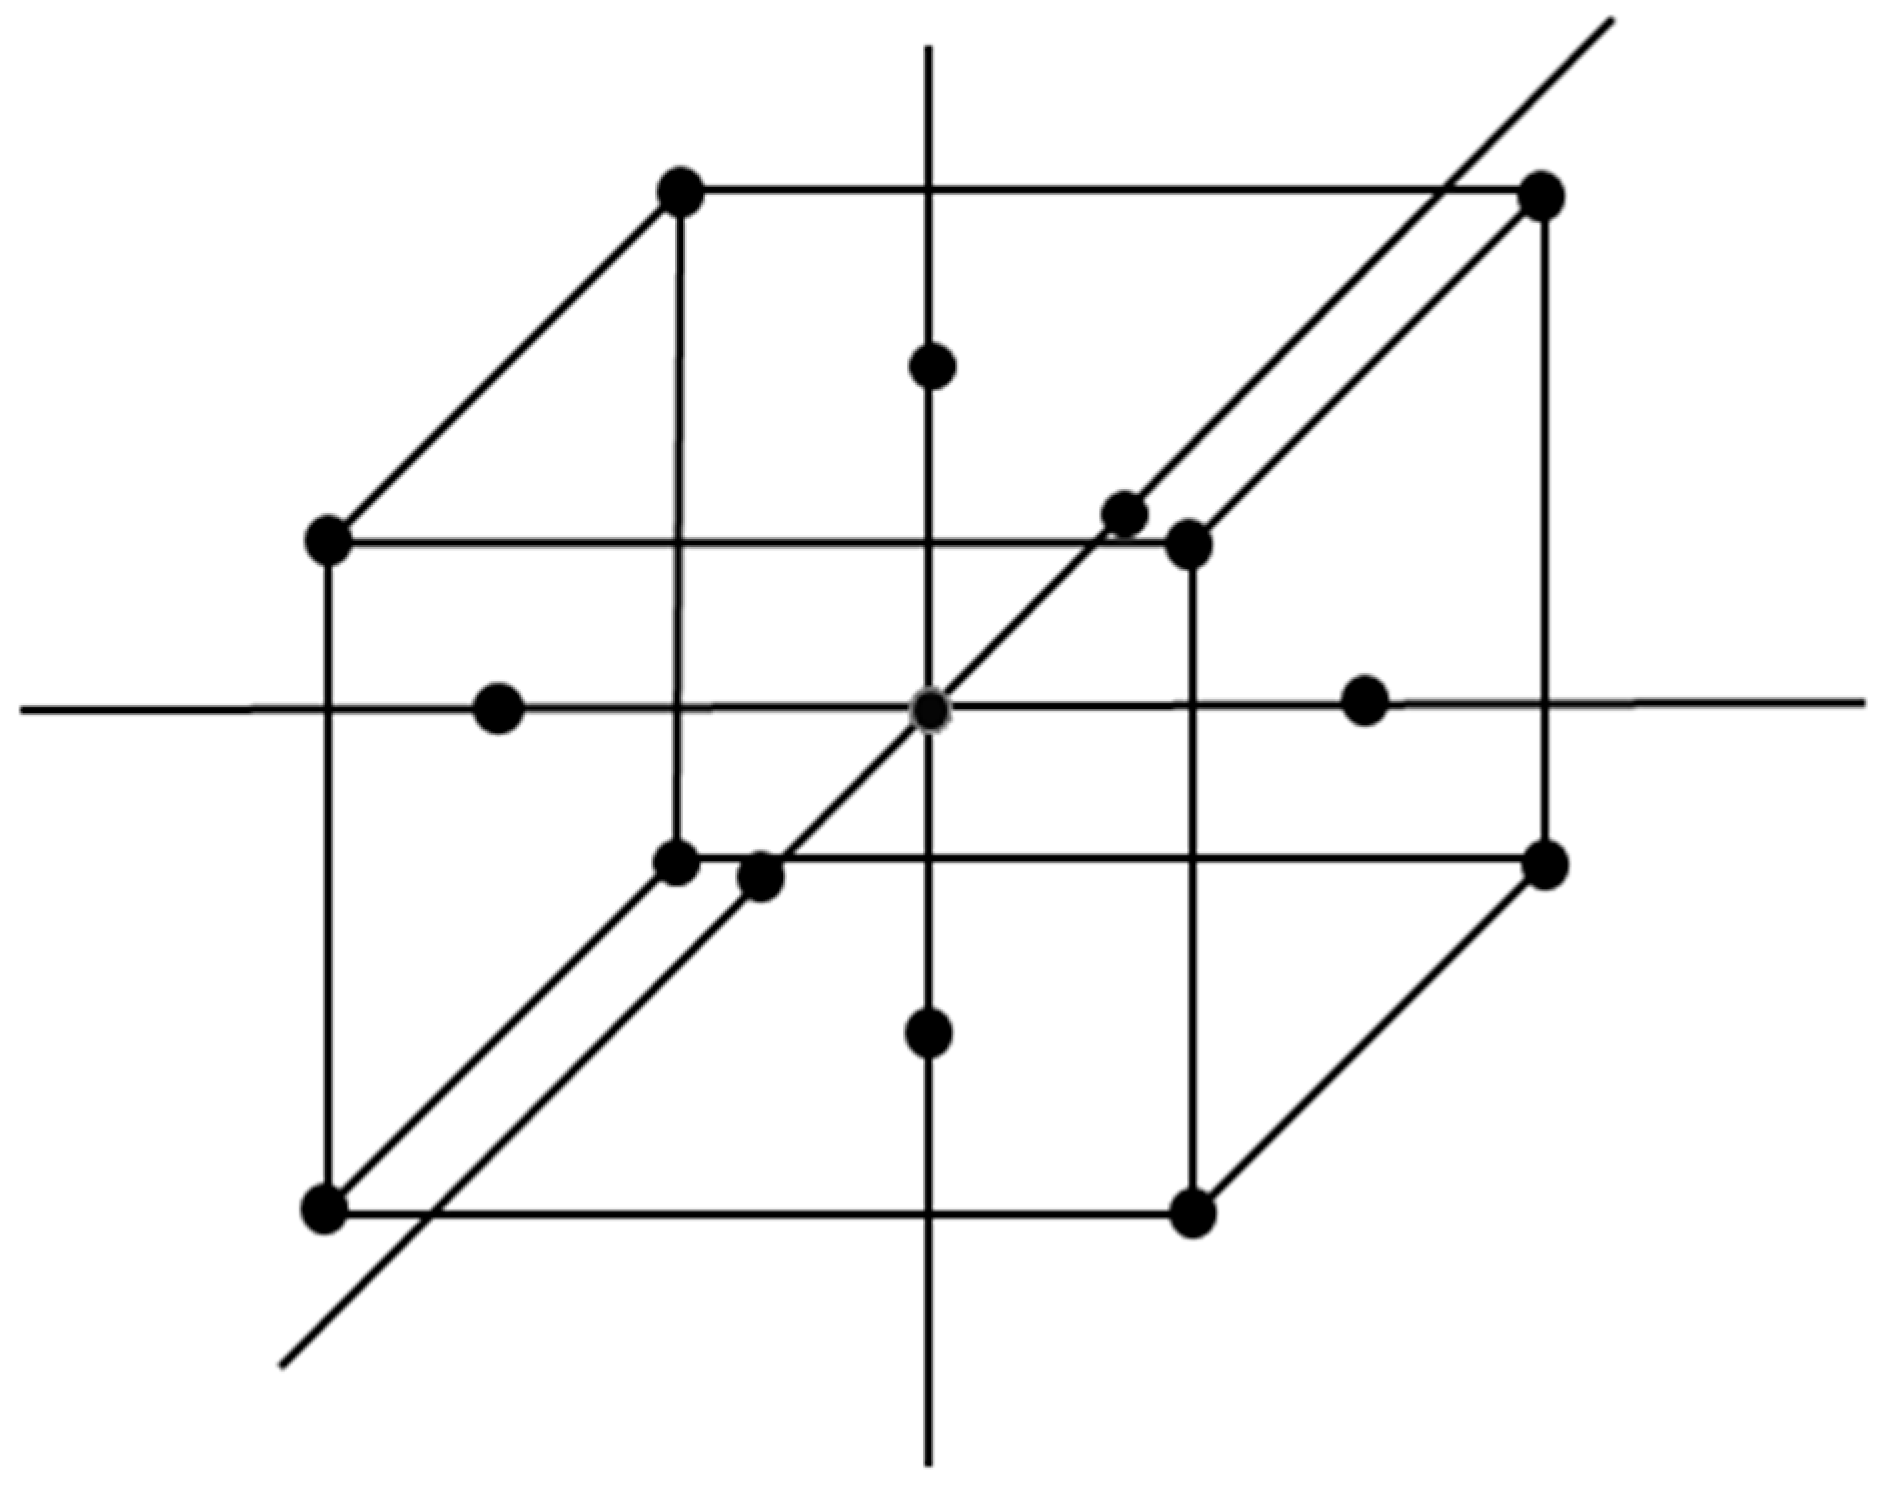
2.4. Mathematical Modelling

Response Surface Methodology

Response surface methodology, comprises a set of mathematical and statistical techniques used to assess the connections between a set of independent variables (input parameters) and one or more dependent variables (output parameters) [25]. This technique is generally used when there are several input parameters affecting the output (response).
There are many such methodologies like mixture experiments, multiple objective functions, central composite designs (CCD) and Box–Behnken designs, stochastic models and optimization techniques, and full or fractional factorials, and they are all similar to response surface methodology in that they aim to optimize responses based on multiple factors, but they each have specific focuses. Mixture experiments deal with components in a mixture, multiple objective functions consider conflicting objectives, central composite and Box–Behnken designs create efficient experimental setups, stochastic models handle uncertainty, and full or fractional factorials estimate curvature and move directions.
A central composite orthogonal experimental design for three independent variables was adopted (Table 2). The variables taken (three levels for each variable) were: the ratio of water/binder content (W/B; 0.4–0.5), the ratio of marble powder (% MP; 0–25%), and the ratio of glass powder (% GB; 0–25%).
The number of the experiments was determined according to the Equation (1). (Table 3).
N = 2 K + 2 k + c
where “k” refers to the number of variables under study. The factorial points, represented by “2k” encompass all combinations of coded values (X = ±1) positioned at the corners of a cube.
Additionally, there are “2k” axial points located at a distance of ±a from the origin, situated at the center of each face of the cube. Moreover, there are “c” center points, where all levels are set to the coded level 0, positioned at the center of the cube. A graphic of a three-dimensional CCD design for k = 3 independent variables is shown in (Figure 2) [27].
Figure 2. A three-dimensional CCD design for k = 3 independent variables.
Sustainability 16 01972 g002
The predictive model used to estimate the responses and explain the relationship between the independent variables was a second-order polynomial equation, Equation (2):
Y = B 0 + i k B i X i + i k B i i X 2 + k j k B i j X i X j + E
where Y represents the response functions, B0 is the constant coefficient, and Bi, Bii and Bij are the coefficients of the linear, quadratic, and interactive terms, respectively [37]. The significance of the model was evaluated by analyzing the determination coefficient (R2), the adjusted coefficient (R2 adj), the root mean-square-error (RMSE) and the p-value.
Table 2. Coding and real levels for CCD model.
VariablesSymbolUnitCoded Factor Levels
−10+1
W/BX1/0.40.450.5
MPX2%012.525
GPX3%012.525
The central composite design was employed to study the impact of process variables on the compressive strength of concrete mixtures, with the aim of predicting their performance.
JMP® Pro 14.0.0 software was used for the design and analysis of the experiments. Statistically designed experiments are a powerful method for initiating the discovery process, ensuring that the resulting data contain substantial information [38]. The investigation involved conducting 17 experiments, and the specific composition of each mixture can be found in (Table 3).
Table 3. Mixture proportions for 1 m3 of concrete [Kg/m3].
MixturePattern in (JMP® Pro 14.0.0)Components
W/BBinderWSandGravel (3/8)Gravel (8/16)Superplasticizer
CMPGP
Mix 1−−−0.4400001609083046218
Mix 2−−+0.43200801609083046218
Mix 3−+−0.43208001609083046218
Mix 4−++0.424080801609083046218
Mix 5+−−0.5400002008562865868
Mix 6+−+0.53200802008562865868
Mix 7++−0.53208002008562865868
Mix 8+++0.524080802008562865868
Mix 9a000.432040401609083046228
Mix 10A000.532040402008562865868
Mix 110a00.453600401808822956038
Mix 120A00.4528080401808822956038
Mix 1300a0.453604001808822956038
Mix 1400A0.4528040801808822956038
Mix 150000.4532040401808822956038
Mix 160000.4532040401808822956038
Mix 170000.4532040401808822956038
W: water, C: cement, B: binder (cement + MP + GP). (+ and A): The amount of substance at its maximum value. (− and a): The amount of substance at its lowest value. 0: The amount of substance at its middle value.

3. Results and Discussion

During this investigation, the flow characteristics were assessed using the slump flow diameter to measure filling ability, while passing ability was evaluated using the L-box test. The resistance to segregation was measured using the sieve stability test.
For each concrete mixture, nine prisms of 70 × 70 × 280 mm3 were cast for the hardened proprieties.
The specimens were demolded after one day and then placed in the water in a curing room with 90% RH and 20 ± 2 °C temperatures until the testing days.

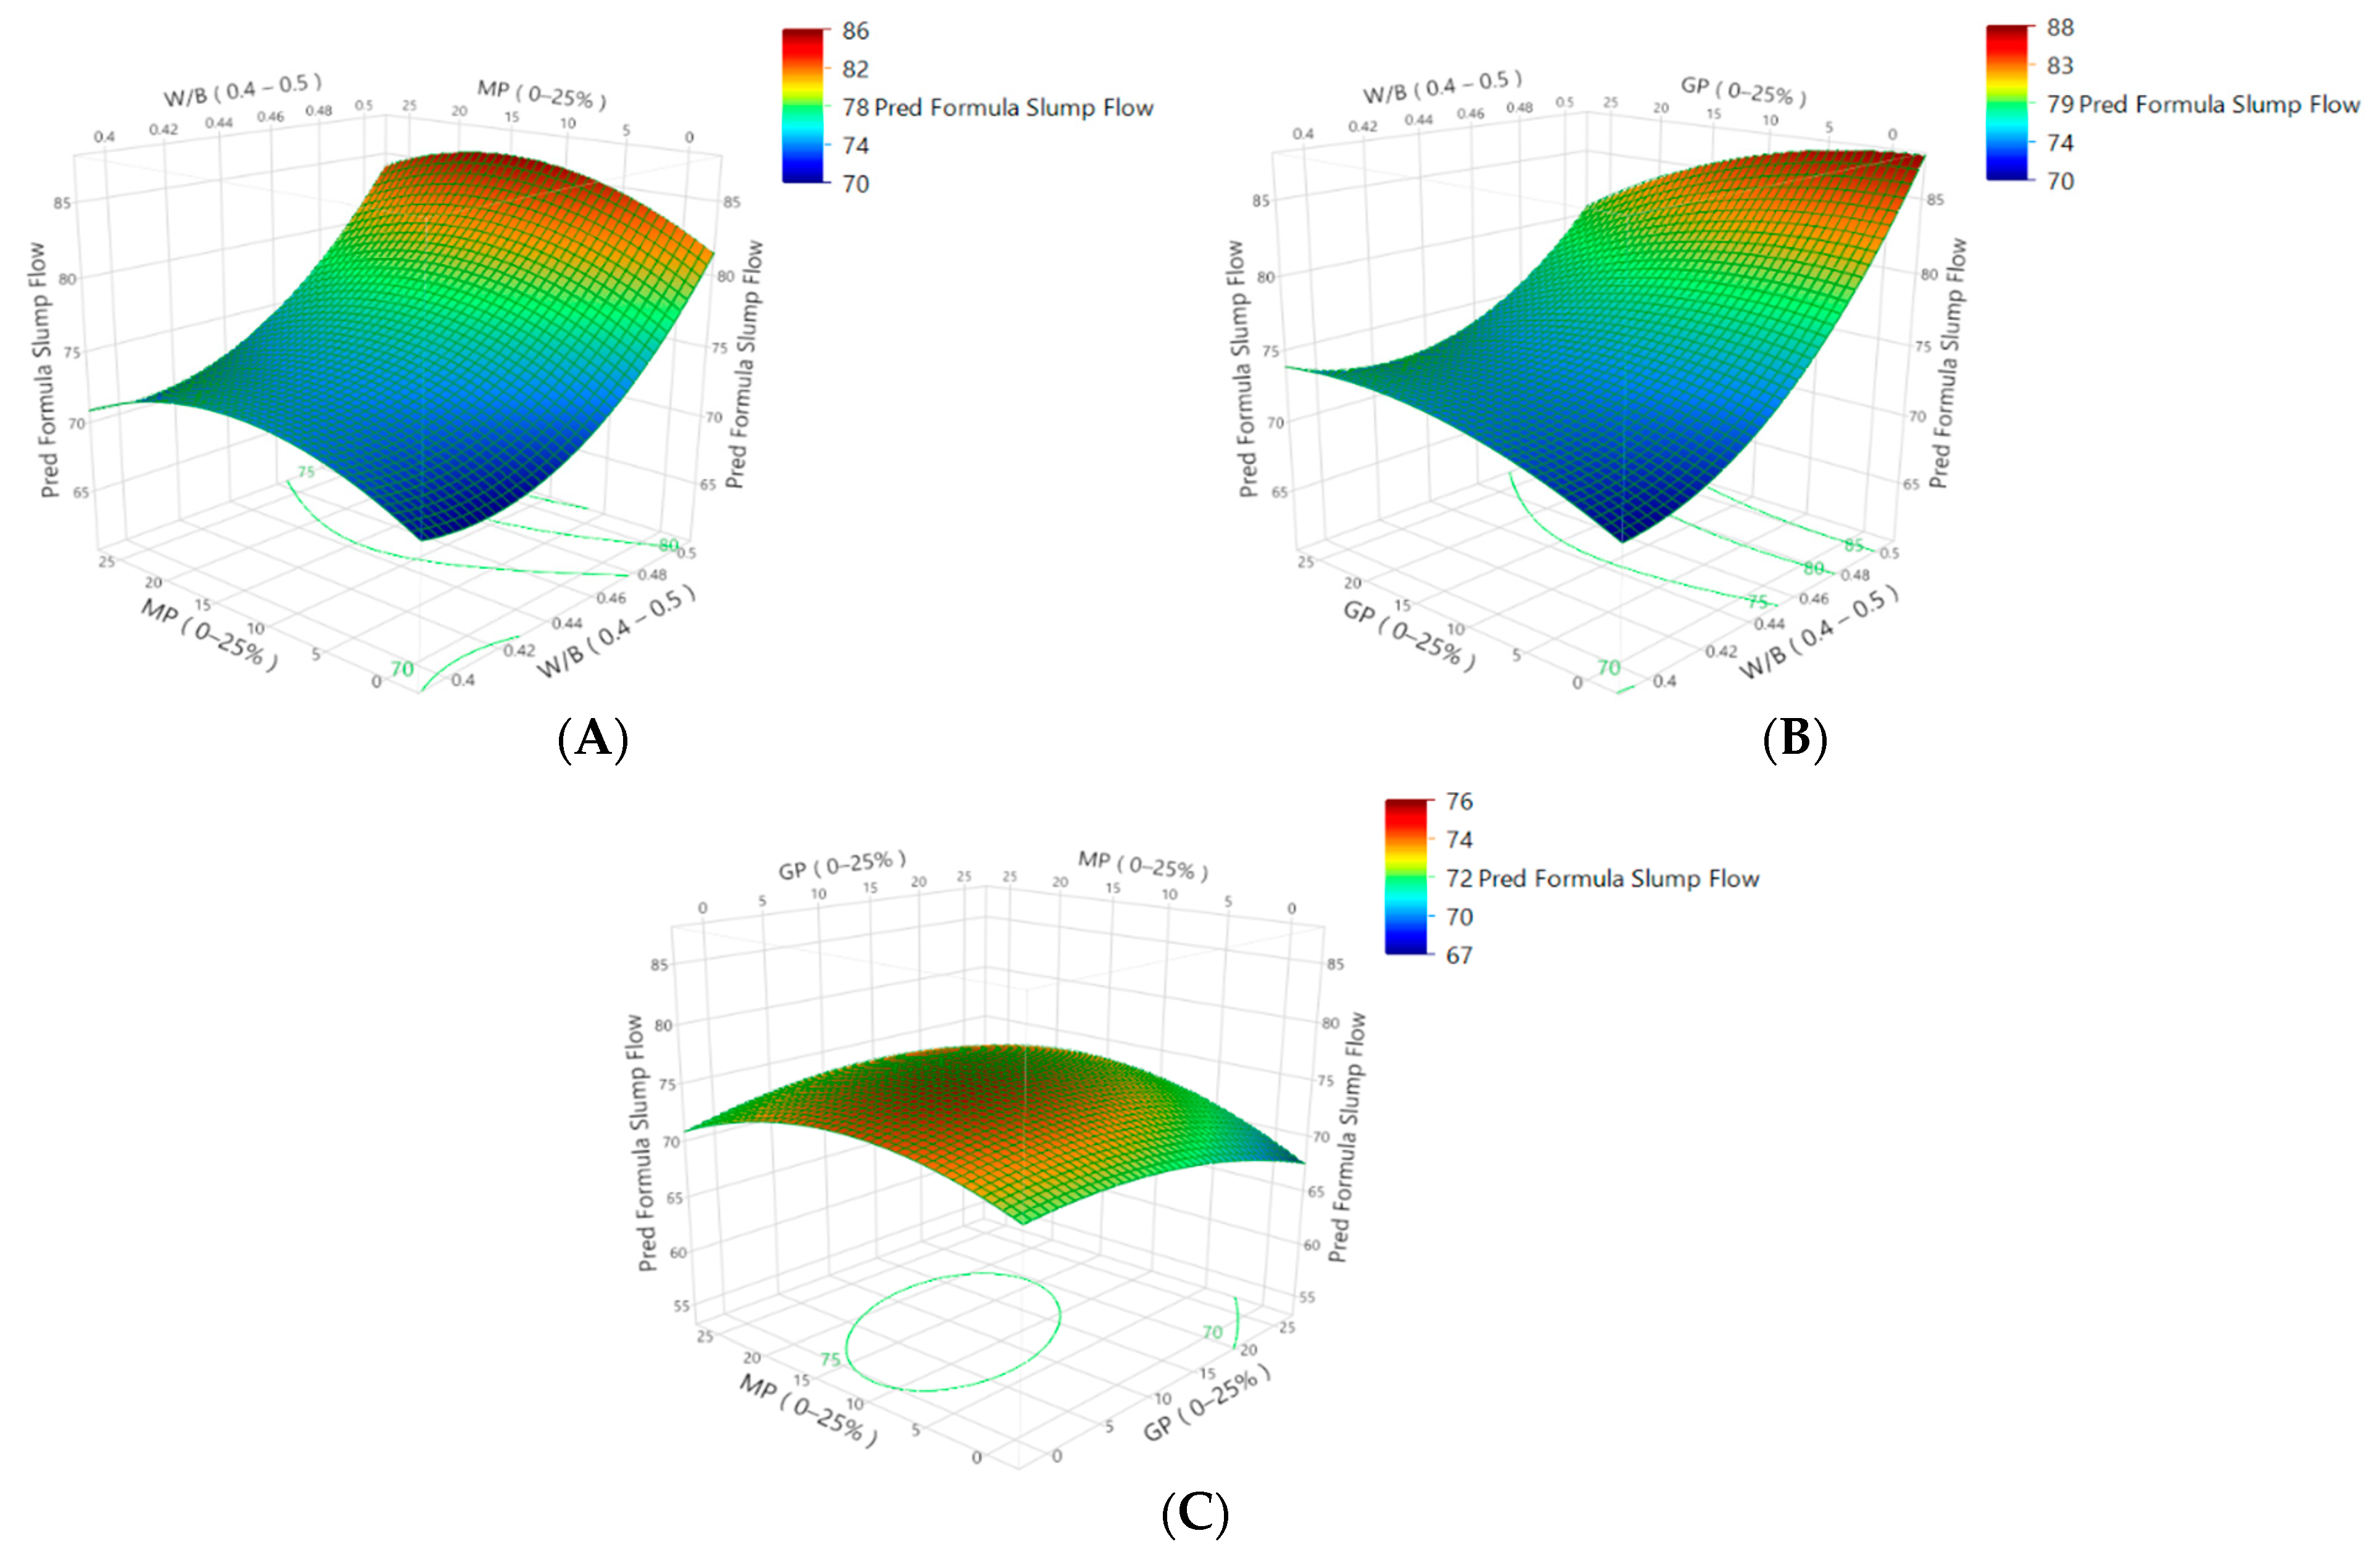
3.1. Modeling of Fresh Properties Tests

To designate a particular type of concrete as self-compacting, it is necessary to ensure that it meets the criteria for both filling and passing ability, as well as for segregation resistance. This ensures that the concrete can flow freely without the restriction of formwork or reinforcement, while also maintaining a consistent composition in its fresh state (see Figure 3) [39]. The experimental results reported in Table 4 show that, despite the reduction in the quantity of cement accompanied by the increase in the quantity of glass powder and/or marble powder, all the concretes have values consistent with those prescribed by the European Guide to Self-Compacting Concretes. This is considered an advantageous gain, making it possible to reduce CO2 emissions from cement production and to reduce the quantity of marble and glass waste products disposed of into the environment.
According to the central composite design, the investigation was conducted to determine the impact of process variables on the fresh properties of self-compacting concrete mixtures. The aim was to predict the fresh properties based on different parameter values, as outlined in (Table 4).
Table 4 shows that the experimental and the predicted values for the different responses are very close, and that this was explained by the high R2 values.
Figure 3. Fresh properties tests of SCC.
Sustainability 16 01972 g003
Table 4. The experimental design layout and corresponding responses for the central composite design (CCD) based on the response surface methodology (RSM), along with the predicted values for the fresh properties tests.
MixtureIndependent VariablesFresh Properties
E/BBinderWSlump Flow [cm]L-Box [%]Sieve Stability [%]Density [Kg/m3]
CMPGPExperimentalPredictedExperimentalPredictedExperimentalPredicted
Mix 10.404000016068.0069.2090%88%12%12%2366
Mix 20.4032008016069.0069.8077%79%13%14%2468
Mix 30.4032080016066.0068.1057%71%12%12%2490
Mix 40.40240808016071.0072.4594%73%11%12%2490
Mix 50.504000020083.0082.7583%85%22%22%2381
Mix 60.5032008020076.5075.6084%85%23%24%2469
Mix 70.5032080020082.5082.9085%84%23%23%2542
Mix 80.50240808020079.5079.5092%95%22%23%2552
Mix 90.40320404016079.0073.4580%81%13%12%2551
Mix 100.50320404020083.0083.7594%91%24%22%2515
Mix 110.4536004018073.5072.6586%85%16%15%2438
Mix 120.45280804018078.0074.0575%82%16%14%2617
Mix 130.4536040018078.5075.0587%89%14%14%2632
Mix 140.45280408018075.0073.6593%90%17%14%2557
Mix 150.45320404018072.5075.6387%88%12%14%2576
Mix 160.45320404018072.3075.6389%88%13%14%2561
Mix 170.45320404018072.5075.6389%88%11%14%2554
W: water, C: cement, B: binder (cement + MP + GP).
The experimental results obtained from the central composite design (CCD) were used to formulate a second-order polynomial equation to represent the responses. This equation enables the prediction of the slump flow, L–box, and sieve stability tests. The final equations, represented in terms of coded factors, are provided in the following equations:
Yslump flow = 75.63 + 5.15 X1 + 0.7 X2 − 0.7 X3 + 0.3125 X1X2 − 1.9375 X1X3 + 0.9375 X2X3 + 2.97 X12 − 2.28 X22 − 1.28 X32
YL-box = 0.88 + 0.047 X1 − 0.016 X2 + 0.006 X3 + 0.039 X1X2 − 0.022 X1X3 + 0.028 X2X3 − 0.021 X12 − 0.049 X22 + 0.013 X32
Ysieve stability = 0.1397+ 0.053 X1 − 0.002 X2 + 0.003 X3 + 0.0025 X1X2 − 1.73× 10−18 X1X3 − 0.005 X2X3 + 0.0305 X12 + 0.0055 X22 + 0.0005 X32

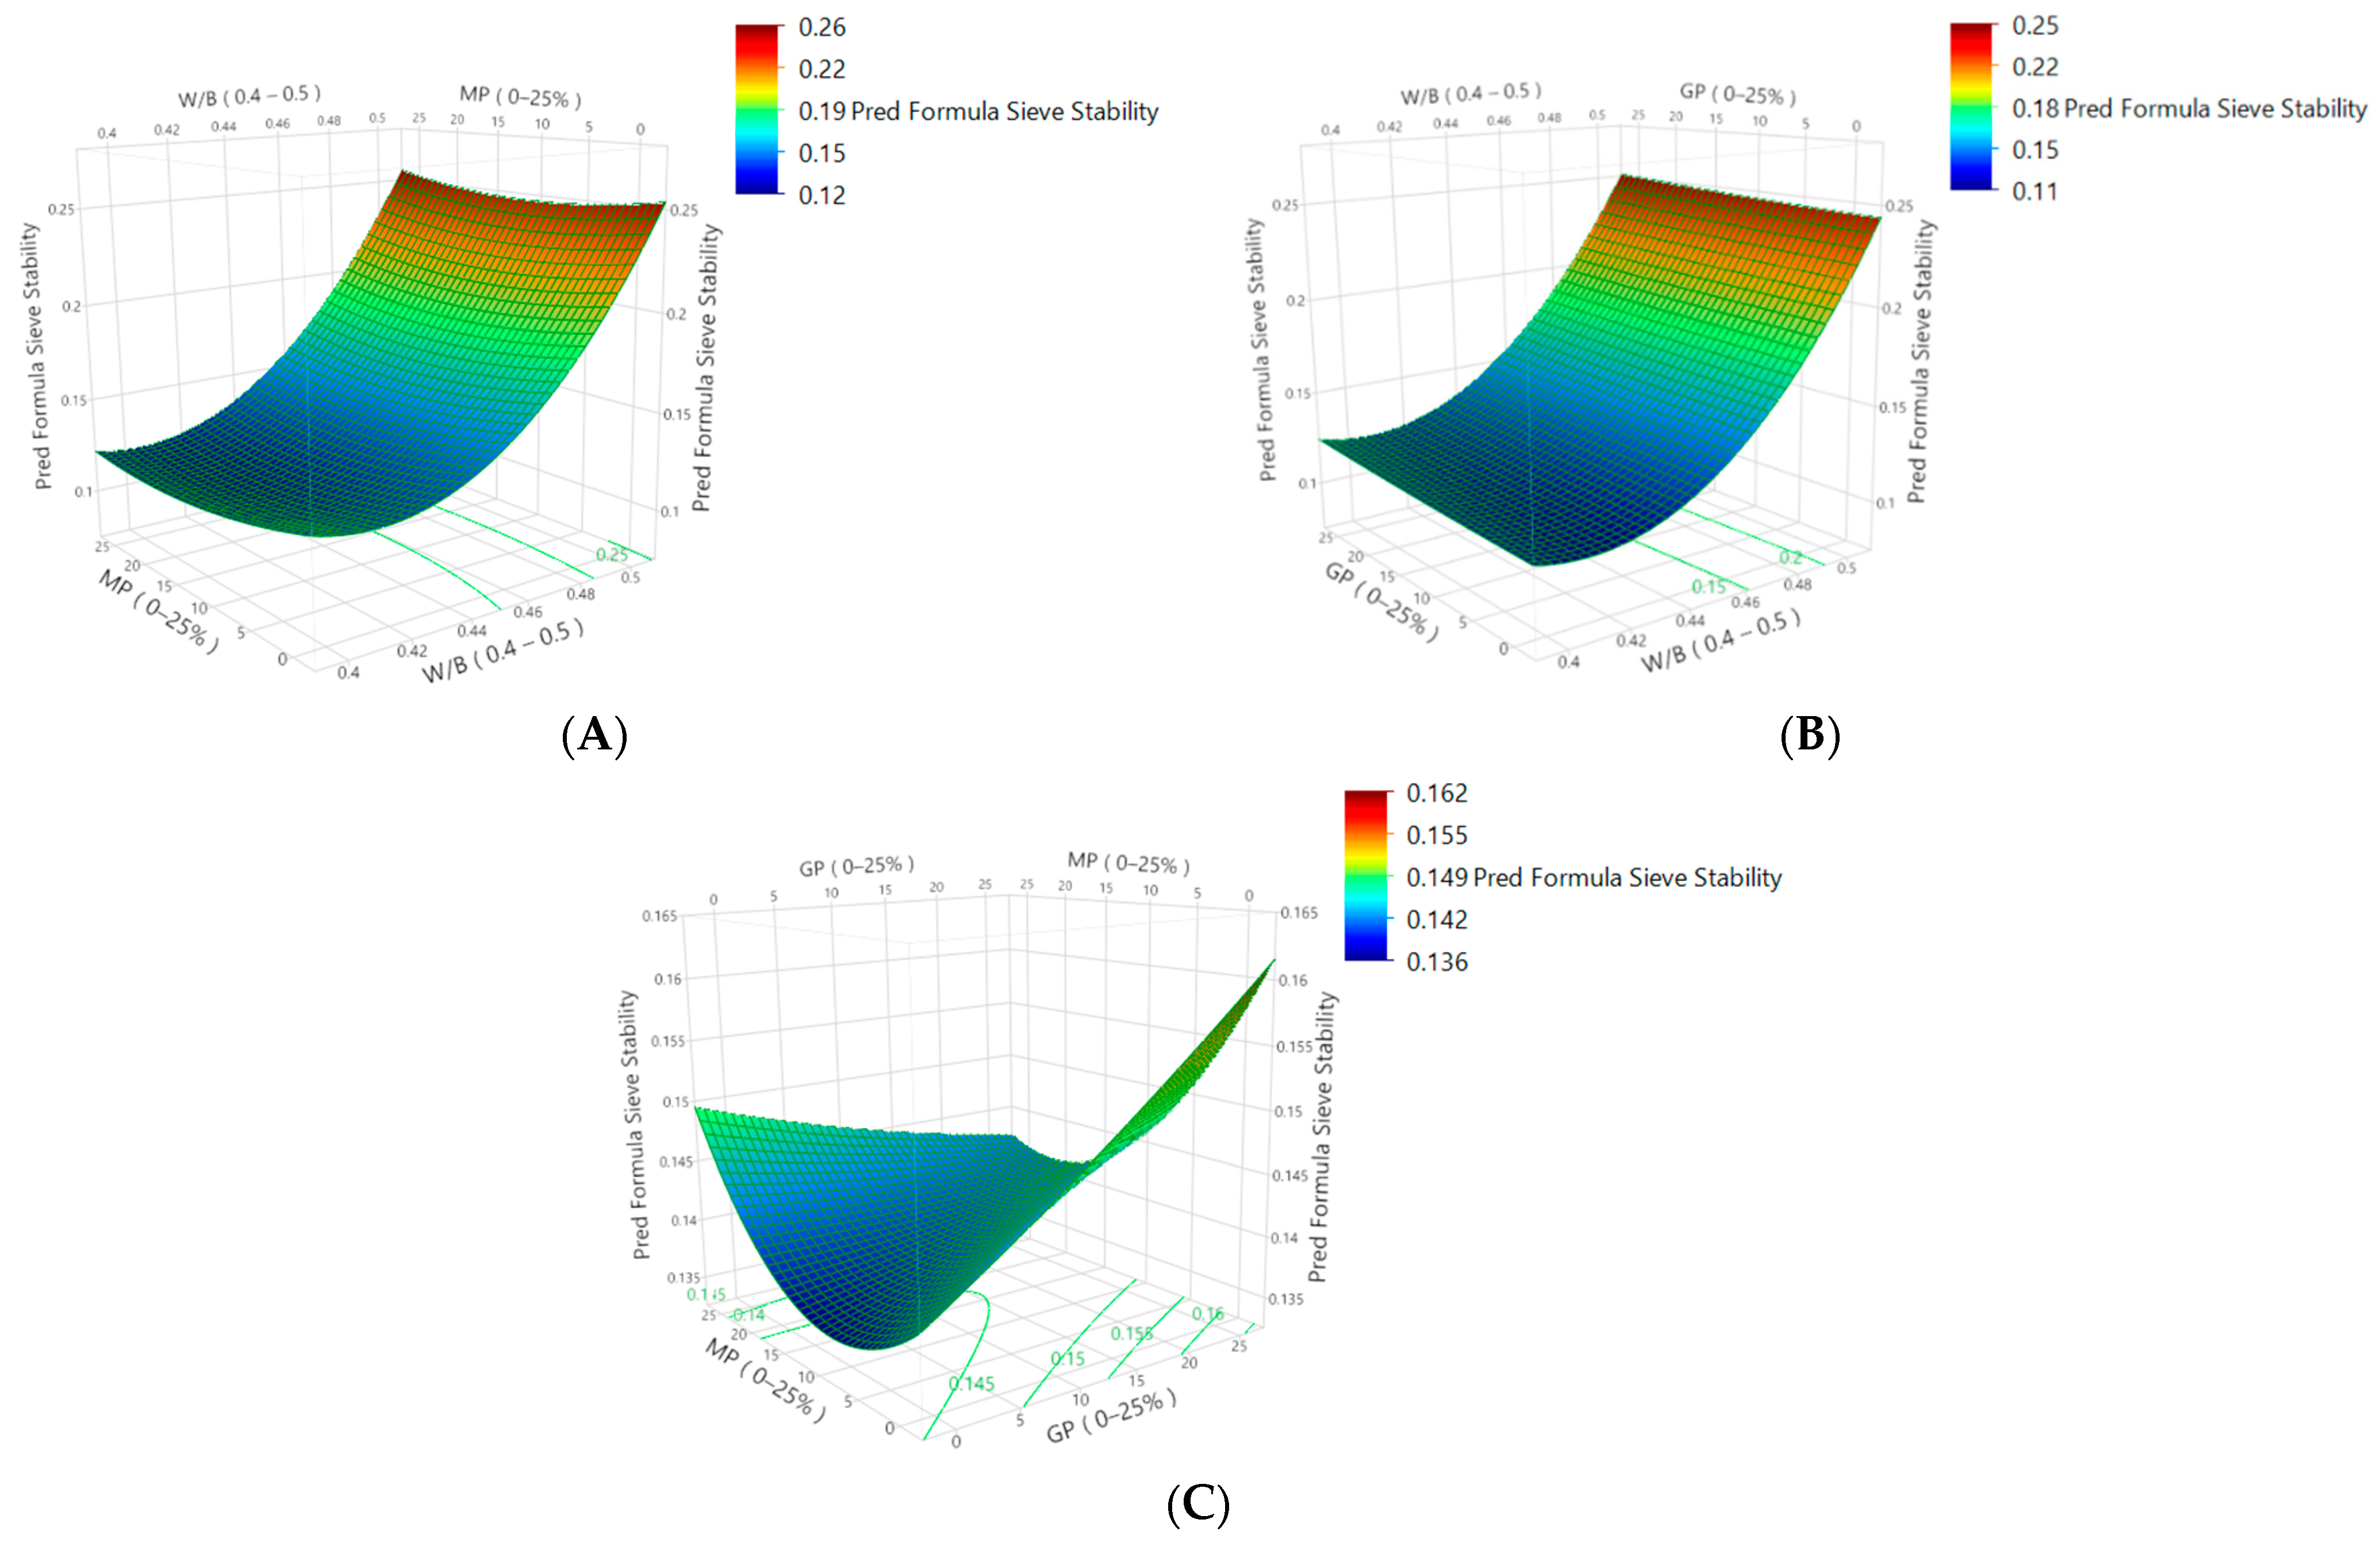
3.2. Analysis of Fresh Properties Tests

The results of the analysis of variance (ANOVA) for the fitting model are presented in (Table 5). These results indicate that the equations adequately represent the actual relationship between the independent variables and the responses [40]. The model’s adequacy and fitness were evaluated by calculating the coefficients of determination (R2) and adjusted coefficients (R2 adj). The results also suggest that there are strong correlations between the predicted and experimental models.
R 2 = 1 S S r e s   ( s q u a r e d   s u m   r e s i d u a l s ) S S t o t   ( s q u a r e d   s u m   t o t a l )
R 2 a d j = 1 1 R 2 n 1 n 1 p ( n : number of samples ) ( p : number of features )
It can be observed in (Figure 4) that the points align with the fitting line, that there are high values for the correlation coefficient and adjusted coefficient, and that there is at least one significant effect in this model (Prob. > F) lower than 5%, regardless of the types of tests. (Table 5). The significance or high significance of each coefficient was assessed using p-values of 0.05 and 0.01.
Table 5. The experimental results include the analysis of variance (ANOVA) and statistics from the full regression models.
DFSlump FlowL-boxSieve Stability
Sum of SquaresF-ValueProb > FSsF-ValueProb > FSsF-ValueProb > F
Model9334.9382.63680.10730.06008.38950.0052 *0.03328.15300.0057 *
X11265.22518.24700.0037 *0.021727.33560.0012 *0.028162.0670.0001 *
X214.90000.33710.57970.00273.28450.11280.000040.08840.7749
X314.90000.33710.57970.00030.41870.53820.000090.19890.6691
X1X210.78130.05370.82330.012215.32360.0058 *0.000050.11050.7493
X1X3130.03132.06610.19380.00394.92540.06192.4074 × 10−350.00001.0000
X2X317.031250.48370.50920.00648.01570.0254 *0.00020.44190.5275
X12123.60661.62410.24320.00111.43100.27050.00255.50450.0514
X22113.94850.95960.35990.00658.19250.0243 *0.0000810.17860.6852
X3214.40130.30280.59920.00050.58210.47040.000000650.00140.9708
Residual7101.7467 0.0056 0.00317
Lack of Fit5101.72001525.800>0.00070.00560.00000.00000.002975.9361>0.1504
Pure Error20.0267 0.0000 0.0002
R2 0.7722 0.9152 0.91291
R2 adj 0.4793 0.8061 0.8009
Adeq pre
RMSE
3.8125 0.0282 0.0213
Cor Total16446.6847 0.0656 0.03638
Ss: Sum of squares, *: (Prob. > F) lower than 5%.
Figure 4. The correlations between the predicted and observed values for: (A) slump flow; (B) L-box; and (C) sieve stability tests.
Sustainability 16 01972 g004
The optimal W/B ratio, marble powder ratio (MP), and glass powder ratio (GP) for each of the slump flow, L–box, and sieve stability tests were determined using ISO response curves and response surfaces. The ANOVA results for our model in the slump flow test indicate a p-value > 0.05, suggesting that the model is not statistically significant. However, it is worth noting that the p-value for X1, which represents E/B, is less than 0.01, indicating that it is highly significant. As shown in (Table 5), the model in the L-box test indicates a p-value < 0.01, demonstrating that it is highly statistically significant. This is further supported by the highly significant effect of the linear parameters (X1) and the mutual interactions (X1X2) on the L-box test (p-value < 0.01). Additionally, the mutual interactions (X2X3) and the quadratic term coefficients X32 exhibit a significant effect on this test (p-value < 0.05), while the remaining coefficients do not show statistical significance (p-value > 0.05). The model in the sieve stability test demonstrates a p-value < 0.01, indicating a high level of statistical significance. It should be noted that the p-value for X1, is less than 0.01, indicating high statistical significance. The response plots were generated by plotting the response (z-axis) against two independent variables (x and y coordinates), while keeping the other independent variables constant at their minimum levels within the testing ranges [29]. By examining (Figure 5A, Figure 6A and Figure 7A), we can observe the development of 3-D response surface plots for the slump flow and sieve stability tests. During this process, the E/B ratio was varied within the range of 0.4 to 0.5, while the MP was varied between 0 and 25%, and the GP was fixed at 12.5%. As we expected, the prediction for slump flow diameters was 78 cm, and the prediction for the sieve stability test was 19%. However, E/B varied from 0.4 to 0.5, and GP varied between 0 and 25%, while the MP was fixed at 12.5% (Figure 5B, Figure 6B and Figure 7B). The prediction of the slump flow diameters and sieve stability test was improved by 79 cm and 18%, respectively.
Furthermore, when both the MP and GP varied between 0 and 25% and the E/B ratio was fixed at 0.45, the slump flow diameters and sieve stability test decreased to 72 cm and 14.9%, respectively (Figure 5C, Figure 6C and Figure 7C). Based on the analysis of response surfaces and main effect plots, it can be observed that increasing the E/B ratio resulted in an increase in the flow diameter of the concrete. However, both marble powder and glass powder can help to reduce the risk of segregation. The previously found p-value for E/B confirmed its high significance in these two tests. From (Figure 6A), when developing the 3-D response surface plot for the L–box test, we observed that fixing the value of MP at 12.5% resulted in a lower prediction of 78% for the L–box test. However, when we fixed the GP at 12.5% or the E/B ratio at 0.45, values of 88% and 84% were obtained, respectively (Figure 6B,C). This is probably due to the presence of spherical marble powder particles in the fresh concrete, which created a ball-bearing effect, leading to a reduction in internal friction and an improvement in the flowability and compaction properties of the concrete [37].
Figure 5. Response surface plot for slump flow, according to RSM: (A) as a function of MP and W/B; (B) as a function of GP and W/B; and (C) as a function of MP and GP.
Sustainability 16 01972 g005
Figure 6. Response surface plot for L-box, according to RSM: (A) as a function of MP and W/B; (B) as a function of GP and W/B; and (C) as a function of MP and GP.
Sustainability 16 01972 g006
Figure 7. Response surface plot for sieve stability, according to RSM: (A) as a function of MP and W/B; (B) as a function of GP and W/B; and (C) as a function of MP and GP.
Sustainability 16 01972 g007

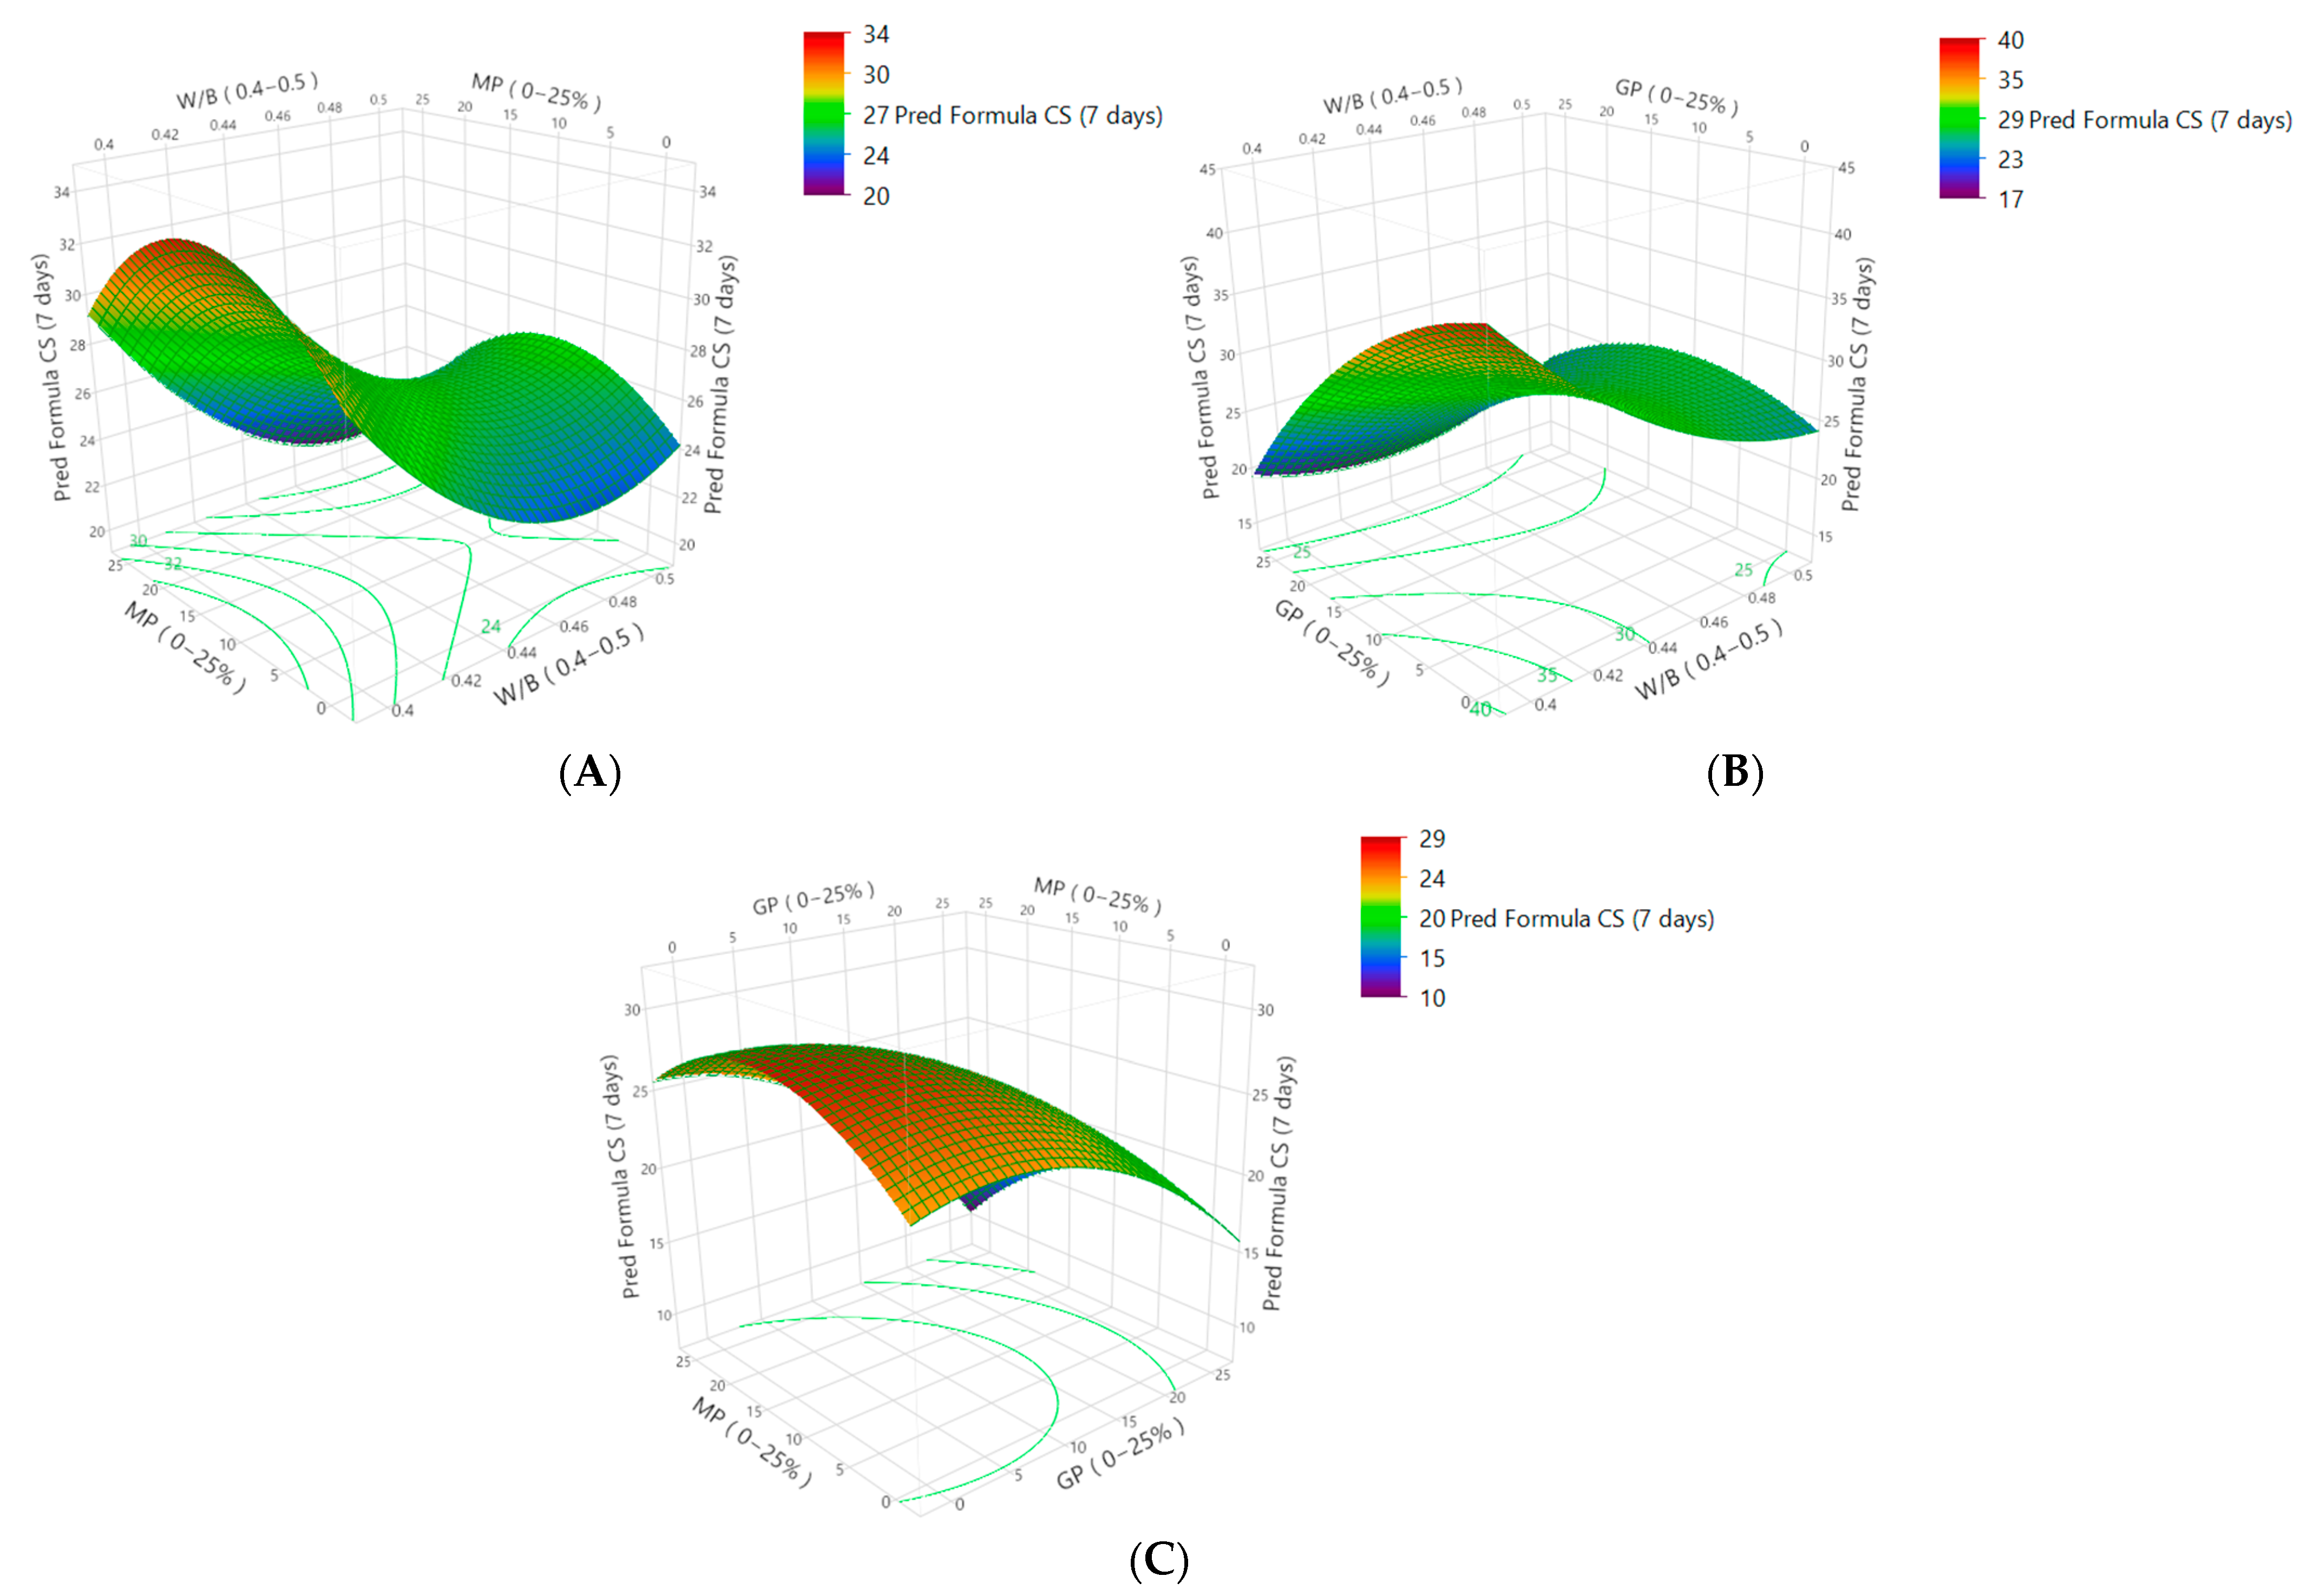
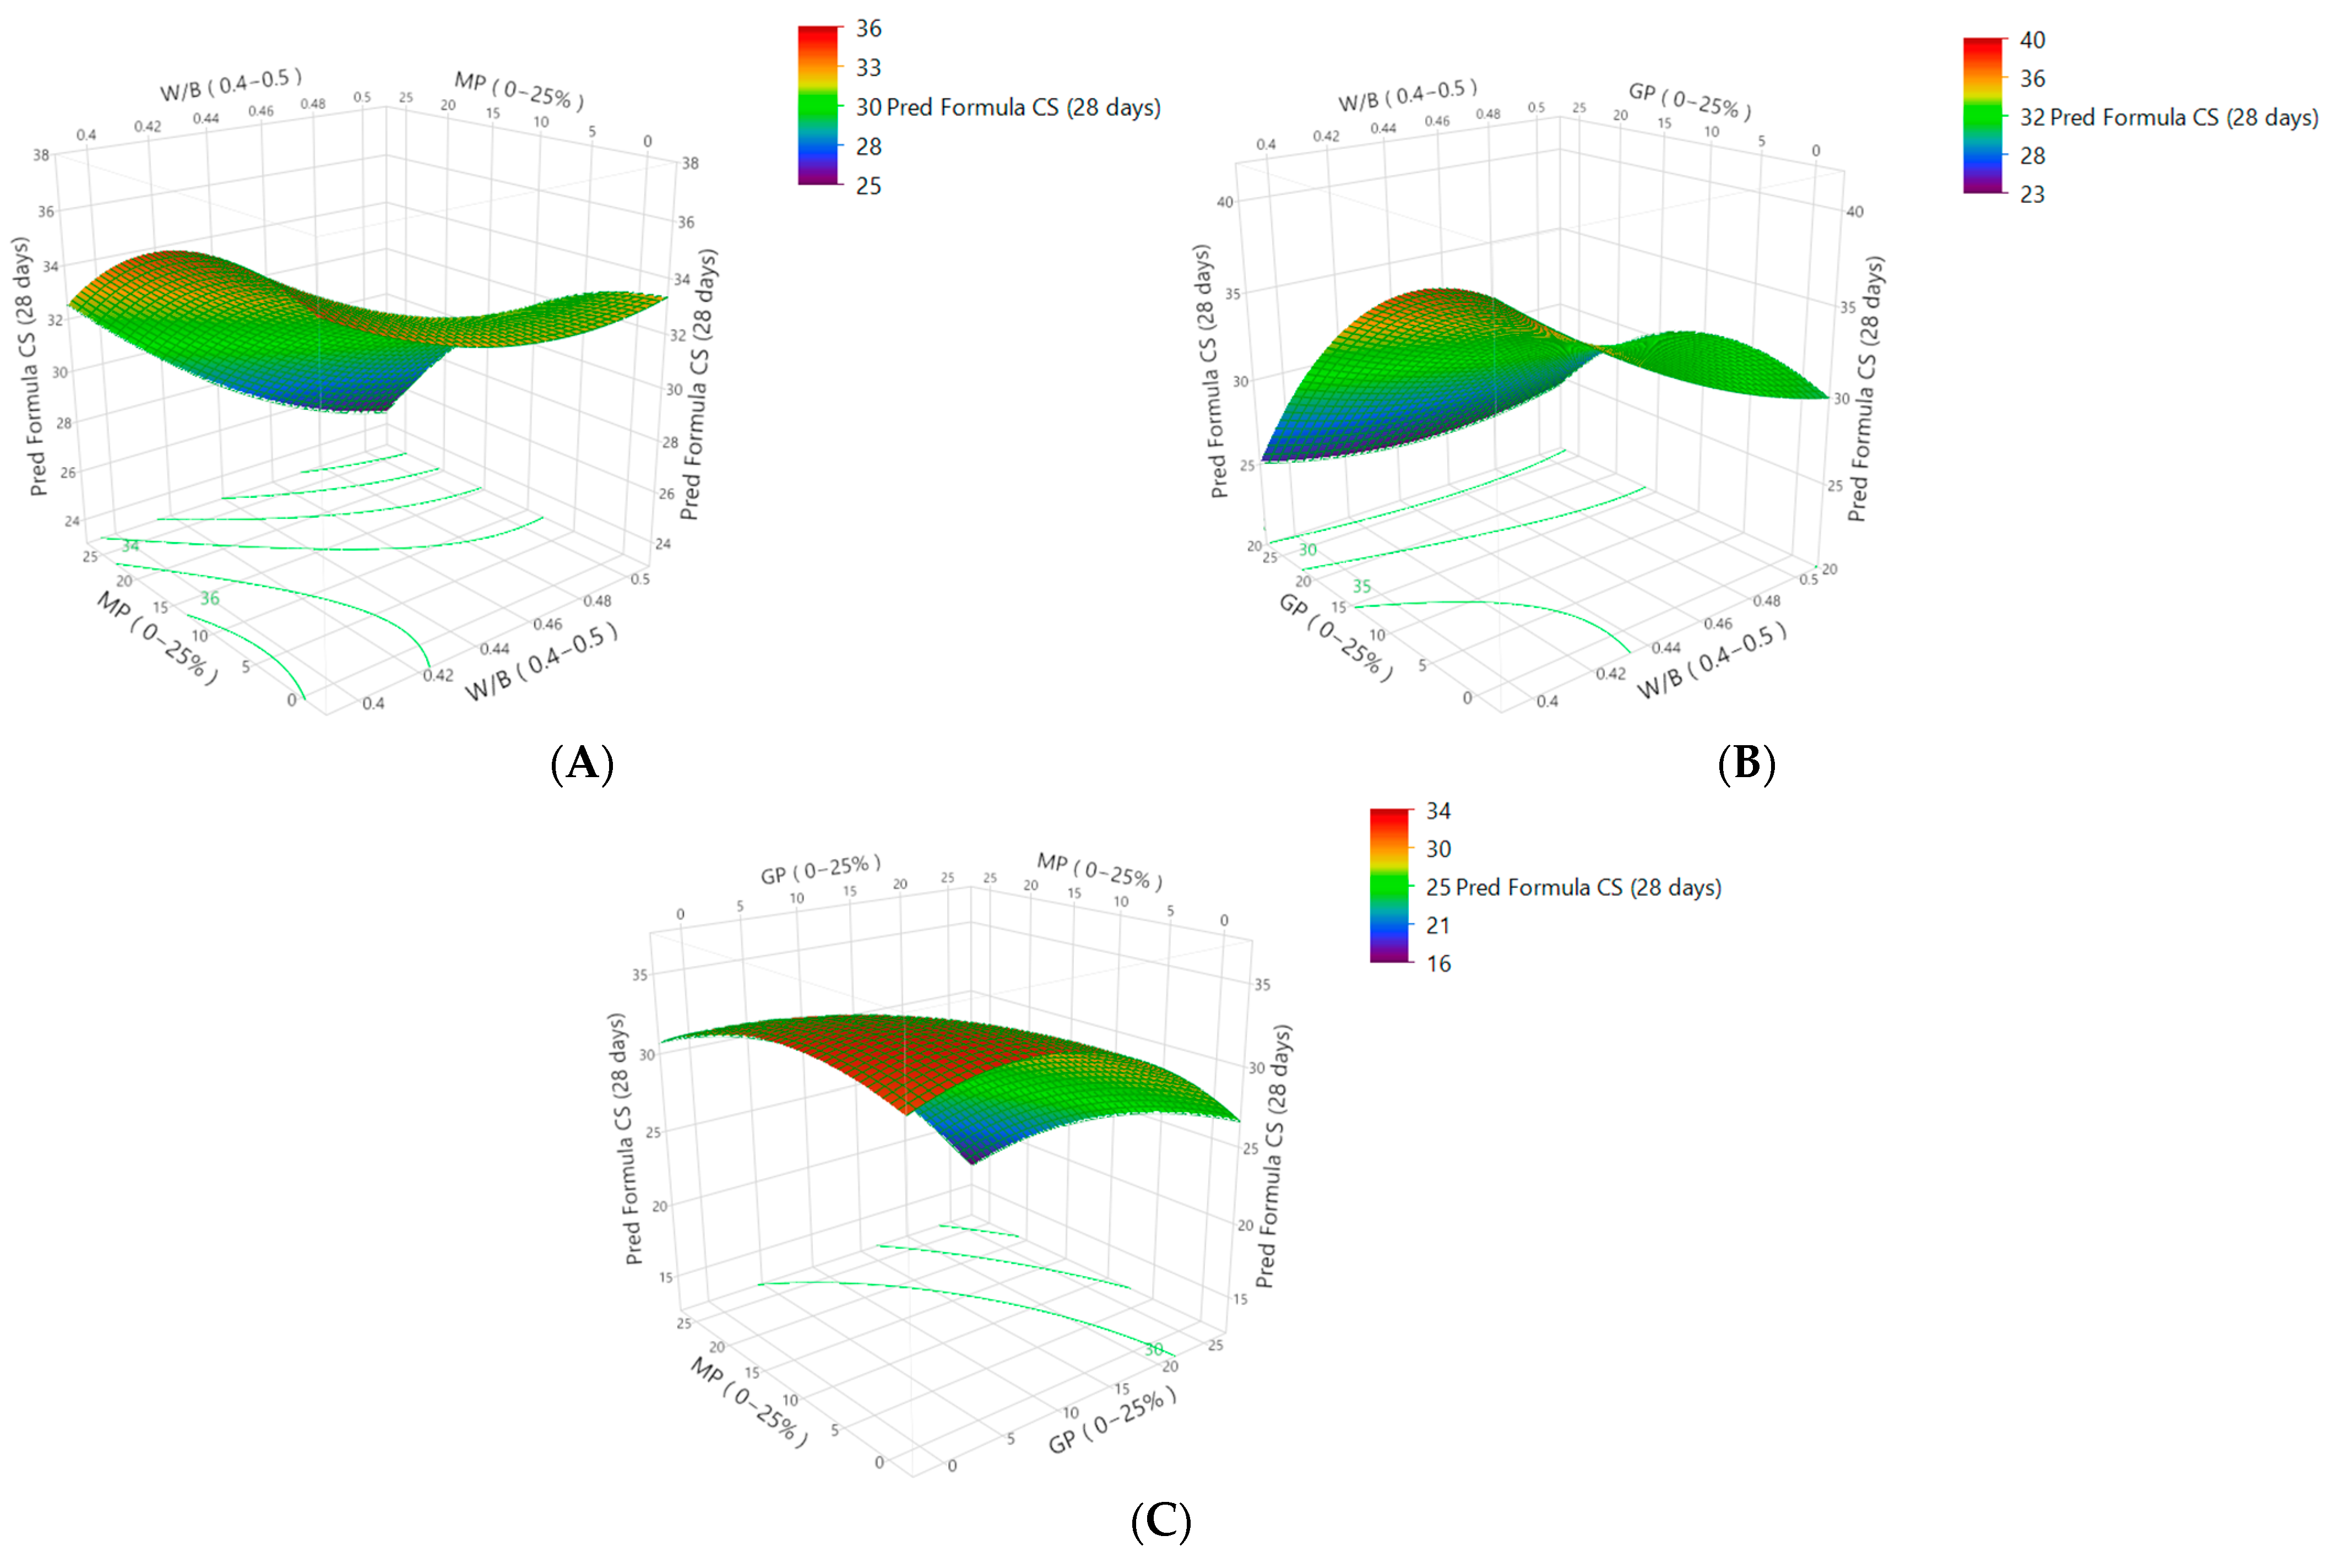
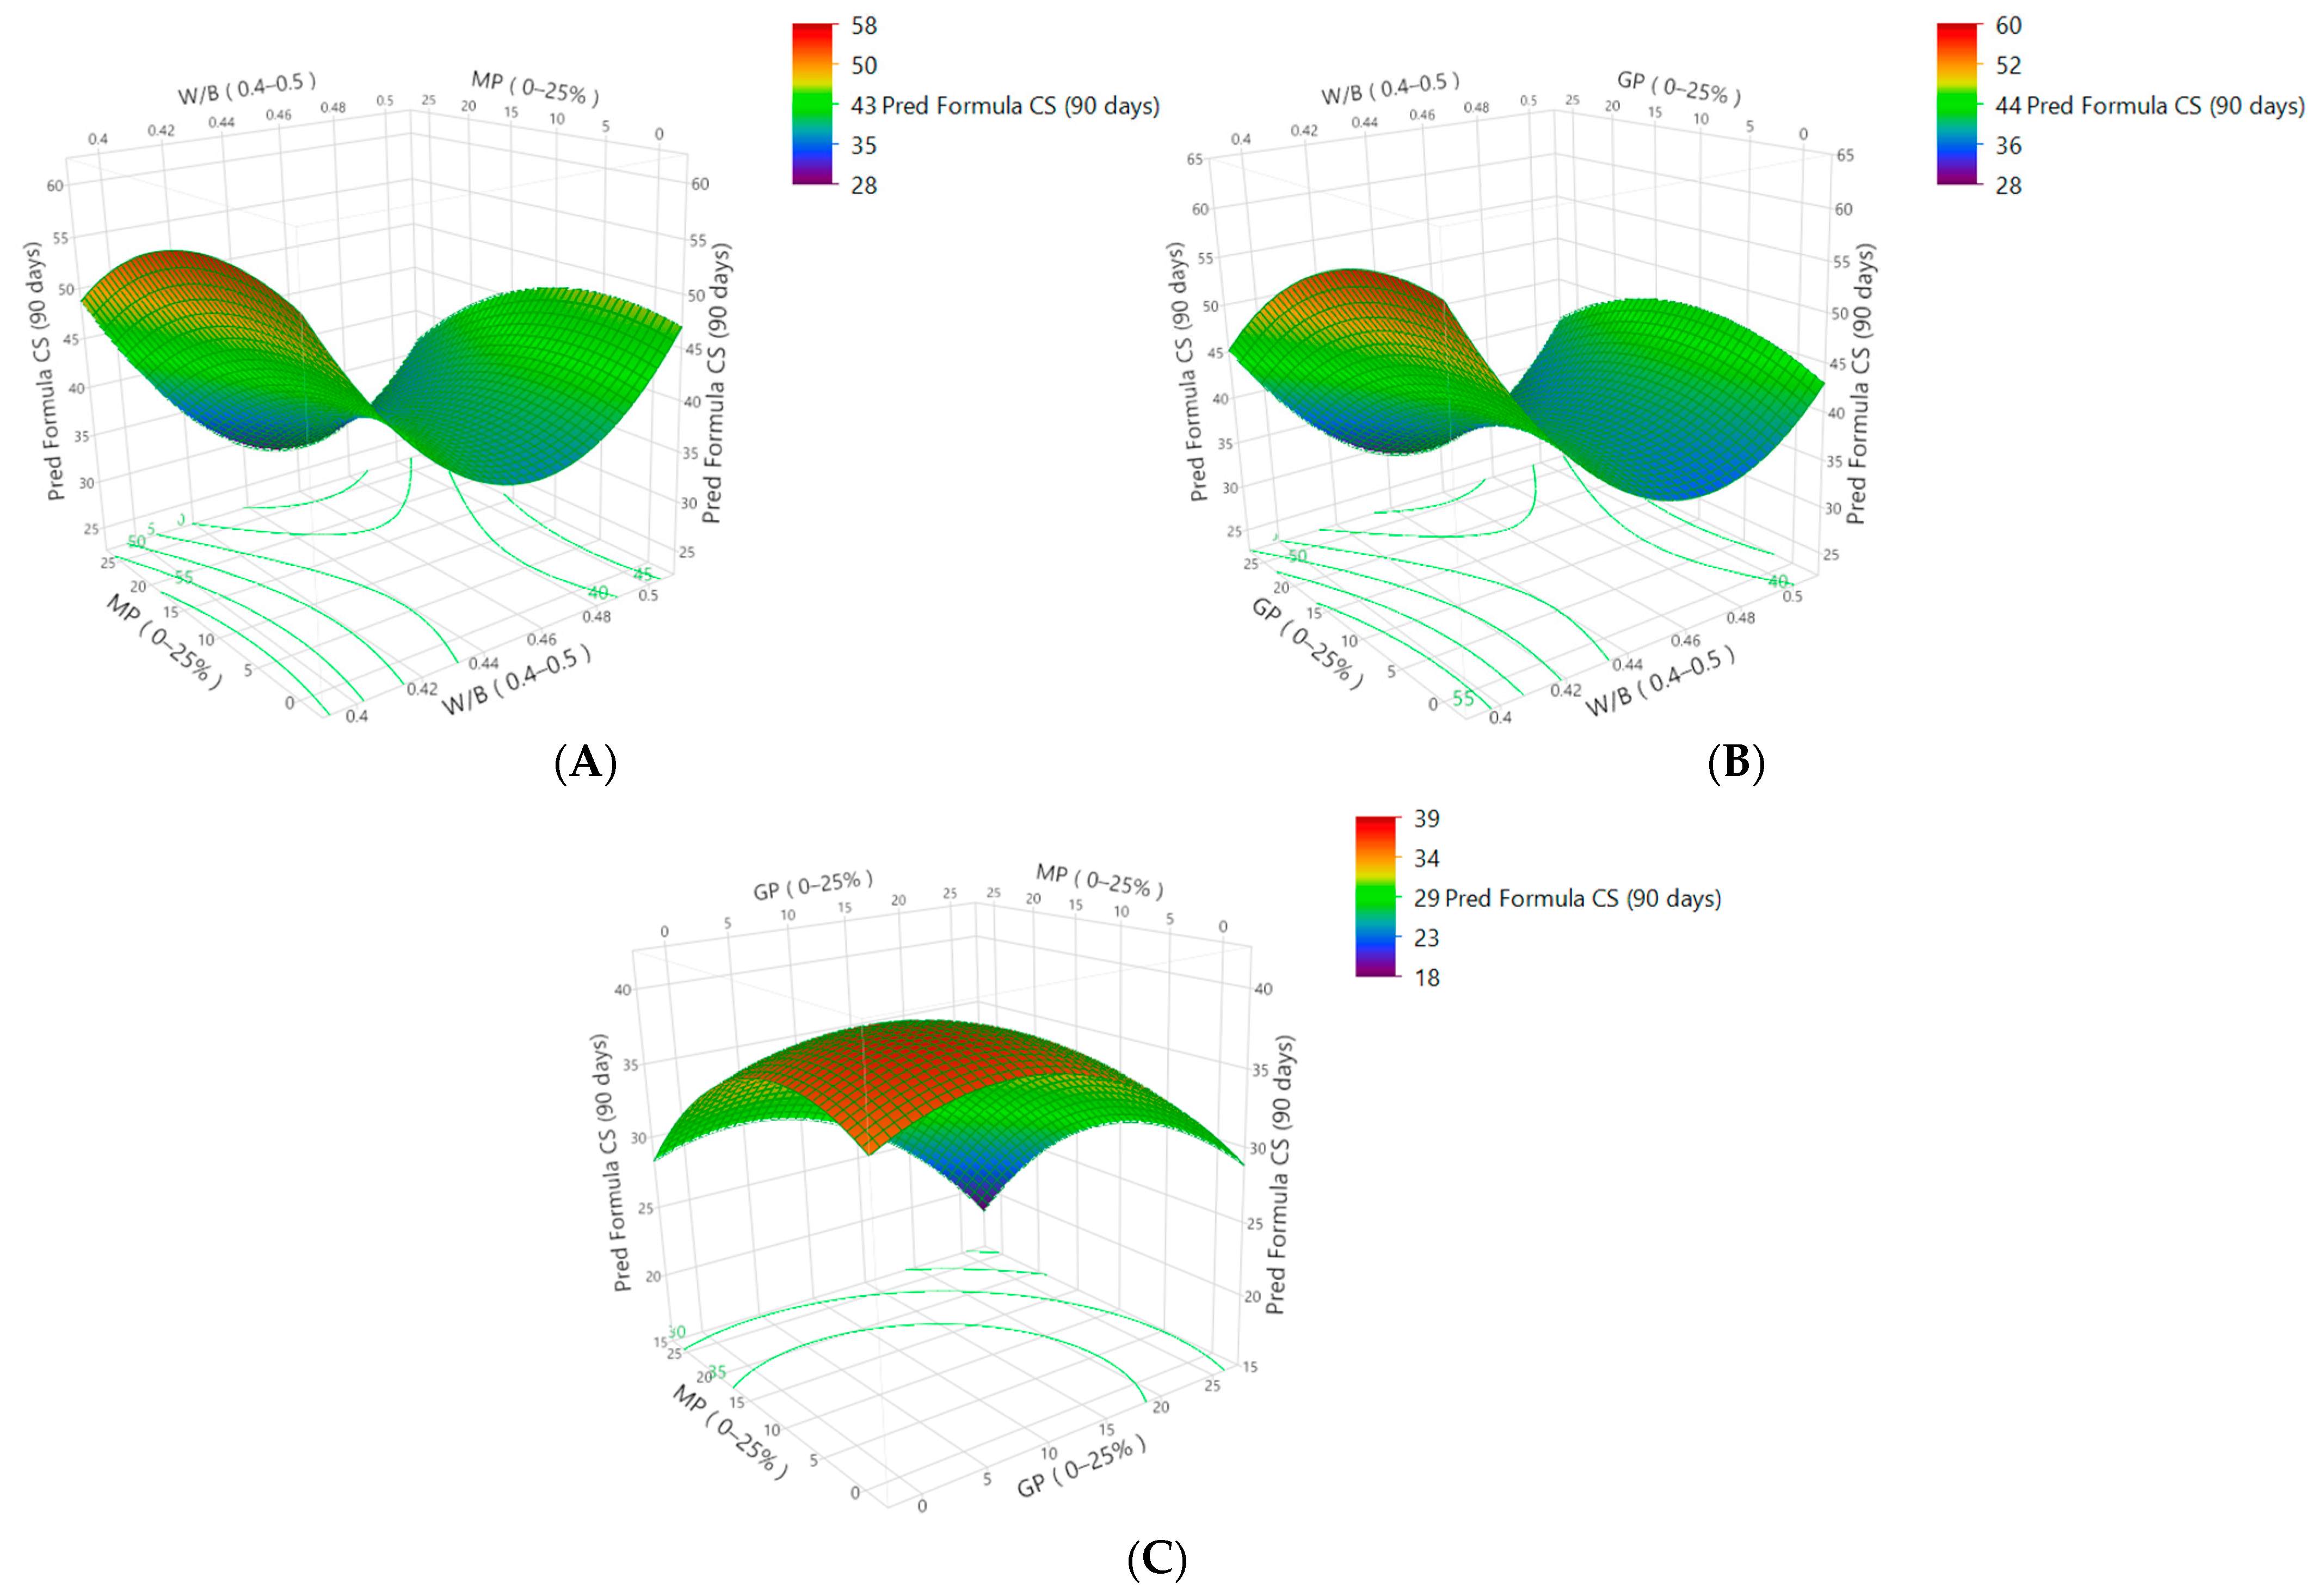
3.3. Modeling of Hardened Properties Tests

According to the central composite design, the study aimed to assess how process variables affect the hardened properties of self-compacting concrete mixtures. The goal was to make predictions about compressive strength based on various parameter values, as detailed in (Figure 8 and Table 6).
The experimental results obtained from the central composite design (CCD) were used to create a quadratic equation that represents the responses. This equation allows for the prediction of the compressive strength at 7, 28, and 90 days. The equations in terms of coded factors are presented in the following provided equations:
YCS (7 days) = 26.7437 − 2.9001 X1 − 0.8227 X2 − 4.9319 X3 − 0.4459 X1X2 + 3.2564 X1X3 − 1.2891 X2X3 + 2.3821 X12 − 2.8899 X22 − 2.6579 X32
YCS (28 days) = 32.2085 − 2.1554 X1 − 2.4899 X2 − 4.1977 X3 − 0.97 X1X2 + 1.60325 X1X3 − 1.4605 X2X3 + 0.8917 X12 − 1.3658 X22 − 2.5518 X32
YCS (90 days) = 37.5617 − 4.433 X1 − 3.7483 X2 − 3.5364 X3 − 0.5546 X1X2 + 1.9721 X1X3 − 0.6461 X2X3 + 9.9735 X12 − 3.381 X22 − 3.5225 X32

3.4. Analysis of Hardened Properties Tests

The correlation coefficient and adjusted coefficient exhibit high values (Figure 9), and at least one significant effect is evident in these models (Prob. > F) at a level lower than 5%, regardless of the types of tests (Table 7). The significance of each coefficient was evaluated using p-values of 0.05 and 0.01.
The optimal W/B, marble powder (MP), and glass powder (GP) ratios for compressive strength at 7, 28, and 90 days were determined using ISO response curves and response surfaces. The ANOVA results for our models in the compressive strength tests at 7 and 90 days indicated a p-value less than 0.05, suggesting that the models are statistically significant. However, for 28 days, it is noteworthy that the p-value was less than 0.01, indicating a high level of statistical significance. It should be noted that for compressive strength at 28 and 90 days, all linear parameters exhibited statistical significance and high statistical significance, while the (X2) coefficient did not show statistical significance (p-value > 0.05) for compressive strength at 7 days. As for mutual interactions, we observed the presence of one statistically significant coefficient (X1X2) at 7 days, and that one quadratic term coefficient (X22) exhibited a highly statistically significant effect on the 90-day test (p-value < 0.01). By examining (Figure 10A, Figure 11A and Figure 12A), we can observe the 3-D response surface plots depicting the development of compressive strength at 7, 28, and 90 days. During this process, the E/B ratio was varied within the range of 0.4 to 0.5, while the MP was varied between 0 and 25%, and the GP was fixed at 12.5%. The predicted values were 27, 30, and 43 MPa, respectively. However, when the E/B ratio varied from 0.4 to 0.5, and GP varied between 0 and 25%, while keeping the MP fixed at 12.5% (Figure 10B, Figure 11B and Figure 12B), the predictions were 27, 32, and 44 MPa, respectively. Furthermore, when both the MP and GP were changed between 0 and 25% and the E/B Ratio was fixed at 0.45, compressive strength decreased to 17, 25, and 29 MPa, respectively (Figure 10C, Figure 11C and Figure 12C).

4. Conclusions

The aim of this study was to investigate the impact of cement content and the proportion of recycled marble and glass powder on the fresh and hardened properties of self-compacting concrete, using the response surface methodology (RSM). The study yielded the following key findings:
  • The results indicate that incorporating MP and GP in SCC necessitates the use of a high volume of superplasticizer admixture to counteract the workability loss;
  • The ANOVA results indicate that our models in the slump flow test did not show statistical significance (p-value > 0.05). However, both the sieve stability and L-box tests exhibited a highly statistically significant effect (p-value < 0.01);
  • The high significance of the linear parameters (X1) and the combined effects (X1X2) on the L-box test (p-value < 0.01) is noteworthy. Additionally, the combined effects (X2X3) and the quadratic term coefficients X32 demonstrate a significant effect on this test (p-value < 0.05). These results offer limited evidence that the inclusion of MP and GP improves the fresh properties of self-compacting concrete;
  • The ANOVA results indicate that our models for compressive strength in the 7- and 90-day tests did demonstrate statistical significance (p-value < 0.05). However, the compressive strength in the 28-day test exhibited a highly statistically significant effect (p-value < 0.01);
  • The examination of coefficients through the RSM method confirms its efficacy as a predictive instrument for assessing the hardened characteristics of self-compacting concrete.
Our research focused on examining the fresh and hardened properties of self-compacting concrete using three variables. We tested different amounts, ranging from 0 to 25 percent, for each of the two powders under study to make predictions about the results. Additionally, we employed the response surface methodology (RSM) to collect a larger amount of information and expectations, while also reducing the number of trial mixtures required. This method also proved effective for prediction, as evidenced by the determination of coefficients (R2), adjusted coefficients (R2 adj), and the p-values.
The response surface methodology has proven to be highly effective in the examination and prediction of the hardened properties of SCC. Future research can investigate varying proportions of marble and glass powder, while also incorporating the specific surface area (Blaine value) as a variable within the study. Furthermore, upcoming research could concentrate on the analysis and prediction of the durability characteristics of self-compacting concrete. Moreover, research is needed to study and predict the behavior of fiber-reinforced self-compacting concrete (FRSCC), which has rarely been studied in previous work.

Author Contributions

Conceptualization: C.B. and Y.A.; methodology: Y.A., C.B. and A.H.; software: Y.A., C.B. and A.H. validation: All authors; formal analysis: All authors; investigation: All authors; resources: Y.A., C.B., S.Z. and A.H.; data curation: All authors; writing—original draft preparation: Y.A., C.B. and A.H.; writing—review and editing: All authors; visualization: All authors; supervision: C.B., A.H., S.Z., S.C. and E.-H.K.; project administration: All authors; funding acquisition: All authors. All authors have read and agreed to the published version of the manuscript.

Funding

This research received no external funding.

Institutional Review Board Statement

Not applicable.

Informed Consent Statement

Not applicable.

Data Availability Statement

Data available on request.

Conflicts of Interest

The authors declare no conflicts of interest.

References

  1. Blair, J.; Mataraarachchi, S. A Review of Landfills, Waste and the Nearly Forgotten Nexus with Climate Change. Environments 2021, 8, 73. [Google Scholar] [CrossRef]
  2. Tayeh, B.A. Effects of marble, timber, and glass powder as partial replacements for cement. J. Civ. Eng. Constr. 2018, 7, 63–71. [Google Scholar] [CrossRef]
  3. Islam, M.T.; Iyer-Raniga, U.; Trewick, S. Recycling Perspectives of Circular Business Models: A Review. Recycling 2022, 7, 79. [Google Scholar] [CrossRef]
  4. Arel, H. Recyclability of Waste Marble in Concrete Production. J. Clean. Prod. 2016, 131, 179–188. [Google Scholar] [CrossRef]
  5. Majeed, M.; Khitab, A.; Anwar, W.; Khan, R.B.N.; Jalil, A.; Tariq, Z. Evaluation of Concrete with Partial Replacement of Cement by Waste Marble Powder. Civ. Eng. J. 2021, 7, 59–70. [Google Scholar] [CrossRef]
  6. Zajac, M.; Skocek, J.; Ben Haha, M.; Deja, J. CO2 Mineralization Methods in Cement and Concrete Industry. Energies 2022, 15, 3597. [Google Scholar] [CrossRef]
  7. Ahmad, J.; Aslam, F.; Martinez-Garcia, R.; De-Prado-Gil, J.; Qaidi, S.; Brahmia, A. Effects of waste glass and waste marble on mechanical and durability performance of concrete. Sci. Rep. 2021, 11, 21525. [Google Scholar] [CrossRef]
  8. Amran, M.; Murali, G.; Khalid, N.H.A.; Fediuk, R.; Ozbakkaloglu, T.; Huei Lee, Y.; Haruna, S.; Yong Lee, Y. Slag uses in making an ecofriendly and sustainable concrete: A review. Constr. Build. Mater. 2021, 272, 121942. [Google Scholar] [CrossRef]
  9. Wang, J.; Wang, Y.; Sun, Y.; Tingley, D.D.; Zhang, Y. Life cycle sustainability assessment of fly ash concrete structures. Renew. Sustain. Energy Rev. 2017, 80, 1162–1174. [Google Scholar] [CrossRef]
  10. Belebchouche, C.; Moussaceb, K.; Bensebti, S.-E.; Aït-Mokhtar, A.; Hammoudi, A.; Czarnecki, S. Mechanical and Microstructural Properties of Ordinary Concrete with High Additions of Crushed Glass. Materials 2021, 14, 1872. [Google Scholar] [CrossRef]
  11. Mei, J.; Xu, G.; Ahmad, W.; Khan, K.; Amin, M.N.; Aslam, F.; Alaskar, A. Promoting sustainable materials using recycled rubber in concrete: A review. J. Clean. Prod. 2022, 373, 133927. [Google Scholar] [CrossRef]
  12. Pooja, P.; Vaitla, M.; Sravan, G.; Reddy, M.P.; Bhagyawati, M. Study on Behavior of Concrete with Partial Replacement of Fine Aggregate with Waste Plastics. Mater. Today Proc. 2019, 8, 182–187. [Google Scholar] [CrossRef]
  13. Toghroli, A.; Shariati, M.; Sajedi, F.; Ibrahim, Z.; Koting, S.; Mohamad, E.; Khorami, M. A review on pavement porous concrete using recycled waste materials. Smart Struct. Syst. 2018, 22, 433–440. [Google Scholar] [CrossRef]
  14. Rahman, M.T.; Mohajerani, A.; Giustozzi, F. Recycling of Waste Materials for Asphalt Concrete and Bitumen: A Review. Materials 2020, 13, 1495. [Google Scholar] [CrossRef] [PubMed]
  15. Tang, Q.; Ma, Z.; Wu, H.; Wang, W. The utilization of eco-friendly recycled powder from concrete and brick waste in new concrete: A critical review. Cem. Concr. Compos. 2020, 114, 103807. [Google Scholar] [CrossRef]
  16. Ramos, J.C.R.; Passalini, P.G.S.; Holanda, J.N.F. Utilization of marble waste as a sustainable replacement for calcareous in the manufacture of red-firing wall tiles. Constr. Build. Mater. 2023, 377, 131115. [Google Scholar] [CrossRef]
  17. Mohajerani, A.; Vajna, J.; Cheung, T.; Kurmus, H.; Arulrajah, A.; Horpibulsuk, S. Practical recycling applications of crushed waste glass in construction materials: A review. Constr. Build. Mater. 2017, 156, 443–467. [Google Scholar] [CrossRef]
  18. Tariq, S.; Scott, A.; Mackechnie, J.; Shah, V. Glass powder replacement in self-compacting concrete and its effect on rheological and mechanical properties. J. Sustain. Cem.-Based Mater. 2022, 11, 240–256. [Google Scholar] [CrossRef]
  19. Pang, L.; Liu, Z.; Wang, D.; An, M. Review on the Application of Supplementary Cementitious Materials in Self-Compacting Concrete. Crystals 2022, 12, 180. [Google Scholar] [CrossRef]
  20. Haddadou, N.; Chaid, R.; Ghernouti, Y.; Adjou, N. The effect of hybrid steel fiber on the properties of fresh and hardened self-compacting concrete. J. Build. Mater. Struct. 2014, 1, 65–76. [Google Scholar] [CrossRef]
  21. Nasr, M.S.; Salman, A.J.; Ghayyib, R.J.; Shubbar, A.; Al-Mamoori, S.; Al-khafaji, Z.; Hashim, T.M.; Hasan, Z.A.; Sadique, M. Effect of Clay Brick Waste Powder on the Fresh and Hardened Properties of Self-Compacting Concrete: State-of-the-Art and Life Cycle Assessment. Energies 2023, 16, 4587. [Google Scholar] [CrossRef]
  22. Brouwers, H.; Radix, H. Self-Compacting Concrete: Theoretical and experimental study. Cem. Concr. Res. 2005, 35, 2116–2136. [Google Scholar] [CrossRef]
  23. Haddadou, N.; Chaid, R.; Ghernouti, Y.; Adjou, N.; Bouzoualegh, M. Fresh and hardened properties of self-compacting concrete with different mineral additions and fibers. J. Build. Mater. Struct. 2015, 2, 41–50. [Google Scholar] [CrossRef]
  24. Belouadah, M.; Rahmouni, Z.; Tebbal, N. Influence of the addition of glass powder and marble powder on the physical and mechanical behavior of composite cement. Procedia Comput. Sci. 2019, 158, 366–375. [Google Scholar] [CrossRef]
  25. Hashmi, S.R.Z.; Imran Khan, M.; Khahro, S.H.; Zaid, O.; Shahid Siddique, M.; Md Yusoff, N.I. Prediction of Strength Properties of Concrete Containing Waste Marble Aggregate and Stone Dust—Modeling and Optimization Using RSM. Materials 2022, 15, 8024. [Google Scholar] [CrossRef] [PubMed]
  26. Hammoudi, A.; Moussaceb, K.; Belebchouche, C.; Dahmoune, F. Comparison of artificial neural network (ANN) and response surface methodology (RSM) prediction in compressive strength of recycled concrete aggregates. Constr. Build. Mater. 2019, 209, 425–436. [Google Scholar] [CrossRef]
  27. Ghafari, E.; Costa, H.; Júlio, E. RSM-based model to predict the performance of self-compacting UHPC reinforced with hybrid steel micro-fibers. Constr. Build. Mater. 2014, 66, 375–383. [Google Scholar] [CrossRef]
  28. Abdulkadir, I.; Mohammed, B.S.; Liew, M.S.; Wahab, M.M.A. Modelling and multi-objective optimization of the fresh and mechanical properties of self-compacting high volume fly ash ECC (HVFA-ECC) using response surface methodology (RSM). Case Stud. Constr. Mater. 2021, 14, e00525. [Google Scholar] [CrossRef]
  29. Alaloul, W.S.; Musarat, M.A.; Haruna, S.; Law, K.; Tayeh, B.A.; Rafiq, W.; Ayub, S. Mechanical Properties of Silica Fume Modified High-Volume Fly Ash Rubberized Self-Compacting Concrete. Sustainability 2021, 13, 5571. [Google Scholar] [CrossRef]
  30. NF EN 197-1; Cement—Part 1: Composition, Specifications and Conformity Criteria for Common Cements. Normes Francaises et Europeennes: Paris, France, 2001.
  31. Rachid, R.; Mohamed, A.; Mohamed, R.; Mohammed, O. Effect of additions on the self-compacting concrete’s absorption. J. Eng. Exact Sci. 2023, 9, 16058-01e. [Google Scholar] [CrossRef]
  32. Zaouai, S.; Tafraoui, A.; Makani, A.; Benmerioul, F. Hardened and transfer properties of self-compacting concretes containing pre -coated rubber aggregates with crushed dune sand. J. Rubber Res. 2019, 23, 5–12. [Google Scholar] [CrossRef]
  33. EN 12350-8:2019; Testing Fresh Concrete—Part 8: Self-Compacting Concrete—Slump-Flow Test. iTeh Standards: Etobicoke, ON, Canada, 2019.
  34. EN 12350-10:2010; Testing Fresh Concrete—Part 10: Self-Compacting Concrete—L Box Test. iTeh Standards: Etobicoke, ON, Canada, 2010.
  35. EN 12350-9:2010; Testing Fresh Concrete—Part 9: Self-Compacting Concrete—V-Funnel Test. iTeh Standards: Etobicoke, ON, Canada, 2010.
  36. EN 12390-3:2019; Testing Hardened Concrete—Part 3: Compressive Strength of Test Specimens. iTeh Standards: Etobicoke, ON, Canada, 2019.
  37. Dahmoune, F.; Remini, H.; Dairi, S.; Aoun, O.; Moussi, K.; Bouaoudia-Madi, N.; Adjeroud, N.; Kadri, N.; Lefsih, K.; Boughani, L.; et al. Ultrasound assisted extraction of phenolic compounds from P. lentiscus L. leaves: Comparative study of artificial neural network (ANN) versus degree of experiment for prediction ability of phenolic compounds recovery. Ind. Crop. Prod. 2015, 77, 251–261. [Google Scholar] [CrossRef]
  38. Peng, X.; Wang, X. Next-generation intelligent laboratories for materials design and manufacturing. MRS Bull. 2023, 48, 179–185. [Google Scholar] [CrossRef] [PubMed]
  39. Haddadou, N.; Chaid, R.; Ghernouti, Y. Experimental study on steel fibre reinforced self-compacting concrete incorporating high volume of marble powder. Eur. J. Environ. Civ. Eng. 2015, 19, 48–64. [Google Scholar] [CrossRef]
  40. Sivanandam, G.; Venkataraman, S. Mechanical and Durability Properties of CCD-Optimised Fibre-Reinforced Self-Compacting Concrete. Processes 2023, 11, 455. [Google Scholar] [CrossRef]
Figure 8. Hardened properties tests.
Sustainability 16 01972 g008
Figure 9. Correlations between the predicted and observed values for compressive strength tests at: (A) 7 days; (B) 28 days; and (C): 90 days.
Sustainability 16 01972 g009
Figure 10. Response surface plot for compressive strength at 7 days, according to RSM: (A) as a function of MP and W/B; (B) as a function of GP and W/B; and (C) as a function of MP and GP.
Sustainability 16 01972 g010
Figure 11. Response surface plot for compressive strength at 28 days, according to RSM: (A) as a function of MP and W/B; (B) as a function of GP and W/B; and (C) as a function of MP and GP.
Sustainability 16 01972 g011
Figure 12. Response surface plot for compressive strength at 90 days, according to RSM: (A) as a function of MP and W/B; (B) as a function of GP and W/B; and (C) as a function of MP and GP.
Sustainability 16 01972 g012
Table 1. Chemical characteristics of cement, MP, and GP.
Chemical Analysis (%)CementMarble PowderGlass Powder
Na2O--14.7
MgO1.941.951.3
Al2O33.550.22.13
SiO2150.46268.1
P2O50.7510.5930.893
SO33.430.5930.213
Cl0.05590.03610.0298
K2O0.7070.07130.213
CaO70.496.111.1
TiO20.246-0.0784
MnO0.0705--
Fe2O33.660.2130.345
CuO-0.02570.0105
SrO0.1220.06820.0097
As2O3--0.196
ZrO2--0.066
BaO--0.521
Table 6. The experimental design layout and corresponding responses for the central composite design (CCD) based on the response surface methodology (RSM), along with the predicted values for the hardened properties tests.
MixtureIndependent Variables
E/BBinderWCompressive Strength at 7-Day MPaCompressive Strength
at 28-Day MPa
Compressive Strength
at 90-Day MPa
CMPGPExperimentalPredictedExperimentalPredictedExperimentalPredicted
Mix 10.404000016034.7933.7537.7537.2056.5653.12
Mix 20.4032008016019.1419.9629.8128.5244.7143.40
Mix 30.4032080016034.3935.5836.4937.0847.8848.03
Mix 40.40240808016016.6116.6222.0022.5636.2735.72
Mix 50.504000020023.0622.3332.5131.6240.7241.42
Mix 60.5032008020023.4621.5630.2729.3539.5939.58
Mix 70.5032080020023.9022.3726.6627.6232.6434.11
Mix 80.50240808020016.1216.4419.2919.5126.1029.69
Mix 90.40320404016033.0132.0334.5535.2646.8151.97
Mix 100.50320404020022.4026.2330.3130.9448.8443.10
Mix 110.4536004018021.8324.6829.6833.3333.8737.93
Mix 120.45280804018023.0323.0330.6728.3535.0830.43
Mix 130.4536040018026.9229.0133.9633.8536.4537.58
Mix 140.45280408018018.4119.1524.0225.4632.2130.50
Mix 150.45320404018028.9726.7432.4432.2137.4837.56
Mix 160.45320404018026.1826.7432.3232.2136.2337.56
Mix 170.45320404018030.7726.7434.5432.2137.8237.56
W: water, C: cement, B: binder (cement + MP + GP).
Table 7. The experimental results source includes the analysis of variance (ANOVA) and statistics from the full regression models.
DFCS (7 Days)CS (28 Days)CS (90 Days)
SsF-ValueProb > FSsF-ValueProb > FSsF-ValueProb > F
Model9497.2316.45380.0112 *367.5518.80670.0045 *765.566574.47520.0304 *
X1184.105809.82480.0165 *46.4574910.01830.0158 *196.5148910.33880.0147 *
X216.768350.79060.403461.9960213.36920.0081 *140.497537.39170.0298 *
X31243.2363828.41350.0011 *176.2068537.99820.0005 *125.061256.57950.0373 *
X1X211.590440.18580.67947.527201.62320.24332.460870.12950.7296
X1X3184.831839.90960.0162 *20.563284.43440.073231.114221.63690.2415
X2X3113.294751.55300.252817.064483.67990.09663.339820.17570.6877
X12115.203001.77590.22442.130160.45940.5197266.5060314.02100.0072 *
X22122.375912.61380.15004.998171.07780.333730.627011.61130.2449
X32118.927472.21100.180617.446923.76230.093633.244231.74900.2276
Residual759.9241 32.4607 133.05309
Lack of Fit549.22571.84050.388429.35933.78660.2220131.6455137.41040.0262
Pure Error210.6984 3.1014 1.40758
R2 0.8924 0.918851 0.851936
R2 adj 0.7541 0.814516 0.661568
Adeq pre
RMSE
2.9258 2.153425 4.359769
Cor Total16557.1551 400.0117 898.61966
Ss: Sum of squares, *: (Prob. > F) lower than 5%.
Disclaimer/Publisher’s Note: The statements, opinions and data contained in all publications are solely those of the individual author(s) and contributor(s) and not of MDPI and/or the editor(s). MDPI and/or the editor(s) disclaim responsibility for any injury to people or property resulting from any ideas, methods, instructions or products referred to in the content.

