
Macroinvertebrate Community in a Mediterranean Mountain River: Relationship with Environmental Factors Measured at Different Spatial and Temporal Scales


Abstract
1. Introduction
2. Materials and Methods
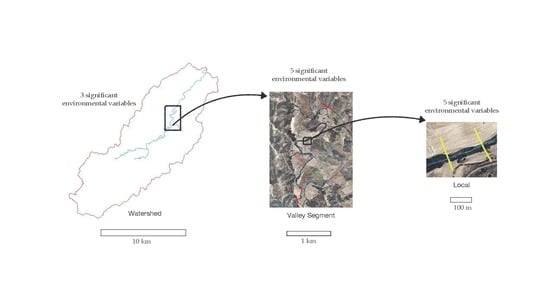
2.1. Study Area and Sampling Sites
2.2. Environmental and Biological Data
2.3. Data Analysis
3. Results
4. Discussion
Supplementary Materials
Author Contributions
Funding
Institutional Review Board Statement
Informed Consent Statement
Data Availability Statement
Acknowledgments
Conflicts of Interest
References
- Junior, R.F.V.; Varandas, S.G.P.; Pacheco, F.A.L.; Pereira, V.R.; Santos, C.F.; Cortes, R.M.V.; Fernandes, L.F.S. Impacts of land use conflicts on riverine ecosystems. Land Use Policy 2015, 43, 48–62. [Google Scholar] [CrossRef]
- García-García, C.; García-García, M.J.; Jiménez-Melero, R.; Guerrero, F.; Parra, G. Ecological status of a Mediterranean river (Turón, South of Spain): Practical use of biological indexes. Verh. Int. Ver. Theor. Angew. Limnol. 2005, 29, 217–220. [Google Scholar] [CrossRef]
- Vidal-Abarca, M.R.; Santos-Martín, F.; Martín-López, B.; Sánchez-Montoya, M.M.; Suárez, M.L. Exploring the capacity of Water Framework Directive indices to assess ecosystem services in fluvial and riparian systems: Towards a second implementation phase. Environ. Manag. 2016, 57, 1139–1152. [Google Scholar] [CrossRef]
- Frissell, C.A.; Liss, W.J.; Warren, C.E.; Hurley, M.D. A hierarchical framework for stream habitat classification: Viewing streams in a watershed context. Environ. Manag. 1986, 10, 199–214. [Google Scholar] [CrossRef]
- Hawkins, C.P.; Kershner, J.L.; Bisson, P.A.; Bryant, M.D.; Decker, L.M.; Gregory, S.V.; McCullough, D.A.; Overton, C.K.; Reeves, G.H.; Steedman, R.J.; et al. A hierarchical approach to classifying stream habitat features. Fisheries 1993, 18, 3–12. [Google Scholar] [CrossRef]
- Rosgen, D.L. A classification of natural rivers. Catena 1994, 22, 169–199. [Google Scholar] [CrossRef]
- Towsend, C.R.; Hildrew, A.G. Species traits in relation to a habitat templet for river systems. Freshw. Biol. 1994, 31, 265–275. [Google Scholar] [CrossRef]
- LeRoy Poff, N. Landscape filters and species traits: Towards mechanistic understanding and prediction in stream ecology. J. N. Am. Benthol. Soc. 1997, 16, 391–409. [Google Scholar] [CrossRef]
- Gilbert, J.D.; Márquez, F.J.; Guerrero, F. Assessing the zooplankton metacommunity (Branchiopoda and Copepoda) from Mediterranean wetlands in agricultural landscapes. Diversity 2023, 15, 362. [Google Scholar] [CrossRef]
- Alba-Tercedor, J.; Jáimez-Cuéllar, P.; Álvarez, M.; Avilés, J.; Bonada, N.; Casas, J.; Mellado, A.; Ortega, M.; Pardo, I.; Prat, N.; et al. Caracterización del estado ecológico de ríos mediterráneos ibéricos mediante el índice IBMWP (antes BMWP’). Limnetica 2002, 21, 175–185. [Google Scholar] [CrossRef]
- Alba-Tercedor, J.; Sánchez-Ortega, A. Un método rápido y simple para evaluar la calidad biológica de las aguas corrientes basado en el de Hellawell (1978). Limnetica 1988, 4, 51–66. [Google Scholar] [CrossRef]
- Guerrero, F.; Madrid-Vinuesa, F.; Gilbert, J.D.; Jiménez-Melero, R.; del Arco, A.; Parra, G. Testing the suitability of the Abundance Biomass Comparison bioassessment method in a Mediterranean river. J. Water Land. Dev. 2022, 56, 49–55. [Google Scholar] [CrossRef]
- Chen, C.; Yang, X.; Jiang, S.; Liu, Z. Mapping and spatiotemporal dynamics of land-use and land-cover change based on the Google Earth Engine cloud platform from Landsat imagery: A case study of Zhoushan Island, China. Heliyon 2023, 9, e19654. [Google Scholar] [CrossRef]
- Chen, C.; Liang, J.; Yang, G.; Sun, W. Spatio-temporal distribution of harmful algal blooms and their correlations with marine hydrological elements in offshore areas, China. Ocean Coast. Manag. 2023, 238, 106554. [Google Scholar] [CrossRef]
- Black, R.W.; Munn, M.D.; Plotnikoff, R.W. Using macroinvertebrates to identify biota–land cover optima at multiple scales in the Pacific Northwest, USA. J. N. Am. Benthol. Soc. 2004, 23, 340–362. [Google Scholar] [CrossRef]
- Li, Z.; Heino, J.; Chen, X.; Liu, Z.; Meng, X.; Jiang, X.; Ge, Y.; Chen, J.; Xie, Z. Understanding macroinvertebrate metacommunity organization using a nested study design across a mountainous river network. Ecol. Indic. 2021, 121, 107188. [Google Scholar] [CrossRef]
- Lowe, W.H.; Likens, G.E.; Power, M.E. Linking scales in stream ecology. BioScience 2006, 56, 591–597. [Google Scholar] [CrossRef]
- IGME. Atlas Hidrogeológico de la Provincia de Málaga, 1st ed.; Centro de Ediciones de la Diputación de Málaga: Málaga, Spain, 1988; p. 151. [Google Scholar]
- Munné, A.; Prat, N. Use of macroinvertebrate-based multimetric indices for water quality evaluation in Spanish Mediterranean rivers: An intercalibration approach with the IBMWP Index. Hydrobiologia 2009, 628, 203–225. [Google Scholar] [CrossRef]
- Tachet, H.; Bournaud, M.; Richoux, P. Introduction à L’étude des Macroinvertébrés d’eau Douce: Systématique Élémentaire et Aperçu Écologique, 4th ed.; Université de Lyon I, Association Française de Limnologie: Paris, France, 1991; p. 151. [Google Scholar]
- Lenat, D.R. Water quality assessment using a qualitative collection method for benthic macroinvertebrates. J. N. Am. Benthol Soc. 1988, 7, 222–233. [Google Scholar] [CrossRef]
- De Souza, J.C.; Sales, J.C.A.; Lopes, E.R.d.N.; Roveda, J.A.F.; Roveda, S.R.M.M.; Lourenço, R.W. Valuation methodology of laminar erosion potential using fuzzy inference systems in a Brazilian savanna. Environ. Monit. Assess. 2019, 191, 624. [Google Scholar] [CrossRef] [PubMed]
- Kinnell, P.I.A.; Risse, L.M. USLE-M: Empirical modeling rainfall erosion through runoff and sediment concentration. Soil Sci. Soc. Am. J. 1998, 62, 1667–1672. [Google Scholar] [CrossRef]
- Conrad, O.; Bechtel, B.; Bock, M.; Dietrich, H.; Fischer, E.; Gerlitz, L.; Wehberg, J.; Wichmann, V.; Böhner, J. System for Automated Geoscientific Analyses (SAGA) v. 2.1.4. Geosci. Model Dev. 2015, 8, 1991–2007. [Google Scholar] [CrossRef]
- Strahler, A.N.; Strahler, A.H. Geografía Física, 3rd ed.; Fecha de Publicación: Barcelona, Spain, 1989; p. 550. [Google Scholar]
- Munné, A.; Prat, N.; Solá, C.; Bonada, N.; Rieradevall, M. A simple field method for assessing the ecological quality of riparian habitat in rivers and streams: QBR index. Aquat. Conserv. Mar. Freshw. Ecosyst. 2003, 13, 147–163. [Google Scholar] [CrossRef]
- Barbour, M.T.; Gerritsen, J.; Snyder, B.D.; Stribling, J.B. Rapid Bioassessment Protocols for Use in Streams and Wadeable Rivers: Perphyton, Benthic Macroinvertebrates, and Fish, 2nd ed.; U.S. Environmental Protection Agency: Washington, DC, USA, 1999; p. 337. [Google Scholar]
- Weigel, B.M.; Wang, L.; Rasmussen, P.W.; Butcher, J.T.; Stewart, P.M.; Simon, T.P.; Wiley, M.J. Relative influence of variables at multiple spatial scales on stream macroinvertebrates in the Northern Lakes and Forest ecoregion, U.S.A. Freshw. Biol. 2003, 48, 1440–1461. [Google Scholar] [CrossRef]
- Sneath, P.H.A.; Sokal, R.R. Numerical Taxonomy: The Principles and Practice of Numerical Classification, 1st ed.; W.H. Freeman & Co.: San Francisco, CA, USA, 1973; p. 573. [Google Scholar]
- Clarke, K.R. Non-parametric multivariate analyses of changes in community structure. Aust. J. Ecol. 1993, 18, 117–143. [Google Scholar] [CrossRef]
- Oksanen, J.; Simpson, G.L.; Blanchet, F.G.; Kindt, R.; Legendre, P.; Minchin, P.R.; O′Hara, R.B.; Solymos, P.; Stevens, M.H.H.; Szoecs, E.; et al. Vegan Community Ecology Package Version 2.6—2 April 2022. The Comprehensive R Archive Network. Available online: http://cran.r-project.org (accessed on 12 September 2023).
- Chen, Y. Spatial autocorrelation equation based on Monran’s index. Sci. Rep. 2023, 13, 19296. [Google Scholar] [CrossRef] [PubMed]
- Blanchet, F.G.; Legendre, P.; Borcard, D. Forward selection of explanatory variables. Ecology 2008, 89, 2623–2632. [Google Scholar] [CrossRef] [PubMed]
- Legendre, P. Studying beta diversity: Ecological variation partitioning by multiple regression and canonical analysis. J. Plant. Ecol. 2008, 1, 3–8. [Google Scholar] [CrossRef]
- Cooper, S.D.; Lake, P.S.; Sabater, S.; Melack, J.M.; Sabo, J.L. The effects of land use changes on streams and rivers in Mediterranean climates. Hydrobiologia 2013, 719, 383–425. [Google Scholar] [CrossRef]
- Rocha, M.P.; Bini, L.M.; Domisch, S.; Tolonen, K.T.; Jyrkänkallio-Mikkola, J.; Soininen, J.; Hjort, J.; Heino, J. Local environment and space drive multiple facets of stream macroinvertebrate beta diversity. J. Biogeogr. 2018, 45, 2744–2754. [Google Scholar] [CrossRef]
- Wang, X.; Tan, X. Macroinvertebrate community in relation to water quality and riparian land use in a subtropical mountain stream, China. Environ. Sci. Pollut. Res. 2017, 24, 14682–14689. [Google Scholar] [CrossRef] [PubMed]
- Feld, C.K.; Hering, D. Community structure or function: Effects of environmental stress on benthic macroinvertebrates at different spatial scales. Freshw. Biol. 2007, 52, 1380–1399. [Google Scholar] [CrossRef]
- Kappes, H.; Sundermann, A.; Haase, P. Distant land use affects terrestrial and aquatic habitats of high naturalness. Biodivers. Conserv. 2011, 20, 2297–2309. [Google Scholar] [CrossRef]
- Fitzpatrick, F.A.; Scudder, B.C.; Lenz, B.N.; Sullivan, D.J. Effects of multi-scale environmental characteristics on agricultural stream biota in eastern Wisconsin. J. Am. Water Resour. Assoc. 2001, 37, 1489–1507. [Google Scholar] [CrossRef]
- Törnblom, J.; Angelstam, P.; Degerman, E.; Henrikson, L.; Edman, T.; Temnerud, J. Catchment land cover as a proxy for macroinvertebrate assemblage structure in Carpathian mountain streams. Hydrobiologia 2011, 673, 153–168. [Google Scholar] [CrossRef]
- Richards, C.; Johnson, L.B.; Host, G.E. Landscape-scale influences on stream habitats and biota. Can. J. Fish. Aquat. Sci. 1996, 53, 295–311. [Google Scholar] [CrossRef]
- Casas, J.; Gessner, M.O.; Langton, P.H.; Calle, D.; Descals, E.; Salinas, M.J. Diversity of patterns and processes in rivers of eastern Andalusia. Limnetica 2006, 25, 155–170. [Google Scholar] [CrossRef]
- Jiang, X.; Xiong, J.; Xie, Z. Longitudinal and seasonal patterns of macroinvertebrate communities in a large undammed river system in Southwest China. Quat. Int. 2017, 440, 1–12. [Google Scholar] [CrossRef]
- Urban, M.C.; Skelly, D.K.; Burchsted, D.; Price, W.; Lowry, S. Stream communities across a rural-urban landscape gradient. Divers. Distrib. 2006, 12, 337–350. [Google Scholar] [CrossRef]
- Lorenz, A.W.; Feld, C.K. Upstream river morphology and riparian land use overrule local restoration effects on ecological status assessment. Hydrobiologia 2013, 704, 489–501. [Google Scholar] [CrossRef]
- Cheimonopoulou, M.T.; Bobori, D.C.; Theocharopoulos, I.; Lazaridou, M. Assessing ecological water quality with macroinvertebrates and fish: A case study from a small Mediterranean river. Environ. Manag. 2011, 47, 279–290. [Google Scholar] [CrossRef] [PubMed]
- Potter, K.M. Landscape Characteristics and North Carolina Stream Life: A Multiple-Scale Ecological Risk Assessment of Nonpoint Source Pollution. Ph.D. Thesis, North Carolina State University, Raleigh, NC, USA, 2002. [Google Scholar]
- Adriaenssens, V.; Goethals, P.L.M.; Pauw, N.D. Assessment of land-use impact on macroinvertebrate communities in the Zwalm River basin (Flanders, Belgium) using multivariate analysis and geographic information systems. Sci. World J. 2002, 2, 546–557. [Google Scholar] [CrossRef] [PubMed][Green Version]
- Roth, N.E.; Allan, J.D.; Erickson, D.L. Landscape influences on stream biotic integrity assessed at multiple spatial scales. Landsc. Ecol. 1996, 11, 141–156. [Google Scholar] [CrossRef]
- Krynak, E.M.; Yates, A.G. Benthic invertebrate taxonomic and trait associations with land use in an intensively managed watershed: Implications for indicator identification. Ecol. Indic. 2018, 93, 1050–1059. [Google Scholar] [CrossRef]
- Álvarez, M.; Pardo, I.; Moya, G.; Ramón, G.; Martínez-Taberner, A. Invertebrate communities in temporary streams of the island of Majorca: A comparison of catchments with different land use. Limnetica 2001, 20, 255–266. [Google Scholar] [CrossRef]
- Menció, A.; Boix, D. Response of macroinvertebrate communities to hydrological and hydrochemical alterations in Mediterranean streams. J. Hydrol. 2018, 566, 566–580. [Google Scholar] [CrossRef]
- Valero, E.; Álvarez, X.; Picos, J. An assessment of river habitat quality as an indicator of conservation status. A case study in the Northwest of Spain. Ecol. Indic. 2015, 57, 131–138. [Google Scholar] [CrossRef]
- González del Tánago, M.; García de Jalón, D. Attributes for assessing the environmental quality of riparian zones. Limnetica 2006, 25, 389–402. [Google Scholar] [CrossRef]
- González del Tánago, M.; García de Jalón, D.; Lara, F.; Garilleti, R. Índice RQI para la valoración de las riberas fluviales en el contexto de la Directiva Marco del Agua. Ing. Civ. 2006, 143, 97–108. [Google Scholar]
- Marzin, A.; Verdonschot, P.F.M.; Pont, D. The relative influence of catchment, riparian corridor, and reach-scale anthropogenic pressures on fish and macroinvertebrate assemblages in French rivers. Hydrobiologia 2013, 704, 375–388. [Google Scholar] [CrossRef]
- Boix, D.; García-Berthou, E.; Gascón, S.; Benejam, L.; Tornés, E.; Sala, J.; Benito, J.; Munné, A.; Solà, C.; Sabater, S. Response of community structure to sustained drought in Mediterranean rivers. J. Hydrol. 2010, 383, 135–146. [Google Scholar] [CrossRef]
- Santos, J.I.; Silva, C.; Gonçalves, F.J.M.; Pereira, J.L.; Castro, B.B. Macroinvertebrate community structure and ecological status in Portuguese streams across climatic and water scarcity gradients. Hydrobiologia 2023, 850, 967–984. [Google Scholar] [CrossRef]
- Le Gall, M.; Palt, M.; Kail, J.; Hering, D.; Piffady, J. Woody riparian buffers have indirect effects on macroinvertebrate assemblages of French rivers, but land use effects are much stronger. J. Appl. Ecol. 2022, 59, 526–536. [Google Scholar] [CrossRef]
- Burdon, F.J.; McIntosh, A.R.; Harding, J.S. Habitat loss drives threshold response of benthic invertebrate communities to deposited sediment in agricultural streams. Ecol. Appl. 2013, 23, 1036–1047. [Google Scholar] [CrossRef] [PubMed]
- Luo, K.; Hu, X.; He, Q.; Wu, Z.; Cheng, H.; Hu, Z.; Mazumder, A. Impacts of rapid urbanization on the water quality and macroinvertebrate communities of streams: A case study in Liangjiang New Area, China. Sci. Total Environ. 2018, 621, 1601–1614. [Google Scholar] [CrossRef]
- Bonada, N.; Rieradevall, M.; Prat, N. Macroinvertebrate community structure and biological traits related to flow permanence in a Mediterranean river network. Hydrobiologia 2007, 589, 91–106. [Google Scholar] [CrossRef]
- Weins, J.A. Riverine landscapes: Taking landscape ecology into the water. Freshw. Biol. 2002, 47, 501–515. [Google Scholar] [CrossRef]
- Lamouroux, N.; Dolédec, S.; Gayraud, S. Biological traits of stream macroinvertebrate communities: Effects of microhabitat, reach, and basin filters. J. N. Am. Benthol. Soc. 2004, 33, 449–466. [Google Scholar] [CrossRef]
- García-Roger, E.M.; Sánchez-Montoya, M.dM.; Gómez, R.; Suárez, M.L.; Vidal-Abarca, M.R.; Latron, J.; Rieradevall, M.; Prat, N. Do seasonal changes in habitat features influence aquatic macroinvertebrate assemblages in perennial versus temporary Mediterranean streams? Aquat. Sci. 2011, 73, 567–579. [Google Scholar] [CrossRef]
- Cesarini, G.; Gallitelli, L.; Traversetti, L.; Bandini, T.; Scalici, M. Hydromorphological discontinuities deeply modify the benthic multi-species assemblage diversity in a Mediterranean running river. Rendiconti Lincei Sci. Fis. Nat. 2023, 34, 257–266. [Google Scholar] [CrossRef]
- Hamzaraj, E.; Lazo, P.; Paparisto, A.; Parllaku, B. Using bacteria and benthic macroinvertebrates as water quality parameters in Mat River, Albania. Aqua Water Infrastruct. Ecosyst. Soc. 2023, 72, 1852–1866. [Google Scholar] [CrossRef]
- Belmar, O.; Velasco, J.; Gutiérrez-Cánovas, C.; Mellado-Díaz, A.; Millán, A.; Wood, P.J. The influence of natural flow regimes on macroinvertebrate assemblages in a semiarid Mediterranean basin. Ecohydrology 2013, 6, 363–379. [Google Scholar] [CrossRef]
- Bêche, L.A.; Mcelravy, E.P.; Resh, V.H. Long-term seasonal variation in the biological traits of benthic-macroinvertebrates in two Mediterranean-climate streams in California, U.S.A. Freshw. Biol. 2006, 51, 56–75. [Google Scholar] [CrossRef]


| Sampling Point | Latitude | Longitude | Altitude (m) | Temperature (°C) | pH | DO (mg L−1) | Alkalinity (mmol L−1) | TDS (mg L−1) |
|---|---|---|---|---|---|---|---|---|
| T1 | −4.99133502 | 3.67737370 | 627 | 14.30 ± 0.96 | 8.3 ± 0.07 | 10.23 ± 0.66 | 3.5 ± 0.45 | 135.0 ± 23.80 |
| T2 | −4.97294618 | 3.67823537 | 571 | 14.43 ± 2.07 | 8.5 ± 0.12 | 9.60 ± 1.12 | 3.78 ± 0.59 | 132.5 ± 17.08 |
| T3 | −4.56590792 | 2.94793852 | 549 | 15.45 ± 3.81 | 8.5 ± 0.30 | 10.05 ± 0.42 | 3.93 ± 0.31 | 145.0 ± 31.09 |
| T4 | −4.93926584 | 3.67949044 | 525 | 16.78 ± 4.13 | 8.4 ± 0.36 | 7.93 ± 2.83 | 4.28 ± 0.56 | 175.0 ± 36.97 |
| T5 | −4.91831657 | 3.68015175 | 502 | 16.10 ± 3.48 | 8.5 ± 0.12 | 10.15 ± 0.70 | 4.20 ± 0.48 | 182.5 ± 35.94 |
| T6 | −4.89629730 | 3.68298751 | 448 | 15.90 ± 3.81 | 8.4 ± 0.10 | 9.25 ± 1.04 | 4.23 ± 0.21 | 162.5 ± 25.00 |
| T7 | −4.87855210 | 3.68657774 | 380 | 15.85 ± 3.47 | 8.5 ± 0.20 | 9.08 ± 1.63 | 4.10 ± 0.08 | 167.5 ± 47.17 |
| T8 | −4.84686702 | 3.68883297 | 344 | 15.73 ± 2.99 | 8.6 ± 0.41 | 8.03 ± 4.42 | 4.63 ± 0.26 | 190.0 ± 21.60 |
| FS | −4.94099278 | 3.67776248 | 571 | 15.10 ± 3.57 | 8.5 ± 0.08 | 9.25 ± 1.05 | 4.33 ± 0.36 | 242.5 ± 59.09 |
| AB | −4.89911693 | 3.68201137 | 461 | 15.88 ± 3.44 | 8.2 ± 0.18 | 9.00 ± 0.93 | 5.13 ± 0.50 | 185.0 ± 92.56 |
| Spring | Summer | Autumn | Winter | |||||
|---|---|---|---|---|---|---|---|---|
| IBMPW | EPT | IBMPW | EPT | IBMPW | EPT | IBMPW | EPT | |
| Siliceous lithology | −0.69 | - | - | - | −0.67 | −0.78 | - | - |
| LUw (urban) | −0.78 | - | - | - | - | −0.72 | −0.66 | - |
| LUw (irrigated crop) | −0.76 | - | - | - | - | −0.70 | - | - |
| LUw (dry crop) | - | −0.66 | - | - | - | - | - | - |
| Watershed gradient | 0.67 | - | - | - | - | 0.65 | - | - |
| Valley depth | 0.70 | 0.65 | - | 0.68 | - | 0.74 | - | 0.77 |
| Curvature | −0.82 | −0.79 | −0.66 | - | −0.73 | −0.68 | - | - |
| Channel gradient | 0.70 | 0.69 | - | - | - | - | - | - |
| HASmed | - | - | 0.75 | 0.72 | - | 0.73 | 0.73 | 0.75 |
| QBRmed | - | - | - | 0.70 | - | - | 0.64 | 0.66 |
| Elevation | 0.68 | - | - | - | 0.64 | 0.68 | - | - |
| LU100 (irrigated crop) | - | - | - | −0.63 | −0.81 | −0.71 | - | - |
| LU30 (irrigated crop) | - | - | - | −0.70 | −0.80 | −0.66 | - | - |
| LU100 (forest land) | - | - | - | - | - | - | - | 0.64 |
| HASs | 0.70 | - | - | - | 0.73 | 0.65 | - | - |
| Temperature | - | - | - | - | 0.71 | - | - | - |
| pH | - | - | - | 0.86 | - | - | - | - |
| Alkalinity | - | - | −0.92 | −0.72 | - | - | - | - |
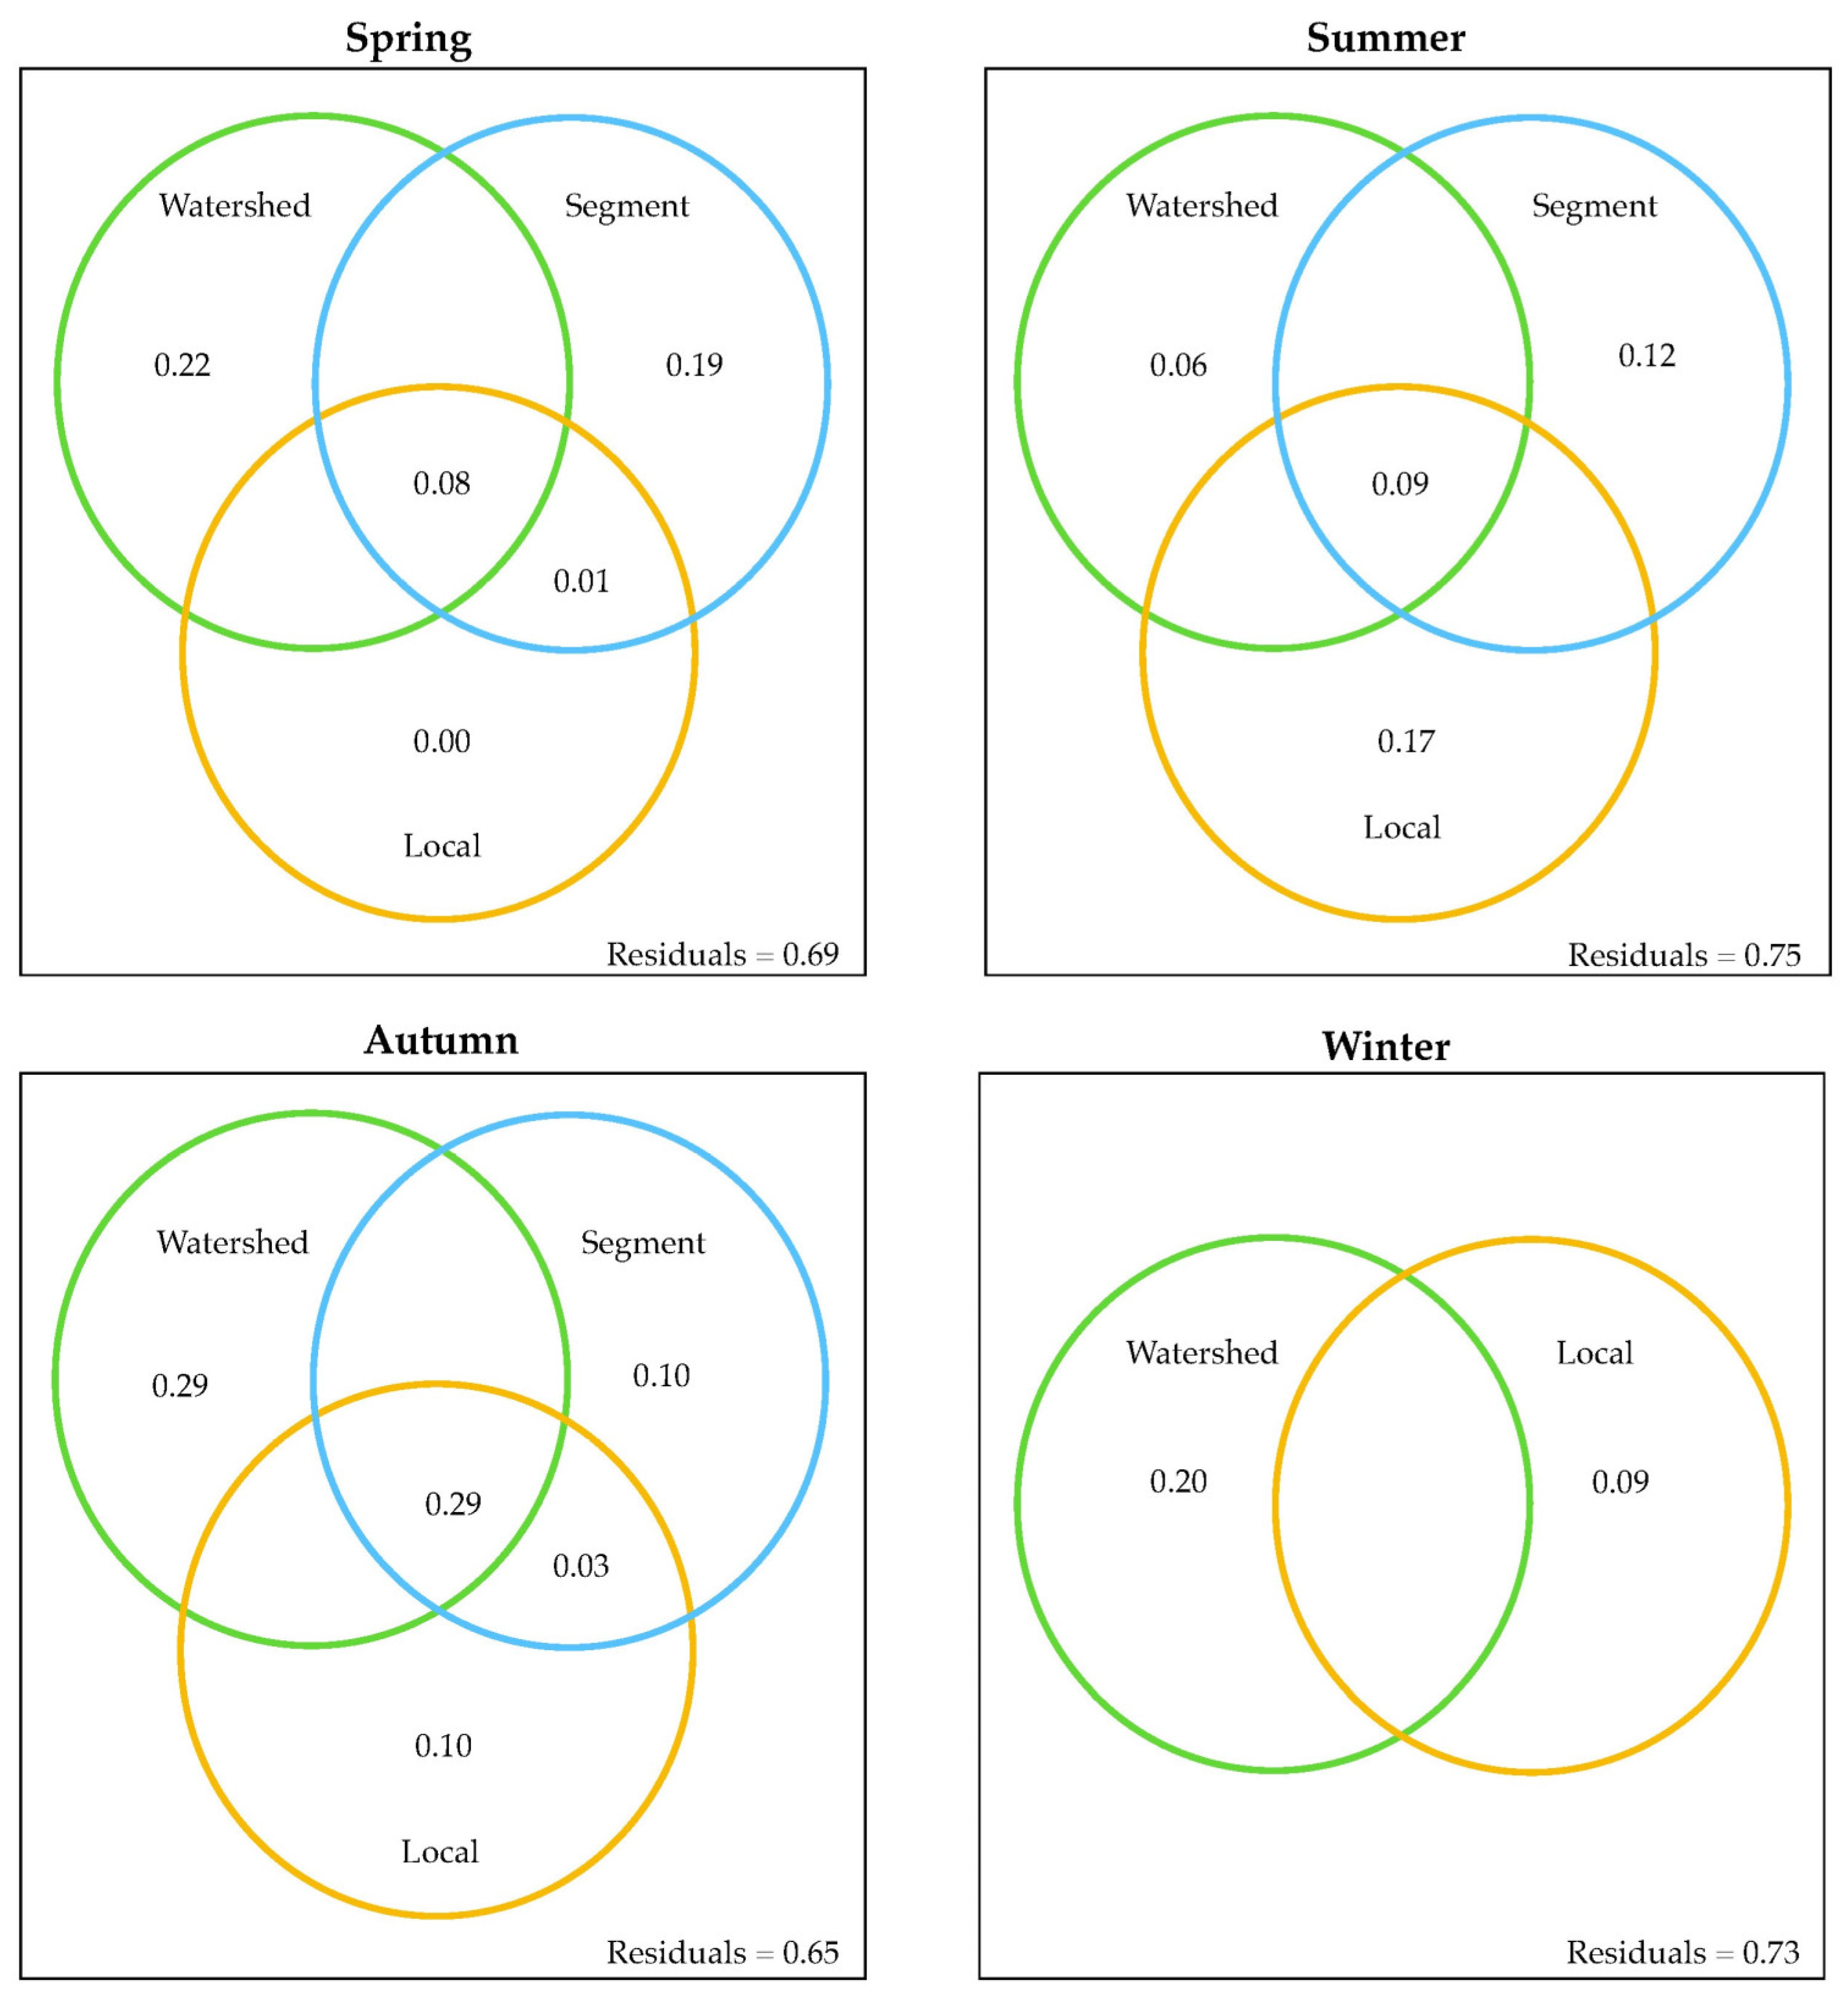
| Season | Scale Level | df | Adj. R2 | Variables |
|---|---|---|---|---|
| Spring | W S L S ∩ L W ∩ S ∩ L | 3 3 1 | 0.22 0.19 0.004 0.01 0.08 | LUW (dry crop, irrigated crop, urban) Valley depth, curvature, channel gradient HASs HASs, valley depth, curvature, channel gradient HASs, valley depth, curvature, channel gradient, LUW (dry crop, irrigated crop, urban) |
| Summer | W S L W ∩ S ∩ L | 2 2 3 | 0.06 0.12 0.17 0.09 | LUW (dry crop, urban) HASmed, curvature HASs, pH, alkalinity LUW (dry crop, urban), HASmed, curvature, HASs, pH, alkalinity |
| Autumn | W S L S ∩ L W ∩ S ∩ L | 1 3 4 | 0.29 0.10 0.10 0.03 0.29 | LUW (dry crop) QBRmed, HASmed, curvature HASs, pH, alkalinity, LU30 (irrigated crop) QBRmed, HASmed, curvature, HASs, pH, alkalinity, LU30 (irrigated crop) QBRmed, HASmed, curvature, HASs, pH, alkalinity, LU30 (irrigated crop), LUW (dry crop) |
| Winter | W L | 5 1 | 0.20 0.09 | LUW (dry crop, irrigated crop, urban), C USLE factor, siliceous lithology Temperature |
Disclaimer/Publisher’s Note: The statements, opinions and data contained in all publications are solely those of the individual author(s) and contributor(s) and not of MDPI and/or the editor(s). MDPI and/or the editor(s) disclaim responsibility for any injury to people or property resulting from any ideas, methods, instructions or products referred to in the content. |
© 2024 by the authors. Licensee MDPI, Basel, Switzerland. This article is an open access article distributed under the terms and conditions of the Creative Commons Attribution (CC BY) license (https://creativecommons.org/licenses/by/4.0/).
Share and Cite
García-García, C.; Gilbert, J.D.; Guerrero, F. Macroinvertebrate Community in a Mediterranean Mountain River: Relationship with Environmental Factors Measured at Different Spatial and Temporal Scales. Sustainability 2024, 16, 1777. https://doi.org/10.3390/su16051777
García-García C, Gilbert JD, Guerrero F. Macroinvertebrate Community in a Mediterranean Mountain River: Relationship with Environmental Factors Measured at Different Spatial and Temporal Scales. Sustainability. 2024; 16(5):1777. https://doi.org/10.3390/su16051777
Chicago/Turabian StyleGarcía-García, Cristóbal, Juan Diego Gilbert, and Francisco Guerrero. 2024. "Macroinvertebrate Community in a Mediterranean Mountain River: Relationship with Environmental Factors Measured at Different Spatial and Temporal Scales" Sustainability 16, no. 5: 1777. https://doi.org/10.3390/su16051777
APA StyleGarcía-García, C., Gilbert, J. D., & Guerrero, F. (2024). Macroinvertebrate Community in a Mediterranean Mountain River: Relationship with Environmental Factors Measured at Different Spatial and Temporal Scales. Sustainability, 16(5), 1777. https://doi.org/10.3390/su16051777