Article

Unravelling the Role of Biochemical Compounds within the Hydrothermal Liquefaction Process of Real Sludge Mixtures

1
Department of Chemical Sciences, University of Naples Federico II, Complesso Universitario di Monte Sant’Angelo, 80126 Napoli, Italy
2
Department of Chemical, Materials and Production Engineering, University of Naples Federico II, Piazzale V. Tecchio 80, 80125 Napoli, Italy
3
Institute of Sciences and Technologies for Sustainable Energy and Mobility, National Research Council, Piazzale V. Tecchio 80, 80125 Napoli, Italy
*
Authors to whom correspondence should be addressed.
Sustainability 2024, 16(5), 1770; https://doi.org/10.3390/su16051770
Submission received: 2 January 2024 / Revised: 2 February 2024 / Accepted: 9 February 2024 / Published: 21 February 2024
(This article belongs to the Special Issue Conversion of Residual Biomass Energy to Power Generation)

Abstract

:
This paper aims to provide a contribution to understanding the role of sludge macro-components (lipids, proteins and carbohydrates) on the yield/quality of bio-crude obtained via hydrothermal liquefaction (HTL). This was pursued by analysing the HTL process of real sludges and the mixtures thereof at different compositions, a topic that has been explored in a very limited way in the pertinent literature. The HTL experiments were run with municipal sludge, tannery sludge and a mixture of them in 25:75, 50:50 and 75:25 weight ratios in a batch reactor at 350 °C and for different residence times. The outcomes for a single sludge showed a greater bio-crude yield for the municipal one (42.5% at 10 min), which is linked to its significant carbohydrate content. The results obtained from the sludge mixtures suggested that a carbohydrate-to-protein mass ratio of 2:1 would maximise the bio-crude yield (average value of about 38%). Moreover, LC-MS and NMR analyses highlighted that the mixed sludges contributed to the formation of a higher number of compounds after the HTL treatment, with respect to the pure municipal or tannery sludge, with an increase in amine, alcohols and aromatic compounds.

1. Introduction

Currently, the energy exploitation of biomass is a promising route to reduce the dependence on fossil fuels that represents the main cause of global warming [1]. Generally, biomass refers to the organic materials derived from plants, animals or human sources composed of a combination of moisture, ashes and biochemical components, including cellulose, lignin, carbohydrates, proteins and lipids. The proportion of these components varies significantly, according to the nature of the biomass [2]. Different processes have been applied to convert biomass into energy, including anaerobic/aerobic digestion [3,4], combustion [5,6], pyrolysis [7,8], gasification [9,10,11,12] and torrefaction [13]. All of these technologies use different chemicals or energy carriers as target products and are characterised by specific requirements for the treated feedstock. The choice of conversion process depends on several factors, such as the biomass feedstock type and properties, end-user requirements, environmental standards and economic conditions [14,15,16,17,18,19,20].
Among the thermochemical conversion technologies, the hydrothermal liquefaction (HTL) process has attracted particular interest in the past decade from the scientific community, since with this technology, it is possible to treat biomass with a high moisture content, including sewage sludge, micro- and macro-algae, food waste, etc., without the expensive drying procedures associated with these processes, such as gasification and pyrolysis [21]. HTL represents a promising route to convert wet biomass into bio-crude (bio-oil) as a target product, which can be further upgraded into advanced bio-fuels and/or added-value products. In this process, when carried out in subcritical water conditions (200–375 °C and 40–200 bar), the properties of the aqueous medium allow for the solubilisation of the organic fraction of biomass and the subsequent fragmentation of macro-components. The generated fragments can recombine, leading to the formation of the target bio-crude, together with an aqueous phase, a solid residue and a gas phase as co-products [22,23,24,25]. Lipids, proteins and carbohydrates are the main reactive components of biomass, and the ratio of these macro-components was shown to strongly influence the yields and quality of HTL products [26]. Several studies have demonstrated that the yield and quality of bio-crude increased following the content ranking (in the starting biomass) lipids>proteins>carbohydrates [27,28]. In this context, micro- and macro-algae, characterised by a high lipid content, are considered excellent starting biomasses for energetic conversion via HTL [29,30,31].
From a circular economy perspective, the adoption of waste biomass, such as sewage sludge as HTL feedstock, is a very promising option to reduce the volume of sludge that is currently landfilled (with associated environmental issues), while converting it into valuable bio-energy. In terms of the ratio of the three macro-components, this kind of biomass shows a generally higher contribution of proteins and carbohydrates [32]. It was observed that the hydrothermal treatment of carbohydrates and protein can lead to the preferential formation of char and water-soluble compounds, but a synergistic effect (derived from a Maillard reaction) between these two components in favour of bio-crude formation was also found [33,34]. Most studies on the HTL of sludges analyse the effect of their type (i.e., primary or secondary) and composition (i.e., by mixing primary and secondary sludges) on HTL performances [35]. In addition, the combination of sewage sludge with different biomasses in the HTL process can give more interesting results when compared to a single biomass in terms of higher bio-crude yields and energy recovery and improved bio-crude quality due to the synergistic effects of the macro-components [36,37,38].
Contextually, several experimental and modelling studies based on model compounds have been reported in the literature to gain deeper knowledge on the influence of biomass macro-components on the yield and quality of bio-crude (and, consequently, on the prevailing reaction pathways), also highlighting the possible synergistic or antagonistic effects [39,40,41,42]. Chacón-Parra et al. [40] investigated Maillard reactions during HTL by adopting a central composite design to validate the impact of the carbohydrate/protein mass ratio on the process performance at different temperature and residence time. Their work showed that a protein-to-carbohydrate mass ratio of 2:1 is likely to maximise the volatile fraction, the elemental carbon and the higher heating value (HHV) of the bio-crude, with a maximum yield of 90−95%. In the work of Tito et al. [41], the interaction between carbohydrates and proteins during hydrothermal liquefaction at different temperatures was studied, with experimental tests carried out with glucose and glycine as model compounds. This study reinforced the hypothesis that carbohydrates and proteins have a strong interaction during HTL, highlighting the central role of temperature in the regulation of this interaction.
The above analysis advances the investigation of the effect of the biomass composition in terms of macro-components on HTL performances, to optimise the yield and quality of the bio-crude. Most studies are based on model compounds, providing deeper knowledge of the influence of biomass macro-components on the yield/quality of bio-crude, and also highlighting the possible synergistic/antagonistic effects. However, there is a lack of information on the possible synergistic effects of lipids, proteins and carbohydrates in more realistic matrices. This is particularly relevant in the case of sludges characterised by significant differences in composition as a function of their origin and/or seasonality. The present study aims to improve knowledge of this investigation framework by analysing the HTL process of real sludge mixtures, i.e., starting with civil and tannery sludges of different compositions. In particular, for tannery sludge and to the best of our knowledge, no detailed data on the relationships between composition and HTL outcomes are available. The effects of the bio-component ratio on the yield of HTL phases, the quality/energetic value of bio-crude and the qualitative composition of the aqueous phase were evaluated and discussed, also in the light of LC-MS and NMR analyses. This, in turn, allowed us to identify the optimal macromolecular compositions favouring the production of the target bio-crude.

2. Materials and Methods

2.1. Biomass Nature and Characterisation

The feedstocks adopted for HTL experiments were two sludges, i.e., a municipal sludge (abbreviated as MS) and an industrial tannery sludge (termed TS), deriving from wastewater treatment plants located in northern and southern Italy, respectively. The proximate analysis was carried out on both sludges using a TGA701 LECO (Saint Joseph, MI, USA) thermobalance. The elemental analysis was performed to determine the C, H and N content using a LECO CHN628 analyser. The sulphur content was determined by means of an elementary LECO SC-144DR analyser. The HHV of the sludges was evaluated using a Parr (Moline, IL, USA) 6200 calorimeter. This analysis also allowed the chlorine content of the sludges to be determined.
A dedicated analysis was devoted to the evaluation of the macro-components (lipids, carbohydrates and proteins) present in the starting sludges. In particular, the lipids content was quantified by adopting the Bligh and Dyer method [43], with slight modifications. Briefly, 0.5 g of the standard (i.e., palmitic acid) or the sample (MS or TS) was added to 3.75 mL (1:2 v/v) chloroform/methanol and vortexed for 2 min. Then, 1.25 mL of chloroform was added and vortexed for another 2 min. Finally, 1.25 mL of deionised water was added and vortexed for 1 min. The sample was then centrifuged to allow the separation of the organic layer from the aqueous one. A known volume of the bottom organic layer (extracted in chloroform) was carefully recovered, using a Pasteur pipette. After extraction, a known volume of the chloroform extract (aliquot) was placed into a pre-weighed (W1) aluminium pan (Fisher Scientific, Segrate, Italy). The extract was allowed to dry at room temperature until a constant weight (W2) was obtained. The content of lipids (then expressed as %) was calculated as:
%   l i p i d s = W 2 W 1 V V a l i q m b i o m a s s
where V is the volume of the organic layer; Valiq is the volume of the chloroform extract; and mbiomass is the sludge weight.
For the determination of carbohydrates, the phenol-sulphuric acid method proposed by Albalasmeh et al. [44] (based on the absorption of light in the visible and UV ranges) was adopted. However, this method was re-adapted to solid samples by solubilising 5 mg of sludge in 8 mL of solvent. Then, a 2 mL aliquot of a carbohydrate solution was mixed with 1 mL of 5% phenol aqueous solution in a test tube. Subsequently, 5 mL of concentrated sulphuric acid was quickly added to the mixture. After allowing the test tubes to rest for 10 min, they were centrifuged for 30 s and placed in a water bath at room temperature for 20 min, for colour development. Then, the absorption of light at 490 nm was recorded on a spectrophotometer. The reference solutions were prepared in the same manner as above, except that the 2 mL carbohydrate aliquot was replaced by Millipore double-treated water.
The determination of the protein content was performed according to the modified Lowry test [45], again adapted to solid samples by solubilising 50 mg of sludge in 7.4 mL of solvent. The analysis involved the preparation of 3 solutions: I. a solution in which 2 mg of potassium sodium tartrate and 100 mg of NaCO3 were dissolved in 500 mL of 1 N NaOH and diluted with water to 1 L; II. a solution in which 2 mg of potassium sodium tartrate and 1 g of CuSO4·5H2O were dissolved in 90 mL of water, and then 10 mL of NaOH 1 N was added; III. a solution in which the Folin–Ciocâlteu reagent was diluted with water at a ratio of 1:10 by vol. The protein samples were diluted to 1 mL with water and treated with 0.9 mL of solution “I”. A blank and a standard were set up in the same way. In particular, the standard curve was traced using different solutions of bovine serum albumin in distilled water (concentrations varying from 0.05 to 2.5 mg/mL). The protein determination was performed by measuring the absorbance at 650 nm. The tubes were placed in a water bath at 50 °C for 10 min, cooled to room temperature (21–25 °C) and treated with 0.1 mL of solution “II”. The solutions were left at room temperature for at least 10 min; then, 3 mL of solution “III” was quickly forced to ensure mixing within 1 s. The tubes were heated again at 50 °C for 10 min and cooled to room temperature. The absorbance of the solutions was read in 1 cm cuvettes at 650 nm.

2.2. Hydrothermal Liquefaction Tests

A detailed description of the experimental apparatus and protocols adopted for both HTL tests and products separation was reported in previous works by this research group [46,47], and it is briefly summarised below.
The lab-scale apparatus adopted for the hydrothermal liquefaction test consisted of a 500 mL autoclave (Parr Instruments; PA 4575A series) equipped with a pressure measurement and control system, a magnetic stirrer and an electrical and loop coil system for the reactor heating and cooling, respectively.
For the HTL experiments, the reactor was loaded with 30 g (on a dry basis) of parent sludge or their mixtures, together with distilled water to obtain a slurry with 10% wt. biomass content. After purging the reactor headspace with N2, the reactor was heated to a final temperature (T) of 350 °C and an isothermal HTL stage followed. Finally, the reactor was cooled to room temperature to allow it to be discharged and the products to be separated. The HTL tests were performed for isothermal times (t) between 10 and 40 min and using both raw sludges (MS, TS) and their mixtures, in order to obtain more in-depth information on the effect of the macro-component content of the biomass on the performances of HTL. In particular, three different mass ratios of the sludges in the mixtures were adopted, namely 25:75, 50:50 and 75:25.
After the HTL run, the following procedure was adopted for the phase separation, as also schematised in Figure S1 in the Supplementary Materials. The slurry recovered from the reactor was filtered on a Büchner under vacuum. Then, two different paths were applied for the solid and the water/oil phase. After filtration, the solid residue was subjected to Soxhlet extraction with dichloromethane (DCM) to recover the bio-oil from the solid pores, and then oven-dried at 105 °C for 24 h. The fraction soluble in DCM was recovered to be subsequently distilled. The liquid water/oil fraction was separated into a bio-crude and an aqueous phase by adopting a centrifugation method, using a ventilated NEYA 8 BASIC (Giorgio Bormac, Carpi, Italy) apparatus. The bio-crude was recovered using 20 g of DCM and finally distilled under vacuum (after mixing it with the extract derived from the Soxhlet procedure). After the separation processes, the percentage yields (Y) of gas, solid residue and bio-crude were calculated according to Equations (2)–(4), respectively:
Y g a s d b = m C O 2 m b i o m a s s , d b × 100   o r   Y g a s d a f b = m C O 2 m b i o m a s s , d a f b × 100
Y s o l i d   r e s i d u e d b = m s o l i d , d b m b i o m a s s , d b × 100
Y b i o - c r u d e d b = m b i o - c r u d e m b i o m a s s , d b × 100   o r   Y b i o - c r u d e d a f b = m b i o - c r u d e m b i o m a s s , d a f b × 100
where m C O 2 , msolid, mbio-crude and mbiomass represent the mass of gas, solid residue, bio-crude and starting biomass, respectively. The superscript “db” refers to dry basis, while “dafb” refers to dry and ash-free basis.

2.3. Characterisation of HTL Products

The energetic value (HHV) of the bio-crude obtained from the HTL of both parent sludges and their mixtures was determined as described in Section 2.1 for parent sludges. The determination of HHV allowed the energy recovery (ER) to be calculated as:
E R = H H V b i o - c r u d e H H V b i o m a s s Y b i o - c r u d e d b
The chemical analysis of both the bio-oil and the aqueous phase was carried out by mono- and bi-dimensional nuclear magnetic resonance (1D/2D NMR) spectroscopy, together with liquid chromatography–mass spectrometry (LC-MS) analysis. More details on the experimental conditions are reported in [47]. Briefly, 1H-NMR, 1H,1H-COSY and 1H,13C-HSQC DEPT spectra were recorded at 400 MHz on a Bruker (Milano, Italy) 400 MHz spectrometer. The spectra were acquired in deuterated dimethyl sulphoxide (DMSO-d6) in the case of bio-oil samples, or in deuterated water (D2O) in the case of aqueous phases. The LC-MS analyses were performed in positive ion mode, using an Agilent (Santa Clara, CA, USA) 1260/6230DA ESI-TOF instrument under the following conditions: 35 psi nebuliser pressure; drying gas (nitrogen) flushed at 8 L/min at T = 325 °C; 3500 V capillary voltage and 175 V fragmentor voltage. An Agilent Eclipse Plus C18 column (150 × 4.6 mm, 5 μm) at a flow rate of 0.4 mL/min was used.

3. Results and Discussion

3.1. Chemical and Energetic Properties of Sludges

Table 1 reports the chemical and energetic properties of the sludges. The proximate analysis results show, for TS compared to MS, a higher content of moisture (18.46% vs. 12.68%) and ash (31.41% vs. 21.43%) and a lower volatile amount (50.13% vs. 56.36%). Furthermore, it should be noted that TS did not reveal any fixed carbon, while MS shows a concentration of approx. 9.5%. Following the results of the ultimate analysis (dry basis), it is observed that the content of C (33.61–34.55%) and H (4.87–5.10%) is very similar for the two sludges, while the municipal sludge has more N (5.90% vs. 2.44%) and the tannery one has more S (4.07% vs. 0.77%), according to their nature. The Cl content varies from 0.35% (TS) to 0.61% (MS). The percentage of organic oxygen (on a dry basis) is calculated as 100 completion with respect to the sum, on a dry basis, between the ash content and that of the five elements analysed (C, H, N, S, Cl):
% o x y g e n d b = 100 % a s h d b + i = C , H , N , S , C l % i d b
We first reported the ash content on a dry basis (21.43%→24.54% for MS, 31.41%→38.52% for TS), and then obtained, from Equation (6), an oxygen content equal to 28.76% for MS and 15.91% for TS. This means that, for MS, the H/C atomic ratio is 1.69 and the O/C atomic ratio is 0.62: these values fall within the range, on a van Krevelen diagram, typically valid for vegetable biomass/organic waste (ca. H/C = 1.1–1.9; O/C = 0.40–1.05). For TS, H/C = 1.82 and O/C = 0.36, not far from the values commonly attributed to animal biomass (H/C = 1.3–1.6 and O/C = 0.25–0.35), which TS resembles in a broad sense.
The calorific value is HHV = 16.67 MJ/kg for MS, 14.90 MJ/kg for TS, from which the lower heating value (LHV) is obtained by:
L H V   M J k g = H H V   M J k g 9 % H d b 100 2.5
For the two biomasses considered, the values fall within typical ranges of around 15 MJ/kg; specifically, 13.75 MJ/kg for tannery sludge, 15.57 MJ/kg for municipal sludge. For both sludges, the least relevant macro-component is lipids (2.4% for MS, 5.3% for TS). For MS, the most important macro-component is carbohydrates (59.0%) compared to proteins (25.0%). The opposite situation is observed, given its different nature, for TS (29.4% proteins, 21.0% carbohydrates). In fact, as TS derives from the processing of animal skins, it is (compared to MS) richer in lipids and proteins; meanwhile, MS is richer in carbohydrates as it derives from the processing of municipal wastewaters.
The values obtained from the proximate and elemental analyses, and from the measurement of the calorific value, are in line with those available in the literature, at least in terms of orders of magnitude, both for MS [48] and for TS [6]. Similarly, the content in terms of macro-components for MS agrees with the data published in the literature [49]. To the best of our knowledge, no data on macro-components relating to tannery sludges are reported in the HTL literature; therefore, this work can be seen as pioneering in considering this biomass in energy valorisation processes through HTL and in analysing how the content of lipids, proteins and carbohydrates in tannery sludge can influence the yield of bio-crude.

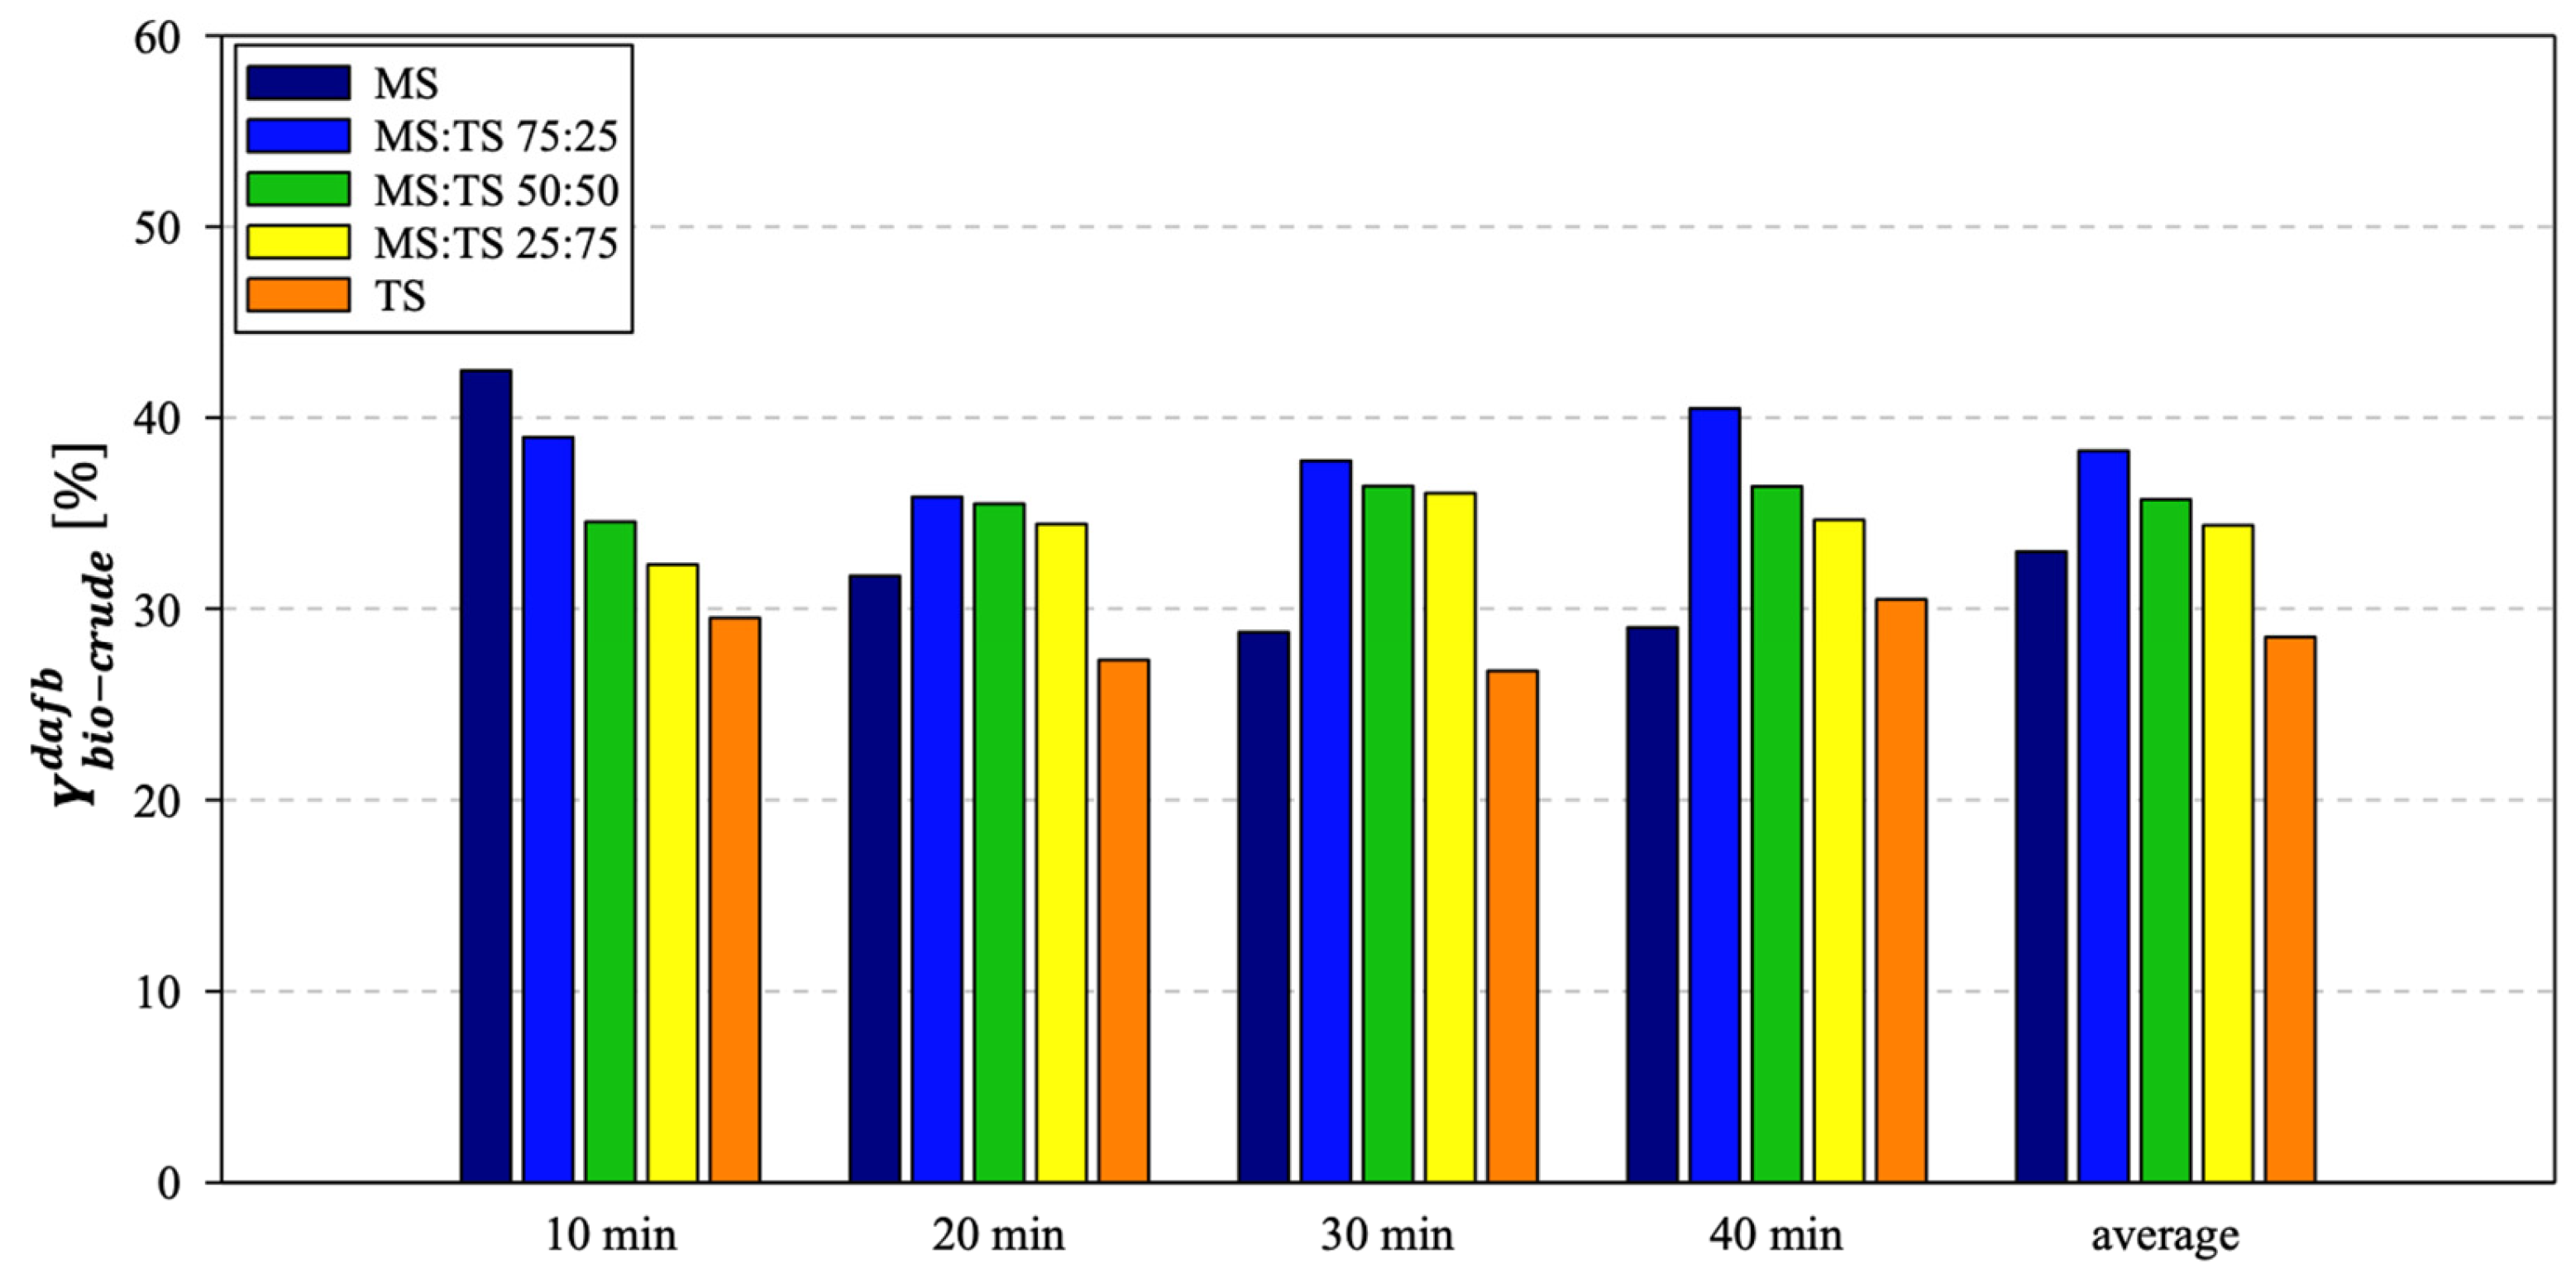
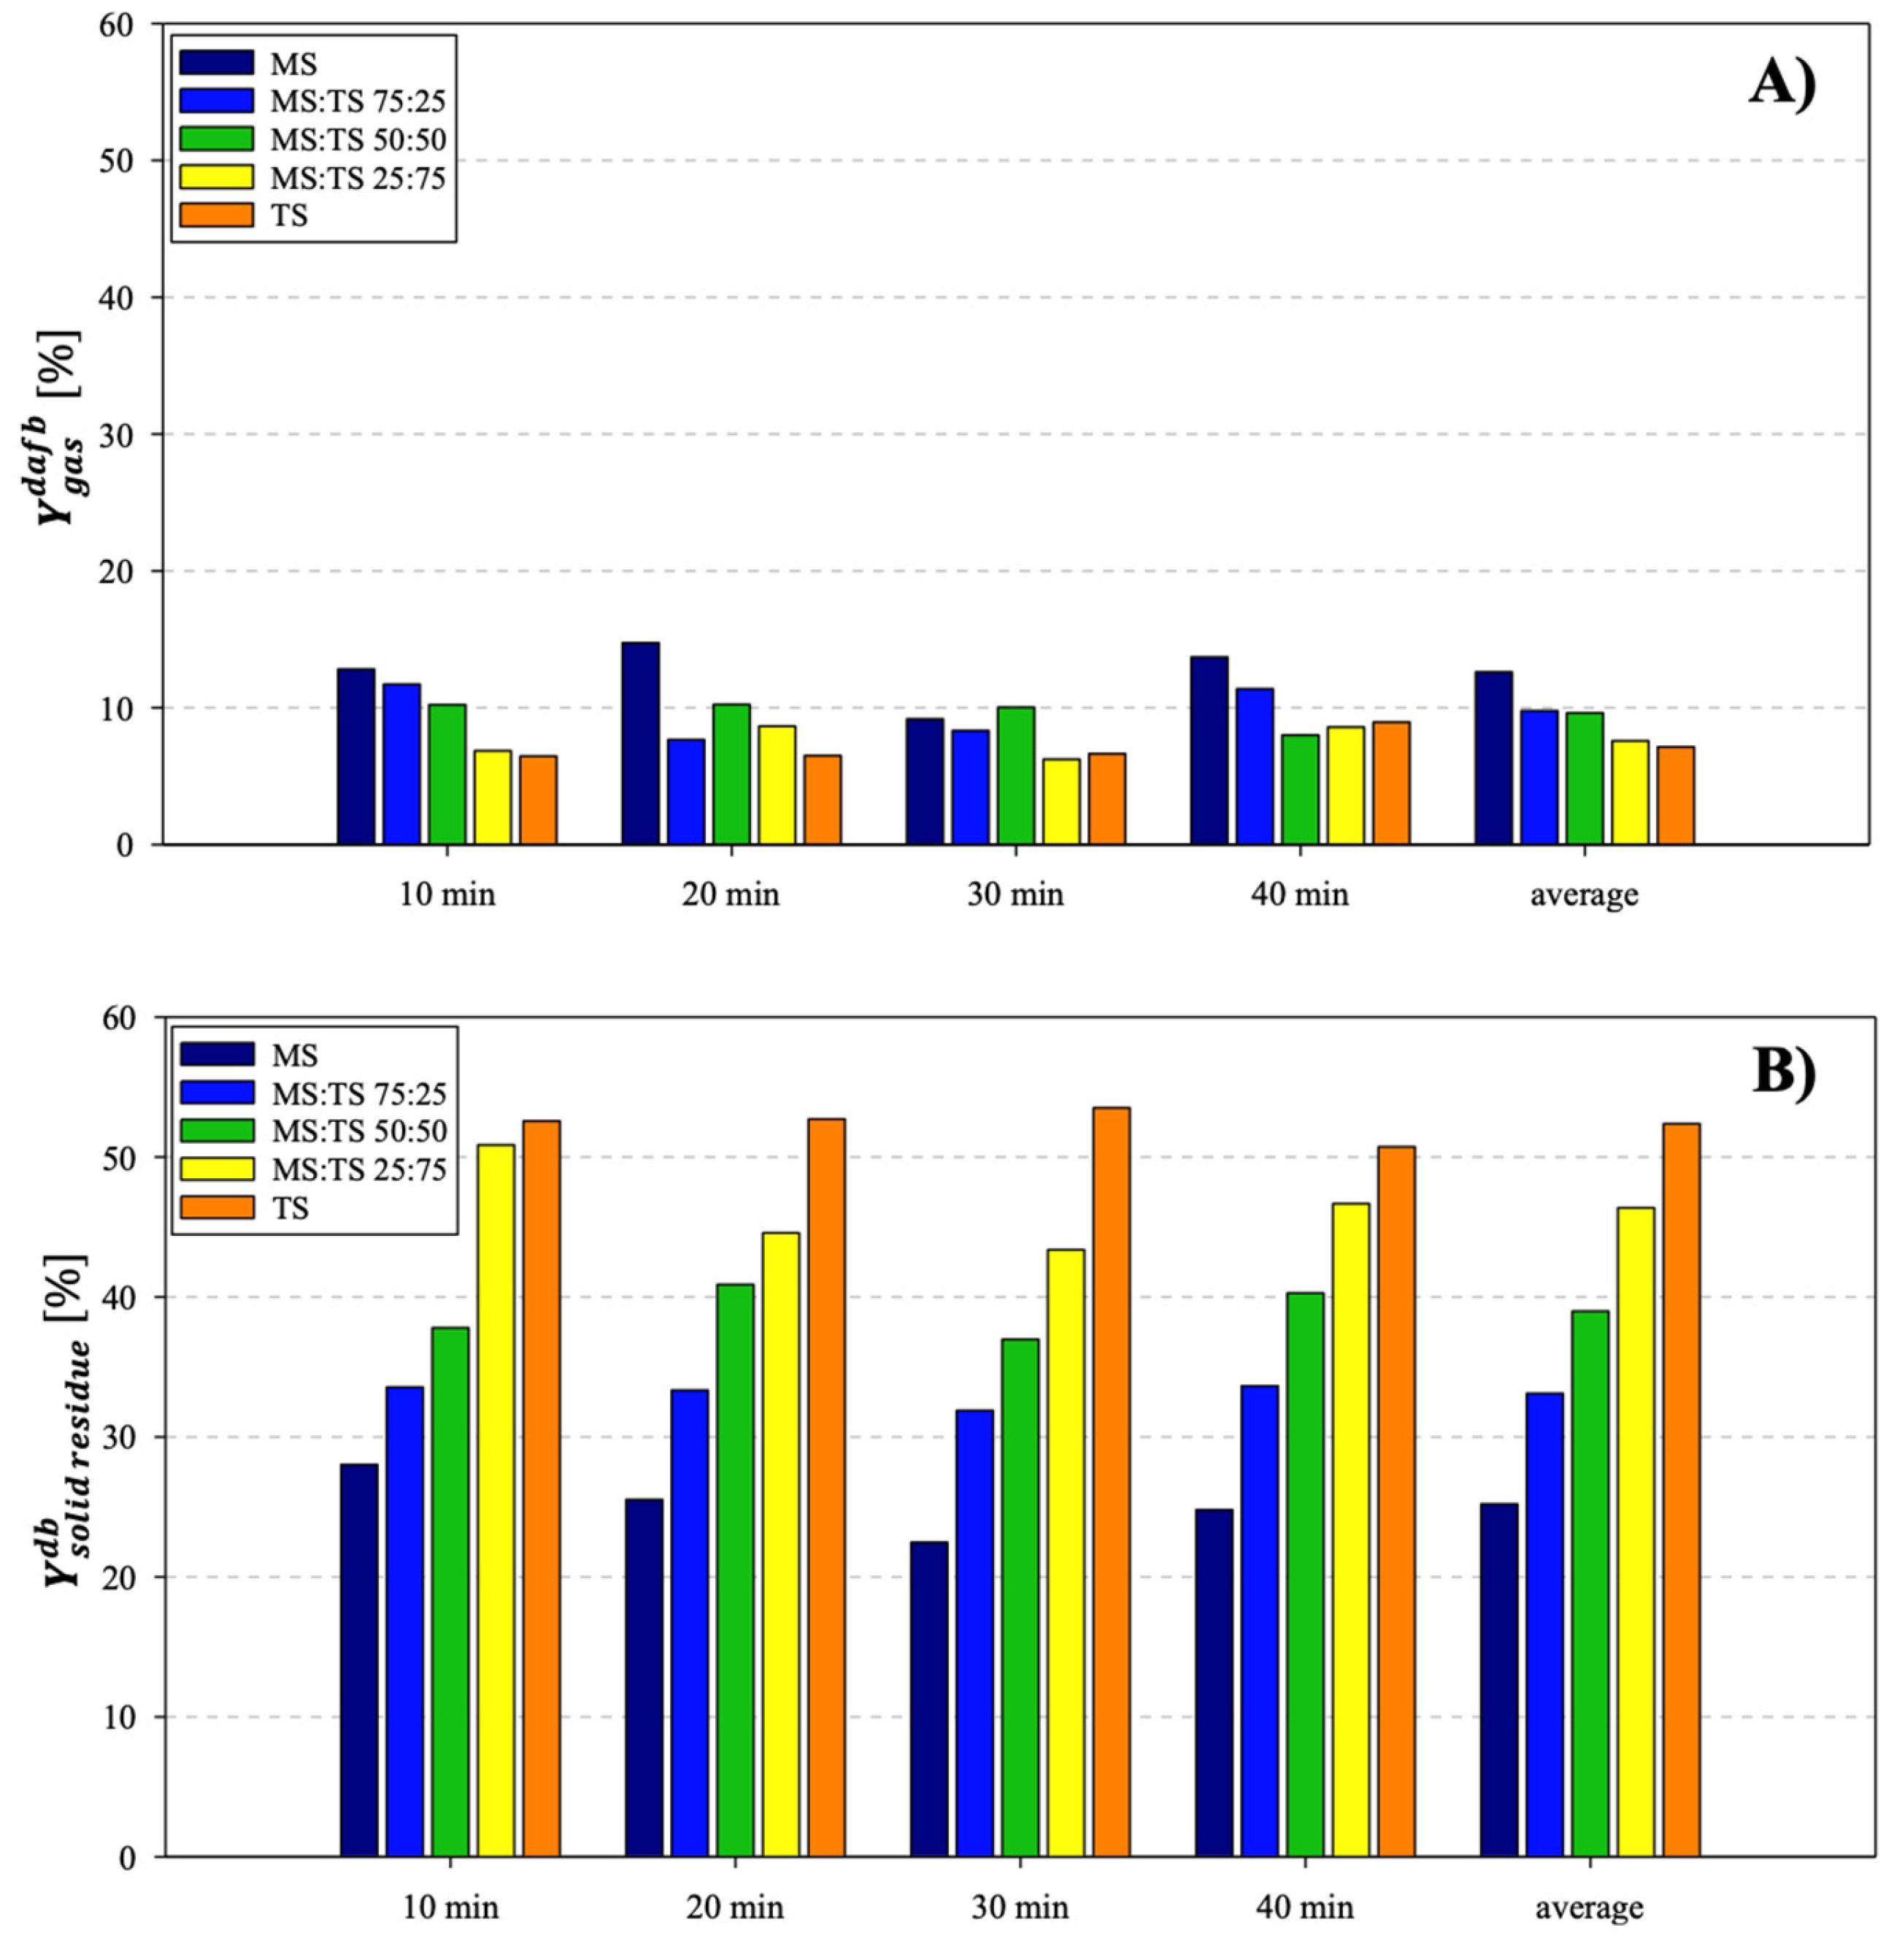
3.2. HTL Results: Yields of Phases and Energetic Properties

In Figure 1, the bio-crude yield values are shown as the starting biomass and HTL test times vary. Once the biomass is given, the effect of t is significant only for MS (42.5% for t = 10 min, 28.8–31.7% for t between 20 and 40 min). For the other cases, the effect of the testing time is secondary ( Y b i o - c r u d e d a f b varies between 26.8 and 30.5% for TS, 35.8 and 40.5% for MS:TS 75:25, 34.6 and 36.4% for MS:TS 50:50, 32.3 and 36.0% for MS:TS 25:75). The considerably high value obtained for MS at the minimum test time (t = 10 min) could be explained in light of the significant carbohydrate content for this sludge (cf. Table 1), capable of determining the formation of a bio-crude at a high content of aliphatic compounds (vide infra).
If we consider (Figure 1) the average yield values in bio-crude for the four times investigated (33.0% for MS, 28.5% for TS, varying between 34.4% and 38.3% for mixtures of the two, on dry and ash-free basis), the presence of a synergistic effect is evident which determines, on average, better yields in the desired product when the sludges are used in combination. The results demonstrate that the different macro-compositions of the mixtures linked to the different contents of lipids, proteins and carbohydrates in the starting sludges significantly influence the yields of the HTL products. This is due to the complexity of the reaction patterns involved in the HTL process which are inevitably driven by the initial composition of the system [39]. Table 2 reports the L:P:C (lipid/protein/carbohydrate) ratio for the five cases examined. Evidently, there are optimal values for this ratio (e.g., C:P ca. 2 as in the case of MS:TS 75:25) to favour the reactive network that leads to the formation of bio-oil. These results agree with those obtained by Lu and collaborators [50], for which the co-liquefaction efficiency of the bio-oil yield was the highest when a 1:2 mass ratio of soy protein to glucose was adopted. Similarly, Qiu et al. [51] obtained an optimal HTL bio-crude yield for the leucine–glucose mixture when a weight ratio of 2:5 (leucine/glucose) and a reaction T of 320 °C were adopted. The results obtained in this work, together with the literature articles cited above, confirm that the Maillard reactions, which involve the decomposition products of the two main macro-components (proteins and carbohydrates), have a strong influence on the yield of the bio-crude obtained.
Table 3 reports the HHV value for two cases referring to MS:TS 75:25 (the mixture that presents the best average yield in bio-crude): 29.42 MJ/kg for t = 10 min, and 28.57 MJ/kg for t = 30 min. The respective ER values, around 50% for both cases, were calculated by applying Equation (5), where (cf. Table 1) HHVbiomass = 0.75(HHVMS) + 0.25(HHVTS) = 16.23 MJ/kg, while Equation (4) has been reworked to obtain:
Y b i o - c r u d e d b Y b i o - c r u d e d a f b = m b i o m a s s , d a f b m b i o m a s s , d b
Since, as already calculated in Section 3.1, the ash content on a dry basis is equal to 24.54% for MS and 38.52% for TS, the ash content for MS:TS 75:25 will be equal to 28.04%. Therefore, setting mbiomas b = 100 g as a reference, we will have mbiomass,dafb = 71.96 g, from which, for t = 10 min, Y b i o - c r u d e d a f b = 39.0% becomes Y b i o - c r u d e d b = 28.1% and, for t = 30 min, Y b i o - c r u d e d a f b   = 37.7% becomes Y b i o - c r u d e d b   = 27.1%.
The gas and solid yields are illustrated in Figure 2. Y g a s d a f b is, on average, higher when using MS alone (12.6%), then gradually decreases to 7.1%, as MS is progressively replaced by TS. Symmetrically, Y s o l i d   r e s i d u e d b is, on average, higher when TS is used alone (52.4%), and then gradually decreases down to 25.2%, as TS is progressively replaced by MS. A higher volatiles content in MS and ash content in TS would explain the observed trend.

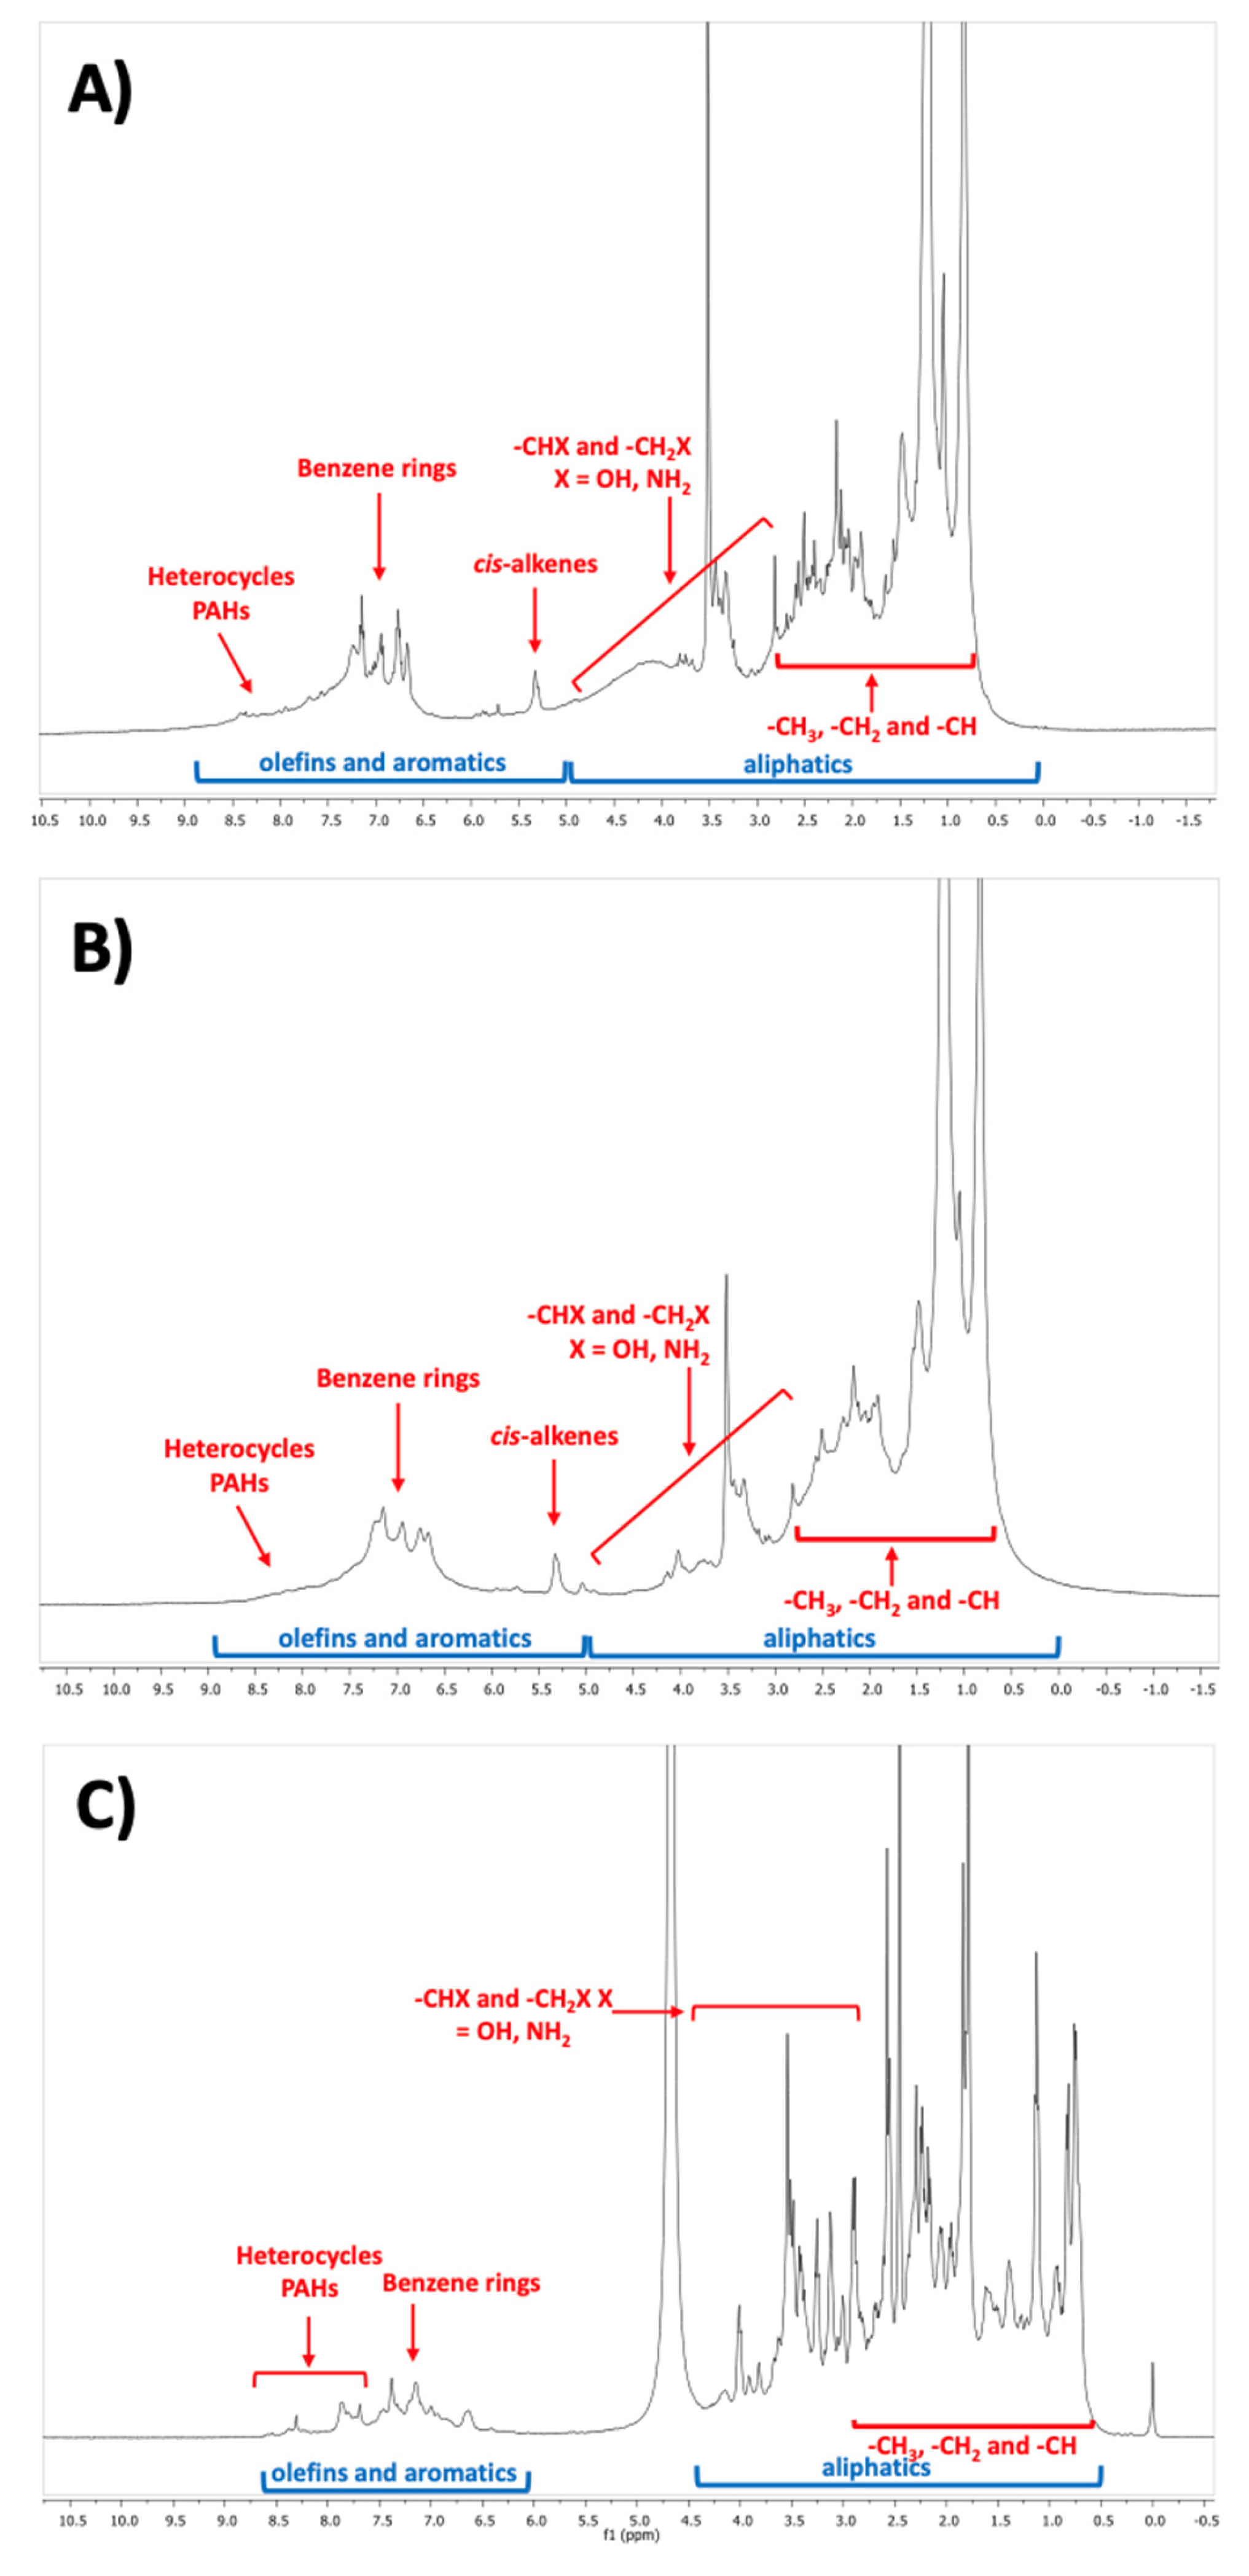
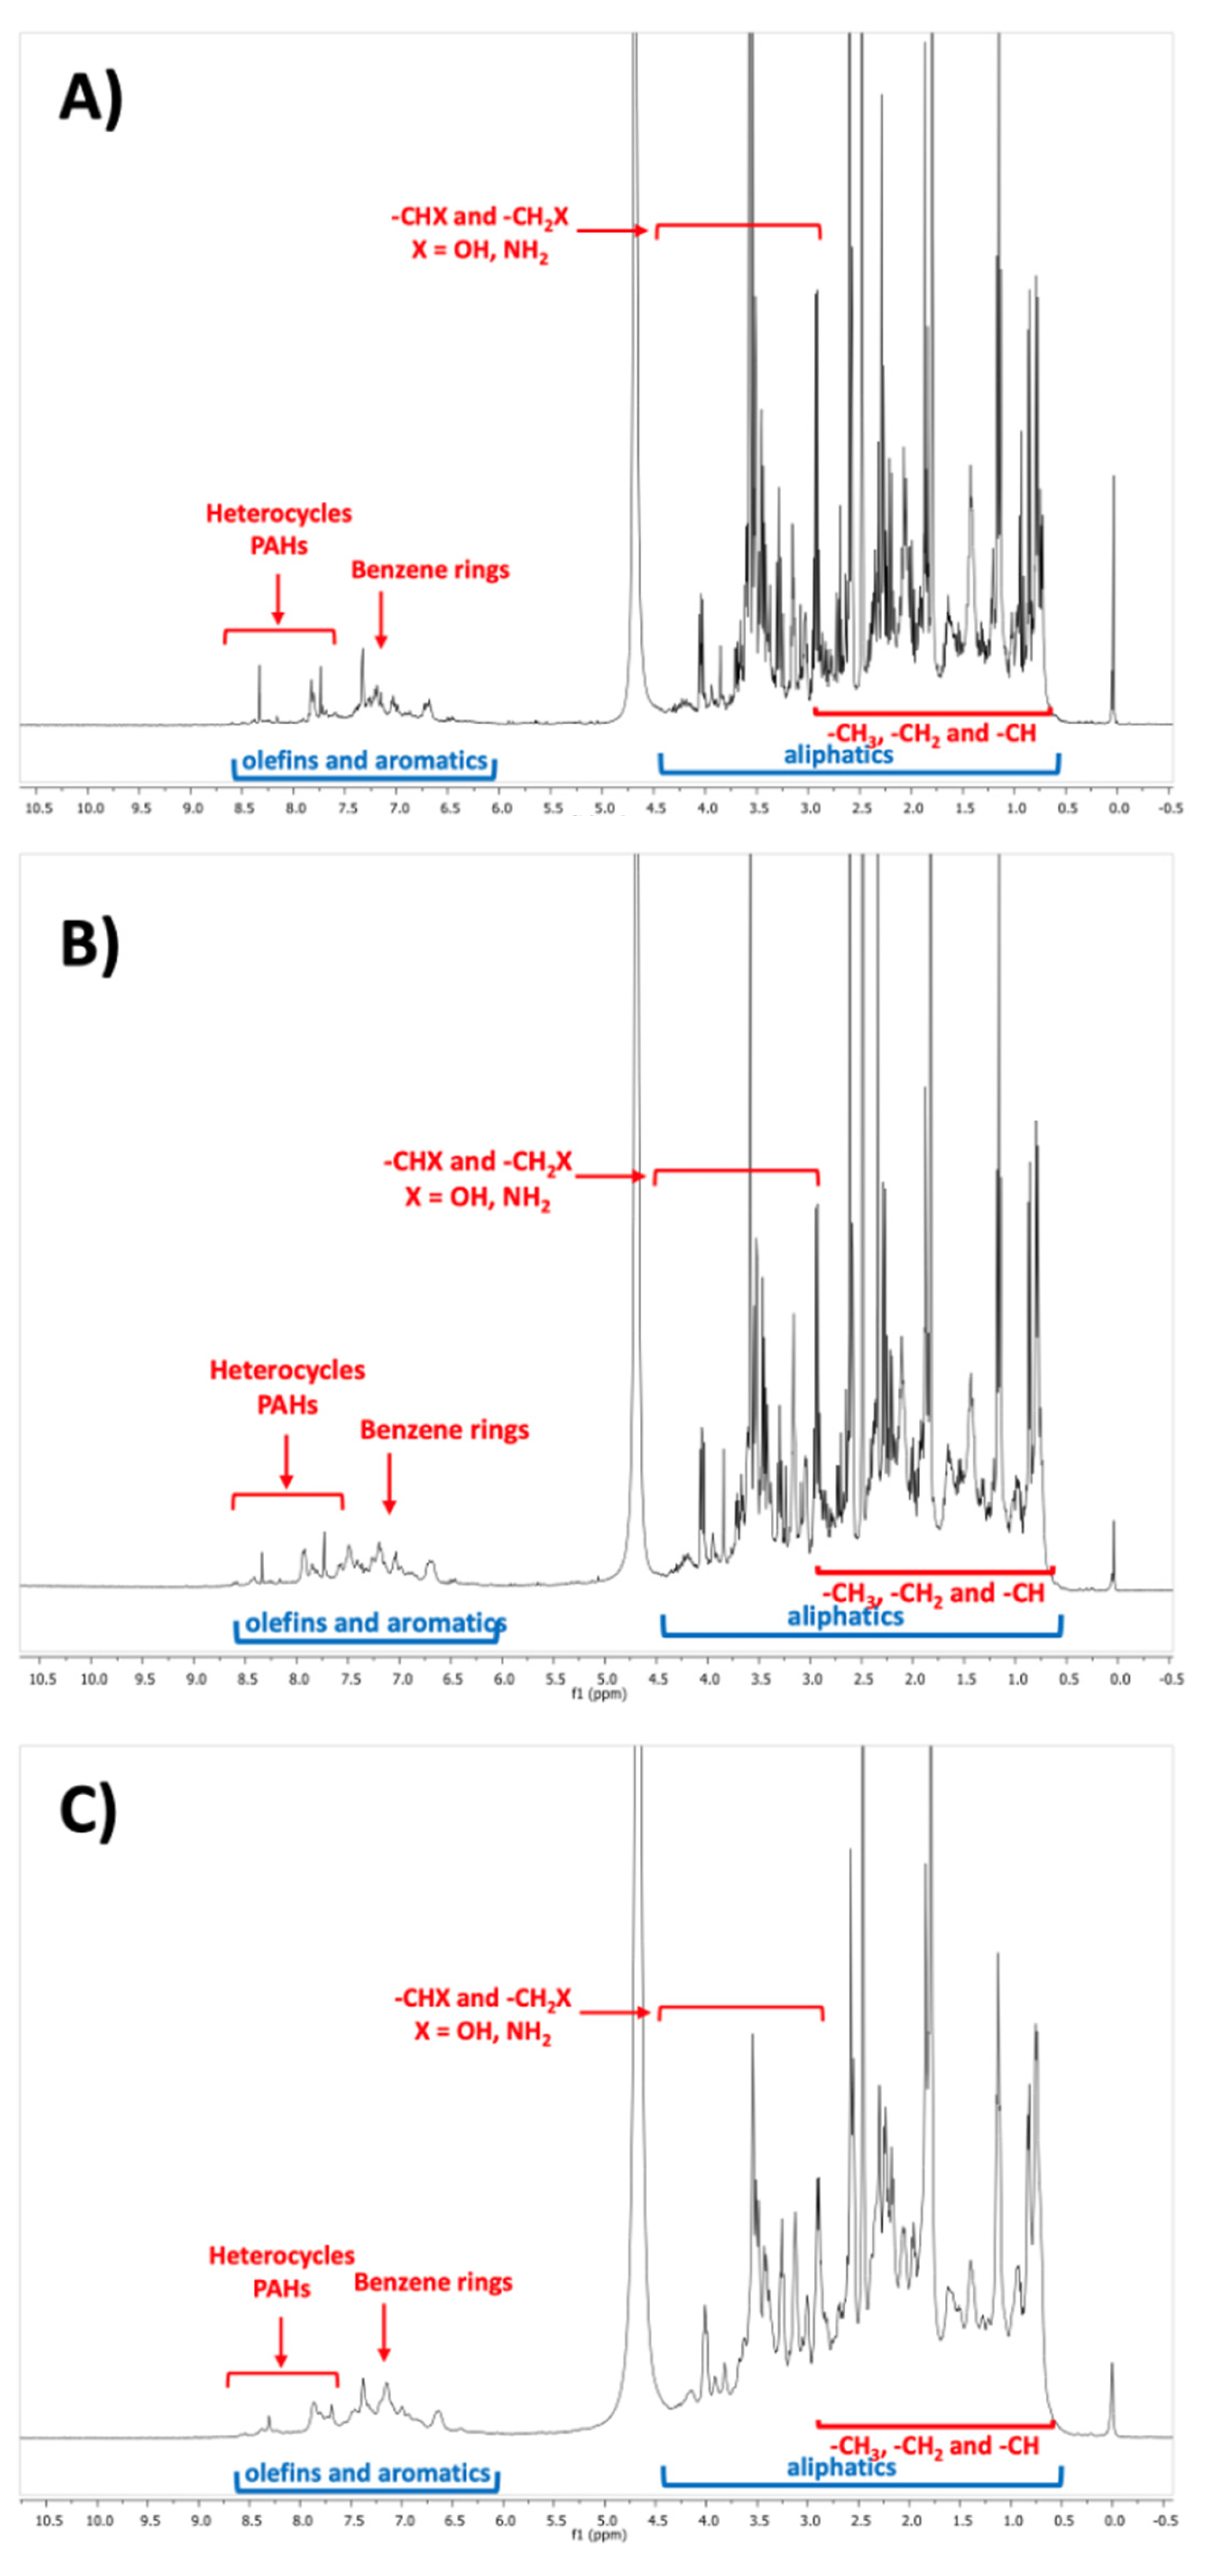
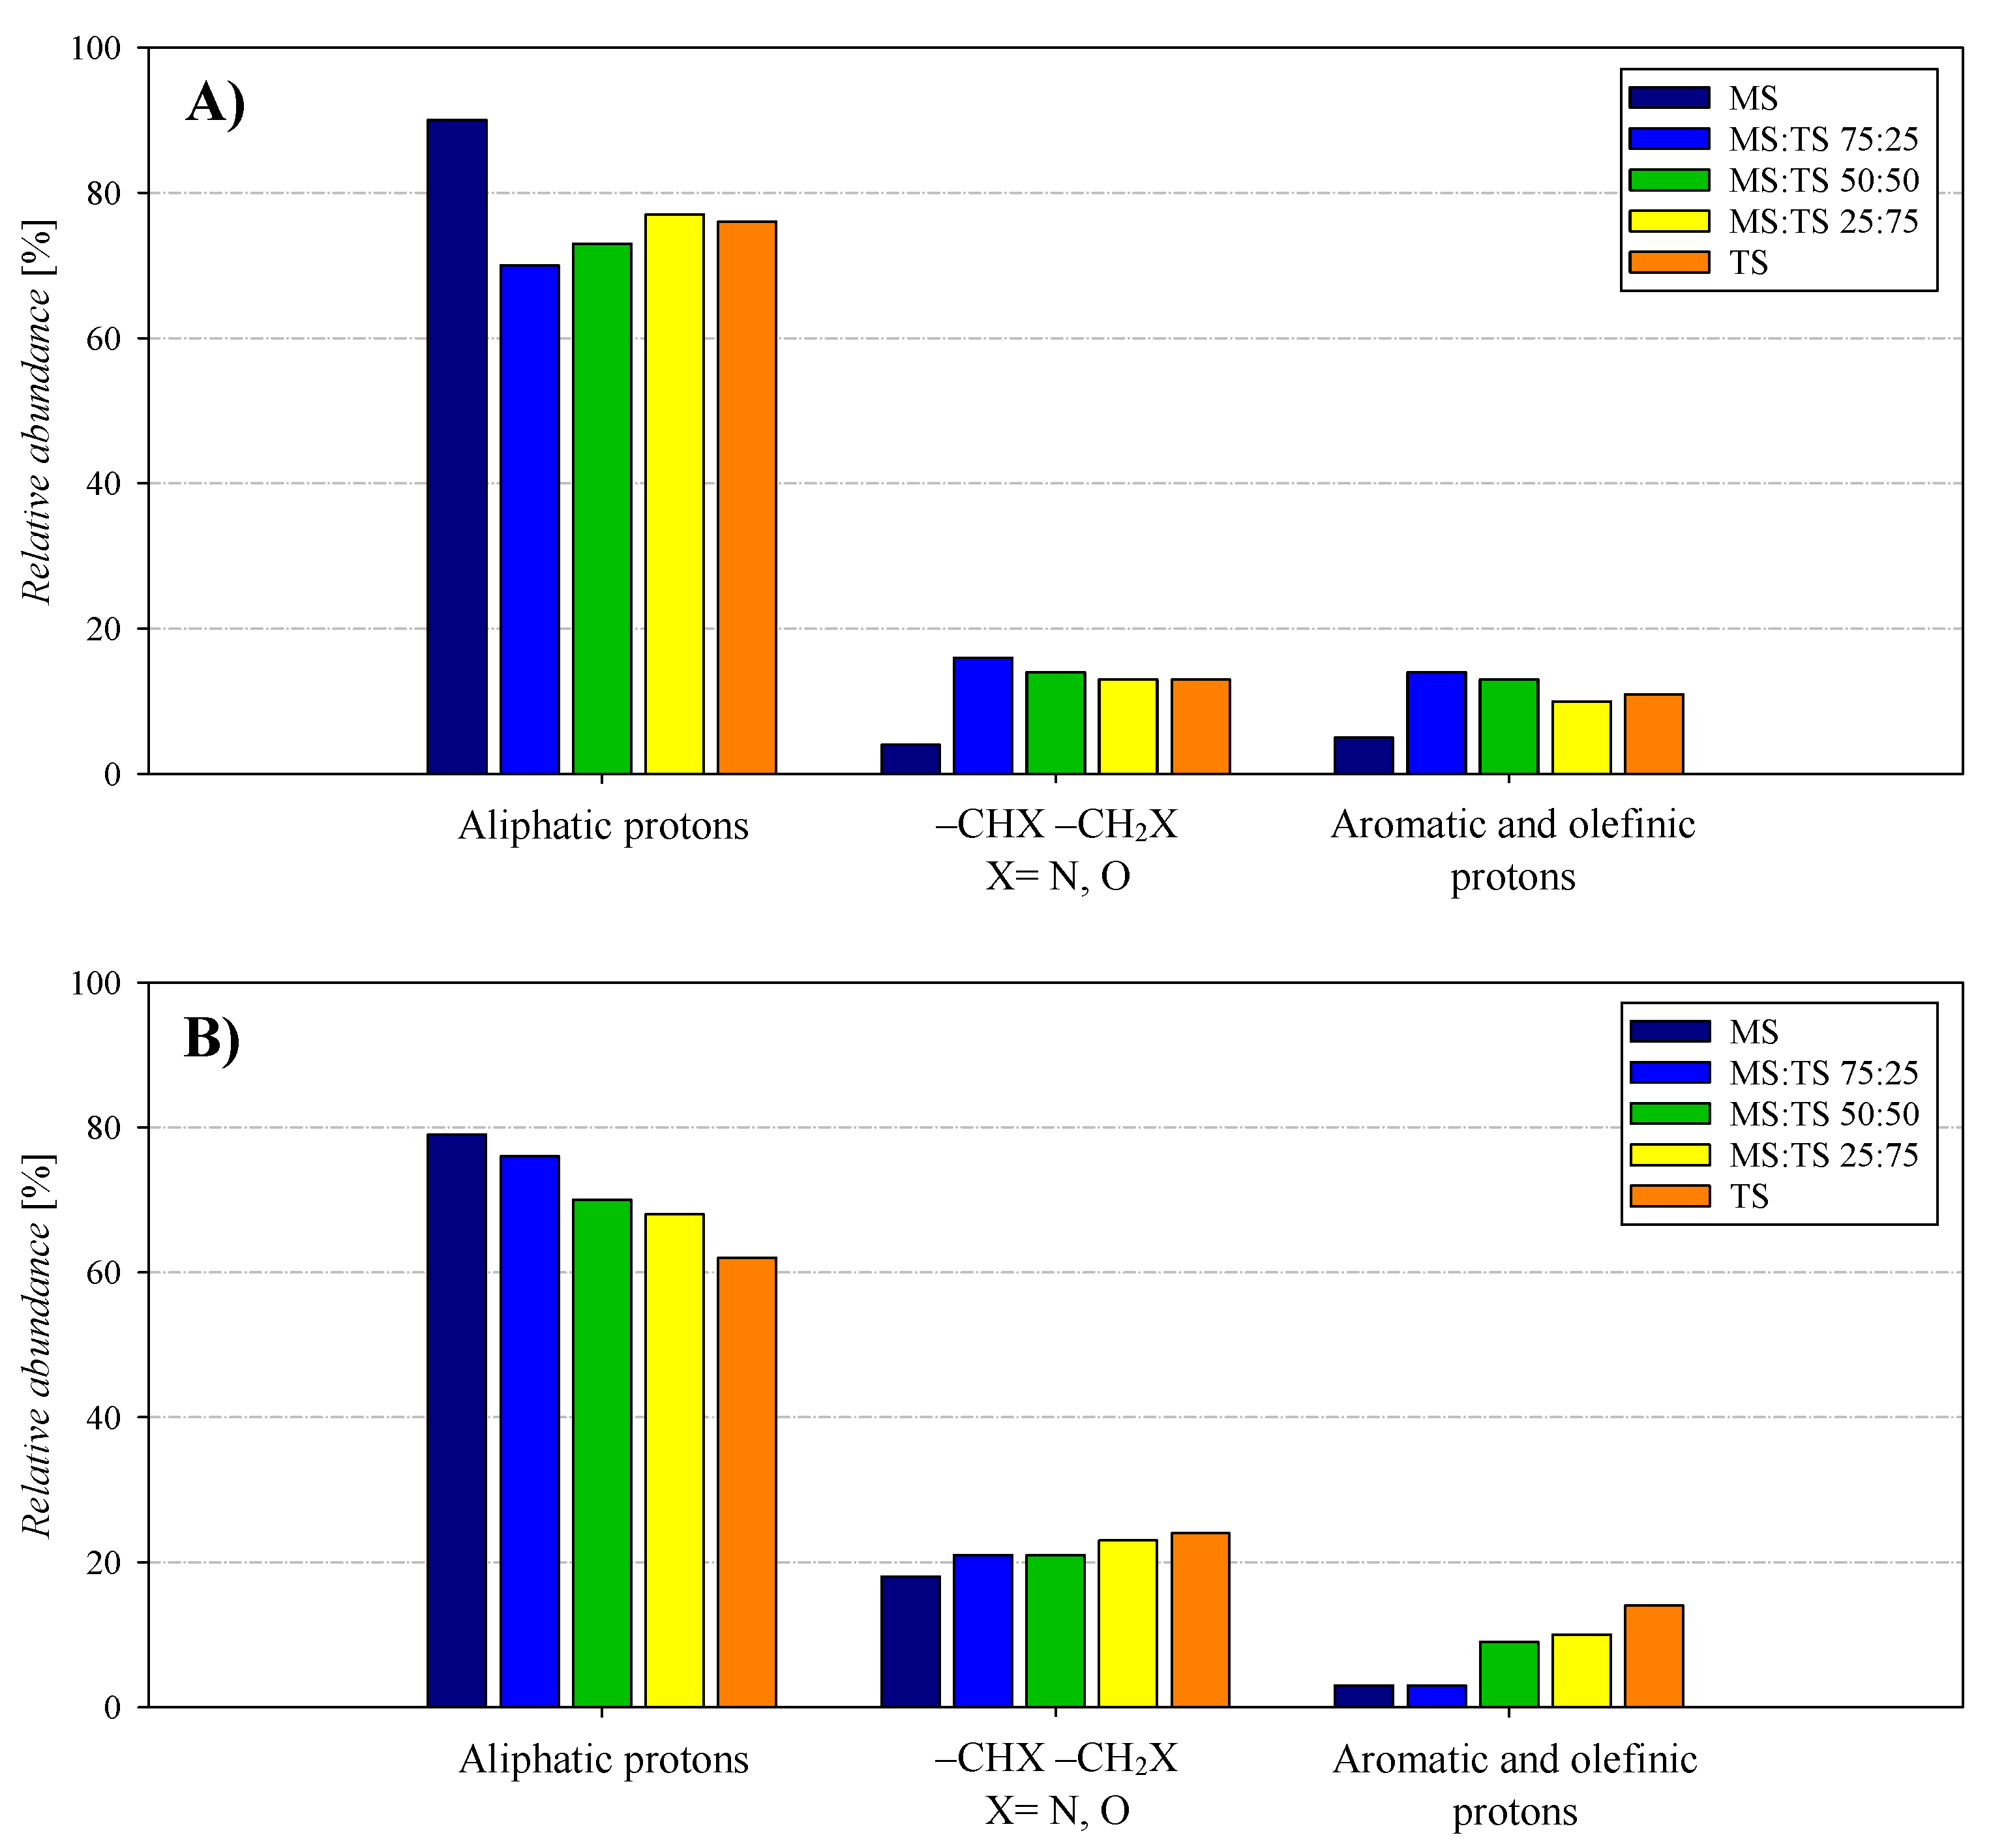
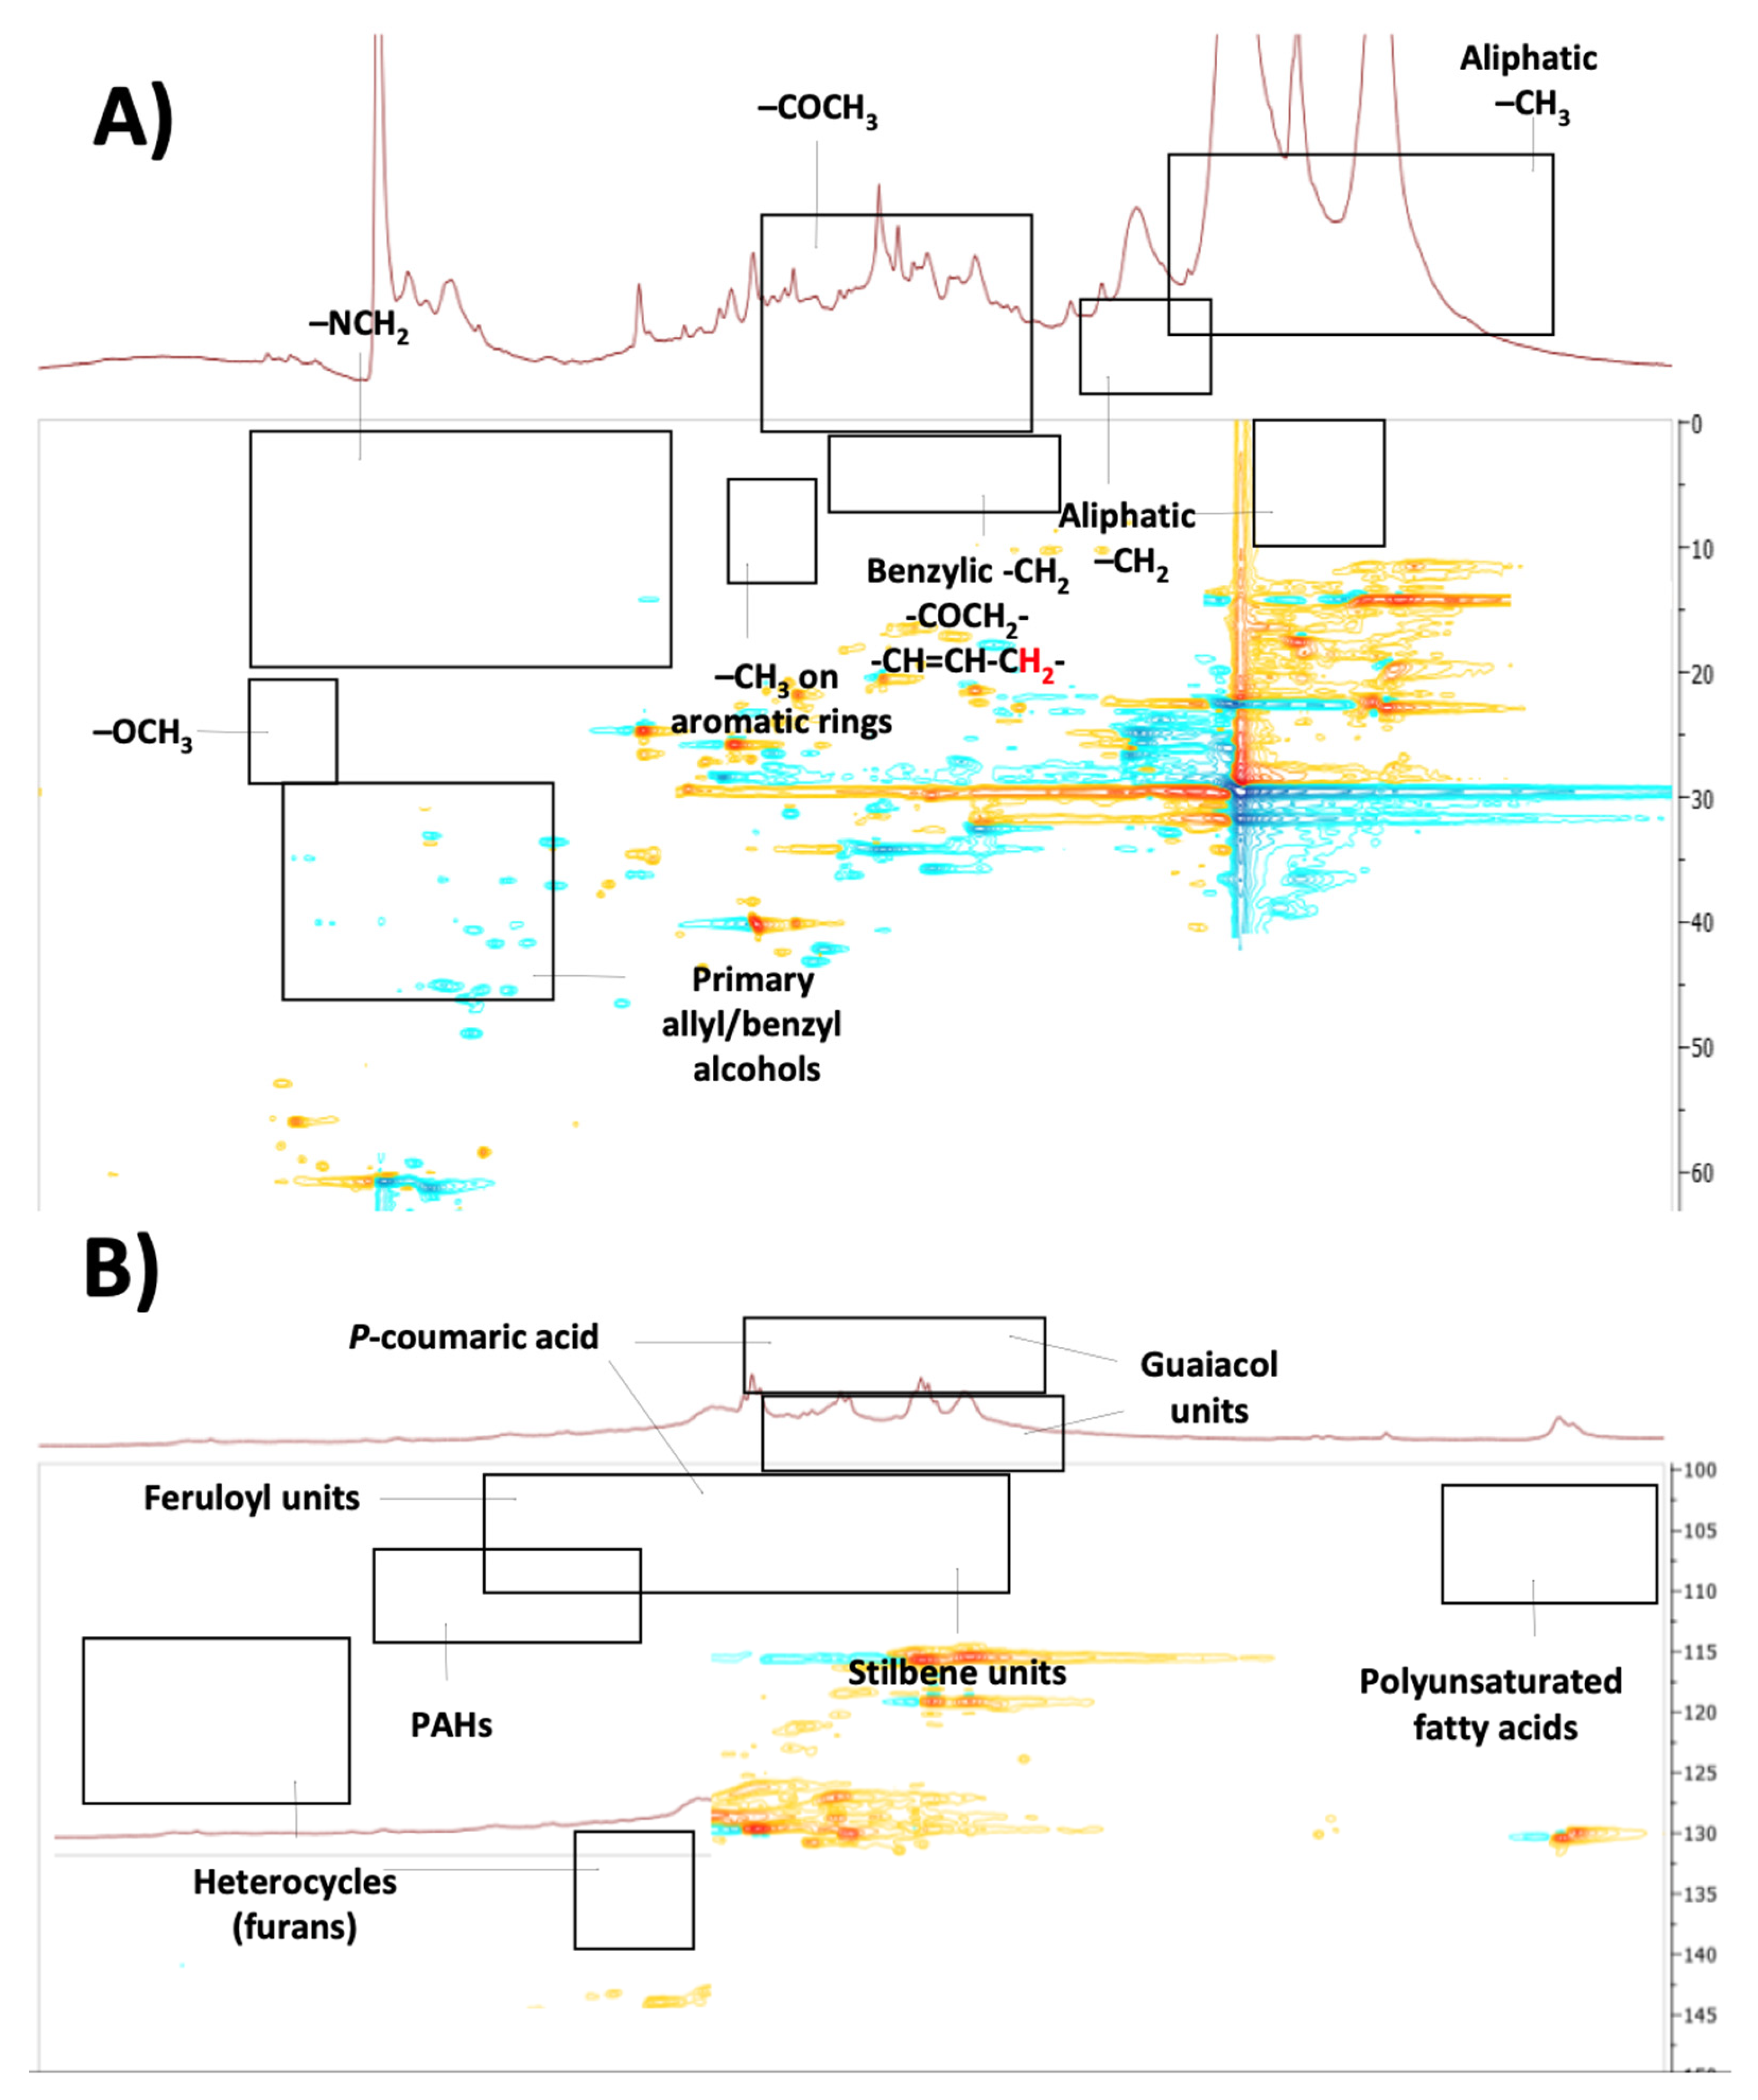
3.3. Chemical Properties of Bio-Crude and Aqueous Phase

With reference to the content of this section, it is highlighted that the data for pure TS will be illustrated in detail in a parallel forthcoming paper, and the data for pure MS were from [47]; when necessary, they will be referred to here for comparison purposes.
To study the effect of the chemical composition of the sludges as HTL feedstock, a comparative analysis of the bio-crude and water fractions was developed through a combined NMR and LC-MS approach. The 1D and 2D NMR experiments were conducted on the HTL products resulting from the three mixtures of TS with MS (MS:TS 25:75, 50:50 and 75:25), Figure 3 and Figure 4.
Both the bio-crude and water fractions are mainly made up of aliphatic compounds (signals in the range 0–5 ppm), of which a minor fraction is made up of protons belonging to alcohol and amine groups (signals in the range 3–5 ppm) and olefins and aromatic compounds (signals in the range 5–9 ppm). It is highlighted that a small part of the aliphatic protons can be attributable to side chains of alcohols and amines, and also denoted by the proton–proton correlations shown in the 1H,1H-COSY spectrum (Figures S2 and S3). The formation of aldehydes (9.5 ppm) and carboxylic acids (12 ppm) was detected only for pure TS; the same sludge also presented, in the aqueous phase, a greater content of aliphatic compounds (numerous proton signals in the 0–3 ppm region).
By integrating the proton signals into the 1H-NMR spectra, it was possible to calculate the relative abundancies of aromatic and aliphatic compounds, alcohols and amines in the bio-crude and aqueous phase deriving from TS and its mixtures with MS. The data reported in Figure 5 confirm the great abundance of aliphatic compounds and revealed that a higher % of TS in the sludge mixtures corresponds to the formation of greater quantities of alcohols, amines, olefins and aromatic compounds compared to aliphatic compounds. This increase, which is more marked in the water fractions with respect to the bio-crude, could be correlated to higher levels of proteins (see also Table 1) and tannins typically present in TS (cf. also reaction schemes reported in [39,52]).
A preliminary identification of the class of compounds present in the bio-crude and aqueous phases was obtained by the inspection of the 1H,1H-COSY (Figures S2–S5) and the 1H,13C-HSQC DEPT spectra (Figure 6 and Figure 7). No appreciable differences emerged from the bidimensional spectra recorded for the three mixed sludges; therefore, for simplicity, in Figure 6 and Figure 7 we have reported only the spectra for MS:TS 75:25 (for the bio-crude and aqueous phases, respectively). In good agreement with the data reported in Figure 5, the spectra showed a broader collection of signals due to the presence of amines and alcohols, compared to those observed in the case of pure MS reported in [47]. A similar enrichment was also evident when comparing the spectra of the mixed sludges and those of the pure TS and MS. In particular, a greater number of signals due to amines, PAHs and heterocycles (i.e., furans and pyridines) were detected in the mixed sludge spectra, suggesting that, in these cases, the HTL treatment can afford more complex mixtures of compounds.
In both the case of pure and mixed sludges, it was evident the presence of a large variety of aromatic ring systems including guaiacol (6.6/114, 6.7–7.4/120 and 6.9–7.2/126 ppm), p-coumaric acid (6.7–6.9/115 and 7.0–7.5/127 ppm), feruloyl (7.7/130 ppm), stilbene (6.9–7.4/130 ppm) and cinnamyl (6.3–6.7/115 and 6.9–7.4/130 ppm) units.
The bio-crude fractions also showed the signals of olefinic protons of polyunsaturated fatty acids (5.3/130 ppm) and aliphatic -CH2 and -CH3 protons in the region 0.5–2.5/10–40 ppm, while the aqueous phases showed a greater number of signals due to the protons of the amines (2.6–3.5/40–50 ppm), of the alcohols (3.0–4.1/55–75 ppm) and of the Hα of the amino acids (3.7–4.2/55–60 ppm).
Having made this general overview of the main components of the bio-crude and aqueous phases, to address their chemical composition in more detail, all samples were subjected to LC-MS analysis. From the collected data reported in Table 4, it was evident that the mixed sludges contributed to the formation of a greater number of compounds after the HTL treatment compared to the pure TS and MS, supporting what was anticipated by the NMR analyses. In particular, numerous compounds obtained from the decomposition of polyphenols were detected, including methyl syringol, gallic acid, ferulic acid, methyl guaiacol, p-coumaric acid, homovanillic acid, sinapil alcohol, coniferilic alcohol as well as PAHs (i.e., fluorene, phenanthrene, pyrene, dibenzoanthracene). In the aqueous phases, we have also identified the products deriving from the decomposition of carbohydrates such as hydroxymethylfurancarboxylic acid, hydroxymethylfurfural and cellobiose, the latter derived specifically from cellulose, while, in the bio-crude fractions, the products of the decomposition of lipids such as methyl palmitate, methyl stearate, methyl oleate, ethyl oleate and stigmasterol were observed. Protein decomposition was evident from the identification of phenylethylamine, tryptamine, phenylpropionic acid and a number of nitrogen-containing products resulting from crossed decomposition processes involving proteins and lipids (i.e., hexadecylamine, octadecylamine, methyl dodecanamide, N,N-dimethylstearamide, hexadecanamide) and proteins and carbohydrates. In the latter case, two different classes of compounds were detected, one consisting of the products obtained by combining the amino groups of amino acids in proteins with the products of the retro-aldol decomposition of monosaccharides (i.e., quinoline, naphthylamine, 2-phenylpyridine), and the other constituted of the products obtained from the Maillard reaction and subsequent decomposition into AGEs (i.e., advanced glycation end-products such as fructosyllysine, carboxyethyllysine, carboxymethylarginine, carboxyethylarginine and argpyrimidine). The above results are in line with the HTL reaction mechanisms reported in the literature for systems containing proteins and carbohydrates [42].

4. Conclusions

In this work, the role of the possible synergistic/antagonistic effects of lipids, proteins and carbohydrates, during the hydrothermal liquefaction process applied to realistic matrices, was examined. The HTL tests on municipal sludge, tannery sludge and their mixtures in ratios 25:75, 50:50 and 75:25, were performed in a 500 mL batch reactor at a temperature of 350 °C and with a reaction time ranging from 10 to 40 min. The results showed that the remarkably high bio-crude yield obtained for municipal sludge at the minimum test time (t = 10 min) could be explained in light of the significant carbohydrate content for this sludge, capable of determining the formation of a bio-crude with a high content of aliphatic compounds. As regards the yields obtained from mixing the two sludges, there is an optimal value of the carbohydrate-to-protein mass ratio (2:1, as in the case of MS:TS 75:25) which favours the reactive network towards the formation of bio-oil. The reaction mechanisms that lead to the formation of bio-crude from mixtures of carbohydrate and protein derivatives could be traced back to Maillard reactions. Indeed, reactions involving the solubilisation of carbohydrates to form soluble products in the aqueous phase, such as hydrolysis and retro-aldol condensation, are favoured for short reaction times at the operating temperature (350 °C) used in the present work. Subsequently, saccharides can: (i) react with the amide groups to form glycosylamine derivatives, which rearrange into the Amadori compound, a reactive intermediate, then subjected to cyclisation and scission reactions to form advanced glycation end-products including carboxymethyllysine, pyrazines and pyrimidines; (ii) undergo reactions such as Grob fragmentation and retro-aldol reactions, forming numerous smaller oxygenated compounds, containing carbonic or carboxyl groups. These fragments can condense with the nitrogen of amino acids to form nitrogen-containing heterocyclic compounds. These hypotheses are supported by the H-NMR and LC-MS analyses, from which it is evident that the mixed sludges contributed to the formation of a greater number of compounds (resulting from the reaction mechanisms described above) after the HTL treatment, compared to the pure tannery and municipal sludges. Finally, this work in particular can be seen as pioneering in considering tannery sludge in energy valorisation processes through HTL and in analysing how the content of lipids, proteins and carbohydrates in tannery sludge can influence the yield of bio-crude.

Supplementary Materials

The following supporting information can be downloaded at: https://www.mdpi.com/article/10.3390/su16051770/s1, Figure S1: HTL products separation steps; Figure S2: 1H,1H-COSY spectrum (DMSO-d6) of the bio-crude fraction obtained at 350 °C and 10 min from pure TS; Figure S3: 1H,1H-COSY spectrum (D2O) of the aqueous fraction obtained at 350 °C and 10 min from pure TS; Figure S4: 1H,1H-COSY spectrum (DMSO-d6) of the bio-crude fraction obtained at 350 °C and 10 min from a mixed sludge composed by MS:TS 75:25; Figure S5: 1H,1H-COSY spectrum (D2O) of the aqueous fraction obtained at 350 °C and 10 min from a mixed sludge composed by MS:TS 75:25.

Author Contributions

Conceptualization, all authors; methodology, M.B., F.D.L., M.L.A., P.M. and R.S.; investigation, M.B., F.D.L. and M.L.A.; resources, M.B., P.M., P.S., F.M. and R.S.; data curation, M.B., F.D.L., M.L.A. and P.M.; writing—original draft preparation, M.B., F.D.L., M.L.A., P.M. and F.M.; writing—review and editing, all authors; supervision, M.B., P.M., P.S., F.M. and R.S.; project administration, M.B., P.S., F.M. and R.S.; funding acquisition, M.B., P.S., F.M. and R.S. All authors have read and agreed to the published version of the manuscript.

Funding

Project funded under the National Recovery and Resilience Plan (NRRP), Mission 4 Component 2 Investment 1.3 - Call for tender No. 1561 of 11.10.2022 of Ministero dell’Università e della Ricerca (MUR); funded by the European Union – NextGenerationEU. Project code PE0000021, Concession Decree No. 1561 of 11.10.2022 adopted by Ministero dell’Università e della Ricerca (MUR), CUP – E63C22002160007, Project title “Network 4 Energy Sustainable Transition – NEST”. Part of the research activities carried out in the framework of the Programma per il Finanziamento della Ricerca di Ateneo (FRA) 2022 of the University of Naples Federico II (Project “Eco-sustainable Production of bIofuels from the Conversion of sludges through hydrothermal liquefaction” (EPIC)).

Institutional Review Board Statement

Not applicable.

Informed Consent Statement

Not applicable.

Data Availability Statement

The data presented in this study are available on request from the corresponding authors. The data are not publicly available due to privacy restrictions.

Acknowledgments

The authors are grateful to Renata Migliaccio for the characterisation of the sludges.

Conflicts of Interest

The authors declare no conflicts of interest.

References

  1. Balsamo, M.; Montagnaro, F.; Anthony, E.J. Socio-economic parameters affect CO2 emissions and energy consumption—An analysis over the United Nations Countries. Curr. Opin. Green Sustain. Chem. 2023, 40, 100740. [Google Scholar] [CrossRef]
  2. Ahanchi, M.; Jafary, T.; Yeneneh, A.M.; Rupani, P.F.; Shafizadeh, A.; Shahbeik, H.; Pan, J.; Tabatabaei, M.; Aghbashlo, M. Review on waste biomass valorization and power management systems for microbial fuel cell application. J. Clean. Prod. 2022, 380, 134994. [Google Scholar] [CrossRef]
  3. Náthia-Neves, G.; Berni, M.; Dragone, G.; Mussatto, S.I.; Forster-Carneiro, T. Anaerobic digestion process: Technological aspects and recent developments. Int. J. Environ. Sci. Technol. 2018, 15, 2033–2046. [Google Scholar] [CrossRef]
  4. Kunatsa, T.; Xia, X. A review on anaerobic digestion with focus on the role of biomass co-digestion, modelling and optimisation on biogas production and enhancement. Bioresour. Technol. 2022, 344, 126311. [Google Scholar] [CrossRef]
  5. Lazaroiu, G.; Pop, E.; Negreanu, G.; Pisa, I.; Mihaescu, L.; Bondrea, A.; Berbece, V. Biomass combustion with hydrogen injection for energy applications. Energy 2017, 127, 351–357. [Google Scholar] [CrossRef]
  6. Hao, D.; Xuguang, J.; Lv, G.; Yong, C.; Jianhua, Y. Co-combustion of tannery sludge in a commercial circulating fluidized bed boiler. Waste Manag. 2015, 46, 227–233. [Google Scholar]
  7. Vuppaladadiyam, A.K.; Vuppaladadiyam, S.S.V.; Awasthi, A.; Sahoo, A.; Rehman, S.; Pant, K.K.; Murugavelh, S.; Huang, Q.; Anthony, E.; Fennel, P.; et al. Biomass pyrolysis: A review on recent advancements and green hydrogen production. Bioresour. Technol. 2022, 364, 128087. [Google Scholar] [CrossRef] [PubMed]
  8. Udayanga, W.D.C.; Veksha, A.; Giannis, A.; Lim, T.T. Pyrolysis derived char from municipal and industrial sludge: Impact of organic decomposition and inorganic accumulation on the fuel characteristics of char. Waste Manag. 2019, 83, 131–141. [Google Scholar] [CrossRef] [PubMed]
  9. Del Grosso, M.; Sridharan, B.; Tsekos, C.; Klein, S.; de Jong, W. A modelling based study on the integration of 10 MWth indirect torrefied biomass gasification, methanol and power production. Biomass Bioenergy 2020, 136, 105529. [Google Scholar] [CrossRef]
  10. Molino, A.; Larocca, V.; Chianese, S.; Musmarra, D. Biofuels production by biomass gasification: A review. Energies 2018, 11, 811. [Google Scholar] [CrossRef]
  11. Di Lauro, F.; Migliaccio, R.; Ruoppolo, G.; Balsamo, M.; Montagnaro, F.; Imperiale, E.; Caracciolo, D.; Urciuolo, M. Tannery sludge gasification in a fluidized bed for its energetic valorization. Ind. Eng. Chem. Res. 2022, 61, 16972–16979. [Google Scholar] [CrossRef]
  12. Zaccariello, L.; Montagnaro, F. Fluidised bed gasification of biomasses and wastes to produce hydrogen-rich syn-gas—A review. J. Chem. Technol. Biotechnol. 2023, 98, 1878–1887. [Google Scholar] [CrossRef]
  13. Brachi, P.; Chirone, R.; Miccio, M.; Ruoppolo, G. Fluidized bed torrefaction of commercial wood pellets: Process performance and solid product quality. Energy Fuels 2018, 32, 9459. [Google Scholar] [CrossRef]
  14. Adams, P.; Bridgwater, T.; Lea-Langton, A.; Ross, A.; Watson, I. Chapter 8—Biomass Conversion Technologies. In Greenhouse Gas Balances of Bioenergy Systems; Thornley, P., Adams, P., Eds.; Academic Press: Cambridge, MA, USA, 2018; pp. 107–139. [Google Scholar]
  15. Aziz, M.; Darmawan, A.; Juangsa, F.B. Hydrogen production from biomasses and wastes: A technological review. Int. J. Hydrogen Energy 2021, 46, 33756–33781. [Google Scholar] [CrossRef]
  16. Li, P.; Shi, X.; Wang, X.; Song, J.; Fang, S.; Bai, J.; Zhang, G.; Chang, C.; Pang, S. Bio-oil from biomass fast pyrolysis: Yields, related properties and energy consumption analysis of the pyrolysis system. J. Clean. Prod. 2021, 328, 129613. [Google Scholar] [CrossRef]
  17. Klüpfel, C.; Herklotz, B.; Biller, P. Influence of processing conditions and biochemical composition on the hydrothermal liquefaction of digested urban and agricultural wastes. Fuel 2023, 352, 129016. [Google Scholar] [CrossRef]
  18. Parkhey, P. Biomethanol: Possibilities towards a bio-based economy. Biomass Convers. Biorefinery 2022, 12, 1877–1887. [Google Scholar] [CrossRef]
  19. Kumar, M.; Oyedun, A.O.; Kumar, A. A review on the current status of various hydrothermal technologies on biomass feedstock. Renew. Sustain. Energy Rev. 2018, 81, 1742–1770. [Google Scholar] [CrossRef]
  20. Wang, L.; Chang, Y.; Li, A. Hydrothermal carbonization for energy-efficient processing of sewage sludge: A review. Renew. Sustain. Energy Rev. 2019, 108, 423–440. [Google Scholar] [CrossRef]
  21. Liu, H.; Basar, I.A.; Eskicioglu, C. Hydrothermal liquefaction for sludge-to-energy conversion: An evaluation of biocrude production and management of waste streams. Energy 2023, 281, 128268. [Google Scholar] [CrossRef]
  22. Toor, S.S.; Rosendahl, L.; Rudolf, A. Hydrothermal liquefaction of biomass: A review of subcritical water technologies. Energy 2011, 36, 2328–2342. [Google Scholar] [CrossRef]
  23. Prestigiacomo, C.; Scialdone, O.; Galia, A. Hydrothermal liquefaction of wet biomass in batch reactors: Critical assessment of the role of operating parameters as a function of the nature of the feedstock. J. Supercrit. Fluids 2022, 189, 105689. [Google Scholar] [CrossRef]
  24. Thomsen, L.B.S.; Carvalho, P.N.; dos Passos, J.S.; Anastasakis, K.; Bester, K.; Biller, P. Hydrothermal liquefaction of sewage sludge; energy considerations and fate of micropollutants during pilot scale processing. Water Res. 2020, 183, 116101. [Google Scholar] [CrossRef]
  25. Tai, L.; de Caprariis, B.; Scarsella, M.; De Filippis, P.; Marra, F. Improved quality bio-crude from hydrothermal liquefaction of oak wood assisted by zero-valent metals. Energy Fuels 2021, 35, 10023–10034. [Google Scholar] [CrossRef]
  26. Gollakota, A.R.K.; Kishore, N.; Gu, S. A review on hydrothermal liquefaction of biomass. Renew. Sustain. Energy Rev. 2018, 81, 1378–1392. [Google Scholar] [CrossRef]
  27. Biller, P.; Ross, A.B. Potential yields and properties of oil from the hydrothermal liquefaction of microalgae with different biochemical content. Bioresour. Technol. 2011, 102, 215–225. [Google Scholar] [CrossRef]
  28. Teri, G.; Luo, L.; Savage, P.E. Hydrothermal treatment of protein, polysaccharide, and lipids alone and in mixtures. Energy Fuels 2014, 28, 7501–7509. [Google Scholar] [CrossRef]
  29. Kumar, M.; Sun, Y.; Rathour, R.; Pandey, A.; Thakur, I.S.; Tsang, D.C.W. Algae as potential feedstock for the production of biofuels and value-added products: Opportunities and challenges. Sci. Total Environ. 2020, 716, 137116. [Google Scholar] [CrossRef] [PubMed]
  30. Brindhadevi, K.; Anto, S.; Rene, E.R.; Sekar, M.; Mathimani, T.; Chi, N.T.L.; Pugazhendhi, A. Effect of reaction temperature on the conversion of algal biomass to bio-oil and biochar through pyrolysis and hydrothermal liquefaction. Fuel 2021, 285, 119106. [Google Scholar] [CrossRef]
  31. He, S.; Zhao, M.; Wang, J.; Cheng, Z.; Yan, B.; Chen, G. Hydrothermal liquefaction of low-lipid algae Nannochloropsis sp. and Sargassum sp.: Effect of feedstock composition and temperature. Sci. Total Environ. 2020, 712, 135677. [Google Scholar] [CrossRef] [PubMed]
  32. Li, J.; Zhang, W.; Liu, T.; Yang, L.; Li, H.; Peng, H.; Jiang, S.; Wang, X.; Leng, L. Machine learning aided bio-oil production with high energy recovery and low nitrogen content from hydrothermal liquefaction of biomass with experiment verification. Chem. Eng. J. 2021, 425, 130649. [Google Scholar] [CrossRef]
  33. Peterson, A.A.; Lachance, R.P.; Tester, J.W. Kinetic evidence of the Maillard reaction in hydrothermal biomass processing: Glucose–glycine interactions in high-temperature, high-pressure water. Ind. Eng. Chem. Res. 2010, 49, 2107–2117. [Google Scholar] [CrossRef]
  34. Fan, Y.; Hornung, U.; Dahmen, N. Hydrothermal liquefaction of sewage sludge for biofuel application: A review on fundamentals, current challenges and strategies. Biomass Bioenergy 2022, 165, 106570. [Google Scholar] [CrossRef]
  35. Shah, A.A.; Toor, S.S.; Conti, F.; Nielsen, A.H.; Rosendahl, L.A. Hydrothermal liquefaction of high ash containing sewage sludge at sub and supercritical conditions. Biomass Bioenergy 2020, 135, 105504. [Google Scholar] [CrossRef]
  36. dos Passos, J.S.; Matayeva, A.; Biller, P. Synergies during hydrothermal liquefaction of cow manure and wheat straw. J. Environ. Chem. Eng. 2022, 10, 108181. [Google Scholar] [CrossRef]
  37. Yang, J.; He, Q.S.; Yang, L. A review on hydrothermal co-liquefaction of biomass. Appl. Energy 2019, 250, 926–945. [Google Scholar] [CrossRef]
  38. Thomsen, L.B.S.; Anastasakis, K.; Biller, P. Hydrothermal liquefaction potential of wastewater treatment sludges: Effect of wastewater treatment plant and sludge nature on products distribution. Fuel 2024, 355, 129525. [Google Scholar] [CrossRef]
  39. Subramanya, S.M.; Rios, N.; Kollar, A.; Stofanak, R.; Maloney, K.; Waltz, K.; Powers, L.; Rane, C.; Savage, P.E. Statistical models for predicting oil composition from hydrothermal liquefaction of biomass. Energy Fuels 2023, 37, 6619–6628. [Google Scholar] [CrossRef]
  40. Chacón-Parra, A.D.; Hall, P.A.; Lewis, D.M.; Glasius, M.; van Eyk, P.J. Elucidating the Maillard reaction mechanism in the hydrothermal liquefaction of binary model compound mixtures and spirulina. ACS Sustain. Chem. Eng. 2022, 10, 10989–11003. [Google Scholar] [CrossRef]
  41. Tito, E.; Pipitone, G.; Monteverde Videla, A.H.A.; Bensaid, S.; Pirone, R. Exploring HTL pathways in carbohydrate–protein mixture: A study on glucose–glycine interaction. Biomass Convers. Biorefinery 2023, 13, 16385–16404. [Google Scholar] [CrossRef]
  42. Fan, Y.; Hornung, U.; Dahmen, N.; Kruse, A. Hydrothermal liquefaction of protein-containing biomass: Study of model compounds for Maillard reactions. Biomass Convers. Biorefinery 2018, 8, 909–923. [Google Scholar] [CrossRef]
  43. Bligh, E.G.; Dyer, W.J. A rapid method of total lipid extraction and purification. Can. J. Biochem. Physiol. 1959, 37, 911–917. [Google Scholar] [CrossRef] [PubMed]
  44. Albalasmeh, A.A.; Berhe, A.A.; Ghezzehei, T.A. A new method for rapid determination of carbohydrate and total carbon concentrations using UV spectrophotometry. Carbohydr. Polym. 2013, 97, 253–261. [Google Scholar] [CrossRef]
  45. Hartree, E.F. Determination of protein: A modification of the lowry method that gives a linear photometric response. Anal. Biochem. 1972, 48, 422–427. [Google Scholar] [CrossRef]
  46. Di Lauro, F.; Balsamo, M.; Solimene, R.; Salatino, P.; Montagnaro, F. Hydrothermal liquefaction process to obtain sludge-derived bio-fuels: Setup of the experimental apparatus and preliminary tests. Chem. Eng. Trans. 2022, 92, 475–480. [Google Scholar]
  47. Di Lauro, F.; Balsamo, M.; Solimene, R.; Alfieri, M.L.; Manini, P.; Migliaccio, R.; Salatino, P.; Montagnaro, F. Characterization of biocrude produced by hydrothermal liquefaction of municipal sewage sludge in a 500 mL batch reactor. Ind. Eng. Chem. Res. 2024, 63, 955–967. [Google Scholar] [CrossRef]
  48. Fan, Y.; Meyer, L.; Gong, M.; Krause, B.; Hornung, U.; Dahmen, N. Understanding the fate of nitrogen during catalytic hydrothermal liquefaction of sewage sludge. Fuel 2023, 339, 126948. [Google Scholar] [CrossRef]
  49. Barampouti, E.M.; Mai, S.; Malamis, D.; Moustakas, K.; Loizidou, M. Liquid biofuels from the organic fraction of municipal solid waste: A review. Renew. Sustain. Energy Rev. 2019, 110, 298–314. [Google Scholar] [CrossRef]
  50. Lu, J.; Fan, G.; Yang, M.; Wu, Y. Origin of carbon in the bio-oil from hydrothermal liquefaction of protein and glucose via isotopic labeling. Fuel 2022, 308, 121941. [Google Scholar] [CrossRef]
  51. Qiu, Y.; Aierzhati, A.; Cheng, J.; Guo, H.; Yang, W.; Zhang, Y. Biocrude oil production through the Maillard reaction between leucine and glucose during hydrothermal liquefaction. Energy Fuels 2019, 33, 8758–8765. [Google Scholar] [CrossRef]
  52. Basar, I.A.; Liu, H.; Carrere, H.; Trably, E.; Eskicioglu, C. A review on key design and operational parameters to optimize and develop hydrothermal liquefaction of biomass for biorefinery applications. Green Chem. 2021, 23, 1404–1446. [Google Scholar] [CrossRef]
Figure 1. Bio-crude yield (on dry and ash-free basis) as a function of HTL time and initial biomass, and t-averaged values.
Sustainability 16 01770 g001
Figure 2. Yield of (A) gas (on dry and ash-free basis) and (B) solid residue (on dry basis) as a function of HTL time and initial biomass.
Sustainability 16 01770 g002
Figure 3. 1H-NMR spectra (DMSO-d6) of the bio-crude obtained at 350 °C and 10 min from MS:TS 25:75 (A), MS:TS 50:50 (B) and MS:TS 75:25 (C).
Sustainability 16 01770 g003
Figure 4. 1H-NMR spectra (D2O) of the aqueous phase obtained at 350 °C and 10 min from MS:TS 25:75 (A), MS:TS 50:50 (B) and MS:TS 75:25 (C).
Sustainability 16 01770 g004
Figure 5. Relative abundance of aliphatic compounds, alcohols, amines, olefins and aromatic compounds in the bio-crude (A) and water (B) fractions for MS, TS and mixed sludges. The relative abundances were calculated by integrating 1H-NMR spectra over the range 0–3 ppm for aliphatic protons, 3–5 ppm for alcohol and amine protons, 9–5 ppm for olefin and aromatic compounds.
Sustainability 16 01770 g005
Figure 6. 1H,13C-HSQC DEPT spectrum (DMSO-d6) of the bio-crude fractions obtained at 350 °C and 10 min for MS:TS 75:25. Aliphatic proton/carbon region (A) and olefin/aromatic proton/carbon region (B). Highlighted in red, the protons corresponding to the detected signals.
Sustainability 16 01770 g006
Figure 7. 1H,13C-HSQC DEPT spectrum (D2O) of the aqueous fractions obtained at 350 °C and 10 min for MS:TS 75:25. Aliphatic proton/carbon region (A) and olefin/aromatic proton/carbon region (B). Highlighted in red, the protons corresponding to the detected signals.
Sustainability 16 01770 g007
Table 1. Chemical and energetic properties of sludges. HHV = higher heating value; LHV = lower heating value.
Municipal Sludge (MS)Tannery Sludge (TS)
Proximate analysis [% wt.]
Moisture12.68 ± 0.0118.46 ± 0.31
Volatile matter56.36 ± 0.0350.13 ± 0.06
Fixed carbon9.54 ± 0.11n.d.
Ash21.43 ± 0.1831.41 ± 0.43
Ultimate analysis [% wt.], dry basis
C34.55 ± 0.3233.61 ± 0.14
H4.87 ± 0.245.10 ± 0.19
N5.90 ± 0.072.44 ± 0.05
S0.77 ± 0.044.07 ± 0.03
Cl0.61 ± 0.020.35 ± 0.03
O28.7615.91
Heating value [MJ/kg], dry basis
HHV16.67 ± 0.4014.90 ± 0.31
LHV15.5713.75
Macro-components [% wt.], dry basis
Lipids2.4 ± 0.105.3 ± 0.20
Proteins25.0 ± 0.1029.4 ± 0.90
Carbohydrates59.0 ± 0.0321.0 ± 0.02
Table 2. Content of lipids, proteins and carbohydrates (expressed in % wt., on dry basis) for the 5 cases investigated.
Lipids (L)Proteins (P)Carbohydrates (C)L:P:C
MS2.425.059.01:10.4:24.6
MS:TS 75:253.126.149.51:8.4:16.0
MS:TS 50:503.827.240.01:7.2:10.5
MS:TS 25:754.628.330.51:6.2:6.6
TS5.329.421.01:5.6:4.0
Table 3. Evaluation, for the cases of interest, of higher heating value and energy recovery (HHVbiomass = 16.23 MJ/kg).
HHVbio-crude [MJ/kg] Y b i o - c r u d e d b [%], Equation (8)ER [%], Equation (5)
MS:TS 75:25, t = 10 min29.42 ± 0.8128.150.94
MS:TS 75:25, t = 30 min28.57 ± 1.6327.147.70
Table 4. Main compounds identified by the LC-MS analyses performed on bio-crude and aqueous phase samples from HTL tests on pure TS, MS and mixed MS:TS (w = water phase; o = bio-crude).
#Time
(min)
Compound[M + H]+
(m/z)
TSMS:TS
25:75
MS:TS
50:50
MS:TS
75:25
MS
13.5p-aminophenol110w/owww/ow
25cresol109wwww-
35.2xylene107--ww-
45.9hydroxymethylfuran-carboxylic acid143-www-
57.1hydroxymethylfurfural126wwwww/o
67.8dimethylindole146-wwww
77.9quinoline130w/ow/ow/ow/ow/o
88.5aminovaleraldehyde102-ooo-
98.8methyl syringol169w/ow/ow/ow/ow
109.1phenylethylamine122oooo-
119.5gallic acid171wwww/ow
1210ferulic acid195w/ow/ow/ow/ow
1310.2methyl guaiacol139w/ow/ow/ow/ow
1411p-coumaric acid165ooow/ow/o
1511.1tryptamine161oooo-
1611.5ethyl pyrrolidinone114w/ow/ow/ow/ow
1712phenylalanine166oooo-
1812.5phenylpropionic acid197w/owwww
1915.3naphthylamine144oooo-
2016.7cinnamic acid149wwww-
2117.3diphenylamine170oooo-
2217.5carboxyethyllysine219wwww-
2318homovanillic acid183w/ow/ow/ow/ow/o
2418.5sinapil alcohol211w/ow/ow/ow/ow/o
2519coniferilic alcohol181ow/ow/ow/ow/o
2620p-coumaryl alcohol151-ooow/o
2720.5argpyrimidine255--ww-
2820.8trimethylbenzonitrile146-www-
2922carboxyethylarginine247w/ow/ow/ow/o-
3022.2fluorene167-w/ow/ow/o-
3123.2carboxymethylarginine233--ww-
3226.4N-fructosyllysine309wwwww
3330.5p-nitrocatechol156w/ow/ow/ow/ow/o
34312-phenylpyridine156w/ow/ow/ow/ow/o
3538.4cellobiose343wwwww
3641.7hexadecylamine242oooo-
3743.4phenanthrene179wwwww/o
3845.5octadecylamine270oooo-
3947methyl palmitate271-oooo
4049.4methyl dodecanamide214ooooo
4150methyl stearate313ooooo
4250.7pyrene203-ooow/o
4352N,N-dimethylstearamide312ooooo
4452.2dibenzoanthracene279w/ow/ow/ow/ow/o
4552.5stigmasterol413w/ow/ow/ow/o-
4652.7tetradecanamide228ooooo
4753.5pentadecane213oooo-
4855tribenzocoronene425w/ow/ow/ow/oo
4955.8methyl oleate297ooooo
5056hexadecanamide256ooooo
5158heptadecane214oooo-
5259ethyl oleate311oooo-
Disclaimer/Publisher’s Note: The statements, opinions and data contained in all publications are solely those of the individual author(s) and contributor(s) and not of MDPI and/or the editor(s). MDPI and/or the editor(s) disclaim responsibility for any injury to people or property resulting from any ideas, methods, instructions or products referred to in the content.

