
A Literature Review of Seaport Decarbonisation: Solution Measures and Roadmap to Net Zero


Abstract
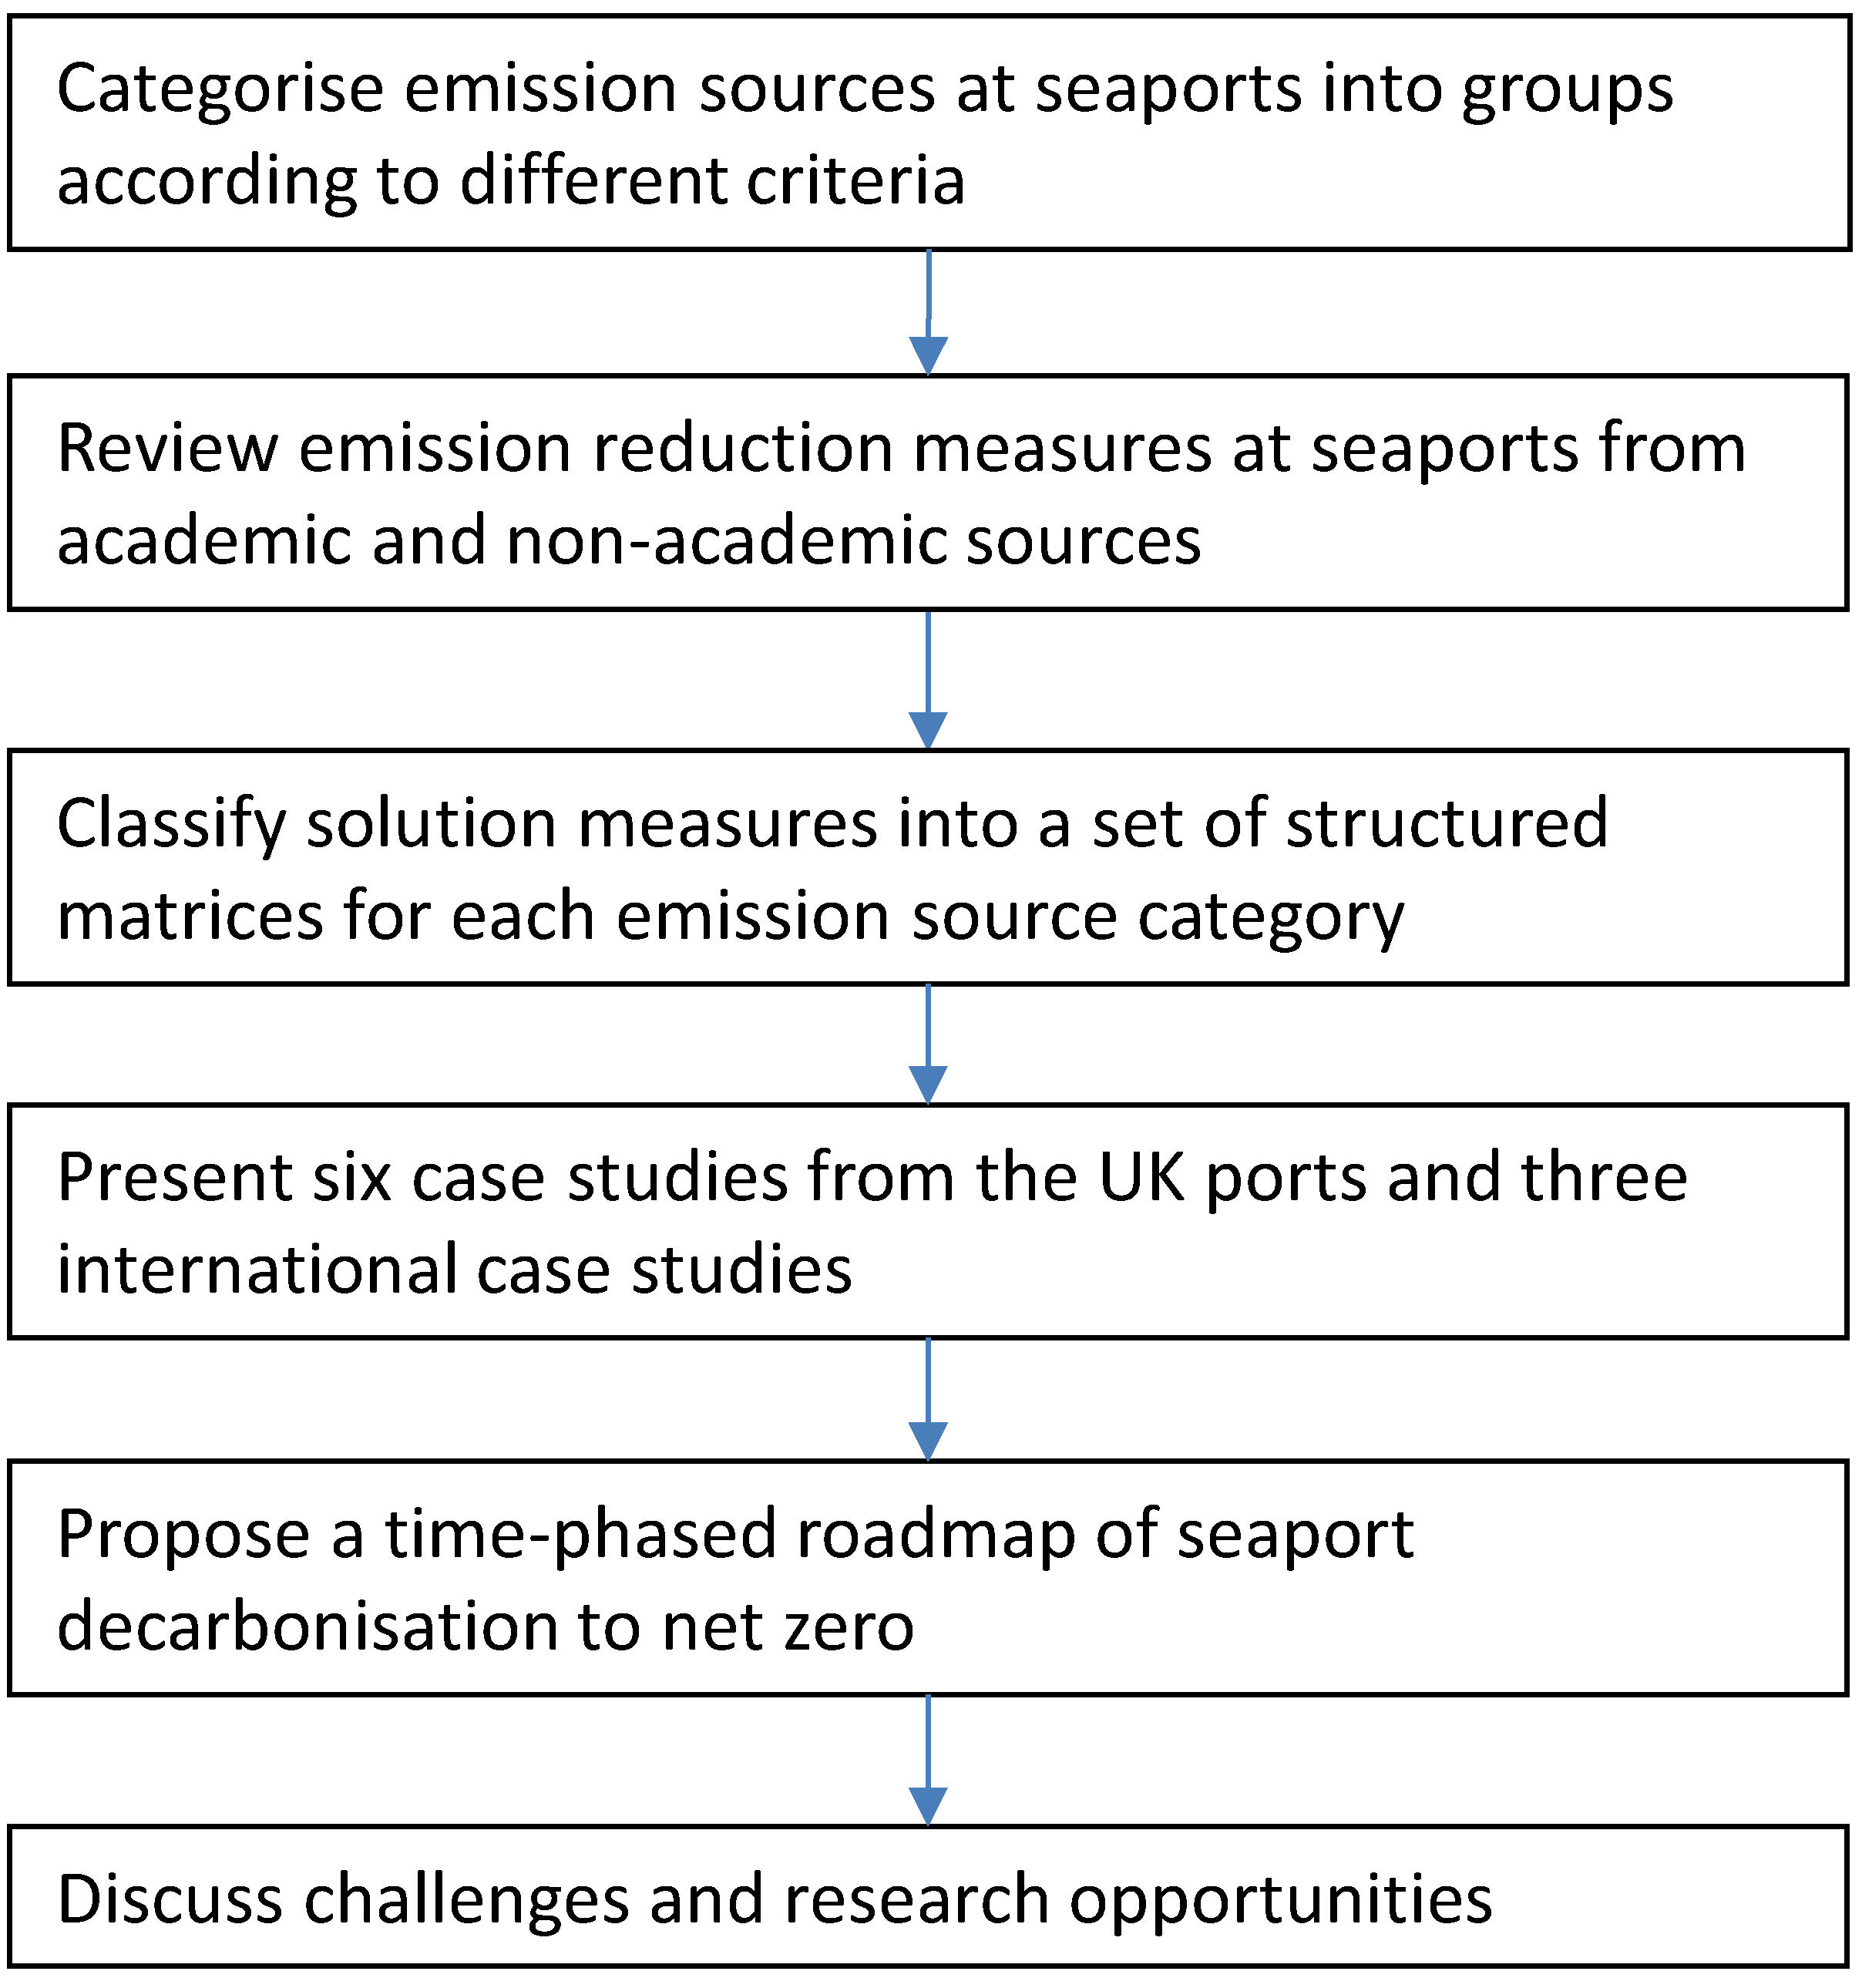
1. Introduction
2. Emission Sources at Seaports
3. Emission Reduction Measures at Ports
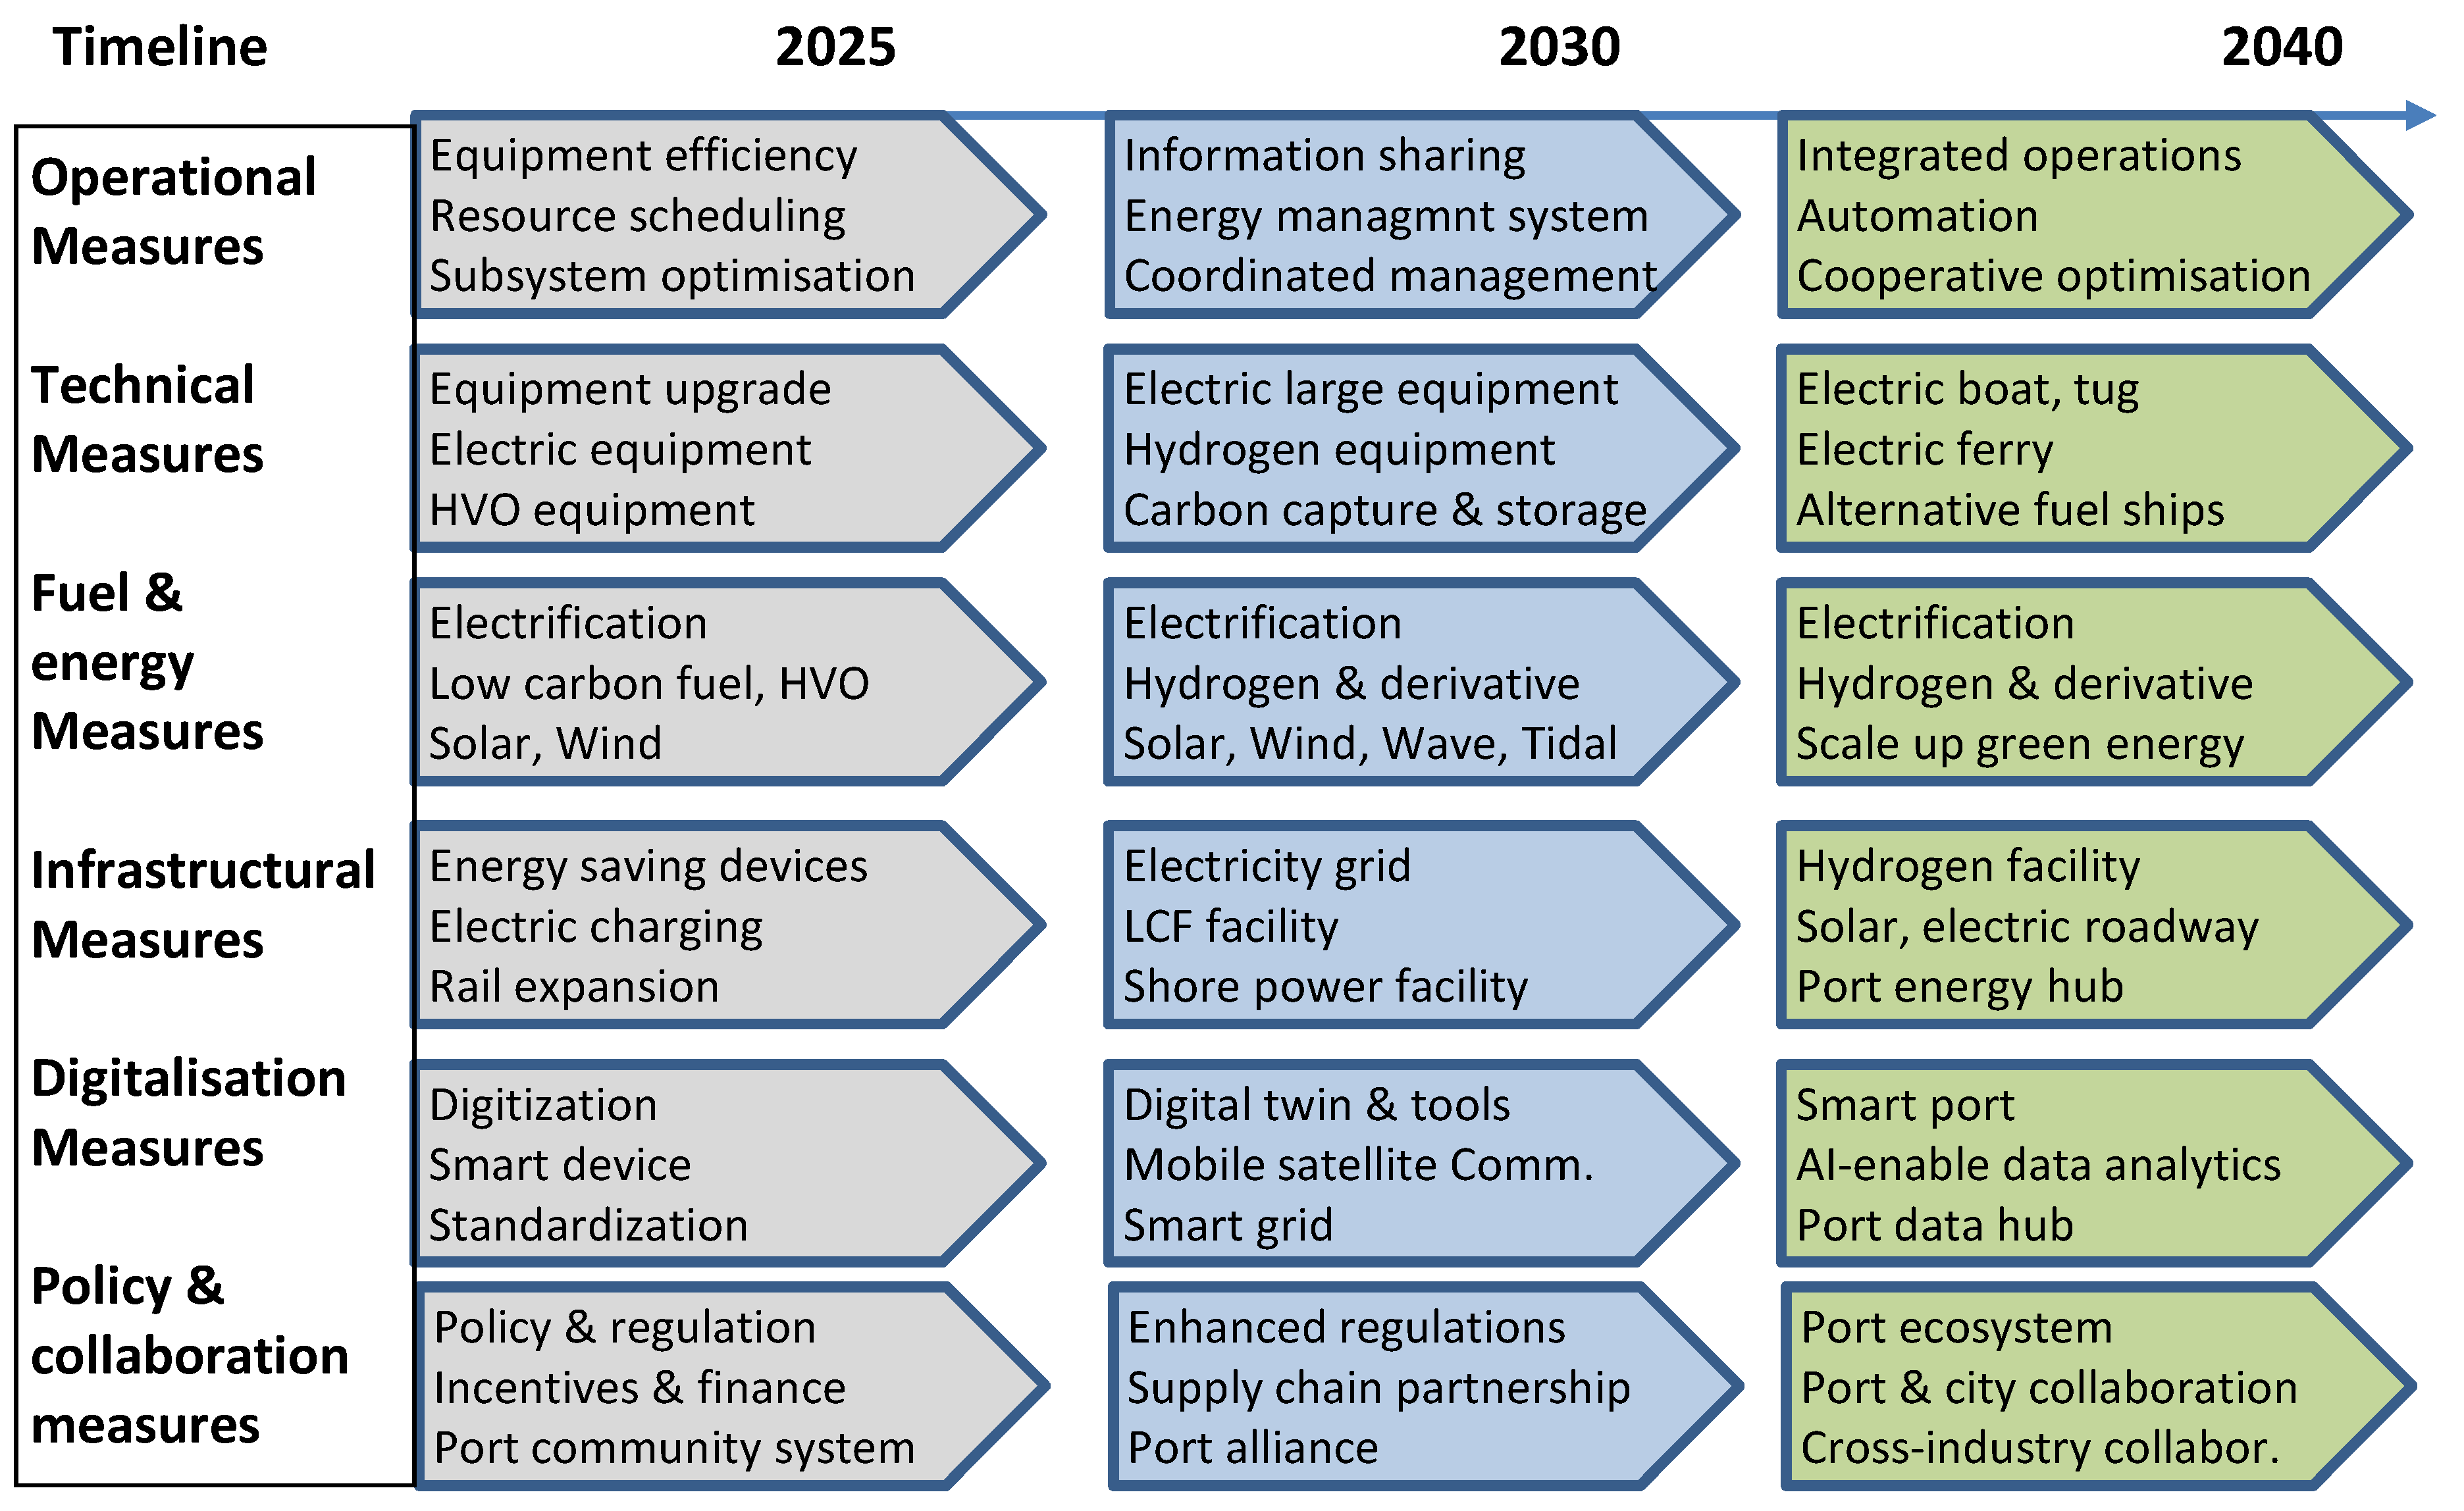
- Operational measures, which focus on improving operational efficiency in the port system to reduce fuel/energy consumption and better utilise energies;
- Technical measures, which focus on improving energy efficiency of the vehicles and equipment through upgrading, retrofitting, or replacing existing machinery, vehicles, equipment, and engines, and adopting carbon capture systems (CCS);
- Fuel and energy measures, which focus on adopting cleaner alternative fuels and energies such as biofuels, hydrogen, electricity, solar power, and wind energy;
- Infrastructural measures, which focus on the changes of port infrastructure and facilities to support emission reductions, e.g., port/terminal redesign and expansion for modal shift by increasing the use of rail services and barge services, cold ironing to provide shore power to vessels, and installing new electrical infrastructure to support equipment electrification;
- Digitalisation measures, which focus on the applications of digital technologies to automate processes, collate reliable data, and implement artificial intelligence to support operational and technical measures;
- Policy and collaboration measures, which focus on relevant legal regulations, incentive programs, financial investment, insurance policies, and cross-function, cross-company, and cross-sector collaborations that would impose, accelerate, and facilitate the adoptions of the solutions in other categories.
3.1. Seaside

| Measures | Cases and Effect | References |
|---|---|---|
| Operational | ||
| Slowing ship speed | Container ships at Los Angeles and Long Beach; engine load factor reduced from 80% to 10%. | [15] |
| Just-in-time arrival | 483 very large crude carriers; 7–19% emission reduction | [16]; bluevisby.com (accessed on 10 December 2023) |
| Reducing port time | Dry bulk ships in North and Baltic seas; 2–8% energy reduction | [17] |
| Training ship crew and port pilots | Tanker vessel at Klaipeda port; 12.5% emission reduction from ship manoeuvres | [18] |
| Technical | ||
| Hull design, e.g., shape, material, coating | Various vessels; 1–30% CO2 reduction | [19] |
| Propulsion system, e.g., hybrid power, machinery, waste heat recovery | Various vessels; 1–45% CO2 reduction | [19] |
| Onshore power | Many ports including Gothenburg; Seattle; Vancouver; Antwerp; Southampton; Port of Koper; 30% emission reduction | [15,23] |
| Carbon capture and storage | LNG carrier; Mitsubishi Shipbuilding; 70–90% CO2 reduction | www.ukpandi.com; www.potterclarkson.com (accessed on 10 December 2023) |
| Fuel and energy | ||
| LNG | Various vessels; 15–20% CO2 reduction | [24] |
| LPG | Very large gas carriers; 17% CO2 reduction | [21] |
| Wind-assisted propulsion systems | Fruit juice tanker by Bound4Blue; 10% CO2 reduction | [25] |
| Nuclear-powered ship | Icebreaker; Cargo ships; be carbon neutral | [26] |
| Biodiesel | Various vessels; 25–100% GHG reduction | [20,27] |
| E-LNG | MSC Cruises; 98% CO2 reduction | [21]; maritime-executive.com (accessed on 10 December 2023) |
| E-Diesel | Ferries; 90–99% CO2 reduction | [21]; www.mtu-solutions.com (accessed on 10 December 2023) |
| E-Ammonia | Under development; 98% CO2 reduction | [21]; www.zerocarbonshipping.com (accessed on 10 December 2023) |
| E-Methanol | Containership; 99% CO2 reduction | [21,28] |
| Hydrogen; Battery | Ferries; tugs; 100% CO2 reduction | [21,29]; www.wartsila.com (accessed on 10 December 2023) |
| Infrastructural | ||
| Port infrastructure to supply electricity | Gothenburg; Seattle; Vancouver; Antwerp; Southampton; support onshore power- and battery-powered vessels | [15]; www.wartsila.com (accessed on 10 December 2023) |
| Port infrastructure to handle captured CO2 | Immingham in UK; support carbon capture storage and utilisation | www.ukpandi.com (accessed on 10 December 2023) |
| Bunkering facilities | Many major ports; support refuelling alternative fuels | [30]; bunkerpay.co.uk; maritimefairtrade.org (accessed on 10 December 2023) |
| Digitalisation | ||
| Automated mooring systems | Port of Santander; reduce CO2 emission by 76% | [15,22] |
| Mobile satellite communication | Inmarsat; Ensure seamless connectivity across the globe | https://sinay.ai (accessed on 10 December 2023) |
| Metocean Data Analysis | Sinay; Simulate and understand weather patterns | https://sinay.ai (accessed on 10 December 2023) |
| Policy & collaboration | ||
| EEDI; EEXI | All ships above 400 gross tonnage; One-time certification on vessel energy efficiency | www.imo.org (accessed on 10 December 2023) |
| CII | All ships above 5000 GT; Annual requirement to calculate ship’s carbon intensity indicator | www.imo.org (accessed on 10 December 2023) |
| SEEMP | All ships above 5000 GT; Ship management plan to meet CII requirements | www.imo.org (accessed on 10 December 2023) |
| EU ETS | All ships above 5000 GT entering EU ports; Define maximum GHG emission | climate.ec.europa.eu (accessed on 10 December 2023) |
| Green Flag Program | Los Angeles; Long Beach; 15–25% port fee reduction for reducing vessel speed | [15] |
| Green Passports Scheme up to 10% port fee reduction | Amsterdam; Hamburg; Rotterdam; Antwerp; Bremen; Le Havre; Meet Environmental Ship Index threshold | [15] |
| World Ports Climate Action Program | A total of 12 major ports across the world; Accelerate alternative fuels uptake | hellenicshippingnews.com (accessed on 10 December 2023) |
| Port green incentives | A total of 28 of the 100 world’s largest ports; Incentive for environmentally friendly ships | [31] |
3.2. Quayside and Yardside
| Measures | Cases and Effect | References |
|---|---|---|
| Operational | ||
| Berth allocation planning, quay crane assignment and scheduling, cargo loading and unloading, vessel stowage planning, internal moving vehicle scheduling | Quayside at most ports and terminals; Operational efficiency | [32,33,34] |
| Yard storage management, yard crane scheduling, container reshuffling/relocation, workforce scheduling, coordination of equipment operations between quayside and yardside | Yardside at most ports and terminals; Operational efficiency | [32,33,34] |
| Energy management system | Hamburg; Genoa; Singapore; Energy efficiency | [35,36] |
| Integrated operations and energy systems | Yangshan Port in Shanghai; Energy efficiency | [37] |
| Technical | ||
| Replacing and repowering older, dirtier engines in ports | US port; Energy efficiency | [38] |
| Electrify ships to shore gantry cranes | Port of Koper | [23] |
| RTG with regenerative power | Port of Tokyo; 40% emission reduction | [39] |
| Electric RTG; lithium battery hybrid RTGs; | Port of Tokyo; Port of Busan; Port of Shanghai; 64% GHG reduction | [39,40] |
| Fuel and energy | ||
| Hydrotreated Vegetable Oil (HVO) | Hong Kong; Liverpool; up to 90% CO2 reduction | www.crownoil.co.uk; www.portstrategy.com; (accessed on 15 December 2023) |
| Hydrogen | Port of Tilbury; Port of Los Angeles; many other ports | [42]; www.forthports.co.uk (accessed on 15 December 2023) |
| Infrastructural | ||
| Electricity network | Port of Koper; To power electrified equipment | [23] |
| Rebuild storage and distribution infrastructure for new fuels and hydrogen | Many ports in Europe and US | [41]; www.forthports.co.uk (accessed on 15 December 2023) |
| Electric vehicle charging stations | Shanghai Yangshan port | [42] |
| Fuel cell vehicle refuelling | Port of Los Angeles | [42] |
| Re-designing port layouts and facilities | Port of Koper; Reduce in-port travel distances | [23] |
| Digitalisation | ||
| Predict vessel arrival lateness | Mediterranean container terminal; quayside resource management | [43] |
| Predict container dwell time | Container terminal in the Middle East; reduce yard congestion | [44] |
| Customer information-based smart stacking | Port of Los Angeles; Import free-flow to reduce reshuffling and waiting times | [45] |
| Policy and collaboration | ||
| Legislation and national requirements | Port of Koper; facilitate long-term investment | [23] |
| Diesel Emission Reduction Act grant | US ports, e.g., Port of Portland; Repower cargo handling equipment and dredge | [46] |
| World Ports Climate Action Program | Long Beach, Los Angeles, New York, Valencia, Vancouver, Yokohama; Decarbonise port equipment | sustainableworldports.org (accessed on 15 December 2023) |
| Container terminals collaboration | Busan New Port; Reduce vessel waiting time | [47] |
3.3. Landside Interface
| Measures | Cases and effect | References |
|---|---|---|
| Operational | ||
| Gate layout design, Vehicle booking systems, Extended gate hours, Automated gate systems, Vehicle use and loading, Empty equipment logistics | Many ports in China, Europe, and US; Improve efficiency of gate operations | [1,48,49]; www.epa.gov (accessed on 20 December 2023) |
| Rail terminal layout design, Rail service slot scheduling, Wagon shunting, Container pre-staging, Loading/unloading trains | Felixstowe in the UK; Container port in Italy; Improve efficiency of rail terminal operations | [1,50,56] |
| Technical | ||
| Replacement/retrofit program | Most American seaports | [46] |
| Electric trucks | Laem Chabang Port; Felixstowe | www.eadt.co.uk (accessed on 20 December 2023) |
| Retrofitted locomotives | Ports of New York/New Jersey, Corpus Christi and Long Beach; decrease diesel emissions | [46] |
| Fuel and energy | ||
| Battery | Road transport in many countries | [51] |
| Hydrogen | Port of Houston | www.houstonchronicle.com (accessed on 20 December 2023) |
| Infrastructural | ||
| Electrified roadways | Los Angeles and Long Beach | [38] |
| Modal shift | Port of Gothenburg; Barcelona | [52] |
| Digitalisation | ||
| Digital solution for truck access | Hamburg | www.portstrategy.com (accessed on 20 December 2023) |
| Blockchain technology | driveMybox and IBEXUS | www.portstrategy.com (accessed on 20 December 2023) |
| Predict truck arrival or delay | Jinzhou Port; increase port efficiency | [53] |
| Antwerp Intermodal Solution | Port of Antwerp | [52] |
| Policy and collaboration | ||
| Vehicle emission standards | Taichung Port | [54] |
| Rule by California’s air regulator | California drayage vehicle | [57] |
| Modal shift policies at international, national, local levels | European ports | [52,55] |
3.4. Landside Industry and Support Facility
| Measures | Cases and Effect | References |
|---|---|---|
| Operational | ||
| Port self-management framework | Taichung Port; Emission reduction across port geographic locations | [54] |
| Distributed energy management | Voltage regulation via multi-agent system; Be greener and sustainable ports | [58] |
| digitalPORT | Singapore; one-stop platform for port call transactions and regulatory clearance | [30] |
| Technical | ||
| Full wall panels in office design; motion sensors; natural ventilation | Taichung port; Singapore; Save energy | [39,54] |
| Use of hybrid hydraulic drive systems | Singapore; Reduce fuel consumption by 20% | [39] |
| Fuel and energy | ||
| Wind | Rotterdam; Kitakyushu in Japan | [35] |
| Waves | Port Kembla in Australia; Mutriku in Spain | [59] |
| Tide differentials | Dover in UK, Digby in Canada, Ribadeo in Spain | [63] |
| Geothermal energy | Hamburg | [35] |
| Solar panels/farms | Tokyo Ohi Terminal; Port of San Diego; Milford Haven | [35,60,62] |
| Infrastructural | ||
| National grid | Ensure power availability for port electricity need | [35] |
| Microgrids | Port of Chennai | [61] |
| Digitalisation | ||
| Smart grids | Milford Heaven | [62,64] |
| Private wireless network | Caribbean port | www.portstrategy.com (accessed on 5 January 2024) |
| Smart port | Port of Antwerp-Bruges | www.portofantwerpbruges.com (accessed on 5 January 2024) |
| Maritime Data Hub | Port of Singapore | [30] |
| Policy and collaboration | ||
| Regulation by Taiwan Environmental Protection Agency | Taichung Port; Equipment certified by Taiwan EPA and emission reduction for nonmarine industries | [54] |
| Community programs; Energy policy | Ports of Long Beach; To support renewable energy and collaboration | [46] |
| Port Community Systems | Many ports, e.g., Dubai, Djibouti; Port of Koper; facilitate information sharing | [65]; www.worldbank.org (accessed on 5 January 2024) |
| International Association of Ports and Harbors | Global alliance of over 170 ports; facilitate sharing best practices | www.iaphworldports.org (accessed on 5 January 2024) |
4. Case Studies
4.1. Port of Felixstowe
- Operational measures: The Port of Felixstowe has been involved in various research projects to pursue optimisation for quayside operations, yardside operations, vehicle booking system, and rail terminal operations.
- Electric cargo handling equipment: In 2020, they implemented eight remote control semi-automated electric RTGs to replace conventional RTGs; in 2021, they ordered 48 battery-powered terminal tractors and 17 zero-emission remote-controlled electric RTG cranes to replace existing diesel-powered cargo handling equipment. The report in 2021 indicated that the carbon footprint had been reduced by 30% since 2015 through a range of measures including the first phase of the programme to phase out diesel-powered yard cranes. In 2023, the port ordered 100 battery-powered autonomous Q-Trucks. By 2030, the port will replace 216 diesel-powered internal tractors and 32 of 74 diesel-powered RTGs, targeting a further 20% reduction in CO2.
- Hydrogen-powered port equipment: In 2021, Ryse Hydrogen initiated a project to supply the Port of Felixstowe with green hydrogen for its prototype port trucks.
- Green hydrogen: In 2022, ScottishPower, with Hutchison Ports, was planning to invest GBP 150 million to build a green hydrogen plant to bring in 100 megawatts of power by 2026 to supply hydrogen to the vehicles and machinery used by the port. It will also have the potential to be used for the production of green ammonia or ethanol.
- Rail infrastructure: In 2019, the Strategic Freight Network and Hutchinson Ports UK invested GBP 60.4 million to complete a new rail line connected to the Port of Felixstowe, which has the potential for an increase from 33 to 47 freight train services a day in each direction. Each additional train would take the equivalent of up to 76 lorries off the roads; currently, about 30% of containers are moved by rail services at Felixstowe.
- Electric infrastructure: In 2022, the port started a 3-year project to upgrade the existing 11,000-volt electricity network to supply power to electric gantry cranes, electric yard cranes, and charging stations for battery-powered tractor units. In 2023, the port commissioned the setup of two new 11 kV high-voltage substations, which will primarily serve its conventional electric tractor fleet.
- Digital technologies: In 2022, the port became the 5G testbeds under a government funding project to deploy 5G technology and the Internet of Things (IoT). The project aims to make use of the real-time data from the IoT sensors and 5G network to detect anomalies in quay cranes and yard cranes to improve preventive maintenance. The port was also involved in a research project in 2022 to apply machine learning techniques to improve container storage allocation between quayside and yardside operations.
- Green energy transition levy: From 2022, each import-laden container through the port of Felixstowe is charged GBP 8.75 to the customs declarant (clearing agent) to contribute to the port’s decarbonisation program.
4.2. Port of London
- Operational measures: Applied to all vessels for energy efficiency.
- Vehicle replacement: By 2021, deployed some electric vehicles and hybrid vehicles; by 2025, switching road vehicles to electric and all pilot taxis to be lower-emission vehicles.
- Retrofitting existing vessels: 2020–2030, trial stage of retrofitting low-carbon fuel or modified internal combustion engine with biofuel; 2030–2050, adoption stage.
- Electrify frequent-stop passenger vessels: 2020–2030, trial stage of battery electric or fuel cell electric; 2030–2050, adoption stage.
- Non-frequent-stop passenger vessels: 2020–2030, internal combustion engine stage V with diesel; 2030–2040, internal combustion engine stage V (or above) with low-carbon fuel; 2035–2050, fuel cell electric.
- Tugs: 2020–2030, internal combustion engine stage V with diesel; 2025–2040, diesel electric with low-carbon fuel; 2035–2050, fuel cell electric.
- Freight vessels: 2020–2030, internal combustion engine stage V with diesel; 2025–2050, battery electric; 2030–2050, fuel cell electric.
- Service and workboats: 2020–2030, internal combustion engine stage V with diesel; 2030–2050, internal combustion engine stage V (or above) with low-carbon fuel; battery electric; fuel cell electric.
- Hydrogen highway: In 2021, a three-year GBP 2.1 million programme was initiated to establish a national hydrogen highway network to support the development of clean maritime technology. The programme includes the demonstration of alternative power and fuel such as fuel cell technologies; offshore hydrogen generation; business case and economic model; and autonomous ship and mooring systems.
- Infrastructure: By 2021, install solar PV panels on roofs at two sites, and used lower-energy lighting; by 2025, install biofuel tanks at PLA riverside locations to accommodate a phased switch; install a new sub-station at Denton Wharf base to cope with increased electrical demand from the vessels and vehicles.
- Low-carbon fuel infrastructure: 2020–2030, first refuelling to serve trials; 2030–2040, roll out refuelling infrastructure to serve existing vessel fleet.
- Electric charging infrastructure: 2020–2025, feasibility study for vessel charging; 2025–2040, roll out charging infrastructure.
- Hydrogen infrastructure: 2020–2030, feasibility study on hydrogen refuelling; 2025–2050, roll out hydrogen refuelling stations.
4.3. Port of Immingham
- Electric cargo handling equipment: In 2020, ABP deployed GBP 7 million electric RTG cranes as part of a GBP 33 million investment; in 2022, 14 electric forklifts were deployed at the Port of Immingham.
- Hydrotreated Vegetable Oil (HVO): In 2022, four HVO reach stackers were used to replace older diesel equipment which had reached the end of its usable life.
- Hydrogen truck: In 2023, a hydrogen-fuelled truck was used in the port to cut GHG emissions.
- Green hydrogen: In 2021, a feasibility project was conducted to investigate the production of 20 MW of green hydrogen for use at the Port of Immingham by 2025.
- Renewable energy: In 2020, ABP completed the UK’s largest rooftop solar array at the Port of Hull near Immingham. In 2023, the Ports of Grimsby and Immingham initiated the onshore wind projects for a generation capacity potentially up to 36 MW. Plans are being developed for up to four turbines at Grimsby (up to 24 MW) and at least two at Immingham (up to 12 MW).
- Infrastructure: In 2022, electric charging for vehicles was rolled out for colleagues and guests. In 2023, ABP installed a mobile hydrogen filling station to fuel the vehicle.
- Carbon capture and storage: In 2022, plans were announced to develop a CO2 terminal to serve as a hub for the collection of CO2 emissions from industrial businesses around the country. Its first CO2 capture is expected in early 2027. It would not only decarbonise the maritime sector but also the Immingham landside industries, which is the most carbon-intensive industrial cluster in the UK.
- Green certificate: In 2021, ABP gained ISO 14,001 Environmental Management Certification.
4.4. Port of Milford Haven
- Electric vehicle: In 2021, seven new electric commercial vehicles were in service at the port.
- Renewable energy supply: In 2019, the port switched its energy to a renewable energy tariff, indicating that all the electricity usage comes from renewable sources.
- Renewable energy production: In 2021, RWE launched the Pembroke Net Zero Centre to maximise the potential of hydrogen, floating offshore wind, and carbon capture to help decarbonise industries in Wales. In 2023, a major hydrogen fuel generation scheme, which could make up to five tonnes of the gas a day at the former Puma Energy site in Milford Haven, was submitted to county planners.
- Infrastructure: By 2019, the port had invested in solar panels, LED lighting, heat pumps, insulation, and smart energy innovations to minimise carbon emissions. In 2022, the Port of Milford Haven started the construction of a new supersize slipway and new workboat pontoons at Pembroke Port, as part of the GBP 60 million Pembroke Dock Marine project. The infrastructure will enhance the Port’s operations and maintenance capabilities for the floating offshore wind industry.
- Welsh and UK Governments support: Expand South Wales’ grid capacity by 10 GW by 2030; implement a fast-tracked consenting regime; incentivise the production and use of low-carbon fuels; back the Skills Accelerator and Supply Chain Accelerator programmes.
4.5. Port of Liverpool
- Operational measures: Dockside electric cranes work on renewable power, and the applied software ensures container movements are optimised to save energy. A vehicle booking system is adopted on the landside automated gate interface; it promotes reconfiguring the movement of goods into and across the UK to transport goods closer to their end destination with fewer emissions.
- Replace diesel equipment: In 2020 was first use of electric vehicles across all ports in the Peel Ports group; in 2021, Peel Ports started trialling the use of electric power for plant machinery. By 2022, 45% of Peel Ports’ plant equipment fleet was moved to Hydrotreated Vegetable Oil (HVO), and 29% to electric. By powering freight carrying vehicles with greener fuels, Peel Ports has reduced landside carbon emissions by 70%.
- Hydrogen powered trucks: From 2021, Peel Ports were exploring the use of hydrogen to power their larger trucks.
- Green electricity: By 2025, Peel Ports intends to implement a green electric use scheme, which has an emissions factor of half the grid average.
- Fuels and energy: By 2035, Peel Ports intends to replace all gas usage and transition to electric or lower-carbon fuel sources.
- Modal shift: Peel Ports are increasing the number of rail connections and multimodal services across their ports to reduce road miles and emissions.
- Infrastructure: In 2020, lighting across the ports underwent transition to LED; in 2021, Peel Ports invested GBP 500,000 in electric charging infrastructure for new vehicles and conducted trials of greener fuels (such as hydrogen and electric alternatives) for plant equipment. For ships idle in docks, Peel Ports is planning to enable ships to plug into the ports’ electric supply. In the last 10 years, Peel Ports group has invested over GBP 1 billion on sustainable infrastructure.
- Support offshore and onshore wind: Peel Ports supports the changing energy markets with both offshore and onshore wind sites available across its various locations.
- Collaboration measures: From 2021, Peel Ports requires their supply chain partners to sign sustainability codes that align with their carbon emission values; Peel Ports group has created an Innovation Forum involving universities, entrepreneurs, consultants, and start-ups to tackle the challenges of emission reduction.
4.6. Port of Southampton
- Operational measures: Adopted vehicle booking system and traffic management system to streamline the arrival of HGVs in the container terminal and their movements around the port; initiated ongoing ‘no idling’ campaign to encourage drivers to switch off engines when vehicles are not moving or working to cut emissions at the port.
- Equipment replacement: From 2018, replaced its forklift trucks with the newest, most efficient models at Southampton Container Terminal; started to replace the straddle carrier fleet with newer more efficient models.
- Electric vehicle fleet: From 2018, introduced electric vehicles to transport staff; by 2023, 100% electric fleet for small vans and cars; 90% of HGVs at the container terminal have efficient Euro VI engines.
- Hydrotreated Vegetable Oil (HVO): In 2021, DP World trialled HVO by using the fuel in its forklift trucks, reefer generators, and straddle carriers; by April 2022, DP World’s Southampton container terminal completely eliminated fossil diesel from its operations and transitioned to HVO.
- Renewable energy: In 2023, on-port solar generation grew to 4 MW; around half of Southampton port operations are powered by on-port solar; maximise solar energy schemes within the port estate to reduce carbon footprint.
- Hydrogen hub: From 2021, investigated opportunities to decarbonise local industries and transport, and created a centre of excellence for hydrogen production and distribution on the south coast through carbon capture and hydrogen-based technologies; working with Fawley Refinery to build hydrogen capacity.
- Rail Infrastructure: Worked with Network Rail to extend rail capacity into the Port of Southampton; in 2023, the GBP 17 million project to expand the rail terminal at the Port of Southampton completed its second phase. Currently, over 30% of containers are arriving or leaving the port on trains through four dedicated rail terminals.
- Electric Infrastructure: Installed electric charging points for cruise passenger vehicles; from 2023, will roll out electric charging for HGVs at the container terminal.
- Fuel Station Infrastructure: Explore the installation of a GTL fuel station for commercial and on-dock vehicles.
- Facility infrastructure: In 2017, installed monitors at locations across the port to monitor air quality in and around the port; in 2021, provided shore power connectivity in the new Horizon cruise terminal; installed large areas of solar arrays on the roofs of the warehouses and terminals; installed low-energy LED lighting; commissioned research into feasibility options for Solar Roads; growing shore power facilities.
- Digital Tool for real-time visibility: DP World launched a digital tool called “Where’s my container” in 2012, which provides customers and cargo owners with visibility of the status of their containers through the container terminals to enable relevant stakeholders to optimise their operations and avoid delays.
- Incentive Modal Shift Scheme: Under this incentive scheme, customers will receive a GBP 70 (GBP 10) incentive if their import-laden containers are moved by rail to a railhead within (beyond) 140 miles of Southampton Container Terminal.
- Port Consultative Committee: Bring together members of the port community and external stakeholders quarterly to promote best practice.
- Sustainable Transport Options: Promote the My Journey sustainable transport initiative to the wider port community.
4.7. Port of Singapore
- Operational measures: From 2019, developed digitalPORT, which provides a one-stop platform for port call transactions and regulatory clearance for operational efficiency; the JIT Planning and Coordination Platform can facilitate direct berthing on arrivals and on-time departures to enhance ship turnaround and reduce ship emissions. Moreover, the port plans to seek energy optimisation from 2025.
- Electrify cargo handling equipment: From 2015, adopted new electric automated RMG cranes; during 2019–2027, replace diesel RTG cranes with electric RTG cranes; in 2021, adopted battery AGVs; during 2023–2025, adopt electric prime movers; during 2025–2030, electrify port equipment (AGVs, quay cranes);
- Low-carbon fuel for prime movers: In 2021, adopted LNG-fuelled prime movers to replace diesel-fuelled prime movers; during 2025–2030, will adopt energy-efficient grab dredger; biofuels for domestic harbour crafts.
- Renewable energy: 2025–2030, solar energy; 2025–2050, hydrogen prime movers and green electricity; by 2050, harbour craft will be powered by alternative energy solutions such as electrification and net-zero fuels.
- Infrastructure: 2023–2030, support pilots for electric harbour craft and charging infrastructure; for international shipping, support the supply of biofuels (e.g., bio-methanol, bio-LNG) as well as hydrogen derivatives (e.g., ammonia, e-methanol, liquefied hydrogen).
- Digitalisation: From 2019, developed Singapore Maritime Data Hub, which acts as a one-stop data repository and centralised data exchange platform in order to enable the integration of Maritime Singapore with the global trade ecosystem; will improve cyber security intelligence through early detection and quick response to cyber security threats; from 2025, will adopt smart grids.
- Incentives and collaboration: The digitalPORT tool promotes cross-sector collaboration among value-chain partners; decarbonise supply chain through efficiency gain; support technical development and incentivise the adoption and uptake of electric harbour craft and low-carbon fuels for seagoing vessels.
4.8. Port of Los Angeles
- Electrify cargo handling equipment: Electric terminal tractor development and demonstration in 2009; capacity plug-in hybrid electric terminal tractor and hybrid yard tractor development and demonstration in 2010; lithium-ion battery demonstration in 2011–2012; in 2020, demonstrated two zero-emission battery electric top handlers and three battery electric yard tractors.
- Hydrogen vehicles: In 2021–2022, demonstrated 10 hydrogen fuel cell class 8 trucks.
- Infrastructure to supply electricity: The Shore Power Program supported vessels to plug into the electrical grid in the port; in 2020, installed charging infrastructure and smart charging system for charging cargo handling equipment; constructed necessary electrical infrastructure to deliver electricity power to all cargo handling equipment.
- Infrastructure for hydrogen: In 2022, built two heavy-duty hydrogen fuelling stations in Ontario and Wilmington.
- Technology: The Ports’ Technology Advancement Program (TAP) provides continuous support (e.g., funding, guidance, testbed, demonstration) to test clean technologies and associated infrastructure in a real-world environment in and around the port.
- Policy and incentive: the OffPeak program was launched by PierPASS in 2005 to incentivise the truckers to use off-peak shifts, which can reduce cargo-related congestion in the surrounding areas of the ports of Los Angeles and Long Beach, and reduce truck waiting time and emissions at ports.
- Policies and collaboration: Adopted the Clean Air Action Plan (CAAP) in 2006 and updated it in 2010 and 2017, which set up the “zero emissions pathway” for cargo movements throughout the port. The CAAP puts in place a few specific port emission control measures, e.g., the Clean Truck Program introduces progressively strict standards on the external trucks to access the port; the Vessel Speed Reduction Program offers financial incentives to encourage vessels to slow down their sailing speed near the port; the CAAP also initiates the concept of cooperation among port stakeholders, including port authorities, terminal operators, ocean carriers, truckers, shippers, national and regional regulatory bodies, and local communities.
4.9. Port of Rotterdam
- Operational measures: Conducted three green-corridor projects to seek port call optimisation; showed 14% CO2 emission reduction by utilising just-in-time vessel arrivals.
- Retrofitting existing vessels: In 2018, eight vessels were switched from conventional diesel to 100% HVO fuel; in 2025, seven vessels will be switched from conventional diesel to cleaner 30% HVO fuel; in 2025–2035, will gradually replace the vessel fleet to be 100% HVO and zero-emission vessels.
- Electrify vehicles: During 2018–2021, 75% personal lease vehicles were transitioned to be fully electric; 25% of business lease vehicle were fully electric; during 2021–2025, passenger car fleet will be fully electric; during 2025–2030, will achieve fully zero-emission vehicle fleet.
- Shore power supply: During 2023–2025, will conduct four case studies to prepare Onshore Power Supply systems (OPS) at four major terminals in the port of Rotterdam.
- Alternative fuels: Will put the first zero-emission vessels into service from 2025; during 2028–2029, first zero-emission dredging work through the use of cleaner fuels such as bio-LNG, HVO, hydrogen, and methanol.
- Infrastructure: During 2026–2027, will redevelop new multifunctional housing only using renewable energy; replace heating oil with gas or climate-neutral energy; install onshore power systems to provide 35 MW of power for container ships, liquid bulk, and cruise ships by 2025.
- Infrastructure to supply alternative fuels for vessels: Scale up the supply of alternative bunker fuels including ammonia, electric shipping, LNG, biofuels, hydrogen, and methanol.
- Digitalisation measures: From 2019, test and implement digitalisation of logistics processes, including digital tools such as PortXchange, Navigate, Routescanner, and Nextlogic to enable sharing real-time data among stakeholders, including port authorities, terminal operators, shipping companies, and agents during a port call.
- Policies and incentives on employee travels: From 2018 and 2021, new policies on employee commuting and business travel (including flights) to reduce CO2 emissions, e.g., effective incentives for the use of bicycle and public transport, air travel using sustainable aviation fuels.
- Policies and collaborations with partners: Policy and incentive schemes are initiated, such as vessel speed limits, and Environmental Ship Index-based green passport. From 2019, sign green energy contracts with suppliers to reduce scope 2 emissions from purchased electricity and district heating; from 2019, be a participant in the national partnership under the Green Deal on Maritime and Inland Shipping and Ports, which aims to reduce greenhouse gases from shipping; be a leader in the international partnership under the World Ports Climate Action Program, which focuses on port management to reduce CO2 from shipping; be a participant in an international knowledge network under the Getting to Zero Coalition, which aims to demonstrate the first zero-emission seagoing vessels from 2030.
5. A Roadmap to Decarbonise Seaports
- Most case ports have explicitly stated their aims to reach net zero emissions from their own operations (scope 1 and scope 2 sources) by 2040. This is more ambitious than IMO’s target for net zero by 2050.
- Most case ports have been pursuing operational measures to improve efficiency and reduce fuel consumption.
- All case ports are implementing time-phased technical measures of equipment/vehicle replacement, e.g., replacing diesel with low-carbon fuels or electricity or hydrogen; the implementation process is carried out phase by phase considering the availability of fuel/energy supply, the supporting infrastructure, and the cost–benefit ratio.
- All case ports are committing to time-phased infrastructural measures, e.g., installing electric charging stations, increasing electricity supply capacity, installing energy-saving devices, expanding rail service capacity for modal shift, and building alternative fuel facilities.
- All case ports are pursuing time-phased fuel and energy measures, especially vehicle electrification and the exploration of the usage and production of low-carbon fuels such as hydrogen.
- Some case ports have tried digitalisation measures to improve operations and reduce emissions; however, it appears that the applications of digital technologies and artificial intelligence (AI) are still in the early stage, especially in the UK ports.
- Some case ports have initiated policy and collaboration measures to facilitate emission reduction; however, the scope and scale are still limited.
6. Discussions and Research Opportunities
- The decarbonisation of seaports will take a time-phased approach as a progressive implementation process, especially for large seaports.
- The categories of operational measures, technical measures, and fuel and energy measures have a direct impact on port emission reduction, whereas the categories of infrastructure measures, digitalisation measures, and policy and collaboration measures will support and facilitate the development and deployment of the solution measures in the first three categories; life cycle assessment and value chain analysis should be performed to ensure that emissions and costs are evaluated appropriately.
- Operational measures are more readily available to apply in practice to reduce the fuel/energy consumption in port-associated activities. Advanced operational measures will be highly dependent on digitalisation measures and collaboration measures, because digitalisation and collaboration may revolutionise business processes, user behaviours, and relationships among port stakeholders; in addition, new business models and operational practices will emerge with the deployment of technical measures and fuel and energy measures.
- Technical measures will be highly dependent on infrastructure measures and fuel and energy measures. Without the availability of supporting infrastructure and sufficient low-carbon fuel and energy, it will be difficult to decarbonise energy-intensive landside equipment and vehicles and seaside vessels.
- Fuel and energy measures require the development, implementation, and scaling up of relevant technologies such as hydrogen production, conversion, storage, and transportation; on the other hand, they also require the collaborative efforts and commitment from associated stakeholders, including governments, and the enforcement from legal regulations in the policy and collaboration category.
7. Conclusions
Funding
Acknowledgments
Conflicts of Interest
References
- Song, D.P. Container Logistics and Maritime Transport; Routledge: London, UK, 2021. [Google Scholar] [CrossRef]
- Bjerkan, K.Y.; Seter, H. Reviewing tools and technologies for sustainable ports: Does research enable decision making in ports? Transp. Res. Part D 2019, 72, 243–260. [Google Scholar] [CrossRef]
- Iris, C.; Lam, J.S.L. A review of energy efficiency in ports: Operational strategies, technologies and energy management systems. Renew. Sustain. Energy Rev. 2019, 112, 170–182. [Google Scholar] [CrossRef]
- Sdoukopoulos, E.; Boile, M.; Tromaras, A.; Anastasiadis, N. Energy efficiency in European ports: State-of-practice and insights on the way forward. Sustainability 2019, 11, 4952. [Google Scholar] [CrossRef]
- Alamoush, A.S.; Ballini, F.; Olcer, A.I. Ports’ technical and operational measures to reduce greenhouse gas emission and improve energy efficiency: A review. Mar. Pollut. Bull. 2020, 160, 111508. [Google Scholar] [CrossRef] [PubMed]
- Barberi, S.; Sambito, M.; Neduzha, L.; Severino, A. Pollutant Emissions in Ports: A Comprehensive Review. Infrastructures 2021, 6, 114. [Google Scholar] [CrossRef]
- Alamoush, A.S.; Olcer, A.I.; Ballini, F. Port greenhouse gas emission reduction: Port and public authorities’ implementation schemes. Res. Transp. Bus. Manag. 2022, 43, 100708. [Google Scholar] [CrossRef]
- Wang, B.; Liu, Q.; Wang, L.; Chen, Y.J.; Wang, J.S. A review of the port carbon emission sources and related emission reduction technical measures? Environ. Pollut. 2023, 320, 121000. [Google Scholar] [CrossRef]
- Alamoush, A.S.; Dalaklis, D.; Ballini, F.; Ölcer, A.I. Consolidating Port Decarbonisation Implementation: Concept, Pathways, Barriers, Solutions, and Opportunities. Sustainability 2023, 15, 14185. [Google Scholar] [CrossRef]
- IMO. Port Emission Toolkit Guide No.1: Assessment of Port Emission; GloMeep project coordination unit and the International Maritime Organisation, UK: London, UK, 2018. [Google Scholar]
- Starcrest. The Port Authority of New York and New Jersey Port Department 2021 Multi-facility Emissions, Starcrest Consulting Group. 2022. Available online: https://www.panynj.gov (accessed on 20 September 2023).
- GHG Protocol. The Greenhouse Gas Protocol. World Resources Institute and World Business Council for Sustainable Development. 2023. Available online: https://ghgprotocol.org (accessed on 10 December 2023).
- Budiyanto, M.A.; Habibie, M.R.; Shinoda, T. Estimation of CO2 emissions for ship activities at container port as an effort towards a green port index. Energy Rep. 2022, 8, 229–236. [Google Scholar] [CrossRef]
- Styhre, L.; Winnes, H.; Black, J.; Lee, J.; Le-Griffin, H. Greenhouse gas emissions from ships in ports—Case studies in four continents. Transp. Res. Part D 2017, 54, 212–224. [Google Scholar] [CrossRef]
- Gibbs, D.; Rigot-Muller, P.; Mangan, J.; Lalwani, C. The role of sea ports in end-to-end maritime transport chain emissions. Energy Policy 2014, 64, 337–348. [Google Scholar] [CrossRef]
- Jia, H.; Adland, R.; Prakash, V.; Smith, T. Energy efficiency with the application of Virtual Arrival policy. Transp. Res. Part D 2017, 54, 50–60. [Google Scholar] [CrossRef]
- Johnson, H.; Styhre, L. Increased energy efficiency in short sea shipping through decreased time in port. Transp. Res. Part A 2015, 71, 167–178. [Google Scholar] [CrossRef]
- Paulauskas, V.; Filina-Dawidowicz, L.; Paulauskas, D. The Method to Decrease Emissions from Ships in Port Areas. Sustainability 2020, 12, 4374. [Google Scholar] [CrossRef]
- Bouman, E.A.; Lindstad, E.; Rialland, A.I.; Stromman, A.H. State-of-the-art technologies, measures, and potential for reducing GHG emissions from shipping—A review. Transp. Res. Part D 2017, 52(Part A), 408–421. [Google Scholar] [CrossRef]
- Rony, Z.I.; Mofijur, M.; Hasan, M.M.; Rasul, M.G.; Jahirul, M.I.; Ahmed, S.F.; Kalam, M.A.; Badruddin, I.A.; Khan, T.M.Y.; Show, P.L. Alternative fuels to reduce greenhouse gas emissions from marine transport and promote UN sustainable development goals. Fuel 2023, 338, 127220. [Google Scholar] [CrossRef]
- Lindstad, E.; Lagemann, B.; Rialland, A.; Gamlem, G.M.; Valland, A. Reduction of maritime GHG emissions and the potential role of E-fuels. Transp. Res. Part D 2021, 101, 103075. [Google Scholar] [CrossRef]
- Piris, A.O.; Daz-Ruiz-Navamuel, E.; Prez-Labajos, C.A.; Chaveli, J.O. Reduction of CO2 emissions with automatic mooring systems: The case of the port of Santander. Atmos. Pollut. Res. 2018, 9, 76–83. [Google Scholar] [CrossRef]
- Twrdy, E.; Zanne, M. Improvement of the sustainability of ports logistics by the development of innovative green infrastructure solutions. Transp. Res. Procedia 2020, 45, 539–546. [Google Scholar] [CrossRef]
- Wang, S.; Notteboom, T. The adoption of liquefied natural gas as a ship fuel: A systematic review of perspectives and challenges. Transp. Rev. 2014, 34, 749–774. [Google Scholar] [CrossRef]
- Maritime Executive. Fruit Juice Tanker Becomes Latest Vessel to Add Wind-Assisted Propulsion. 2023. Available online: https://maritime-executive.com (accessed on 19 December 2023).
- Wang, Q.; Zhang, H.; Zhu, P. Using Nuclear Energy for Maritime Decarbonisation and Related Environmental Challenges: Existing Regulatory Shortcomings and Improvements. Int. J. Environ. Res. Public Health 2023, 20, 2993. [Google Scholar] [CrossRef]
- Kirstein, L.; Halim, R.; Merk, O. Decarbonising Maritime Transport—Pathways to Zero-Carbon Shipping by 2035; International Transportation Forum: Paris, France, 2018. [Google Scholar]
- Dinneen, J. First Cargo Ship Powered by ’Green Methanol’ Has Begun Maiden Voyage, Newscientist, 18 August 2023. Available online: www.newscientist.com (accessed on 20 December 2023).
- Holtze, B. World’s First Liquid-Powered Hydrogen Ship, MF Hydra, Is Powered by Ballard’s Fuel Cells, Ballard Marine Blog, 9 October 2023. Available online: https://blog.ballard.com (accessed on 20 December 2023).
- MPA. Maritime Singapore Decarbonisation Blueprint: Working Towards 2050; Maritime and Port Authority of Singapore: Singapore, 2022. [Google Scholar]
- Kloth, M. How Ports Can Help to Cut Shipping CO2. 2018. Available online: https://ww.itf-oecd.org (accessed on 18 April 2018).
- Stahlbock, R.; Voß, S. Operations research at container terminals: A literature update. OR Spectr. 2008, 30, 1–52. [Google Scholar] [CrossRef]
- Carlo, H.J.; Vis, I.F.A.; Roodbergen, K.J. Seaside operations in container terminals: Literature overview, trends, and research directions. Flex. Serv. Manuf. J. 2015, 27, 224–262. [Google Scholar] [CrossRef]
- Weerasinghe, B.A.; Perera, H.N.; Bai, X. Optimizing container terminal operations: A systematic review of operations research applications. Marit. Econ. Logist. 2023, 1–35. [Google Scholar] [CrossRef]
- Acciaro, M.; Ghiara, H.; Cusano, M.I. Energy management in seaports: A new role for port authorities. Energy Policy 2014, 71, 4–12. [Google Scholar] [CrossRef]
- Lam, J.S.L.; Ko, M.J.; Sim, J.R.; Tee, Y. Feasibility of implementing energy management system in ports. In Proceedings of the 2017 IEEE International Conference on Industrial Engineering and Engineering Management 2017, Singapore, 10–13 December 2017. [Google Scholar] [CrossRef]
- Zhang, Y.; Liang, C.; Shi, J.; Lim, G.; Wu, Y. Optimal port microgrid scheduling incorporating onshore power supply and berth allocation under uncertainty. Appl. Energy 2022, 313, 118856. [Google Scholar] [CrossRef]
- Brittlebank, W. Reducing Emissions in Ports. 2016. Available online: https://www.climateaction.org (accessed on 27 September 2016).
- Fahdi, S.; Elkhechafi, M.; Hachimi, H. Green port in blue ocean: Optimization of energy in Asian ports. In Proceedings of the 2019 5th International Conference on Optimization and Applications (ICOA), Kenitra, Morocco, 25–26 April 2019; pp. 1–4. [Google Scholar]
- Wei, H.L.; Gu, W.; Chu, J.X. The dynamic power control technology for the high power lithium battery hybrid Rubber-Tired Gantry (RTG) crane. IEEE Trans. Ind. Electron. 2019, 66, 132–140. [Google Scholar] [CrossRef]
- Kaack, L.H.; Vaishnav, P.; Morgan, M.G.; Azevedo, I.L.; Rai, S. Decarbonising intraregional freight systems with a focus on modal shift. Environ. Res. Lett. 2018, 13, 083001. [Google Scholar] [CrossRef]
- Lu, Y.; Fang, S.; Niu, T.; Liao, R. Energy-transport scheduling for green vehicles in seaport areas: A review on operation models. Renew. Sustain. Energy Rev. 2023, 184, 113443. [Google Scholar] [CrossRef]
- Pani, C.; Fadda, P.; Fancello, G.; Frigau, L.; Mola, F. A data mining approach to forecast late arrivals in a transhipment container terminal. Transport 2014, 29, 175–184. [Google Scholar] [CrossRef]
- Kourounioti, I.; Polydoropoulou, A.; Tsiklidis, C. Development of models predicting dwell time of import containers in port container terminals—An artificial neural networks application. Transp. Res. Procedia 2016, 14, 243–252. [Google Scholar] [CrossRef]
- Feng, Y.; Song, D.P.; Li, D. Smart stacking for import containers using customer information at automated container terminals. Eur. J. Oper. Res. 2022, 301, 502–522. [Google Scholar] [CrossRef]
- I2S2. Environmental Initiatives at Seaports Worldwide: A Snapshot of Best Practices; International Institute for Sustainable Seaports: Portland, OR, USA, 2013. [Google Scholar]
- Kim, G.S.; Lee, E.S.; Kim, B.K. Strategic port management by consolidating container terminals. Asian J. Shipp. Logist. 2022, 38, 19–24. [Google Scholar] [CrossRef]
- Chen, G.; Govindan, K.; Yang, Z.Z. Managing truck arrivals with time windows to alleviate gate congestion at container terminals. Int. J. Prod. Econ. 2013, 141, 179–188. [Google Scholar] [CrossRef]
- Song, D.P.; Dong, J. Modelling Empty Container Repositioning Logistics; Springer: London, UK. [CrossRef]
- Xie, Y.; Song, D.P. Optimal planning for container prestaging, discharging, and loading processes at seaport rail terminals with uncertainty. Transp. Res. Part E 2018, 119, 88–109. [Google Scholar] [CrossRef]
- IEA. The Future of Trucks: Implications for Energy and the Environment; International Energy Agency (IEA): Paris, France, 2017. [Google Scholar] [CrossRef]
- Gonzalez-Aregall, M.; Cullinane, K.; Vierth, I. A Review of Port Initiatives to Promote Freight Modal Shifts in Europe: Evidence from Port Governance Systems. Sustainability 2021, 13, 5907. [Google Scholar] [CrossRef]
- Wang, Z.; Zeng, Q.; Lv, M. Modeling the external truck arrivals in container terminals based on DBN and SVM. ICIC Express Lett. 2018, 12, 1033–1040. [Google Scholar] [CrossRef]
- Tsai, Y.T.; Liang, C.J.; Huang, K.H.; Hung, K.H.; Jheng, C.W.; Liang, J.J. Self-management of greenhouse gas and air pollutant emissions in Taichung port, Taiwan. Transp. Res. Part D 2018, 63, 576–587. [Google Scholar] [CrossRef]
- Takman, J.; Gonzalez-Aregall, M. Public policy instruments to promote freight modal shift in Europe: Evidence from evaluations. Transp. Rev. 2023, 1–22. [Google Scholar] [CrossRef]
- Siri, S.; Palmiere, A.; Ambrosino, D. Multi-objective optimization methods for train load planning in seaport container terminals. IEEE Trans. Autom. Sci. Eng 2023. [Google Scholar] [CrossRef]
- Marshall, A. Truckers are Caught on the Front Line of California’s EV Push. 2023. Available online: https://www.wired.com (accessed on 17 May 2023).
- Manolis, N.; Ahmad, I.; Fotios, K.; Palensky, P.; Gawlik, W. MAS based demand response application in port city using reefers. In Proceedings of the International Conference on Practical Applications of Agents and Multi-Agent Systems, Porto, Portugal, 21–23 June 2017; Springer: Berlin/Heidelberg, Germany, 2017; pp. 361–370. [Google Scholar]
- Arena, F.; Malara, G.; Musolino, G.; Rindone, C.; Romolo, A.; Vitetta, A. From green-energy to green-logistics: A pilot study in an Italian port area. Transp. Res. Procedia 2018, 30, 111–118. [Google Scholar] [CrossRef]
- Alzahrani, A.; Petri, I.; Rezgui, Y.; Ghoroghi, A. Decarbonisation of seaports: A review and directions for future research. Energy Strategy Rev. 2021, 38, 10072. [Google Scholar] [CrossRef]
- Misra, A.; Venkataramani, G.; Gowrishankar, S.; Ayyasam, E.; Ramalingam, V. Renewable energy based smart microgrids—A pathway to green port development. Strateg. Plan. Energy Environ. 2017, 37, 17–32. [Google Scholar] [CrossRef]
- Alzahrani, A.; Petri, I.; Rezgui, Y.; Ghoroghi, A. Developing smart energy communities around fishery ports: Toward zero-carbon fishery ports. Energies 2020, 13, 2779. [Google Scholar] [CrossRef]
- Ramos, V.; Carballo, R.; Alvarez, M.; Sanchez, M.; Iglesias, G. A port towards energy self-sufficiency using tidal stream power. Energy 2014, 71, 432–444. [Google Scholar] [CrossRef]
- Alzahrani, A.; Petri, I.; Ghoroghi, A.; Rezgui, Y. A proposed roadmap for delivering zero carbon fishery ports. Energy Rep. 2022, 8, 82–88. [Google Scholar] [CrossRef]
- Cerin, P.; Beskovnik, B. Enhancing Sustainability through the Development of Port Communication Systems: A Case Study of the Port of Koper. Sustainability 2024, 16, 348. [Google Scholar] [CrossRef]
- Song, D.P. A literature review, container shipping supply chain: Planning problems and research opportunities. Logistics 2021, 5, 41. [Google Scholar] [CrossRef]


| Emission Source Type | Specific Emission Sources |
|---|---|
| Mobile type | Seagoing vessels; support vessels; cargo handling equipment; heavy-duty vehicles; light-duty vehicles; locomotives |
| Stationary type | Offices; warehouse; storage facilities; quayside, gate, rail terminal facilities; electrical grid facility; electric charging facilities; buildings; parking spaces; manufacturing, industrial, power plants; lighting; maintenance facilities; heating ventilation and air conditioning |
| Source Category | CO2e in 2006 | CO2e in 2021 |
|---|---|---|
| Cargo handling equipment | 154,184 (23.78%) | 166,170 (20.16%) |
| Heavy-duty trucks | 224,050 (34.56%) | 403,806 (48.99%) |
| Rail locomotives | 14,710 (2.27%) | 27,691 (3.36%) |
| Ocean-going vessels | 221,638 (34.19%) | 191,104 (23.19%) |
| Harbour craft | 33,703 (5.20%) | 35,475 (4.3%) |
| Total | 648,284 (100%) | 824,245 (100%) |
| Scope | Emission Source Description |
|---|---|
| Scope 1 Sources | Fossil fuels used in port-owned vehicles (light-duty vehicles, support vessels) and employee vehicles for port business; Fossil fuels used in port-owned equipment such as cranes, folk lifts, diesel generators for electricity generation; Fossil natural gas used in port-owned buildings; |
| Scope 2 Sources | Purchased electricity used by the port-owned buildings and equipment such as cranes, pumps, charging stations, reefer containers, machineries in workshop and for building air conditioning, lighting, and other uses; Purchased steam used in port-owned buildings; |
| Scope 3 Sources | Energy used by port tenants (logistics companies, industries), seagoing vessels, external heavy-duty trucks, rail locomotives, cargo handling equipment that is not controlled by port, waste transport and disposal, employee business travel by air, and port employees commuting to and from work. |
| Geographical Location | Emissions Sources |
|---|---|
| Seaside | Seagoing vessels; support vessels such as tugs, push-boats, tenders, fireboats, pilot boats, police boats; |
| Quayside and yardside | Cargo handling equipment; quayside facility, storage facility; heavy-duty vehicles; light-duty vehicles; reefer charging; |
| Landside interface | Gate system; rail terminals; heavy-duty vehicles; light-duty vehicles; locomotives; cargo handling equipment; |
| Landside industry and support facility | Offices; electrical grid; warehouses; cargo handling equipment; buildings; parking spaces; lighting; maintenance facility; manufacturing, industrial, power plants; heating ventilation and air conditioning. |
Disclaimer/Publisher’s Note: The statements, opinions and data contained in all publications are solely those of the individual author(s) and contributor(s) and not of MDPI and/or the editor(s). MDPI and/or the editor(s) disclaim responsibility for any injury to people or property resulting from any ideas, methods, instructions or products referred to in the content. |
© 2024 by the author. Licensee MDPI, Basel, Switzerland. This article is an open access article distributed under the terms and conditions of the Creative Commons Attribution (CC BY) license (https://creativecommons.org/licenses/by/4.0/).
Share and Cite
Song, D.-P. A Literature Review of Seaport Decarbonisation: Solution Measures and Roadmap to Net Zero. Sustainability 2024, 16, 1620. https://doi.org/10.3390/su16041620
Song D-P. A Literature Review of Seaport Decarbonisation: Solution Measures and Roadmap to Net Zero. Sustainability. 2024; 16(4):1620. https://doi.org/10.3390/su16041620
Chicago/Turabian StyleSong, Dong-Ping. 2024. "A Literature Review of Seaport Decarbonisation: Solution Measures and Roadmap to Net Zero" Sustainability 16, no. 4: 1620. https://doi.org/10.3390/su16041620
APA StyleSong, D.-P. (2024). A Literature Review of Seaport Decarbonisation: Solution Measures and Roadmap to Net Zero. Sustainability, 16(4), 1620. https://doi.org/10.3390/su16041620