Abstract
Informal Green Spaces (IGS) in towns and cities are areas of varied appearance, representing a wide range of aesthetic values. In this study, we have focused on how users perceive such space and which elements match some particular values. Based on the analysis of photographic images taken by chosen IGS visitors, the technique called Visitor-Employed Photography (VEP), we elicited three primary groups of IGS images, namely landscape, scenery, and special elements. It is possible to define several visual structures in each category, with highly preferable spatial fragments and particular attributes. They are aesthetic prototypes, centers of aesthetic preferences among users of informal green areas. Recognizing proximity to the preference core allows us to define the preferred IGS landscape aesthetics. Based on the data collected, we have concluded that IGS users prefer vast grass areas, dense groups of trees and shrubs, water, and the absence of anthropogenic elements.
1. Introduction
Landscapes are visually represented in paintings, drawings, and both professional and amateur photography. They are represented through an accepted set of particular elements unique to particular landscapes. They are universal and widely accepted. An observer can easily see what type of landscape is represented: lowlands, seaside, small town, urban, etc. Visitors generally view landscapes as stunning or valuable. Among different types of landscapes, urban wastelands are a relatively new type of landscape, gaining growing interest. Numerous studies have examined their environmental value and role in ecosystems to conclude that while experiencing environmental decline, such areas ought to be appreciated, maintained, and properly managed [1,2,3,4].
However, few studies devoted to urban wasteland have explored the aesthetic preferences of visitors. For this reason, the present paper looks at the Informal Green Space (IGS) in this context. Informal Green Spaces are defined as urban green areas that are not intentionally designed or maintained by public administration but are used by residents as open recreational areas. The authors of the present study are exploring the extent to which IGS contributes to the overall aesthetics of urban green areas. Considering the environmental specificity, which, following Ingo Kowarik, can be referred to as the “fourth nature” [1,2], the question arises as to whether IGS changes the aesthetic experience of visitors significantly. Urban green spaces are primarily designed based on coherence and legibility. Therefore, it would appear that an undesignated, fourth-nature landscape could enhance the aesthetic experience by adding comprehensiveness and mystery.
Green spaces within urban landscapes are part of the Urban Green Infrastructure, a strategically planned network of parks, gardens, and forests, as well as urban wastelands, brownfields, or informal green spaces (IGS) [5,6]. Well-designed urban green spaces have been found to enhance biodiversity and reduce pollution while also positively impacting human health and well-being [7,8,9]. The quality of informal green spaces close to residential sites, which are managed in a new, sustainable way, fits in with the sustainable development goal of “sustainable life on land” to protect, restore, and promote the sustainable use of terrestrial ecosystems (Goal 15). The protection of biodiversity and ecosystems provided by IGS, which is indicated by the objectives of the European Green Deal, is also central to “climate actions” (Goal 13). Also, given the scarcity of available green spaces in cities, IGS satisfies Goal 3: “Ensure healthy lives and promote well-being”. In a situation of shrinking urban financial resources linked to the anticipated general economic downturn and a gradual reduction in the availability of funds, IGS is a sustainable alternative to classically developed public green spaces—parks, squares, and public gardens.
Proper planning and design of these areas require that users’ preferences be considered. Preferences vary among different users. Some studies suggest some general patterns, e.g., the value of the area’s naturalness [10,11,12] or the presence of water [13]. Other important aspects are also maintenance, cleanliness, and the presence of equipment or facilities (for instance, for the feeling of safety) [14,15].
Constituting a particular type of Green Infrastructure, IGS has been studied and evaluated more frequently as being significant to urban ecosystems and their users. The research shows IGS are of great value for environmental and social reasons. From the point of view of natural science studies, the essence of IGS was noticed because of its general ecological values [16,17,18,19], the study of environmental succession [20,21], and its positive impact on urban biodiversity [22].
From the social point of view, IGS stands out due to its specific methods of use [23,24,25,26]. It does matter to what extent they are managed, considering micro-scale actions as parts of projects positively affecting the intensity of use [27]. Because of the users’ preferences, it is vital to spot the differences between formal and informal greenery [28]. A comparison indicates the essential “naturalness/natural character” of IGS as opposed to the artificial character of formal green areas. In other studies, the users indicate that aspects such as wilderness, uniqueness, views, and artlessness are essential, but they also indicate some social aspects as essential. The surveys show that dwellers generally accepted urban wastelands as recreational areas that did not require much maintenance and were easily accessible.
Analysis of IGS images highlights the areas valued by the users for “naturalness”, access, and absence of imposed aesthetics [2,29,30]. Other researchers [31] studied the aesthetics of degraded areas but only in post-industrial areas and through the summation of design interventions. There is no research presenting the aesthetic preferences of IGS.
The Context of Warsaw
Informal green spaces in Warsaw, full of biodiversity and cultural values [1], are used by inhabitants recreationally and perceived as being very attractive. The Vistula river is the main element of the blue infrastructure in the city, and its preserved oxbow lakes and partially preserved valleys of other minor rivers are the most significant accompanying elements, so researchers have focused mainly on them [32,33]. The results of a questionnaire study on the perception of the Vistula Valley landscape by Warsaw residents confirmed that the Varsovians appreciated the naturalness of this landscape [34,35].
Considering the harsh competition related to urban plots, it is extremely difficult to persuade municipalities and private owners’ representatives to protect the area that has the potential to become a lucrative source of income. Nevertheless, there are still some unused areas designated to become formal greenery. In Warsaw, they account for 12% of the city’s area (semi-natural greenery (10%) and vacant land (2%)), as set out in the Study of Conditions and Directions for Spatial Development, the document preceding the Zoning Plan concerning parklands [36]. How they will be managed depends on municipal administration guidelines and designers’ creativity. Using, maintaining, and protecting these environmental and social assets is crucial. Our study is dedicated to such areas.
Throughout our research, we searched for archetypical images and visual representations of IGS, which constituted their aesthetics. We believe this allowed us to define the aesthetic expectations toward the landscape. Consequently, we can learn which sites and elements should be exposed while planning, designing, and managing IGS. Additionally, aesthetic expectations can be compared with the requirements of the environment, detecting some potential spots of co-existence or conflict between wildlife and users’ preferences.
For all the reasons mentioned above, our research aims to define characteristics of informal green spaces, namely the elements of landscape that appeal to their users. The task was accomplished by answering the following issues:
- Q1/ Which elements make up the environments that IGS users choose?
- Q2/ Which of these elements are most frequent?
- Q3/ Can these elements be classified in repetitive, universal patterns?
2. Materials and Methods
2.1. Research Procedure
The research framework answered the questions mentioned above in two main stages.
In Stage 1, within selected IGS in Warsaw, the respondents took photographs of the sites they preferred or found most beautiful. Then, the images were mapped using their coordinates, which allowed the identification of the most attractive places, the so-called Perceptually Exciting Nodes (PEN).
In Stage 2, the photos from PEN areas were analyzed using the content analysis method, which categorized favorite groups of landscape elements using tags. The resulting matrix of tags was subjected to statistical analysis to extract centers of aesthetic preference (Figure 1).
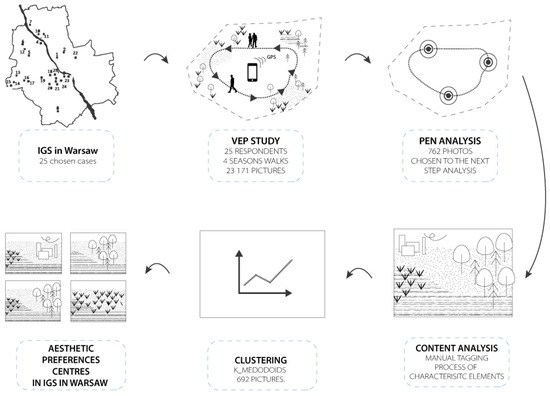
Figure 1.
Schematic representation of the research procedure.
2.2. Study Areas Selection
The study was conducted in 25 informal green areas in nine Warsaw districts (Figure 2). The character of the spots/sites varies. It includes small greeneries located inside some residential estates and vast territories of riparian forests on the Vistula riverside. The areas span between 0.72 ha and 77.9 ha. The average size amounts to 14.5 ha. The total area comprises 362.59 ha. To avoid any result distortion on account of the size diversity of the studied plots and the different number of images taken by the respondents, our material for the study included several spots preferred by respondents, presented in 23,171 images. The areas were chosen based on the following criteria:
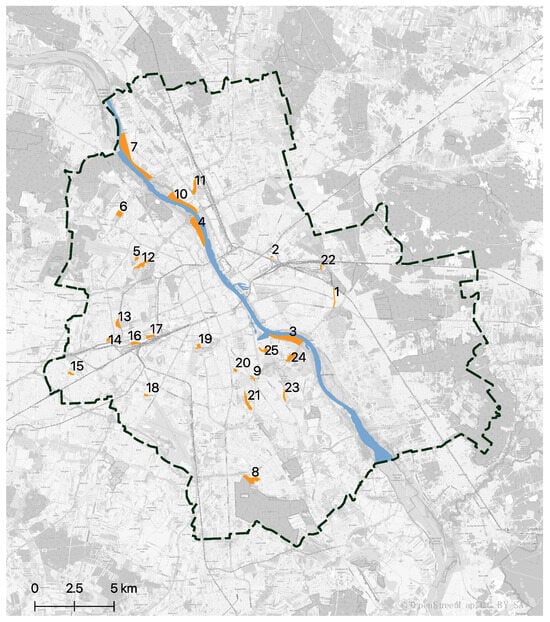
Figure 2.
Study areas on the Warsaw map. 1—Kanal Olszynka, 2—Siarczana, 3—“Siekierki” on the Vistula river, 4—“Żoliborz” on the Vistula river, 5—Lasek Bemowski, 6—Młociny, 7—“Tarchomin” on the Vistula river, 8—Kazurka Hill, 9—Sielecki Channel, 10—“Żerań” on the Vistula river, 11—Zerański Channel, 12—Bema Fort, 13—near Wolski Cemetery, 14—Glinianka Schneidra, 15—Ursus market place, 16—Odolany 1, 17—Odolany 2, 18—Okęcie Fort, 19—Pole Mokotowskie-Skra, 20—Dolna, 21—Potoki, 22—Kozia Hill, 23—Sadyba Psi Nieużytek, 24—Sadyba 2nd Pond, 25—Warsaw Uprising Mound.
- -
- would-be parklands according to zoning plans (Study of Conditions and Directions for Spatial Development);
- -
- easily accessible areas (not gated);
- -
- close proximity (up to 500 m) to the already existing residential investments;
- -
- natural coverage as a result of natural succession.
2.3. Stage 1 of the Study
2.3.1. Visitor-Employed Photography
The Visitor-Employed Photography (VEP) technique has been applied in aesthetic preference studies of landscape areas comprising parklands and nature reserves for almost 50 years [37,38,39,40]. It has also been successfully used in urban studies for both built-up areas and open spaces—municipal forests [41] and parks [42,43]. The VEP study has been carried out to spot the preferences of tourists [40,44,45] and dwellers (Residents Employed in Photography, REP) [46,47]. It was also applied to involve inhabitants in planning processes [48].
The VEP survey is based on employing a group of people to take photographs in one area following defined research criteria that usually concern the positive and negative assessment of landscapes. The method creators have proved that certain spots, motifs, and scenes are inclined to appear repetitively in photos taken by different people, making it possible to distinguish the common range of respondents’ aesthetic preferences by spotting repetitive elements (qualitative aspect of study), counting them, and consequently conducting a statistical analysis (quantitative aspect) [37]. As a result, qualitative and quantitative data regarding common aesthetic preferences are collected most directly without involving middlemen such as interviewers, structured forms, or even a respondent’s memory [49]. The so-called photovoice enables reaching automatic, personal preferences (and not the expected or commonly regarded ones) due to its non-discursive and immediate character [38,39]. Another advantage of the method is its inclusivity and strong link with the studied area. Unlike in ex-situ methods (interviews, SBE), where there is no direct contact with a wide landscape [41], VEP studies take place directly on-site.
Our respondents were asked to take several strolls across the 25 studied areas in all seasons (winter, spring, summer, and autumn). While walking, their task was to take images of sites they liked and estimate which of them brought positive feelings. The number of photographs was not limited [47]. In the process, smartphones with MyTracks (IOS) or Locus Map (Android) applications were used to take georeferenced images. Before each season started, the participants received detailed guidelines with technical information on the software, how to move across the areas, and the deadlines.
In the study, a group of 25 people was recruited and split into:
- (a)
- those still seeking their professional identity and stabilization in the labor market. Ages between 19 and 34 (13 people).
- (b)
- those with a stabilized position in terms of family and work. Ages between 35 and 55 (12 people).
Representatives of the 55+ age group were not recruited for the study due to the difficult field conditions associated with the lack of IGS development. Women constituted 56% of participants, and men 44%.
2.3.2. Hotspot Analysis
In our study, we employed the hotspot analysis (HS) method to identify Perceptually Exciting Nodes (PEN) [37] on the studied surfaces. To accomplish this, we analyzed hotspots based on data obtained from the VEP method, which allowed us to create a point layer representing the geotagged photographs taken. Each point was assigned a weight based on the number of photographs taken by individual respondents. Points associated with individuals who tended to take more photographs were assigned lower weights than those from respondents who took fewer photographs. To estimate the spatial density of these points, we utilized the Spatial KDE library in R, which allowed us to calculate the kernel density estimation. This algorithm generated a raster product representing the density of points ranging from 0 to 45 (Figure 3). For further analysis of the photo contents, we selected only those photographs whose hotspot raster values exceeded the mean value of the entire population (43.73).
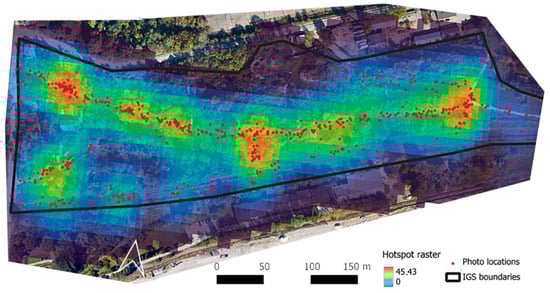
Figure 3.
Distribution of Perceptually Exciting Nodes (PEN) in one of the areas studied.
This approach provided valuable insights into the spatial distribution of Perceptually Exciting Nodes based on the density of 762 photographs taken by different respondents.
2.4. Stage 2 of the Study
2.4.1. Contents Analysis
The analysis of the photographic content that made up the PEN was implemented in two steps. In the first step, each image was analyzed for its composition. In the second, we focused on particular, repetitive groups of elements that were tagged in each photo. In Step 2, all the photographs (692) were content analyzed and tagged with landscape elements. Two individuals carried out the content analysis. The images bringing controversy were discussed in the presence of a third researcher, and consecutively, a final decision was made about which tag was to be assigned to an image.
In Step 1, the photographs were divided into three groups of compositions (Figure 4):
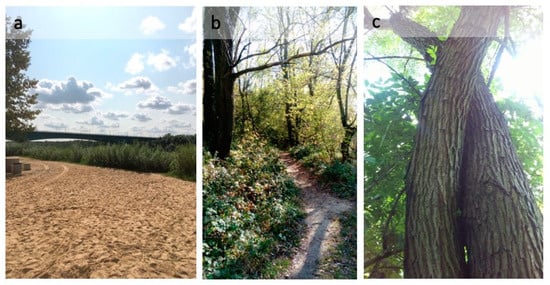
Figure 4.
Default images assigned to the following groups: (a) “landscape”, (b) “scenery”, or (c) “special elements”.
- -
- “landscape”—when an image embraced a wide sight, encompassing landscape in three plans, with visible elements in the background (145 photos);
- -
- “scenery”—those focusing on chosen elements such as trees, shrubs, plants, paths and others (415 photos);
- -
- “special elements”—the spots where one element, such as a tree, shrub, plant, or facility, dominates the frame (132 photos).
The pre-selection made us reject 70 photographs in a macro mode made up of zoom-ins of plant parts (particular flowers, tree bark texture, close-ups of insects, and elements of architecture taking the whole image). They did not depict the environment but only zoomed in on a small detail occupying the whole frame, so it is difficult to talk about the universal patterns consisting of particular elements based on them.
In Step 2, all the photographs (692) were content analyzed and tagged with landscape elements (please see Supplementary Materials). The tags (Figure 5) were divided into the following categories:
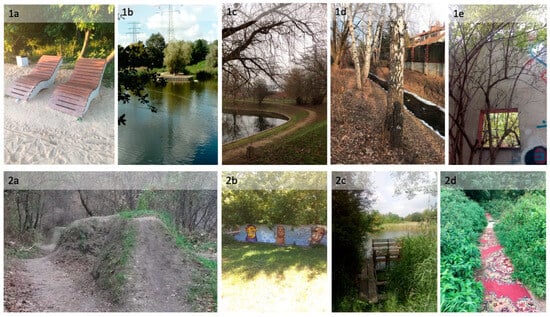
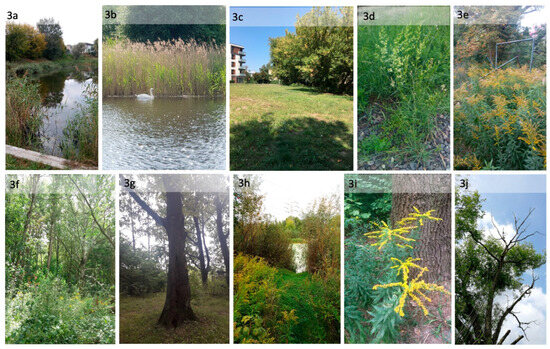
Figure 5.
A default images with tagged elements: (1a)—facilities; (1b)—tech. infrastructure; (1c)—roads; (1d)—urban surroundings; (1e)—ruins; (2a)—territorial constructions; (2b)—territorial markers; (2c)—bottom-up facilities; (2d)—bottom-up roads; (3a)—water; (3b)—fauna; (3c)—lawn; (3d)—meadow; (3e)—monoculture meadow; (3f)—dense trees; (3g)—loose trees; (3h)—dense shrubs; (3i)—single plant; (3j)—dead tree.
- 1/
- elements of anthropogenic origin encompassing the elements placed by human activities like municipal workers or as a part of planned land management “Human top-down”. Five tags were distinguished within the group:
- -
- facilities—benches and other outdoor furniture, outdoor gym, info boards;
- -
- technical infrastructure—high voltage pillars, electric and gas facilities (boxes), street lamps;
- -
- roads—walkways and roads for vehicles;
- -
- urban surroundings—cityscape visible in the background, different types of built-up areas;
- -
- ruins—ruins of buildings.
- 2/
- a group of elements of anthropocentric origin placed spontaneously by its users—“Human bottom-up”. Three tags were distinguished in this category:
- -
- territorial constructions—built in the ground by users’ bike circuits or areas redeveloped by users for another purpose;
- -
- territorial markers—graffiti, murals, and other signs of territoriality;
- -
- bottom-up facilities—self-made benches and other outdoor self-made furniture;
- -
- bottom-up roads—informal paths and other self-made surfaces.
- 3/
- a group of natural elements (“Nature”) with 10 tags as follows:
- -
- water—natural or artificial water containers—a river, a lake, a pond;
- -
- fauna—birds or other animals;
- -
- lawn—mowed lawn;
- -
- meadow—habitat of different (at least two) grass species and/or plants, not mowed;
- -
- monoculture meadow—monoculture of grass and/or plants, not mowed;
- -
- dense trees—dense stalks of trees and shrubs, no visible gaps between treetops;
- -
- loose trees—some separated trees with visible gaps between their treetops;
- -
- dense shrubs—dense stalks of shrubs, no visible gaps between their upper parts;
- -
- single plant—single tree, shrub, or plant;
- -
- dead tree—decaying tree or its thick branch or trunk.
To verify the adopted division of images into “landscape”, “scenery”, and “special elements” categories, we conducted a chi-square test. We tested the “null” hypothesis, which assumes that the elements captured in the photographs are not related to the image category. The outcome was empirical values of test statistics and their likelihood. X-squared = 136.32, df = 20, p-value ≈ 0.000. The results indicate that the zero hypotheses must be rejected in favor of an alternative hypothesis. This suggests that the characteristics being studied are interdependent, meaning the presence of distinguished elements depends on the image category. In the next step, we checked whether the distribution of photographed elements in particular categories was satisfactory. The “zero” hypothesis was rejected in each category, demonstrating a significant variation in the distribution of analyzed elements among the different categories (Table 1).

Table 1.
Comparison of photographed elements distributions in particular categories.
2.4.2. Identification of Landscape Patterns with the Use of Statistical Methods of Categorizing Objects
To categorize the images based on certain elements, we applied the cluster analysis, namely the k-medoids method. Speaking broadly, in focus analysis, one can distinguish two stages, i.e., measuring proximity between categorized objects—photographs based on characteristics values (quantitative and qualitative) and, subsequently, the appliance of proper method spotting the level of similarity. Due to nominal variables, we used the Sokal & Michener methods in our study.
The method of putting objects into clusters is commonly applied in marketing research (e.g., market segmentation). Still, it can be used in studies on universal features of landscape. A good example is the case where the authors have elaborated a set of criteria enabling them to make a quality ranking of urban landscape followed by making comparisons of different urban areas based, among others, on the cluster analysis applying hierarchical and non-hierarchical methods [50]. In another study, different forms of categorizing were compared to define landscape types, including the Jaccard index and k-means cluster analysis [51]. The k-means method implemented in machine learning algorithms was also applied to define desired plant landscape types in the process of urban planning [52]. Another example is the application of multidimensional cluster analysis (CLARA algorithm) to put landscape objects in groups with information on forest patterns [53]. The above-mentioned research examples indicate that object grouping methods can be successfully applied to analyze and label landscape types. Our approach, which combines the analysis of some particular elements in the images along with the methods of grouping objects, is a good contribution to that kind of study.
We defined the proximity in the first analysis stage using the Sokol & Michener method. In theory, plenty of measures are applied to define the similarity level among the objects characterized by binary variables. One of the most popular ones is the Sokol & Michener ratio, which can be expressed in the form of an equation [54]:
where a_11—is a sequence of positive links between objects (given attribute is found in both objects), a_10—number of inadequacies (given attribute is found only with the first object), a_01—number of inadequacies (given attribute is only assigned to the first object), a_00—several negative links between objects (given attribute not found with any of the objects).
SM = (a_11 + a_00)/(a_11 + a_10 + a_01 + a_00)
One can conclude from the above remarks that the similarity of objects is defined as possessing a given characteristic value and not possessing a given characteristic value. The Sokol & Michener similarity ratio is within the range of [0, 1], where 1 is the most likely and 0 is the least possible. The higher the ratio is, the more inseparable the attributes are (the appearance of one attribute accompanies the arrival of another, and the absence of a given attribute is parallel for both objects). The reverse situation is found in the interpretation of the Sokol & Michener ratio expressed as
d(x_1,x_2) = 1 − SM
The measure above was used in the further step to group images in clusters. For this reason, the k-medoids method was applied, which is based on searching such k-medoids (i.e., objects representing cluster core) among the analyzed objects to reduce the total proximity of all elements that are not medoids from the nearest medoids. The cluster comprises a medoid and objects located in its nearest proximity. The algorithm applied to spot medoids is, among others, PAM. (Partitioning Around Medoids). Broadly speaking, the algorithm is made up of the following steps [54,55]:
- -
- BUILD: stage—defining the number of k-type clusters, the choice of initial objects being medoids, as well as assigning the most similar objects to particular medoids (attention: the choice of initials medoids can be random or not-random);
- -
- SWAP: stage—improving the first stage assignment by applying all the combinations of object pairs medoid—non-medoid.
The aim of the algorithm is to minimize the average proximity between objects and their nearest medoid. Equally, the total gap between objects and their nearest medoid can be minimized. After grouping, the outcome quality must be estimated. To do so, the so-called silhouette method was applied to estimate whether a given object was rightly assigned to a given group. The outcome emerging from using the k-medoid method is juxtaposed with the hierarchical method of grouping objects—the Ward Method. Calculations were made in the R Studio program using cluster, stats, and Mercator packages. It made it possible to distinguish groups—universal landscape patterns.
3. Results
3.1. Stage 1
The participants of the VEP study took 23,171 photos altogether. The hotspot analysis indicated 42 PEN comprised of 762 photographs that constituted analysis material in the second research stage.
3.2. Stage 2
3.2.1. Content Analysis
Table 2 presents the most and least frequent elements in each photo. In the photographs under the “landscape” composition group, the most frequent elements are “water”, and the least frequent are “roads”. In the images under the “scenery” composition group—the most frequent elements are “dense shrubs”, and the least frequent is “dead trees”. In the photographic images under the “special element” composition group, “single plant” is the most frequent, and “bottom-up facilities” are the least. That allowed us to define specific landscape compositions and what constructed them in each IGS, allowing further design and management implications.
Table 2.
The most (bolded) and the least (in italics) frequently occurring elements/tags in the categories: “landscape”, “scenery”, and “special element”.
In places where respondents appreciated “landscape” composition, the open view and water view were important elements, allowing a broader view; however, the view of dense trees was also appreciated. In the composition group that was more focused on the particular “scenery”, respondents focused mainly on natural elements—dense shrubs and dense trees. However, elements such as lawns, meadows, water, and loose trees were also appreciated. This group also valued human bottom-up elements such as informal roads or paths. In some areas, respondents photographed special elements, especially natural elements, such as single plants.
3.2.2. Statistical Analysis
Based on the Sokol & Michener proximity matrix in three groups of images (“landscape”, “scenery”, and “special elements”), the Ward Trees were constructed, which allowed us to conduct entry-level cluster estimation, their amount and the number of images in each cluster. Moving on from the lowest level of the dendrogram upwards, the similarity level between analyzed images decreases, and some new attributes appear in the images. The issue can be perceived from two different perspectives. At first, by analyzing the images, they usually possess 1–2 attributes (for instance, in the special element group, there are plenty of images with a single plant in them). The second approach, however, involves analyzing images that are further away from each other but still in the same cluster. These photographs have a higher number of attributes, typically 3–6, and what is more, they share the same attributes that are remarkable for a given cluster. In the following step, the k-medoid algorithm was applied regarding the distance matrix. Since the visible division into clusters in particular groups (landscape, special elements, and scenery) was not obvious, which resulted from their dichotomous traits, the so-called silhouette criterion was applied to define the cluster number. The group quality observed in the charts in the coordinate system was assessed using the expert method. The newly created groups were characterized by the overrepresentation of some attributes, which is presented in the bar graph (Figure 6, Figure 7 and Figure 8).
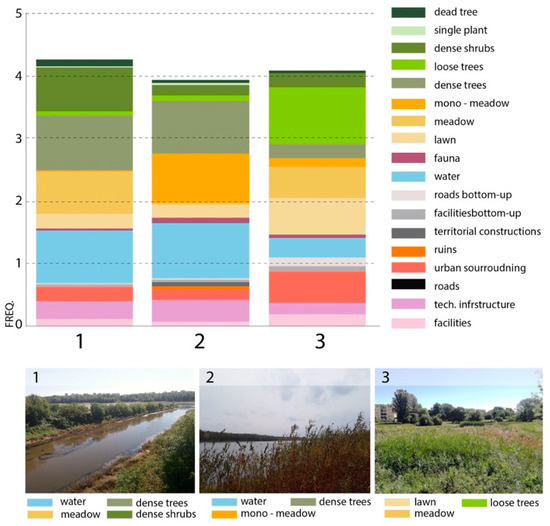
Figure 6.
The presence frequency of particular elements in clusters—”landscape” group.
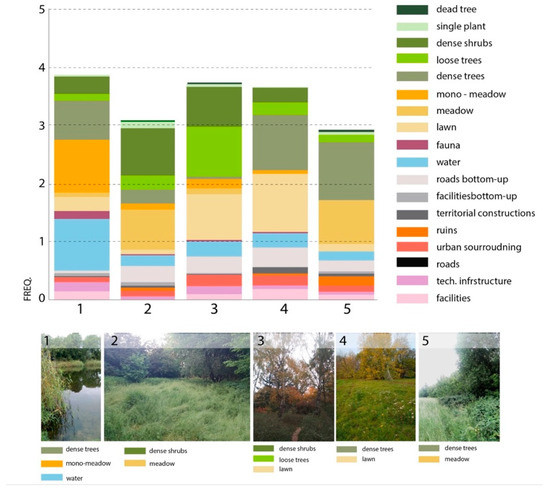
Figure 7.
The presence frequency of particular elements in clusters—“scenery” group.
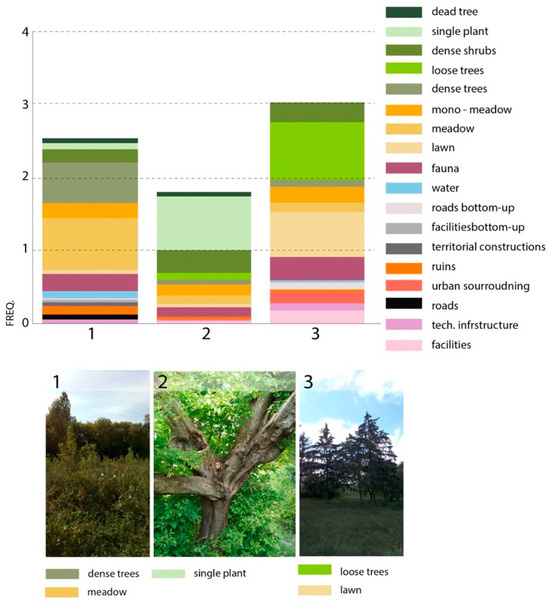
Figure 8.
The presence frequency of particular elements in clusters—“special element” group.
In the “landscape” group that is divided into three sets, there are mostly images with group tags of natural elements (“Nature”). The most popular tags are “dense trees”, “meadow”, “mono-meadow”, and “loose trees” (the third set and “dense shrubs”—the first set in the landscape group). In this group, facilities are less important; the most crucial are “roads” and “technical infrastructure”. Water plays a significant role, which is visible in Sets 1 and 2. In the center of the images are water reservoirs, flat grass areas, meadows and sand accompanying meadows, tall trees, and groups of dense shrubs (Figure 6).
The outcome is similar in the “scenery group” divided into five sets. There are mainly found images with tags from” natural elements (“Nature”) group. The most popular tags are “dense trees”, “mono-meadow”, “dense shrubs”, “lawn”, and “loose trees” in the third set and “dense shrubs”—the first set in the “landscape” group. In this group, facilities also play the smallest role.
Water is present, too, but apart from Set 1, it is never found in most images. In Sets 2–5, it is equally represented with “technical infrastructure” and does not appear in images in the sets’ centers (Figure 7).
In the “special element” group that is divided into three sets, like in previous groups, there are mainly images with tags from natural elements (“Nature”) groups. The most popular tags are “dense trees” and “meadow” (cluster 1), “single plant” (Set 2), as well as “loose trees” and lawns (the third Set). In the facilities group, they are of minor importance; the most crucial are “roads” and “ruins”. Water is present in clusters 1 and 3 but does not play a significant role here. The images in the middle of sets present flowers, unusual “sculpture-like” shapes of tree trunks, and interestingly shaped silhouettes of trees (Figure 8).
The groups and clusters are quite homogenous. Besides Set 2 in the “special element” group, they present flat clearing areas with grass or meadow-type vegetation and water surfaces surrounded by trees or dense shrubs. No anthropogenic elements are found in the images located at the nearest centers, although they were present elsewhere in sets. It results in a landscape made up only of natural components but reminds more of parklands than forests or shrubbery, both associated with nature/wildlife. The groups of densely growing trees are accompanied by flat terrain, allowing one to see all the sight elements.
4. Discussion. Surroundings Picked by IGS Users. The Most Frequently Chosen IGS Landscape Elements, Photography Groups, and Universal Patterns in Them
The users tended to pick distinct landscape compositions and sights where dense groups of trees and shrubs accompanied vast grass surfaces and meadows of one or many species. Such surrounding elements are also a background for “special elements” photographed by respondents. The most frequently presented types of surroundings are meadows and dense trees or dense shrubs—water and dense shrubs or dense trees—lawn and loose trees or water—meadow, dense trees and dense shrubs. Such a combination of elements has been spotted by numerous researchers before [56,57,58] in studies carried out in municipal parks and forests.
Without the division into sets and using the analysis of the presence of particular elements in the centers of all 11 clusters, one could conclude which landscape elements are most frequently picked. The predominant (most commonly chosen) element in the cluster centers is “dense trees”, which is present six times. “Meadow” appears in five clusters. “Lawn”, “dense shrubs”, and “loose trees” in four of them. “Water” is found in three clusters. “Urban surroundings”, “single plant”, and “mono-meadow” are spotted in one of them. These elements prevail in preferences to a different extent. At the same time, they constitute integral elements of the above-mentioned landscape structures, i.e., open spaces surrounded by vegetation. One interesting aspect is that the most vital element of the whole set is the surroundings of “dense trees”. Such a study outcome had never been in landscape preference research before, especially regarding IGS studies.
The remaining elements, especially those connected with green vegetation (meadow, lawn, mono-meadow, and, to some extent, dense shrubs and loose trees), lead to the same results as in IGS studies indicating people prefer early stages of environmental succession [20,22]. Our research results conclude that the late succession stage (dense trees) is incredibly universal, although it does not refer to foregrounds but rather the composition backdrop in images. It allows us to claim that what matters to preferences is the diversity of succession stages, their mutual penetration, and the presence of ecotones, i.e., transition space between particular ecosystems. It should be emphasized that ecotones are crucial for environmental biodiversity [59]. The high aesthetic preference for the biodiversity (plant species richness) of urban green spaces in this IGS has been proven by cross-sectional studies in many European cities [22]. However, they referred to homogeneous landscapes. The attention to the preference towards ecotones and the diversity of stages of natural succession is something new in the research on IGS aesthetics.
It concerns such elements as water reservoirs. Flat surfaces are preferred here again—grass, meadow, or water reservoir surrounded by lush vegetation of trees and shrubs. The preference for water does not come as a surprise, as has been proved in numerous studies conducted before [39,44,60]. Some of them were carried out in Warsaw as well, where the landscapes of the Vistula valley turned out to be the most favorite type of landscape [1,32,35].
The results of our study lead to the conclusion that IGS users prefer a landscape type similar to one of the classical urban parks. A total of 11 photograph clusters found in three groups present quite even images of the preferred landscape. They are the places where greenery is predominant, and surfaces of meadows and grass-covered areas are surrounded with groups of trees and shrubs or densely growing trees as well as outstanding separate plant elements—flowers, tree silhouettes, peculiar thick tree branches. The difference between the IGS landscape preferred by our respondents and parkland lies, on the one hand, in the “naturalness” of plant forms and the lack of anthropogenic elements in the centers of the landscape. The “parkland without any human beings” seems to be the universal beauty canon of informal greenery.
Typical park landscapes are designed to form a broad prospect and shelter its users simultaneously [61]. The explanation of the attractiveness of that type of landscape should be found in the prospect-refuge theory by Jay Appleton [62], which is based on evolutional psychology.
Still, one can find the explanation of the attractiveness of that landscape type by referring to the classical category of picturesque, on which contemporary landscape architecture is based. The concept of picturesque is deeply ingrained in the notion present in eighteenth-century literature and painting that nature creates itself in a manner as if it were designed by humans [63], becoming a concept like “parkland without human beings”. When experiencing nature as a landscape, which has been fully developed and described in the concept of picturesque, the sense of sight is front and center. The authors of the book “Alternative Types of Environment,” describing the practices derived from the fact that visuality takes the upper hand, introduced the term “spectacularization of the environment” [64]. The phenomenon is based on experiencing nature from a safe distance by an observer who is not directly involved. Such an approach allows us to aesthetically discover sites and vicinities of “wild nature” that in the past were considered hostile, unfriendly, dangerous, etc. [65]. Regarding these theories, one can ask a question: To what extent does research based on visual methods (VEP) not fall into the trap of ambient spectacularity appealing only to the visual qualities of the IGS?
How the above-asked question is formulated implies a possible explanation of why prototype centers lack such remarkable and frequently represented IGS landscape elements like dead trees, windbreaks, thickets and paths, small hand-made buildings, bonfires, etc. There is no point in jumping to the conclusion that these elements and functions accompanying them (biodiversity, ecosystem values, and freedom of use) are unimportant to users. According to the studies conducted with other methods, they are often crucial to users of this space [23,26,30,66,67,68].
The research focused on aesthetic values indicates the low esteem of landscape thickets, full of fallen trees, holes, and decaying timber, which can be explained by the need for order and neatness in the landscape and reflects the concern for space [69]. Such care is more visible and desirable than ecological values, often perceived as a mess and run-down space [31,69,70,71]. Even in landscapes dominated by dense wood, people are inclined to disapprove of dead timber and tend to identify its presence with inappropriate maintenance policies run by respective services and authorities [41].
Considering municipal authorities’ use of our IGS management study, it is worth evoking the concept of regenerative design [71,72,73]. It emphasizes the need for the creation of habitats that not only decrease negative impacts on the environment but actively support regenerative processes and recovery of ecosystems. In the context of the IGS user’s preferences analyzed, our conclusions may provide the proper perspective concerning the sustainable design of green areas considering regenerative elements.
Still, one must bear in mind the method limitations, especially partly subjective image tagging, which may have led to some distortions of the results. Continuing the studies and applying a more detailed qualitative analysis is necessary. Another critical point is to consider users’ diversity to adjust space to more diverse social expectations better.
5. Conclusions
The outcome of the study on IGS aesthetics in Warsaw shows there are two regularities regarding the perception of such areas. The research aimed at user preferences made it possible to distinguish the most frequently chosen IGS landscape elements and several universal patterns applied to them. Concerning our first research question, we have concluded that IGS users prefer environmental elements such as vast grass areas and dense groups of trees, shrubs, and water. According to the second question asked at the beginning of the survey and the frequency of elements, the dominant one is the grass or water surface, which is the cornerstone for many preferred compositions. An equally important observation, which can be classified in the repetitive, universal pattern, is that there are no anthropogenic elements in IGS landscape prototype centers. These conclusions may help enhance sustainable planning of municipal greenery, especially those of IGS type, including regenerative design and points at IGS as a new type of municipal recreational area and several particular elements that can define the aesthetics and attractiveness of IGS.
Supplementary Materials
The following supporting information can be downloaded at https://www.mdpi.com/article/10.3390/su16041619/s1, Data Chart S1: Tag matrix (1 = the respective attribute was present on the image).
Author Contributions
Conceptualization, B.J.G. and M.Ł.; methodology, B.J.G., M.Ł. and P.A.; investigation, B.J.G., M.Ł. and A.W.; data curation, B.J.G., M.Ł., P.A., A.W. and Ł.P.; writing—original draft, B.J.G., M.Ł., P.A., A.W. and Ł.P.; writing—review and editing, B.J.G., M.Ł. and A.W.; visualization, A.W. and Ł.P. All authors have read and agreed to the published version of the manuscript.
Funding
This work was implemented as a part of the project “Inventory and valorization of selected degraded and polluted areas in Warsaw—natural and social potential of wasteland”, co-financed under the Operational Program Infrastructure and Environment 2014-2020 2.5 “Improvement of the quality of the urban environment”, a project commissioned by the Zarząd Zieleni M.St. Warszawy (Department of Urban Greenery, Municipality of Warsaw) POIS.02.05.00-00-0207/16 of 21 July 2017.
Institutional Review Board Statement
After consulting with the WULS Research Ethics Committee, ethical review and approval were waived for this study due to its anonymity. The survey was conducted in complete agreement with the national and international regulations in compliance with the Declaration of Helsinki (2000). The personal information and data of the participants were anonymous according to the General Data Protection Regulation of the European Parliament (GDPR 679/2016). The survey did not require approval by the ethics committee because of the anonymous nature of the survey and the impossibility of tracking sensitive personal data. A brief description of the study and its aim and the declaration of anonymity and confidentiality of data was given to the participants before the start of the study. The survey and the photographs collected as a result were also anonymous.
Informed Consent Statement
Informed consent was obtained from all subjects involved in the study.
Data Availability Statement
The data supporting reported results can be found in the Supplementary Materials.
Acknowledgments
The authors thank all members of the research team involved in the project: Piotr Sikorski, Jarosław Chormański, Axel Schwerk, Marzena Wińska-Krysiak, Izabela Dymitryszyn, Tomasz Duda, Krzysztof Herman, Arkadiusz Przybysz, Aleksandra Przegalińska-Skierkowska, Daria Sikorska, Barbara Zajdel, Ryszard Nejman, Martyna Cziszewska, Agata Jojczyk, Wojciech Mejor, Jarosław Matusiak, Piotr Archiciński, Wojciech Ciężkowski, Maciej Góraj, Jacek Jóźwiak.
Conflicts of Interest
The authors declare no conflicts of interest.
References
- Sikorski, P.; Gawryszewska, B.; Sikorska, D.; Chormanński, J.; Schwerk, A.; Jojczyk, A.; Ciężkowski, W.; Archiciński, P.; Łepkowski, M.; Dymitryszyn, I.; et al. The Value of Doing Nothing—How Informal Green Spaces Can Provide Comparable Ecosystem Services to Cultivated Urban Parks. Ecosyst. Serv. 2021, 50, 101339. [Google Scholar] [CrossRef]
- Kowarik, I. Urban biodiversity, ecosystems and the city. Insights from 50 years of the Berlin School of Urban Ecology. Landsc. Urban. Plan. 2023, 240, 104877. [Google Scholar] [CrossRef]
- Luo, S.; Patuano, A. Multiple ecosystem services of informal green spaces: A literature review. Urban For. Urban Green 2023, 81, 127849. [Google Scholar] [CrossRef]
- Threlfall, C.G.; Kendal, D. The distinct ecological and social roles that wild spaces play in urban ecosystems. Urban For. Urban Green. 2018, 29, 348–356. [Google Scholar] [CrossRef]
- European Commission. The Forms and Functions of Green Infrastructure. Available online: https://ec.europa.eu/environment/nature/ecosystems/benefits/index_en.htm (accessed on 17 March 2021).
- Coutts, C.; Hahn, M. Green infrastructure, ecosystem services, and human health. Int. J. Environ. Res. Public Health 2015, 12, 9768–9798. [Google Scholar] [CrossRef] [PubMed]
- World Health Organization. Urban Green Spaces and Health 2016, (No. WHO/EURO: 2016-3352-43111-60341). World Health Organization. Regional Office for Europe. Available online: https://www.who.int/europe/publications/i/item/WHO-EURO-2016-3352-43111-60341 (accessed on 12 December 2023).
- Wood, E.; Harsant, A.; Dallimer, M.; Cronin de Chavez, A.; McEachan, R.R.; Hassall, C. Not all green space is created equal: Biodiversity predicts psychological restorative benefits from urban green space. Front. Psychol. 2018, 9, 2320. [Google Scholar] [CrossRef]
- Gascon, M.; Triguero-Mas, M.; Martínez, D.; Dadvand, P.; Rojas-Rueda, D.; Plasència, A.; Nieuwenhuijsen, M.J. Residential green spaces and mortality: A systematic review. Environ. Int. 2016, 86, 60–67. [Google Scholar] [CrossRef]
- Korpela, K.; Hartig, T. Restorative qualities of favorite places. J. Environ. Psychol. 1996, 16, 221–233. [Google Scholar] [CrossRef]
- White, M.P.; Weeks, A.; Hooper, T.; Bleakley, L.; Cracknell, D.; Lovell, R.; Jefferson, R.L. Marine Wildlife as an Important Component of Coastal Visits: The Role of Perceived Biodiversity and Species Behaviour. Mar. Policy 2017, 78, 80–89. [Google Scholar] [CrossRef]
- Ode Sang, Å.; Knez, I.; Gunnarsson, B.; Hedblom, M. The Effects of Naturalness, Gender, and Age on How Urban Green Space Is Perceived and Used. Urban For. Urban Green. 2016, 18, 268–276. [Google Scholar] [CrossRef]
- Völker, S.; Kistemann, T. The Impact of Blue Space on Human Health and Well-Being—Salutogenetic Health Effects of Inland Surface Waters: A Review. Int. J. Hyg. Environ. Health 2011, 214, 449–460. [Google Scholar] [CrossRef]
- Korpilo, S.; Kaaronen, R.O.; Olafsson, A.S.; Raymond, C.M. Public Participation GIS Can Help Assess Multiple Dimensions of Environmental Justice in Urban Green and Blue Space Planning. Appl. Geogr. 2022, 148, 102794. [Google Scholar] [CrossRef]
- Kuo, M.; Bacaicoa, M.; Sullivan, W. Transforming Inner-City Landscapes Trees, Sense of Safety, and Preference. Environ. Behav. 1998, 30, 28–59. [Google Scholar] [CrossRef]
- Clément, G. Manifeste du Tiers Paysage; Sujet/Objet: Paris, France, 2004. [Google Scholar]
- Gandy, M. Marginalia: Aesthetics, ecology, and urban wastelands. Ann. Am. Assoc. Geogr. 2013, 103, 1301–1316. [Google Scholar] [CrossRef]
- Del Tredici, P. The Flora of the Future. Places Journal. 2014. Available online: https://placesjournal.org/article/the-flora-of-the-future/ (accessed on 14 December 2023).
- Kowarik, I. Urban wilderness: Supply, demand, and access. Urban For. Urban Green. 2018, 29, 336–347. [Google Scholar] [CrossRef]
- Mathey, J.; Arndt, T.; Banse, J.; Rink, D. Public perception of spontaneous vegetation on brownfields in urban areas-Results from surveys in Dresden and Leipzig (Germany). Urban For. Urban Green. 2016, 29, 384–392. [Google Scholar] [CrossRef]
- Brun, M.; Di Pietro, F.; Bonthoux, S. Residents’ perceptions and valuations of urban wastelands are influenced by vegetation structure. Urban For. Urban Green. 2018, 29, 393–403. [Google Scholar] [CrossRef]
- Fischer, L.K.; Honold, J.; Cvejić, R.; Delshammar, T.; Hilbert, S.; Lafortezza, R.; Kowarik, I. Beyond green: Broad support for biodiversity in multicultural European cities. Glob. Environ. Change 2018, 49, 35–45. [Google Scholar] [CrossRef]
- Rupprecht, C.D.; Byrne, J.A.; Ueda, H.; Lo, A.Y.H. ‘It’s real, not fake like a park’: Residents’ perception and use of informal urban green-space in Brisbane, Australia and Sapporo, Japan. Landsc. Urban Plan. 2015, 143, 205–218. [Google Scholar] [CrossRef]
- Rupprecht, C.D.; Byrne, J.A.; Lo, A.Y.H. Memories of vacant lots: How and why residents used informal urban green space as children and teenagers in Brisbane, Australia, and Sapporo, Japan. Child. Geogr. 2016, 14, 340–355. [Google Scholar] [CrossRef]
- Gobster, P.H. Appreciating urban wildscapes: Towards a natural history of unnatural places. In Urban Wildscapes; Routledge: London, UK, 2012; pp. 33–48. [Google Scholar]
- Thompson, C.W. Places to be wild in nature. In Urban Wildscapes; Routledge: London, UK, 2012; pp. 49–64. [Google Scholar]
- Unt, A.L.; Bell, S. The impact of small-scale design interventions on the behaviour patterns of the users of an urban wasteland. Urban For. Urban Green. 2014, 13, 121–135. [Google Scholar] [CrossRef]
- Hofmann, M.; Westermann, J.R.; Kowarik, I.; Van der Meer, E. Perceptions of parks and urban derelict land by landscape planners and residents. Urban For. Urban Green. 2012, 11, 303–312. [Google Scholar] [CrossRef]
- Nejman, R.; Łepkowski, M.; Wilczyńska, A.; Gawryszewska, B.J. The right to wild. Green urban wasteland in the context of urban planning. Urban Dev. Issues 2018, 59, 43–53. [Google Scholar] [CrossRef]
- Gawryszewska, B.J.; Łepkowski, M.; Wilczyńska, A. City wastelands. Creating spaces of vernacular democracy. In Urban Gardening and the Struggle for Social and Spatial Justice; Certoma, C., Sondermann, M., Noori, S., Eds.; Manchester University Press: Manchester, UK, 2019; pp. 38–58. [Google Scholar] [CrossRef]
- Hands, D.E.; Brown, R.D. Enhancing visual preference of ecological rehabilitation sites. Landsc. Urban Plan. 2002, 58, 57–70. [Google Scholar] [CrossRef]
- Bąkowska-Waldmann, E. Rzeki Warszawy w Oczach Mieszkańców Wyniki Geoankiety Poświęconej Percepcji Dolin Rzecznych [Warsaw’s Rivers in the Eyes of the Inhabitants Results of a Geo-Survey Dedicated to the Perception of River Valleys]; Project Report “Miejskie Ekosystemy Dolin Rzecznych. Potencjał Usług Ekosystemów w Obliczu Antropogenicznych Zmian Klimatu” [Urban River Valley Ecosystems. The Potential of Ecosystem Services in the Face of Anthropogenic Climate Change] Sendzimir Foundation, Warsaw. 2022. Available online: https://sendzimir.org.pl/wp-content/uploads/2023/01/Raport-doliny-rzeczne.pdf (accessed on 10 August 2023).
- Angiel, J.; Angiel, P.J. Perception of river value in education for sustainable development (The Vistula River, Poland). Sustain. Dev. 2015, 23, 188–201. [Google Scholar] [CrossRef]
- Wilczyńska, A.; Niin, G.; Vassiljev, P.; Myszka, I.; Bell, S. Perceptions and Patterns of Use of Blue Spaces in Selected European Cities: Tartu, Tallinn, Barcelona, Warsaw and Plymouth. Sustainability 2023, 15, 7392. [Google Scholar] [CrossRef]
- Wojnowska-Heciak, M. The naturalness of the Vistula riverbank’s landscape: Warsaw inhabitants’ perceptions. Sustainability 2019, 11, 5957. [Google Scholar] [CrossRef]
- Projekt Studium Uwarunkowań i Kierunków Zagospodarowania Przestrzennego m.st. Warszawy 2 June 2023. [Draft of the Study of Conditions and Directions of Spatial Development of the Capital City of Warsaw] 2 June 2023 Warsaw. 2023. Available online: https://architektura.um.warszawa.pl/studium (accessed on 8 December 2023).
- Cherem, G.J.; Driver, B.L. Visitor employed photography: A technique to measure common perceptions of natural environments. J. Leis. Res. 1983, 15, 65–83. [Google Scholar] [CrossRef]
- Taylor, J.G.; Czarnowski, K.J.; Sexton, N.R.; Flick, S. The importance of water to Rocky Mountain National Park visitors: An adaptation of visitor-employed photography to natural resources management. J. Appl. Recreat. Res. 1995, 20, 61–85. [Google Scholar]
- Fung, C.K.; Jim, C.Y. Unraveling Hong Kong Geopark experience with visitor-employed photography method. Appl. Geogr. 2015, 62, 301–313. [Google Scholar] [CrossRef]
- Ye, I.Q.; Hughes, K.; Walters, G.; Mkono, M. Up close and personal: Using high engagement techniques to study Chinese visitors’ landscape perceptions. Tour. Manag. Perspect. 2020, 33, 100629. [Google Scholar] [CrossRef]
- Heyman, E. Analysing recreational values and management effects in an urban forest with the visitor-employed photography method. Urban For. Urban Green. 2012, 11, 267–277. [Google Scholar] [CrossRef]
- Cunningham, C.J.; Jones, M.A. How a community uses its parks: A case study of Ipswich, Queensland, Australia. Leis./Loisir 1999, 24, 233–253. [Google Scholar] [CrossRef]
- Sugimoto, K. Analysis of Scenic Perception and Its Spatial Tendency: Using Digital Cameras, GPS loggers, and GIS. Procedia Soc. Behav. Sci. 2011, 21, 43–52. [Google Scholar] [CrossRef][Green Version]
- Cherem, G.J. Looking through the eyes of the public. In I: Proceedings of Aesthetics Opportunity Colloqium; Utah State University: Logan, UT, USA, 1973. [Google Scholar]
- Haywood, K.M. Visitor-employed photography: An urban visit assessment. J. Travel. Res. 1990, 29, 25–29. [Google Scholar] [CrossRef]
- Stedman, R.; Beckley, T.; Wallace, S.; Ambard, M. A picture and 1000 words: Using resident-employed photography to understand attachment to high amenity places. J. Leis. Res. 2004, 36, 580–606. [Google Scholar] [CrossRef]
- Sun, F.; Xiang, J.; Tao, Y.; Tong, C.; Che, Y. Mapping the social values for ecosystem services in urban green spaces: Integrating a visitor-employed photography method into SolVES. Urban For. Urban Green. 2019, 38, 105–113. [Google Scholar] [CrossRef]
- Hawkins, G.; Harril, R.; Potts, T.; Becker, R. Finding Common Ground: A Model for Sustainable Community Development Planning. In Proceedings of the Leisure Research Symposium; National Recreation and Parks Association: Denver, CO, USA, 1999. [Google Scholar]
- Dorwart, C.E.; Moore, R.L.; Leung, Y.F. Visitors’ perceptions of a trail environment and effects on experiences: A model for nature-based recreation experiences. Leis. Sci. 2009, 32, 33–54. [Google Scholar] [CrossRef]
- Campos, A.; Oliveira, R.C. Cluster analysis applied to the evaluation of urban landscape quality. WIT Trans. Ecol. Environ. 2016, 204, 93–103. [Google Scholar] [CrossRef]
- Moreira Braz, A.; Mirándola García, P.H.; Luiz Pinto, A.; Salinas Chávez, E.; Oliveira, I.J.D. Integrated management of river basins: Possibilities and advances in the analysis of land use and land cover. Cuad. Geogr. Rev. Colomb. Geogr. 2020, 29, 69–85. [Google Scholar] [CrossRef]
- Liu, D. Application of Modern Urban Landscape Design Based on Machine Learning Model to Generate Plant Landscaping. Sci. Program. 2022, 2022, 1610427. [Google Scholar] [CrossRef]
- Long, J.; Nelson, T.; Wulder, M. Regionalization of landscape pattern indices using multivariate cluster analysis. Environ. Manag. 2010, 46, 134–142. [Google Scholar] [CrossRef]
- Kaufman, L.; Rousseeuw, P.J. Finding Groups in Data; John Wiley & Sons, Inc.: Hoboken, NJ, USA, 1990; ISBN 978-0-471-73578-6. [Google Scholar]
- Schubert, E.; Rousseeuw, P.J. Faster k-medoids clustering: Improving the PAM, CLARA, and CLARANS algorithms. In Proceedings of the Similarity Search and Applications: 12th International Conference, SISAP 2019, Newark, NJ, USA, 2–4 October 2019; Springer International Publishing: Berlin/Heidelberg, Germany; pp. 171–187. [Google Scholar]
- Ribe, R.G. The aesthetics of forestry: What has empirical preference research taught us? Environ. Manag. 1989, 13, 55–74. [Google Scholar] [CrossRef]
- Bjerke, T.; Østdahl, T.; Thrane, C.; Strumse, E. Vegetation density of urban parks and perceived appropriateness for recreation. Urban For. Urban Green. 2006, 5, 35–44. [Google Scholar] [CrossRef]
- Gundersen, V.; Frivold, L.H. Naturally dead and downed wood in Norwegian boreal forests: Public preferences and the effect of information. Scand. J. For. Res. 2011, 26, 110–119. [Google Scholar] [CrossRef]
- Odum, E.P.; Barrett, G.W. Fundamentals of Ecology, 5th ed.; Thomson Brooks/Cole: Pacific Grove, CA, USA, 2005. [Google Scholar]
- Arnberger, A.; Eder, R.; Preiner, S.; Hein, T.; Nopp-Mayr, U. Landscape Preferences of Visitors to the Danube Floodplains National Park, Vienna. Water 2021, 13, 2178. [Google Scholar] [CrossRef]
- Bell, P.A.; Green, T.; Fisher, J.D.; Baum, A. Environmental Psychology; Psychology Press: New Jersey, NJ, USA, 2001. [Google Scholar]
- Appleton, J. The Experience of Landscape; John Wiley: New York, NY, USA, 1975. [Google Scholar]
- Woźniakowski, J. Góry Niewzruszone: O Różnych Wyobrażeniach Przyrody w Dziejach Nowożytnej Kultury Europejskiej. [Mountains Unmoved: On Different Representations of Nature in the History of Modern European Culture]; Znak: Cracow, Poland, 1995. [Google Scholar]
- Macnaghten, P.; Urry, J. Alternatywne Przyrody: Nowe Myślenie o Przyrodzie i Społeczeństwie. [Alternative Natures: New Thinking about Nature and Society]; Scholar: Warsaw, Poland, 2005. [Google Scholar]
- Łepkowski, M.; Miasto Jako Przyswojona Przyroda. Projekt Ekologicznej Estetyki Przyrody Gernota Böhme w Kontekście Współczesnych Praktyk Artystycznych [The City as assimilated Nature. Gernot Böhme’s Project of Ecological Aesthetics of Nature in the Context of Contemporary Artistic Practices]. Master’s Thesis, University of Warsaw, Warsaw, Poland, 2011. [Google Scholar]
- Edensor, T.; Evans, B.; Holloway, J.; Millington, S.; Binnie, J. Playing in Industrial Ruins; Routledge: London, UK; New York, NY, USA, 2012; pp. 65–79. [Google Scholar]
- Gawryszewska, B.J.; Łepkowski, M.; Wilczyńska, A. Urban wastelands and their potential to deliver CICES community services. In Proceedings of the Growing in Cities: Interdisciplinary Perspectives on Urban Gardening Conference, Basel, Switzerland, 10–11 September 2016; pp. 387–404. [Google Scholar]
- Łepkowski, M.; Nejman, R.; Wilczyńska, A. The role of green urban wastelands in 3rd place creation. Challenge for urban policy in Poland. In Landscapes and Greenways of Resilience, Proceedings of 5th Fabos Conference on Landscape and Greenway Planning, Budapest, Hungary,1 July 2016; Jombach, S.W., Valanszki, I., Filep-Kovacs, K., Fabos, J.G., Ryan, R.L., Lindhult, M.S., Kollanyi, L., Eds.; Szent István Egyetem: Budapest, Hungary, 2016; pp. 45–53. [Google Scholar]
- Nassauer, J.I. Messy ecosystems, orderly frames. Landsc. J. 1995, 14, 161–170. [Google Scholar] [CrossRef]
- Gobster, P.H. The urban savanna: Reuniting ecological preference and function. Ecol. Restor. 1994, 12, 64–71. [Google Scholar] [CrossRef]
- Cole, R.J. Regenerative design and development: Current theory and practice. Build. Res. Inf. 2012, 40, 1–6. [Google Scholar] [CrossRef]
- Tainter, J.A. Regenerative design in science and society. Build. Res. Inf. 2012, 40, 369–372. [Google Scholar] [CrossRef]
- Yang, M.; Cho, T.Y. A Study on the Aesthetic Awareness of Regenerative Landscape Design Based on Post-industrial Landscape Design. J. Korean Soc. Des. Cult. 2023, 29, 291–302. [Google Scholar] [CrossRef]
Disclaimer/Publisher’s Note: The statements, opinions and data contained in all publications are solely those of the individual author(s) and contributor(s) and not of MDPI and/or the editor(s). MDPI and/or the editor(s) disclaim responsibility for any injury to people or property resulting from any ideas, methods, instructions or products referred to in the content. |
© 2024 by the authors. Licensee MDPI, Basel, Switzerland. This article is an open access article distributed under the terms and conditions of the Creative Commons Attribution (CC BY) license (https://creativecommons.org/licenses/by/4.0/).