Article

Spatial Justice of Urban Park Green Space under Multiple Travel Modes and at Multiple Scales: A Case Study of Qingdao City Center, China

1
College of Landscape Architecture and Forestry, Qingdao Agricultural University, Qingdao 266109, China
2
College of Resources and Environment, Qingdao Agricultural University, Qingdao 266109, China
3
Shandong Provincial Institute of Land and Space Planning, Jinan 250014, China
*
Authors to whom correspondence should be addressed.
These authors contributed equally to this work.
Sustainability 2024, 16(4), 1428; https://doi.org/10.3390/su16041428
Submission received: 22 November 2023 / Revised: 1 February 2024 / Accepted: 1 February 2024 / Published: 8 February 2024
(This article belongs to the Special Issue Urban Green Space and Sustainable Forest Management)

Abstract

:
Improving the justice of public parks is of great significance to the well-being of residents, and it is also an important goal of green space planning. In this paper, the spatial justice of park green space under five travel modes and at three scales was analyzed using the travel-behavior-based Gaussian two-step floating catchment area method (TB-G2SFCA) and Gini coefficient method for Qingdao City Center. The main results are as follows: Under walking mode, walking–bus mode, and walking–subway mode, there were unserved areas in terms of urban park green space, while there were no unserved areas in the cases of cycling and driving. Residents’ choice of travel time and travel mode would affect the service scope of the park green space, and the increase in travel time would reduce the unserved areas in the urban park green space. The choice of travel time and travel mode affected the accessibility of urban park green space for residents in each residential patch, as well as the justice of the distribution of park green space resources at the scales of street blocks, districts, and the whole study area. The increase in residents’ travel speed and travel time could promote the equitable allocation of urban park green space to a certain extent. The results of this study provide a scientific basis for the planning and construction of urban park green space in Qingdao City.

1. Introduction

Urban park green space (UPGS) is a key component of urban green infrastructure which plays a vital role in delivering various ecosystem services. Firstly, UPGS provides regulation and maintenance services, e.g., carbon sequestration, dust retention, heat mitigation, and noise reduction [1,2,3]. Secondly, UPGS supplies diverse cultural ecosystem services such as city dwellers’ spiritual enrichment, perceptual development, aesthetics, and entertainment [1,4,5,6]. In this regard, UPGS is closely related to the well-being of residents, and it is an essential resource for city residents to which they should have equal access in an ideal world. However, many studies have shown that access to UPGS remains unequally distributed to some extent, which has been regarded as a critical environmental justice issue [7,8].
Environmental justice refers to the fair treatment and substantial involvement of all people, regardless of race, national origin, or income, with respect to the development, implementation, and enforcement of environmental laws, regulations, and policies [7,9,10,11]. Several studies have shown that city residents with inferior socioeconomic statuses have relatively less access to UPGS, which is referred to as “spatial injustice” or “environmental injustices” [12,13,14,15]. In general, a great majority of the literature has investigated spatial justice or injustice by means of assessing the accessibility of urban green spaces [16,17].
Accessibility is a multi-dimension concept that has been differently defined by various authors. It has been widely applied in several scientific fields over the past few decades, such as urban planning, transport planning, and geography, and it also plays an important role in policymaking [18,19,20,21,22]. The most common definition of accessibility is the potential to reach spatially distributed opportunities [23,24]. In 2004, a systematic review on assessing accessibility in terms of land use, transport strategies, and development was conducted, and the author argued that there was a trade-off between easily operationalizing and satisfying theoretical criteria [25]. Here, the accessibility of UPGS is defined as the quantity of available UPGS. In reality, owing to variations in urban planning, economic level, residential vitality, etc., there is uneven accessibility or serious injustice in the spatial distribution of UPGS [26,27], and the spatial injustice weakens urban residents’ well-being. Conversely, improving the justice of UPGS can effectively increase the well-being of urban residents and promote the sustainable development of the urban environment. Hence, evaluating UPGS spatial justice would definitely contribute to improving the accessibility of green spaces and reducing the disparity in UPGS distribution.
In view of the equity of UPGS distribution, several studies have focused on residents’ accessibility and spatial justice, and have argued that the quality of green space [28,29], demographic groups (such as age and income) [7,8,30,31], and transportation networks influences the accessibility of urban green spaces [32,33]. Until now, a series of quantitative calculation methods, e.g., buffer zone analysis [12,34], network analysis [35], spatial syntax [36], and the two-step floating catchment area method [37,38,39], have been applied to assess accessibility. In addition, justice can be reflected in the balance of resource distribution within a region, and consequently, the Gini coefficient is also a common measure used for determining the fairness of resource allocation [40,41]. However, previous studies have merely used a single travel mode to assess green space justice [42], which is not in accordance with the reality of residents’ travel, and they have also neglected the transportation injustice within their study area. In addition, some scholars have reached conclusions on residents’ accessibility and spatial justice by means of large-scale panel data [22], which does not take into account the uneven population distribution within a street block [31].
As one of China’s megacities, Qingdao City has highlighted park city construction in the 14th Five-Year Plan, and it is stated that the per capita park green space area will not be less than 15 m2 in 2025. In this context, there is an urgent need to improve the utilization rate of UPGS and promote the justice of UPGS allocation.
Therefore, we employed the processed population distribution data and first-hand travel mode data to assess the accessibility and spatial justice of UPGS, then evaluated spatial justice under multiple travel modes and analyzed its scale effects, providing a sound basis for accurately assessing the ecosystem service and improving the spatial justice of UPGS. Based on a survey of local residents’ travel behavior, we set two time thresholds (including 15 min and 30 min) and five travel modes (i.e., walking, cycling, walking–subway combined travel, walking–bus combined travel, and driving), and used the travel behavior-based Gaussian two-step floating catchment area method (TB-G2SFCA) to investigate the differences in UPGS accessibility at the patch scale and under multiple travel modes. We utilized the green space justice model to compare the differences in space justice of UPGS at the street block scale, the district scale, and the whole study area scale, respectively. Based on the findings from the evaluation and analysis, this study proceeds to propose corresponding optimization strategies to improve the accessibility and spatial justice or environmental justice of UPGS in Qingdao City.

2. Materials and Methods
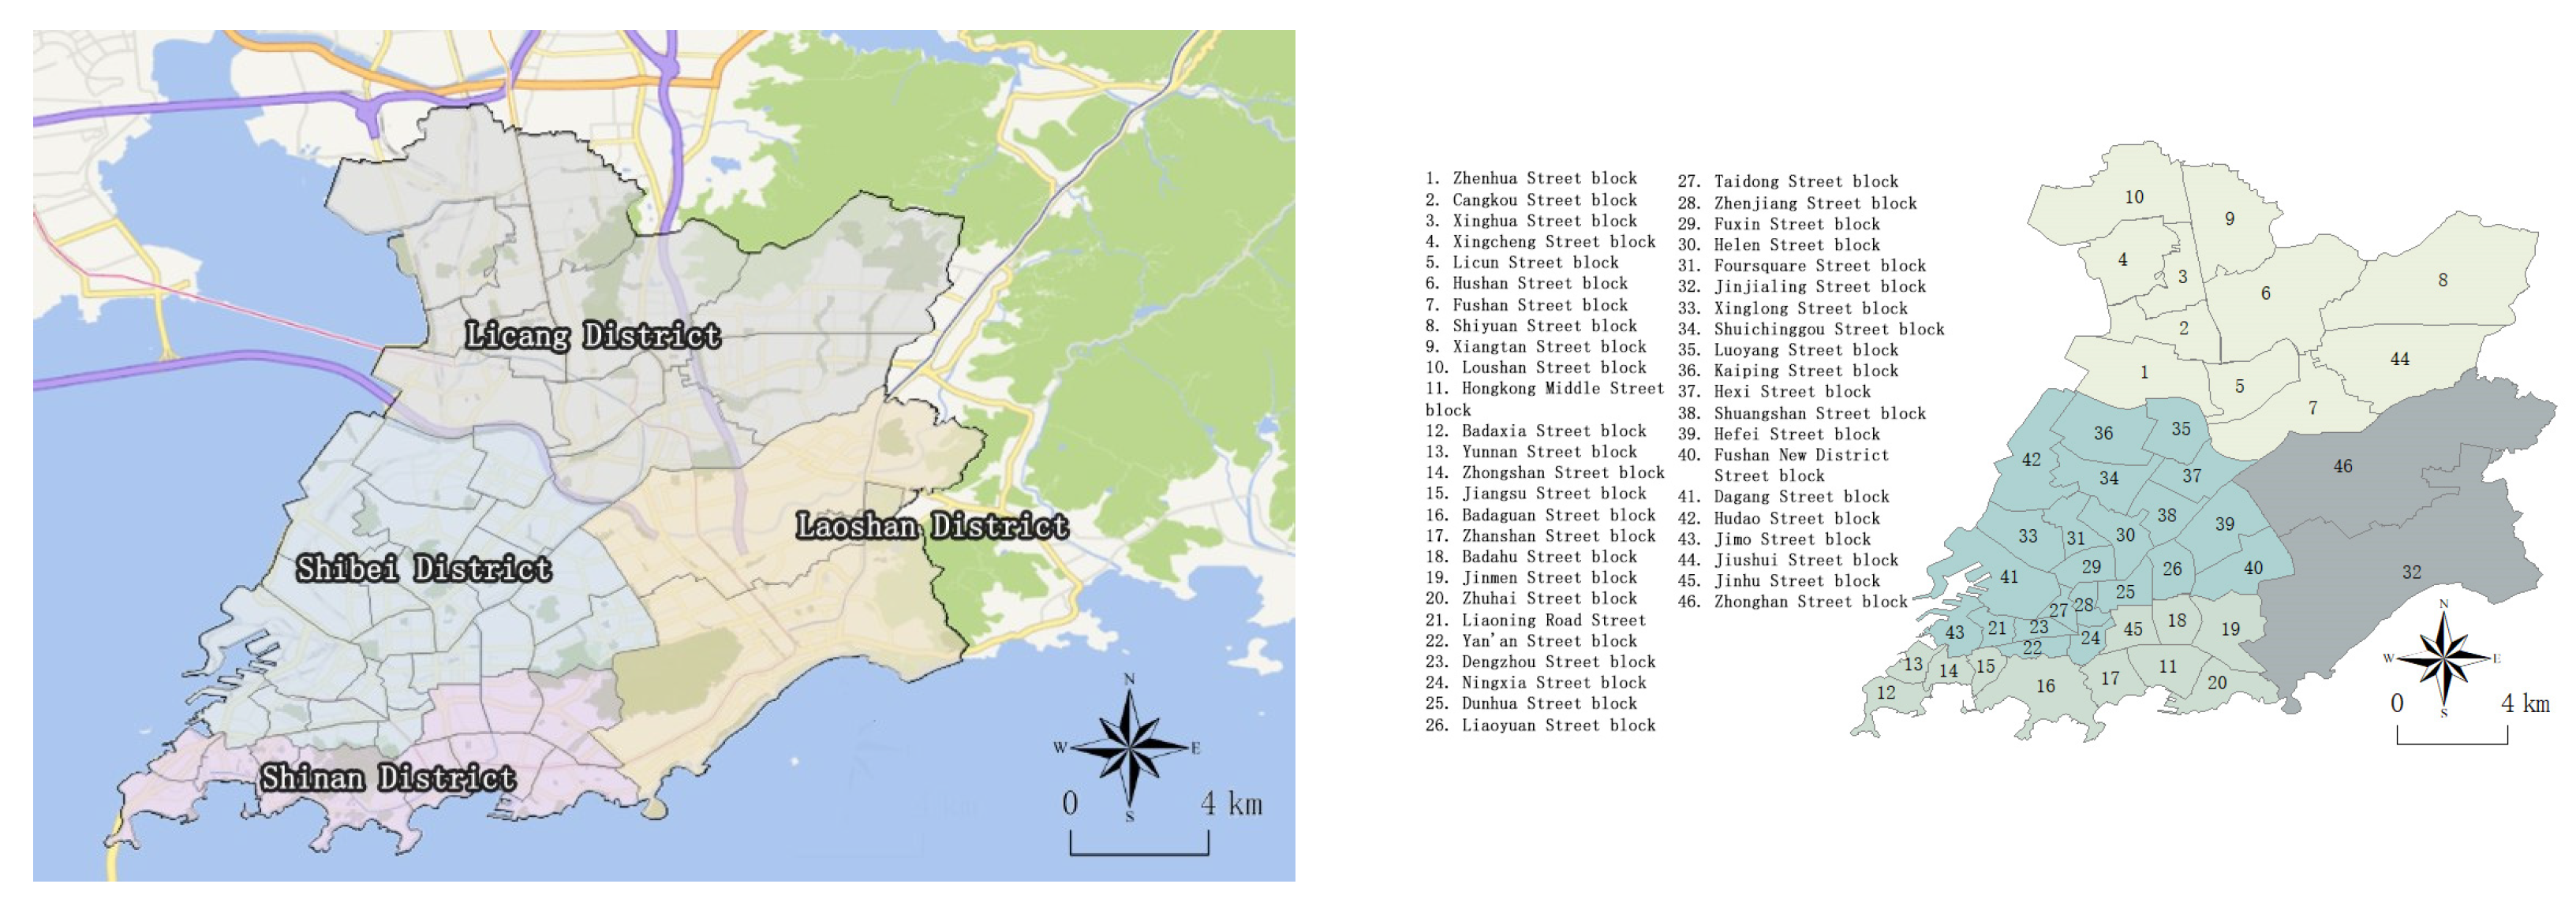
2.1. Study Area

Qingdao City is located on the south coast of the Shandong Peninsula, and it is the economic center of east China’s Shandong Province. It is famous as a coastal holiday tourism city as well as a major nodal city along the belt and road that connects Asia with Europe, and it covers an area of 11,282 square kilometers. It includes seven districts and three county-level cities, wherein Shinan District, Shibei District, Laoshan District, and Licang District belong to the city center. Red tiles, green trees, as well as clear blue sky and ocean are the four highlights of Qingdao City.
Situated in the eastern coastal region of Qingdao City, the study area encompasses 4 districts and 46 street blocks (120°16′–120°22′ N, 36°2′–36°9′ E) (Figure 1). The study area covers about 253.13 square kilometers, and the resident population is about 279.6 thousand, which accounts for about 2.24% and 27.26% of the total area and population of Qingdao City, respectively. The city center has abundant tourism resources, and the park green space area covers about 24.52 square kilometers. The road networks are highly reachable and densely connected. Additionally, subway lines 1, 2, 3, and 11 spread through the city center. Thus, the residents in the city center have various choices of travel modes, namely walking, cycling, walking–subway combined travel, walking–bus combined travel, and driving.

2.2. Research Methods and Data Processing

2.2.1. Research Method

Travel-Behavior-Based Gaussian Two-Step Floating Catchment Area Method (TB-G2SFCA)

Green space accessibility reflects the difficulty and quantity of residents’ access to UPGS, and it is also used to identify unserved areas in terms of park green space. The Gaussian two-step floating catchment area method (G2SFCA) is a conventional model for accessibility calculation based on travel cost, which is a combination of the traditional two-step floating catchment area (2SFCA) and the Gaussian function [43]. The travel cost can be divided into distance cost and time cost, and the time cost can be measured by the travel time between the supply side and demand side. Consequently, since this study adopted the TB-G2SFCA method to assess the accessibility of UPGS, the actual travel conditions of residents could be thoroughly considered according to different travel patterns, travel speeds, and travel times [21]. For ease of presentation, we used the quintile method to divide the accessibility of each residential area into five categories: I, II, III, IV, and V.
G d i j = e 1 2 × d i j d 0 2 e 1 2 1 e 1 2 d i j d 0
A i = j d i j d 0 G ( d i j ) R j = j d i j d 0 G ( d i j ) S j i d i j d 0 G ( d i j ) D i
where Ai is the park accessibility of residential community i, i.e., the area of accessible park green space for the residential community under different travel modes; dij is the travel time from the residential community i to the park green space j; d0 is the travel time threshold; Rj is the supply and demand capacity of the park green space, i.e., the area of PGS available per local resident; Sj is the area of park green space j; Di is the population of residential patch i; and G(dij) is the Gaussian decay function.

Gini Coefficient Method

The Gini coefficient is a typical indicator of public resource disparity [41], which could be employed to evaluate the justice of park green space resource allocation in the study area and the districts as a whole. The Gini coefficient varies between 0 and 1, and it should be noted that the smaller the Gini coefficient is, the higher the justice of green space resource allocation is. Here, the Gini coefficient was calculated as follows [44].
G E u = 1 k = 1 n ( P k P k 1 ) ( C k + C k 1 )
C k = i = 1 k A i D i i = 1 n A i D i
where GEu is the park green space justice index of geographic unit u; n is the total number of residential patches in geographic unit u; k is the k-th patch after ranking the park green space accessibility of patches from the smallest to the largest; k = 1, 2, … n; Ai and Di are the park green space accessibility value and population of the patch i, respectively; Ck is the cumulative ratio of the product of park green space accessibility and population of the corresponding patches from patch 1 to k, C0 = 0, Cn = 1; and Pk is the cumulative ratio of population from patch 1 to patch k, P0 = 0, Pn = 1.

2.2.2. Data Acquisition and Processing

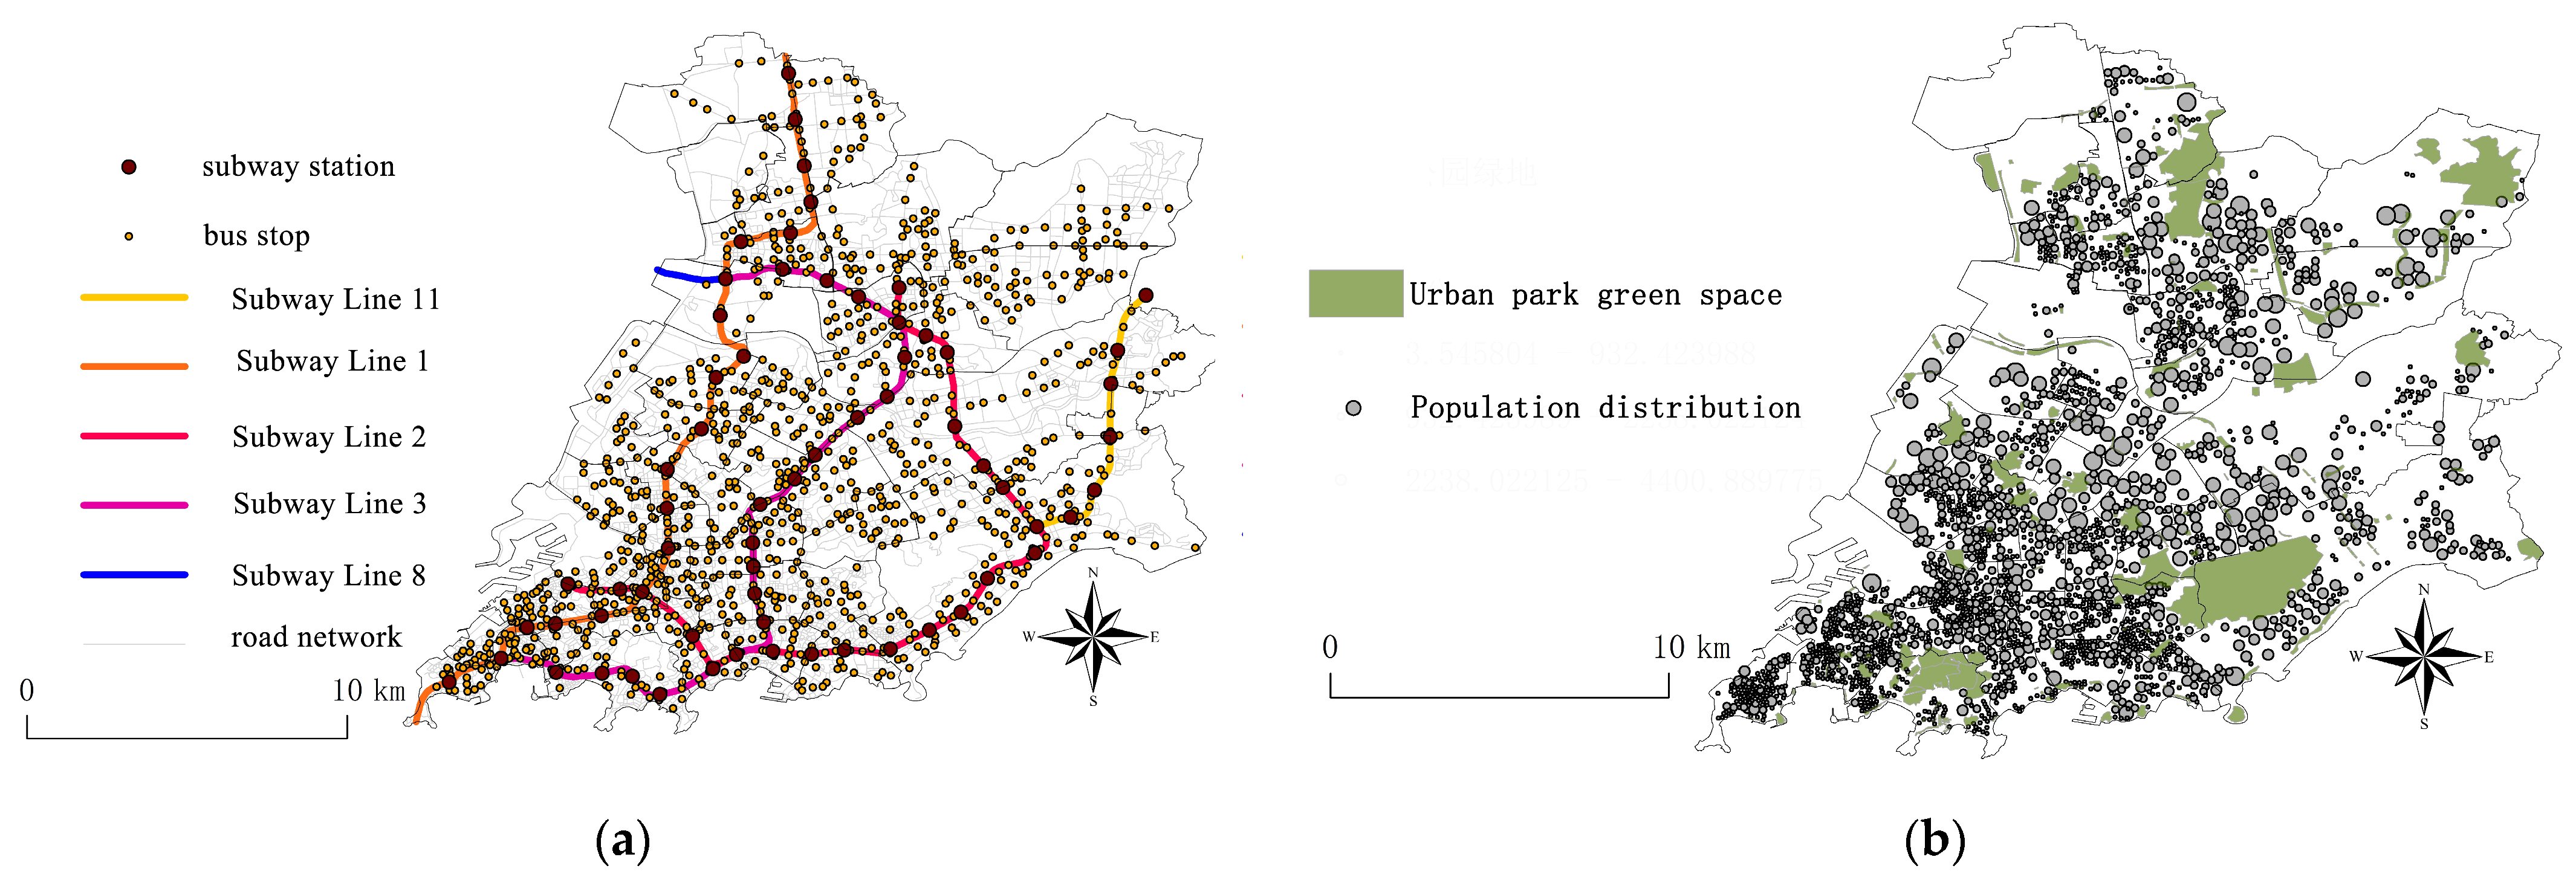
Data Acquisition and Processing of Population

In the absence of freely available census data at a sufficiently granular scale, alternative methods of estimating residential populations at the street level were required. We estimated the population of each residential building unit based on building height and building coverage. Firstly, the building outline and height of the study area were obtained from the GaodeMap Open Platform (https://gaode.com, accessed on 19 October 2021), and non-residential building outlines, such as schools, commercial buildings, factory buildings, and scenic spots, were removed by manual visual interpretation using ArcGIS 10.5 software. The building outlines were calibrated according to remote sensing images of the study area in 2021. Secondly, the number of floors of the original building outline was calculated, and the numbers of floors of any new buildings not shown on the GaodeMap, and any buildings whose height was unclear on GaodeMap, were calibrated using a web search and the Baidu Street View platform (https://lbs.baidu.com/visualize/home, accessed on 22 October 2021 ) to reduce the errors in the building data. Overall, 2346 residential patches were divided in ArcGIS 10.5 software using a pedestrian road network, and their populations were counted as follows.
C P = R A × H j 3 H A
where CP is the number of residents of building j; Hj is the height of building j, and the height of each floor is assumed to be 3 m by convention; RA is the floor area of building j in m2; and HA represents the floor areas of residential buildings per capita in Qingdao City in 2020, set at 33.4 m2 and 38 m2, respectively, for urban residents and rural residents according to the statistical data [45].

Data Acquisition and Processing of Urban Park Green Space (UPGS)

We distinguished the park green space from other green spaces according to a Chinese national standard entitled “Urban Green Space Classification Standard” (CJJ/T 85-2017 [46]). Based on the high-resolution satellite imagery from 2021 and vector data of the administrative boundary for each district in the study area, we used ArcGIS 10.5 software in combination with the GaodeMap open platform (https://gaode.com, accessed on 25 October 2021) and BaiduMap open platform (https://map.baidu.com/, accessed on 25 October 2021) to determine the boundary of each park green space. We made a vector map of urban green space patches using the manual visual interpretation method, and then calculated the areas of green space patches.

Data Acquisition and Processing of Visitor Travel and Road Network

We randomly conducted a face-to-face survey of 508 local residents who were visiting the park green spaces through the questionnaire (Appendix A). It was found that there were five travel modes for local residents, i.e., taking the bus, taking the subway, self-driving, walking, and cycling (Figure 2). In terms of travel modes, the number of local residents who chose to travel on foot and take public transportation accounted for the majority, and 86.66% of local residents spent less than 30 min traveling. Then, in combination with travel software and data from previous literature, we determined the speeds of the various travel modes, i.e., 4.01 km/h for walking, 15.03 km/h for cycling, 16.33 km/h for taking the bus, 40.91 km/h for taking the subway line 1, 32.87 for taking the subway line 2, 31.79 km/h for taking the subway line 3, 61.47 km/h for taking the subway line 11, and 28.13 km/h for driving, respectively [47]. Moreover, road network data, bus stop data, and subway station data were obtained from the OpenStreetMap website, including GaodeMap and BaiduMap (https://www.openstreetmap.org, accessed on 28 October 2021).
Because of the traffic rules, residents who take public transportation transfer at the transit station. The shortest straight-line distance to the green space does not denote the shortest time which the residents can spend. In more detail, the residents would have no choice but to walk to transfer onto the bus or subway if they chose public transportation. Therefore, based on the above methods and principles, we used ArcGIS 10.5 software to build an urban road network data set under five travel modes, i.e., walking, cycling, driving, walking–bus combined travel, and walking–subway combined travel, and the routes were classified and refined correspondingly. These five travel modes fully characterize the actual travel patterns of local residents.

3. Results

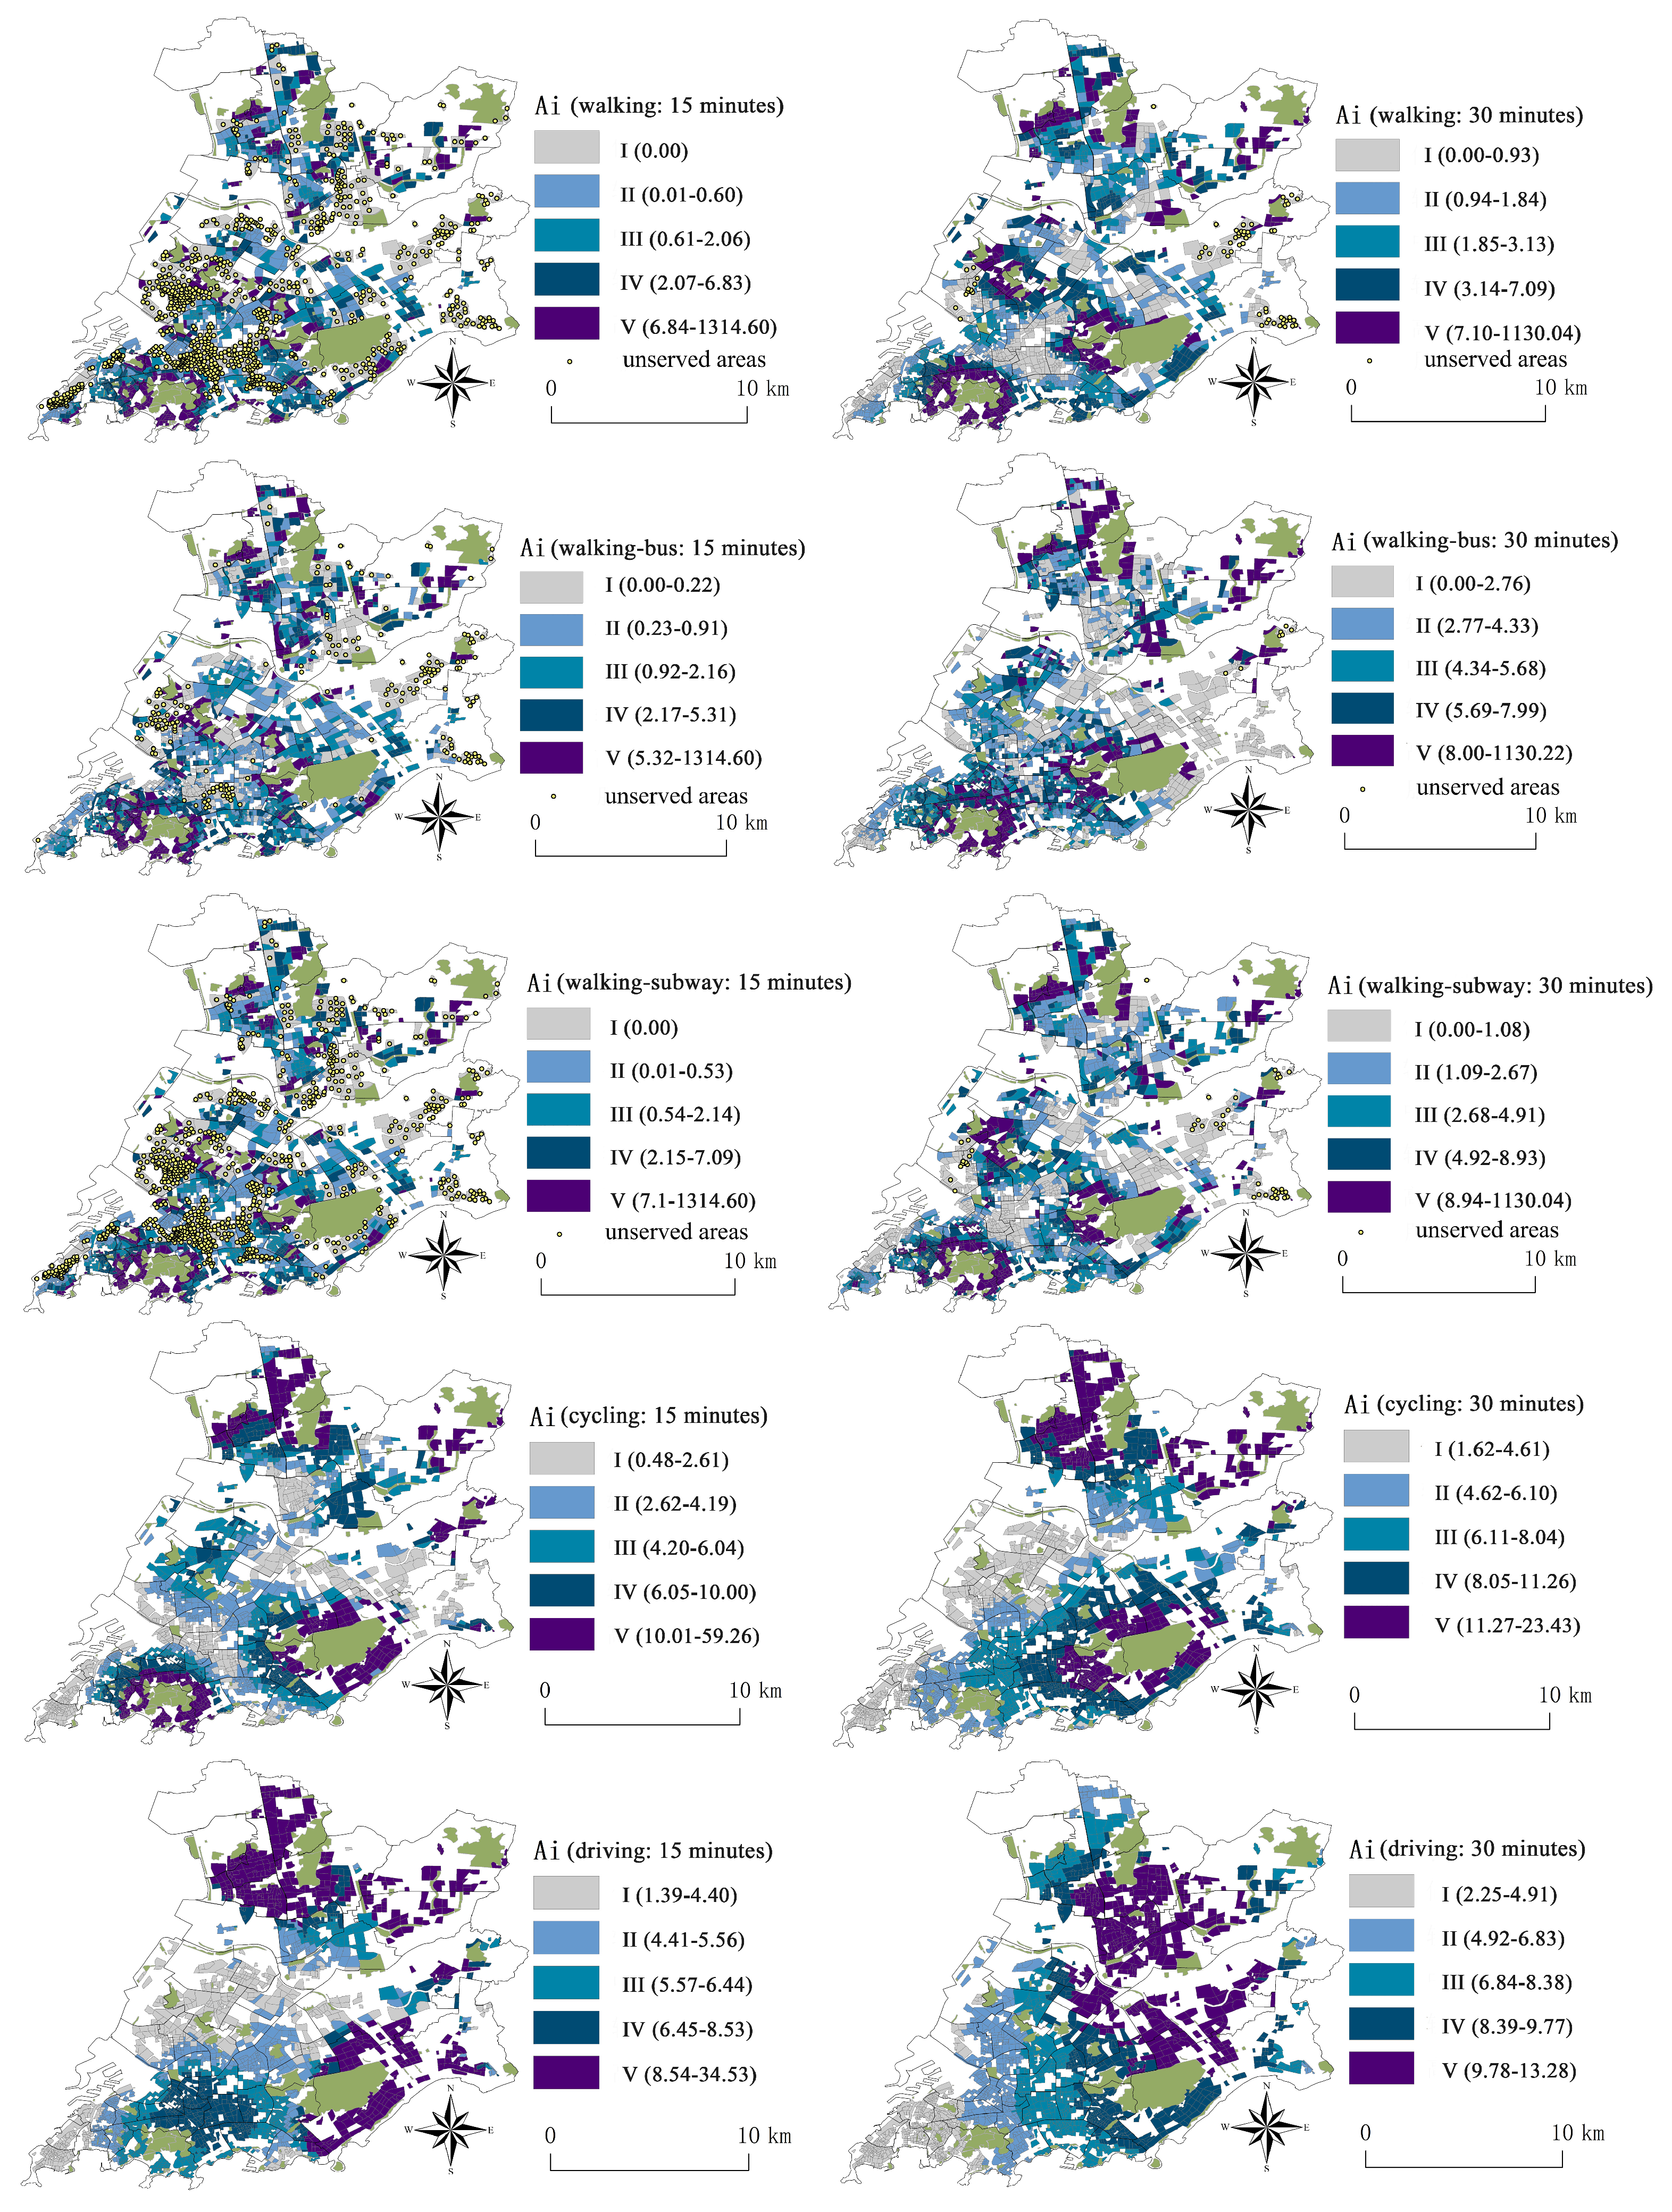
3.1. Accessibility of UPGS at the Scale of Residential Areas

With the increase in travel time and the promotion of travel modes, the service area of UPGS increased, and the unserved area in terms of park green space decreased. Under the scenarios of walking within 15 min and 30 min, the proportions of 2346 patches in residential areas with non-accessibility to green park space were 36.19% and 2.77%, respectively. Under the circumstances of walking–subway combined travel within 15 min and 30 min, 33.80% and 2.26% of the residential areas had non-accessibility to park green spaces, respectively. Additionally, 8.57% and 0.43% of the residential area patches were in unserved areas in terms of walking–bus combined travel within 15 min and 30 min, respectively. However, under the conditions of cycling or driving, the accessibility values of residential area patches were both greater than 0, implying that there were no unserved UPGS areas.
As shown in Figure 3, under the scenario of walking within 15 min, unserved areas in terms of UPGS were mainly located in Yunnan Street Block and Badahu Street Block in Shinnan District, Xinglong Street Block and Sifang Street Block in Shibei District, Fushan Street Block and Hushan Street Block in Licang District, and Zhonghan Street Block and Jinjialing Street Block in Laoshan District, respectively. However, under the circumstances of walking–subway combined travel within 15 min, unserved areas in terms of UPGS were distributed in several street blocks, including Yunnan Street Block, Xinglong Street Block, and Sifang Street Block. In the context of walking–bus combined travel, the unserved areas in terms of UPGS were distributed in several street blocks, including Jinhu Street Block, Xinglong Street Block, and Hudao Street Block. Nonetheless, in terms of 30 min of walking and walking–subway combined travel, the unserved areas were mainly in Hudao Street Block in Shibei District, Zhonghan Street Block, and Jinjialing Street Block in Laoshan District. Notably, just one street block fell into the unserved spot, namely, Zhonghan Street Block in Laoshan District, in the context of walking–bus combined travel within 30 min.
Under the condition of 15 min travel, the maximum accessibility of the residential patches was 1314.60 m2 for the walking, walking–subway combined travel, and walking–bus combined travel modes. Notably, the accessibility range of the residential patches was extremely broad in the context of walking, and could reach up to 1314.6 m2. However, in terms of the cycling and driving modes, the maximum accessibility levels of the patches were, respectively, 59.26 m2 and 34.53 m2. The extreme difference between residential accessibility ranges was relatively smaller than that in the context of walking, and these extreme differences was 58.78 m2 and 33.14 m2, respectively. Furthermore, under the travel time threshold of 30 min, the values of patch accessibility nearly ascended to 1130 m2 by means of walking, walking–subway combined travel, and walking–bus combined travel. The interval of patch accessibility was quite large for residential areas. However, under cycling and driving travel conditions, the maximum values of patch accessibility were, respectively, 23.43 m2 and 13.28 m2; hence, the extreme differences between residential areas were relatively smaller than the above travel modes involving walking. This phenomenon indicates that the accessibility gap of residential patches decreases gradually with the walking travel mode, combined walking and public transportation mode, cycling mode, and driving mode at the same travel time scale; moreover, the accessibility gap of residential patches decreased along with the increasing travel time in the same travel mode.

3.2. Justice Analysis of Park Green Space at Street Block Scale

In terms of the 15-min traveling threshold, the only two street blocks were Jiangsu Street Block and Loushan Street Block, which had the best justice and the fairest distribution of park green space resources as far as walking and walking–subway combined travel were concerned, whereas the other 37 street blocks had less equal distribution of park green space resources under these circumstances (Figure 4). Under the scenario of walking–bus combined travel, Loushan Street Block had a very fair distribution of UPGS, while the other 41 street blocks in the study area presented uneven distributions of UPGS. With regard to the cycling mode, 28 street blocks had highly fair or relatively even distributions of UPGS; furthermore, two street blocks, i.e., Jinjialing Street Block and Zhonghan Street Block, had the worst justice and the sharpest disparity of UPGS. Nevertheless, with regard to the driving mode, all street blocks except for Jinjialing Street Block, Zhonghan Street Block, and Zhuhai Street Block presented highly even distributions of UPGS.
Under the circumstances of 30 min of walking and walking–subway combined travel, only a minority of the street blocks had highly equal distributions of UPGS, while the majority of the street blocks had large or uneven distributions of UPGS. As far as the walking–bus travel mode was concerned, more than half of the street blocks had highly fair distributions in terms of UPGS, while only Jinjialing Street Block, Zhonghan Street Block, and Hushan Street Block had uneven distributions of UPGS. Furthermore, with regard to the cycling mode or driving mode, all streets presented highly just distributions of UPGS.

3.3. Justice Analysis of Park Green Space at District Level Scale

With regard to 15-min travel, the spatial differences in justice were smaller under the walking, walking–bus, and walking–subway combined travel modes, while the justice values of the whole study area and each district involved were higher than 0.8, with a wide gap in the allocation of UPGS (Figure 5). The spatial differences in justice increased under the cycling and driving travel modes. Under the cycling scenario, the Gini coefficient of Shibei District was 0.39, with a more reasonable allocation of UPGS, in contrast with a much larger gap in the UPGS allocation in other districts. Under the circumstances of driving, the allocation of park green space resources in Shinan District and Shibei District was shown to be highly even, the allocation of UPGS in Licang District was relatively uneven, and the allocation of UPGS in Laoshan District was more reasonable.
As far as 30-min traveling was concerned, the spatial differences in justice were relatively larger under the walking, walking–bus combined travel, and walking–subway combined travel modes in contrast with the other two modes. Under the walking and walking–subway combined travel conditions, the Gini coefficient was less than 0.6 for Shibei District, with a larger gap in UPGS allocation; however, the Gini coefficient was greater than 0.9 for Laoshan District, with a large gap in UPGS distribution. With regard to the walking–bus combined travel mode, the Gini coefficient was less than 0.4 for Shinan District and Shibei District, with a large gap in UPGS distribution. The Gini coefficient of Laoshan District was greater than 0.8, and the disparity in the distribution of UPGS was quite large. Moreover, under the conditions of cycling and driving, the spatial difference in justice decreased, and the distribution of green space resources in Laoshan District was highly uniform under the cycling mode, while the distributions of green space resources in the other three districts were relatively even. Under the conditions of driving, the Gini coefficient of each district was less than 0.2, and the distribution of green space resources was highly even. Therefore, the justice of UPGS in the whole study area and the districts is influenced by travel time as well as travel mode.

4. Discussion

Previous studies have shown evidence that travel distance exerts considerable limiting effects on park visits [48,49]. However, the accessibility of park green spaces varies according to travel modes and travel time. In this study, we set the travel time thresholds, i.e.,15 min and 30 min, by conducting a survey of local residents. In contrast with the previous literature [7,50], which took the total population of the street block as a whole or assumed that the default population was uniformly distributed in order to calculate the population distribution, our results are certainly more convincing. We estimated the population of each residential building unit by combining data such as the number of people on the street block, the urban per capita floor area, the area of the residential building unit, and the number of floors, which ensured a more accurate estimate of the populations of the residential patches. Moreover, the distinction among different travel modes, including walking, cycling, taking public transportation, and driving, has already been studied by some scholars; however, they merely focused on the differences in road networks and travel speeds [38,47]. In this study, we identified five travel modes via first-hand questionnaire data from residents visiting park green spaces. Moreover, we also combined the road network data involving bus stops and subway stations, considering that residents were able to take public transportation or transfer only at the stops, which ensured greater compliance with the actual travel situations of residents. Accordingly, this study’s method would be considered as an innovative way to further promote issues of UPGS accessibility and spatial justice, which we reflected by refining the supply and demand data, incorporating multiple travel modes, and utilizing the optimized model. Therefore, it has led to a more accurate assessment of the accessibility of UPGS in residential patches and the justice of UPGS in each district under various circumstances and at different scales. This study mainly took the area of UPGS as the key factor to assess its service ability; however, the service ability of urban green space could be affected by several factors, e.g., landscape quality, facilities, planting configuration, management levels, gender, age, and income [51,52], so there is some deficiency in this aspect. In addition, we conducted the survey among 508 park visitors and obtained valid responses; however, it may be perceived as biased due to the fact that we omitted those who had no access to a park, e.g., due to travel distance or a mobility impairment.
According to the “Qingdao 14th Five-Year Plan (2021–2025) for Forestry Development Plan”, the urban green space per capita in Qingdao should be no less than 15 m2 in 2025. In our study, the accessibility gap between residents was the smallest under the driving mode, and the justice of UPGS in each street was the best, but the highest accessibility value was 13.28 m2. In other words, under the most convenient travel modes, the current urban green space per capita in the study area still did not meet the requirements anticipated for 2025. The Gini coefficient varied with travel time and travel mode, and it also presented differences among four districts, indicating the inequality of access to UPGS. Thus, in order to improve the accessibility of UPGS and promote justice in UPGS distribution, we propose the following two suggestions: Firstly, greater attention should be paid to the unserved area in terms of park green space, and the areas of park green spaces should be increased. In fact, the central districts of Qingdao City are densely built, and in the subsequent planning, it will be necessary to make full use of various marginal land, construct pocket parks in the gaps around the buildings, and extend the park green space layout by means of adding plants and recreational facilities. Secondly, it is vital to improve travel conditions and reduce travel resistance. For instance, although a mountainous green space lies in the south of Laoshan District, the entrances to the park are restricted owing to the limitations of the intrinsic topography and urban road network. In recent years, the local government could have increased the investment in shared vehicles and improved parking service facilities around the park green space, in addition to increasing the connection between green spaces and residential areas.

5. Conclusions

This study used the G2SFCA method combined with residents’ travel time thresholds to evaluate the accessibility of park green spaces at the residential patch scale under five travel modes (i.e., walking, cycling, walking–subway travel, walking–bus travel, and driving), and it also adopted the park green space justice model to investigate the justice of park green spaces at the street block scale and the district scale. The main results are presented as follows: (1) With the increase in the time threshold and the upgrading of travel modes, the service scope of park green spaces increases, and the percentage of unserved areas of UPGS decreases from 36.19% to 0%. Similarly, the accessibility gap between each residential area patch gradually decreases. (2) There is a significant difference in the available green space resources for residents in different street blocks under the walking mode, walking–subway mode, and walking–subway modes, while the distribution of park green spaces is highly homogeneous among the 46 street blocks under the cycling mode and driving mode. As the time threshold increases, the justice of park green space in each geographical unit (the whole study area, districts, and street blocks) gradually increases. (3) The choice of residents’ travel modes will affect the justice of park green spaces at various geographical scales (the whole study area, districts, and street blocks).

Author Contributions

Conceptualization, S.L. and X.Z. (Xueyan Zeng); methodology, S.L., X.Z. (Xueyan Zeng) and X.Z. (Xiaoguang Zhang); software, X.Z. (Xueyan Zeng) and X.Z. (Xiaoguang Zhang); formal analysis, X.Z. (Xueyan Zeng) and F.W.; investigation, X.Z. (Xueyan Zeng), F.W., T.Z. and J.Z.; data curation, S.L. and F.W.; writing—original draft preparation, S.L., X.Z. (Xueyan Zeng) and X.Z.(Xiaoguang Zhang).; writing—review and editing, S.L., X.Z. (Xueyan Zeng) and X.Z. (Xiaoguang Zhang); visualization, X.Z. (Xueyan Zeng) and X.Z. (Xiaoguang Zhang); supervision, S.L.; project administration, S.L. and J.J.; funding acquisition, S.L. and J.J. All authors have read and agreed to the published version of the manuscript.

Funding

This research was funded by the Qingdao Science and Technology Foundation for Public Wellbeing (23-2-8-cspz-10 nsh) and the technical service for Shandong Provincial Institute of Land and Space Planning (6602422217; 6602422218).

Institutional Review Board Statement

This study did not involve human subjects, animals, plants, or cells.

Informed Consent Statement

The study did not involve human subjects.

Data Availability Statement

The data that support the findings of this study are available from the corresponding author upon reasonable request.

Conflicts of Interest

The authors declare no conflicts of interest.

Appendix A

Questionnaire Templates.
1. What is the purpose of travel to parks?
□ Sightseeing □ Exercise and Fitness □ Community activity □ Scientific research □ Photography
2. Where do you reside?
□ Shinan □ Shibei □ Licang □ Laoshan □ Chenyang □ Jimo □ Huangdao □ other
3. How long does it take to get from residential area to the park?
□ 10 min □ 30 min □ 1 h □ 2 h □ 3 h □ 4 h □ 5 h □ >5 h
4. Your travel mode to arrive at the park?
□ Bus/Subway □ Driving □ Cycling □ Walking □ Combination □ Other
5. How much does it cost to get from residential area to the park?
□ CNY 0 □ CNY 2 □ CNY 4 □ CNY 6 □ CNY 8 □ CNY 10 □ CNY 20 □ CNY 40 □ CNY 60 □ CNY 60 □ CNY 80 □ CNY 100 □ More
6. How often do you go to the park?
□ Every day □ Twice a week □ Once a week □ Twice a month □ Once a month □ Twice a year □ Once a year □ Other
7. How much time do you spend at the park?
□ 15 min □ 40 min □ 1 h □ 2 h □ 3 h □ 4 h □ 5 h □ More
8. How much do you spend at the park?
□ CNY 0 □ CNY 1–10 □ CNY 11–20 □ CNY 21–30 □ CNY 31–40 □ CNY 41–50 □ CNY 51–70 □ CNY 71–100 □ CNY 101–200 □More
9. The level of satisfaction at the park?
□ Quite satisfactory □ Relatively satisfactory □ satisfactory □ Relatively unsatisfactory □ Quite unsatisfactory
10. Willingness to pay for the park experience?
□ CNY 0 □ CNY 1–100 □ CNY 101–500 □ CNY 501–1000 □ More
11. Gender and age
□ Male □ Female □ <18 □ 18–25 □ 26–45 □ 46–60 □ >60
12. Level of education
□ Junior high school and below □ high school or vocational school □ college degree □ graduate degree
13. Monthly income level
□ ≤CNY 1000 □ CNY 1001–2000 □ CNY 2001–3000 □ CNY 3001–4000 □ CNY 4001–5000 □ CNY 4001–5000 □ CNY 5001–8000 □ More

References

  1. Guan, J.; Wang, R.; Van Berkel, D.; Liang, Z. How spatial patterns affect urban green space equity at different equity levels: A Bayesian quantile regression approach. Landsc. Urban Plan. 2023, 233, 104709. [Google Scholar] [CrossRef]
  2. Pinto, L.V.; Inácio, M.; Ferreira, C.S.S.; Ferreira, A.D.; Pereira, P. Ecosystem services and well-being dimensions related to urban green spaces—A systematic review. Sustain. Cities Soc. 2022, 85, 104072. [Google Scholar] [CrossRef]
  3. Muluneh, M.G.; Worku, B.B. Contributions of urban green spaces for climate change mitigation and biodiversity conservation in Dessie city, Northeastern Ethiopia. Urban Clim. 2022, 46, 101294. [Google Scholar] [CrossRef]
  4. Zhu, X.; Cheng, X.; Zhang, B.; Mihalko, C. A user-feedback indicator framework to understand cultural ecosystem services of urban green space. Ecol. Indic. 2023, 154, 110642. [Google Scholar] [CrossRef]
  5. Buchel, S.; Frantzeskaki, N. Citizens’ voice: A case study about perceived ecosystem services by urban park users in Rotterdam, the Netherlands. Ecosyst. Serv. 2015, 12, 169–177. [Google Scholar] [CrossRef]
  6. Khotdee, M.; Singhirunnusorn, W.; Sahachaisaeree, N. Effects of Green Open Space on Social Health and Behaviour of Urban Residents: A Case Study of Communities in Bangkok. Procedia Soc. Behav. Sci. 2012, 36, 449–455. [Google Scholar] [CrossRef]
  7. Wolch, J.R.; Byrne, J.; Newell, J.P. Urban green space, public health, and environmental justice: The challenge of making cities ‘just green enough’. Landsc. Urban Plan. 2014, 125, 234–244. [Google Scholar] [CrossRef]
  8. Xing, L.; Liu, Y.; Wang, B.; Wang, Y.; Liu, H. An environmental justice study on spatial access to parks for youth by using an improved 2SFCA method in Wuhan, China. Cities 2020, 96, 102405. [Google Scholar] [CrossRef]
  9. Xiao, Y.; Wang, Z.; Li, Z.G.; Tang, Z.L. An assessment of urban park access in Shanghai—Implications for the social equity in urban China. Landsc. Urban Plan. 2017, 157, 383–393. [Google Scholar] [CrossRef]
  10. Grant, A.; Millward, A.A.; Edge, S.; Roman, L.A.; Teelucksingh, C. Where is environmental justice? A review of US urban forest management plans. Urban For. Urban Green. 2022, 77, 127737. [Google Scholar] [CrossRef]
  11. Gebeyehu, B.; Adugna, B.; Gammie, T.; Simane, B.; Mekuriaw, A. Environmental Justice and Sustainable Development. In Encyclopedia of Sustainability in Higher Education; Leal Filho, W., Ed.; Springer International Publishing: Cham, Switzerland, 2019; pp. 1–9. [Google Scholar]
  12. Liu, D.; Kwan, M.-P.; Kan, Z. Analysis of urban green space accessibility and distribution inequity in the City of Chicago. Urban For. Urban Green. 2021, 59, 127029. [Google Scholar] [CrossRef]
  13. Jung, E. Green spaces for whom? A latent profile analysis of park-rich or -deprived neighborhoods in New York City. Landsc. Urban Plan. 2023, 237, 104806. [Google Scholar] [CrossRef]
  14. Zhai, T.; Wang, J.; Jin, Z.; Qi, Y.; Fang, Y.; Liu, J. Did improvements of ecosystem services supply-demand imbalance change environmental spatial injustices? Ecol. Indic. 2020, 111, 106068. [Google Scholar] [CrossRef]
  15. Amaral, M.H.; Benites-Lazaro, L.L.; Antonio de Almeida Sinisgalli, P.; Prates da Fonseca Alves, H.; Giatti, L.L. Environmental injustices on green and blue infrastructure: Urban nexus in a macrometropolitan territory. J. Clean. Prod. 2021, 289, 125829. [Google Scholar] [CrossRef]
  16. Kronenberg, J.; Haase, A.; Łaszkiewicz, E.; Antal, A.; Baravikova, A.; Biernacka, M.; Dushkova, D.; Filčak, R.; Haase, D.; Ignatieva, M.; et al. Environmental justice in the context of urban green space availability, accessibility, and attractiveness in postsocialist cities. Cities 2020, 106, 102862. [Google Scholar] [CrossRef]
  17. Ghasemi, K.; Behzadfar, M.; Borhani, K.; Nouri, Z. Geographic information system based combined compromise solution (CoCoSo) method for exploring the spatial justice of accessing urban green spaces, a comparative study of district 22 of Tehran. Ecol. Indic. 2022, 144, 109455. [Google Scholar] [CrossRef]
  18. Black, J.; Conroy, M. Accessibility Measures and the Social Evaluation of Urban Structure. Environ. Plan. A Econ. Space 1977, 9, 1013–1031. [Google Scholar] [CrossRef]
  19. Handy, S.L. Regional Versus Local Accessibility: Implications for Nonwork Travel. Transp. Res. Rec. 1993, 1400, 58–66. [Google Scholar]
  20. Handy, S.L.; Niemeier, D.A. Measuring Accessibility: An Exploration of Issues and Alternatives. Environ. Plan. A 1997, 29, 1175–1194. [Google Scholar] [CrossRef]
  21. Li, Z.; Fan, Z.; Song, Y.; Chai, Y. Assessing equity in park accessibility using a travel behavior-based G2SFCA method in Nanjing, China. J. Transp. Geogr. 2021, 96, 103179. [Google Scholar] [CrossRef]
  22. Zhang, F.; Li, D.; Ahrentzen, S.; Zhang, J. Assessing spatial disparities of accessibility to community-based service resources for Chinese older adults based on travel behavior: A city-wide study of Nanjing, China. Habitat Int. 2019, 88, 101984. [Google Scholar] [CrossRef]
  23. Páez, A.; Scott, D.M.; Morency, C. Measuring accessibility: Positive and normative implementations of various accessibility indicators. J. Transp. Geogr. 2012, 25, 141–153. [Google Scholar] [CrossRef]
  24. Pei, X.R.; Guo, P.; Chen, Q.Y.; Li, J.R.; Liu, Z.F.; Sun, Y.L.; Zhang, X.K. An Improved Multi-Mode Two-Step Floating Catchment Area Method for Measuring Accessibility of Urban Park in Tianjin, China. Sustainability 2022, 14, 11592. [Google Scholar] [CrossRef]
  25. Geurs, K.T.; van Wee, B. Accessibility evaluation of land-use and transport strategies: Review and research directions. J. Transp. Geogr. 2004, 12, 127–140. [Google Scholar] [CrossRef]
  26. Chen, Y.; Ge, Y.; Yang, G.; Wu, Z.; Du, Y.; Mao, F.; Liu, S.; Xu, R.; Qu, Z.; Xu, B.; et al. Inequalities of urban green space area and ecosystem services along urban center-edge gradients. Landsc. Urban Plan. 2022, 217, 104266. [Google Scholar] [CrossRef]
  27. Phillips, A.; Canters, F.; Khan, A.Z. Analyzing spatial inequalities in use and experience of urban green spaces. Urban For. Urban Green. 2022, 74, 127674. [Google Scholar] [CrossRef]
  28. Gupta, K.; Kumar, P.; Pathan, S.K.; Sharma, K.P. Urban Neighborhood Green Index—A measure of green spaces in urban areas. Landsc. Urban Plan. 2012, 105, 325–335. [Google Scholar] [CrossRef]
  29. Zhang, R.; Peng, S.; Sun, F.; Deng, L.; Che, Y. Assessing the social equity of urban parks: An improved index integrating multiple quality dimensions and service accessibility. Cities 2022, 129, 103839. [Google Scholar] [CrossRef]
  30. Wu, L.; Kim, S.K.; Lin, C. Socioeconomic groups and their green spaces availability in urban areas of China: A distributional justice perspective. Environ. Sci. Policy 2022, 131, 26–35. [Google Scholar] [CrossRef]
  31. Xiao, Y.; Wang, D.; Fang, J. Exploring the disparities in park access through mobile phone data: Evidence from Shanghai, China. Landsc. Urban Plan. 2019, 181, 80–91. [Google Scholar] [CrossRef]
  32. Chen, J.; Chang, Z. Rethinking urban green space accessibility: Evaluating and optimizing public transportation system through social network analysis in megacities. Landsc. Urban Plan. 2015, 143, 150–159. [Google Scholar] [CrossRef]
  33. Dony, C.C.; Delmelle, E.M.; Delmelle, E.C. Re-conceptualizing accessibility to parks in multi-modal cities: A Variable-width Floating Catchment Area (VFCA) method. Landsc. Urban Plan. 2015, 143, 90–99. [Google Scholar] [CrossRef]
  34. Nghiem, L.T.P.; Zhang, Y.; Oh, R.R.Y.; Chang, C.-c.; Tan, C.L.Y.; Shannahan, D.F.; Lin, B.B.; Gaston, K.J.; Fuller, R.A.; Carrasco, L.R. Equity in green and blue spaces availability in Singapore. Landsc. Urban Plan. 2021, 210, 104083. [Google Scholar] [CrossRef]
  35. Li, Q.; Peng, K.; Cheng, P. Community-Level Urban Green Space Equity Evaluation Based on Spatial Design Network Analysis (sDNA): A Case Study of Central Wuhan, China. Int. J. Environ. Res. Public Health 2021, 18, 10174. [Google Scholar] [CrossRef]
  36. Tannous, H.O.; Major, M.D.; Furlan, R. Accessibility of green spaces in a metropolitan network using space syntax to objectively evaluate the spatial locations of parks and promenades in Doha, State of Qatar. Urban For. Urban Green. 2021, 58, 126892. [Google Scholar] [CrossRef]
  37. Wu, J.; Peng, Y.; Liu, P.; Weng, Y.; Lin, J. Is the green inequality overestimated? Quality reevaluation of green space accessibility. Cities 2022, 130, 103871. [Google Scholar] [CrossRef]
  38. Hu, S.; Song, W.; Li, C.; Lu, J. A multi-mode Gaussian-based two-step floating catchment area method for measuring accessibility of urban parks. Cities 2020, 105, 102815. [Google Scholar] [CrossRef]
  39. Wu, J.; Chen, H.; Wang, H.; He, Q.; Zhou, K. Will the opening community policy improve the equity of green accessibility and in what ways?—Response based on a 2-step floating catchment area method and genetic algorithm. J. Clean. Prod. 2020, 263, 121454. [Google Scholar]
  40. Boyce, J.K.; Zwickl, K.; Ash, M. Measuring environmental inequality. Ecol. Econ. 2016, 124, 114–123. [Google Scholar] [CrossRef]
  41. Shu, H.; Xiong, P. The Gini coefficient structure and its application for the evaluation of regional balance development in China. J. Clean. Prod. 2018, 199, 668–686. [Google Scholar] [CrossRef]
  42. Dai, D. Racial/ethnic and socioeconomic disparities in urban green space accessibility: Where to intervene? Landsc. Urban Plan. 2011, 102, 234–244. [Google Scholar] [CrossRef]
  43. Dai, D. Black residential segregation, disparities in spatial access to health care facilities, and late-stage breast cancer diagnosis in metropolitan Detroit. Health Place 2010, 16, 1038–1052. [Google Scholar] [CrossRef] [PubMed]
  44. Castro, C.V. Optimizing nature-based solutions by combining social equity, hydro-environmental performance, and economic costs through a novel Gini coefficient. J. Hydrol. X 2022, 16, 100127. [Google Scholar] [CrossRef]
  45. Qingdao Municipal Statistics Bureau, National Bureau of Statistics of China. Statistical Communiqué of Qingdao on the 2021 National Economic and Social Development. 2021. Available online: http://qdsq.qingdao.gov.cn/ (accessed on 10 May 2022).
  46. CJJ/T85-2017; Standard for Classification of Urban Green Space. China Construction Industry Press: Beijing, China, 2017.
  47. Li, X.; Huang, Y.; Ma, X. Evaluation of the accessible urban public green space at the community-scale with the consideration of temporal accessibility and quality. Ecol. Indic. 2021, 131, 108231. [Google Scholar] [CrossRef]
  48. Tu, X.; Huang, G.; Wu, J.; Guo, X. How do travel distance and park size influence urban park visits? Urban For. Urban Green. 2020, 52, 126689. [Google Scholar] [CrossRef]
  49. Gong, F.-Y. Modeling walking accessibility to urban parks using Google Maps crowdsourcing database in the high-density urban environments of Hong Kong. Sci. Rep. 2023, 13, 20798. [Google Scholar] [CrossRef]
  50. Zhang, J.; Yu, Z.; Cheng, Y.; Chen, C.; Wan, Y.; Zhao, B.; Vejre, H. Evaluating the disparities in urban green space provision in communities with diverse built environments: The case of a rapidly urbanizing Chinese city. Build. Environ. 2020, 183, 107170. [Google Scholar] [CrossRef]
  51. Ode Sang, Å.; Knez, I.; Gunnarsson, B.; Hedblom, M. The effects of naturalness, gender, and age on how urban green space is perceived and used. Urban For. Urban Green. 2016, 18, 268–276. [Google Scholar] [CrossRef]
  52. Yang, W.; Yang, R.; Zhou, S. The spatial heterogeneity of urban green space inequity from a perspective of the vulnerable: A case study of Guangzhou, China. Cities 2022, 130, 103855. [Google Scholar] [CrossRef]
Figure 1. Location of the study area and its street blocks.
Sustainability 16 01428 g001
Figure 2. Distribution of (a) road network, bus stop, subway stations, (b) park green space, and population.
Sustainability 16 01428 g002
Figure 3. Spatial pattern of accessibility of residential patches under multiple travel scenarios.
Sustainability 16 01428 g003
Figure 4. Spatial pattern of green space justice at street block scale under multi-travel scenarios.
Sustainability 16 01428 g004
Figure 5. District-level justice values (indicated by Gini coefficient) for the multi-travel scenarios. (a) The 15-min travel scenario; (b) the 30-min travel scenario.
Sustainability 16 01428 g005
Disclaimer/Publisher’s Note: The statements, opinions and data contained in all publications are solely those of the individual author(s) and contributor(s) and not of MDPI and/or the editor(s). MDPI and/or the editor(s) disclaim responsibility for any injury to people or property resulting from any ideas, methods, instructions or products referred to in the content.

