Article

Soil CO2 and CH4 Dynamics and Their Relationships with Soil Nutrients, Enzyme Activity, and Root Biomass during Winter Wheat Growth under Shallow Groundwater

1
School of Grassland Science, Beijing Forestry University, Beijing 100083, China
2
College of Water Resources and Civil Engineering, China Agricultural University, Beijing 100083, China
3
Institute of Plant Protection, Inner Mongolia Academy of Agriculture and Animal Husbandry Sciences, Hohhot 010031, China
4
Farmland Irrigation Research Institute, Chinese Academy of Agricultural Sciences, Xinxiang 453003, China
5
College of Agriculture, Yangtze University, Jingzhou 434025, China
*
Author to whom correspondence should be addressed.
Sustainability 2024, 16(4), 1396; https://doi.org/10.3390/su16041396
Submission received: 8 December 2023 / Revised: 24 January 2024 / Accepted: 2 February 2024 / Published: 7 February 2024
(This article belongs to the Special Issue BRICS Soil Management for Sustainable Agriculture)

Abstract

:
Soil CO2 and CH4 concentrations are crucial determinants of crop physiology and the soil environment. However, the intricate relationships among soil respiration, soil nutrients, enzyme activities, and winter wheat growth in the presence of shallow groundwater remain enigmatic. This study aimed to investigate the dynamics of soil CO2 and CH4 concentrations and their correlations with soil nutrient content, enzymatic activities, and wheat root biomass to better understand the influence of shallow groundwater on soil environmental conditions. Lysimeter experiments were conducted at five groundwater depths (20, 40, 50, 60, and 80 cm) and three fertilizer application rates (low, 75%; normal, 100%; high, 125%). Soil CO2 (soil layer > 10 cm) and CH4 concentrations significantly decreased with increasing groundwater depth. The maximum values of root parameters and shoot biomass were mainly concentrated at 50–60 cm at the high fertilization level (except root length density, which was higher at the normal fertilization level), and were 0.36–77.4% higher than other treatments. Soil CO2 concentration showed positive correlations with organic matter and total N content, enzyme activities, and root biomass. Soil CH4 concentration had significant correlations with soil organic matter, total N, and available K. Compared to the fertilization level, groundwater depth emerged as a crucial factor as it affected soil physicochemical properties, soil enzymatic activities, root respiration, and winter wheat growth in shallow groundwater.

1. Introduction

The soil carbon pool is the largest natural terrestrial carbon resource and is closely related to soil fertility and environmental quality [1,2,3,4]. Soil respiration is the primary output of the soil carbon pool [5,6], and it releases approximately 98 ± 12 Pg C annually [7]. Soil respiration includes root respiration and microbial respiration (root and mycorrhizosphere respiration, surface litter, organic matter decomposition, and so on [8,9]). Microbial respiration represents the microbial decomposition and transformation rate [4,5], whereas root respiration represents the root metabolism rate that is affected by photosynthesis, plant phenology, root biomass, carbohydrate content in plant shoots, and net primary production, etc. [8,10]. The C accumulation and C recycling in the soil are directly dependent on photosynthesis, as photosynthates are the primary source of carbohydrates for root respiration or microbial respiration in root exudates [10]. Root biomass is a crucial C source in the soil. High root biomass is often associated with high root respiratory activity [11], and it provides a high amount of substrate for microbial decomposition [12]. Briefly, soil respiration is influenced by such factors as crop growth (root growth, photosynthetic efficiency, dry matter accumulation, etc.) and soil environment (microbial activity, enzyme activity, nutrient content, etc.), and these factors in turn are significantly affected by soil water status and fertilizer application [8,13,14].
Soil moisture tends to be high in areas at the shallow groundwater [15], and it directly or indirectly affects soil respiration. In heterotrophic respiration, CO2 and CH4 are the primary metabolites produced due to aerobic and anaerobic microbial decomposition, respectively [16]. A high level of soil water content leads to waterlogging and reduces oxygen supply in soil [2], which inhibits aerobic microbial activity and enhances anaerobic microbial activity [17]. Thus, CH4 is replaced by CO2 as the primary metabolite in soil. In autotrophic respiration, reduced O2 supply to roots hampers root respiration and root growth by decreasing ATP (adenosine triphosphate) production, energy-dependent nutrient uptake and nutrient transport [18]. Indirect effects of soil moisture are due to anaerobic conditions resulting from high groundwater level. As demonstrated in a previous report, anaerobic conditions retard secretion of soil enzymes, such as urease and phosphatase, etc., by soil microbes and root cells [19]. Regardless of soil temperature, decreased secretion of enzymes reduces enzymatic activity, which results in slower cycling of soil nutrients and CO2 production rate than aerated soil [15,20]. Overall, shallow groundwater profoundly impacts soil respiration.
Fertilizer application regulates soil respiration by altering soil nutrient content and enzymatic activities. Chemical fertilizer application influences soil respiration by increasing NPK availability, growth of crop roots, and microbial populations in the soil [21]. Xue et al. [22] showed that N (urea) and P (chemical fertilizer) increased the density, surface area, and dry biomass weight of crop roots, as N and P play crucial roles in the allocation of photosynthates in shoots and roots. Subsequently, higher root abundance and activity lead to higher soil CO2 emission [3,23]. The application of urea and ammonium fertilizers increases the microbial activity, which leads to an increased SOC decomposition, as ammonium is the preferred nitrogen source for soil microbes [24,25]. Also, chemical fertilizer inducing augmentation in root and microbial biomass increases the secretion of soil enzymes [26,27]. Enhanced soil enzymatic activity effectively stimulates the recycling of soil nutrients and promotes the growth of soil root and microbes [26,27,28], then improves the intensity of soil respiration. In general, an appropriate fertilizer application rate is crucial in regulating soil environmental conditions for crop root and microbial growth, which are closely related to soil respiration.
Compared to fertilization level, soil moisture in areas with shallow groundwater appears to have greater effects on soil nutrient cycling and gas emission [15,21]. Shallow groundwater can easily cause waterlogging, which affects 10–15 Mha of the world’s wheat-growing areas by altering the soil environmental conditions, such as physical, biological, and chemical properties, associated with the crop roots and microbial growth, and soil biochemical reactions, resulting in the deterioration of the soil nutrient cycle and crop growth [2,17,29]. It is a well-known fact that appropriate drainage and fertilizer application decrease waterlogging and improve soil environmental conditions. However, the complex correlations among groundwater level, fertilization level, root growth, enzymatic activity, and soil respiration and their interaction mechanisms in shallow-groundwater soil remain ambiguous.
In this study, we hypothesized that soil CO2 and CH4 are influenced by groundwater depth and fertilization level through their regulation of soil moisture and nutrients, thereby impacting nutrient cycling and wheat root growth. Therefore, we aimed to (1) determine the effects of groundwater depth and fertilizer level on soil CO2 and CH4 concentrations in different stages of winter wheat growth under shallow groundwater and (2) investigate the correlations of soil CO2 and CH4 concentrations with soil nutrient content, enzymatic activity, and root biomass to better understand the influence of shallow groundwater on soil environmental conditions.

2. Materials and Methods

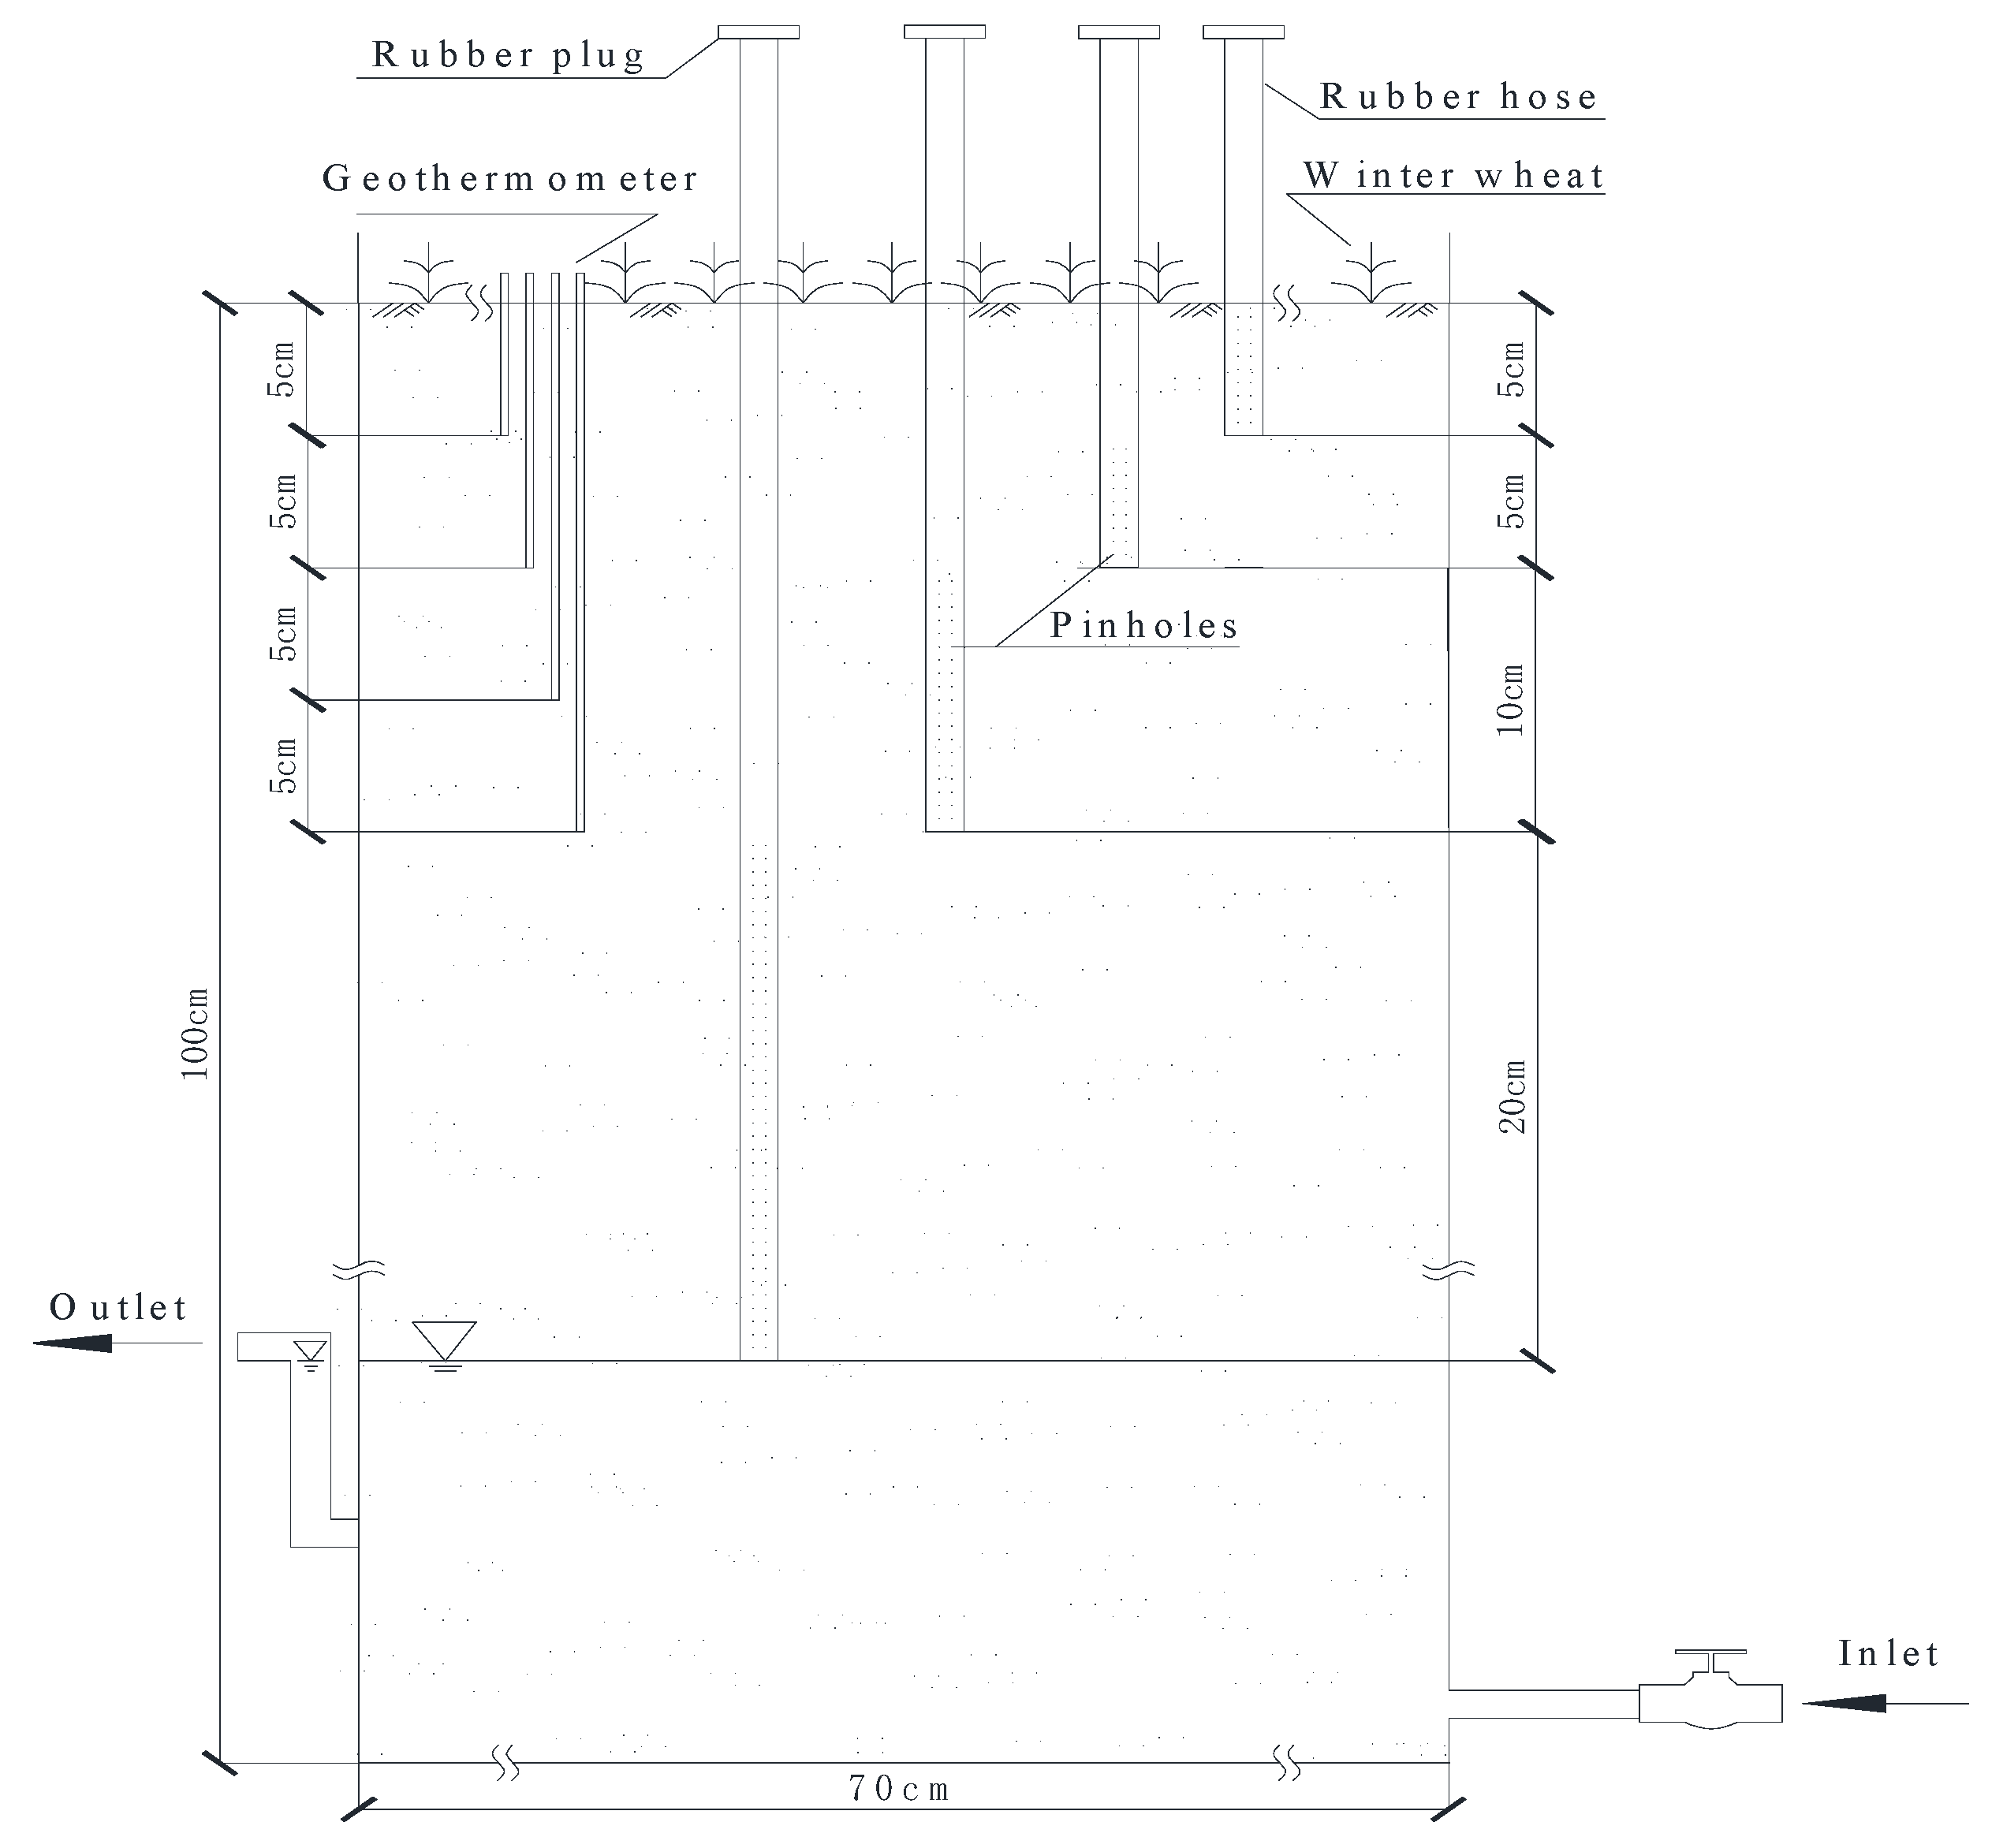
2.1. Experimental Site and Treatments

The experiment was performed at the Experimental Station of Yangtze University (latitude, 30°21′ N; longitude, 112°09′ E; elevation, 31.8 m above sea level) in Jingzhou, Hubei, China. It is a subtropical humid monsoon region with a rainy spring and summer with mean annual precipitation and air temperature of 1100 mm and 16.7 °C, respectively. The mean monthly rainfall increases from 29.6 mm in January to 159.9 mm in June. Groundwater depth in the experimental region is around 50 cm on average, total salinity in the groundwater is less than 1 g L−1, and pH is 6.7–8.9.
The experiments were conducted in micro-lysimeters that were 112 cm deep and 70 cm in diameter. The micro-lysimeters were evenly filled layer by layer with soil collected from a local farm field at a bulk density of 1.27 g cm−3. Micro-lysimeter groundwater level at depths of 20, 40, 50, 60, and 80 cm below the soil surface was automatically controlled by using water inlet and outlet apparatus (Figure 1). Soil-filled micro-lysimeters were employed to estimate the initial contents of organic matter, total N, available P, available K, and soil pH value (soil: water ratio of 1:2.5), which were found to be 8.63 g kg−1, 1.29 g kg−1, 16.90 mg kg−1, 153.76 mg kg−1, and 7.8, respectively. The soil is characterized as yellow-brown paddy soil, exhibiting a loamy texture with clay (0–2 μm) content of 22.0%, silt (2–50 μm) content of 75.0%, and sand (50–2000 μm) content of 3.0%.
The winter wheat (Triticum aestivum L.) variety used in this study is Zhengmai 9023, co-developed by the Wheat Research Institute of Henan Academy of Agricultural Sciences and Northwest A&F University. This wheat variety exhibits robust growth during winter and spring, demonstrates high temperature resistance in the late period, undergoes rapid filling, achieves excellent ripening, and yields approximately 4.85 t ha−1. It is well suited for cultivation in Hubei province. Winter wheat was sown on 28 October 2015 at a density of 210 plants m−2 and harvested on 4 May 2016. During the wheat growth period, compound fertilizer (total nutrient content ≥ 45%; N:P2O5:K2O in the ratio of 14:16:15) and urea (46% N) were applied at rates of 450 kg ha−1 and 150 kg ha−1, respectively, representing normal fertilization treatment (NF). All fertilizers were applied in a ratio of 7:1:2 before sowing, at seedling stage, and jointing stage, respectively. The rainfall and mean daily air temperature were 388 mm and 12.2 °C, respectively, in the winter wheat growth period during 2015–2016. As per the weather records (1952–2016), this region received normal rainfall throughout the year, with a drought index of 0.34 during the winter wheat growth period [15]. No supplementary irrigation was provided during the growth period of winter wheat.
Experimental treatments included five groundwater depths (20, 40, 50, 60, and 80 cm) and three fertilization application rates (low, normal, and high). The fertilizer application rates for the low and high fertilization levels were 75% (75% NF) and 125% (125% NF) of the standard fertilizer application rate (NF), respectively. All experimental treatments in the study were replicated three times.

2.2. Soil Nutrient Determination
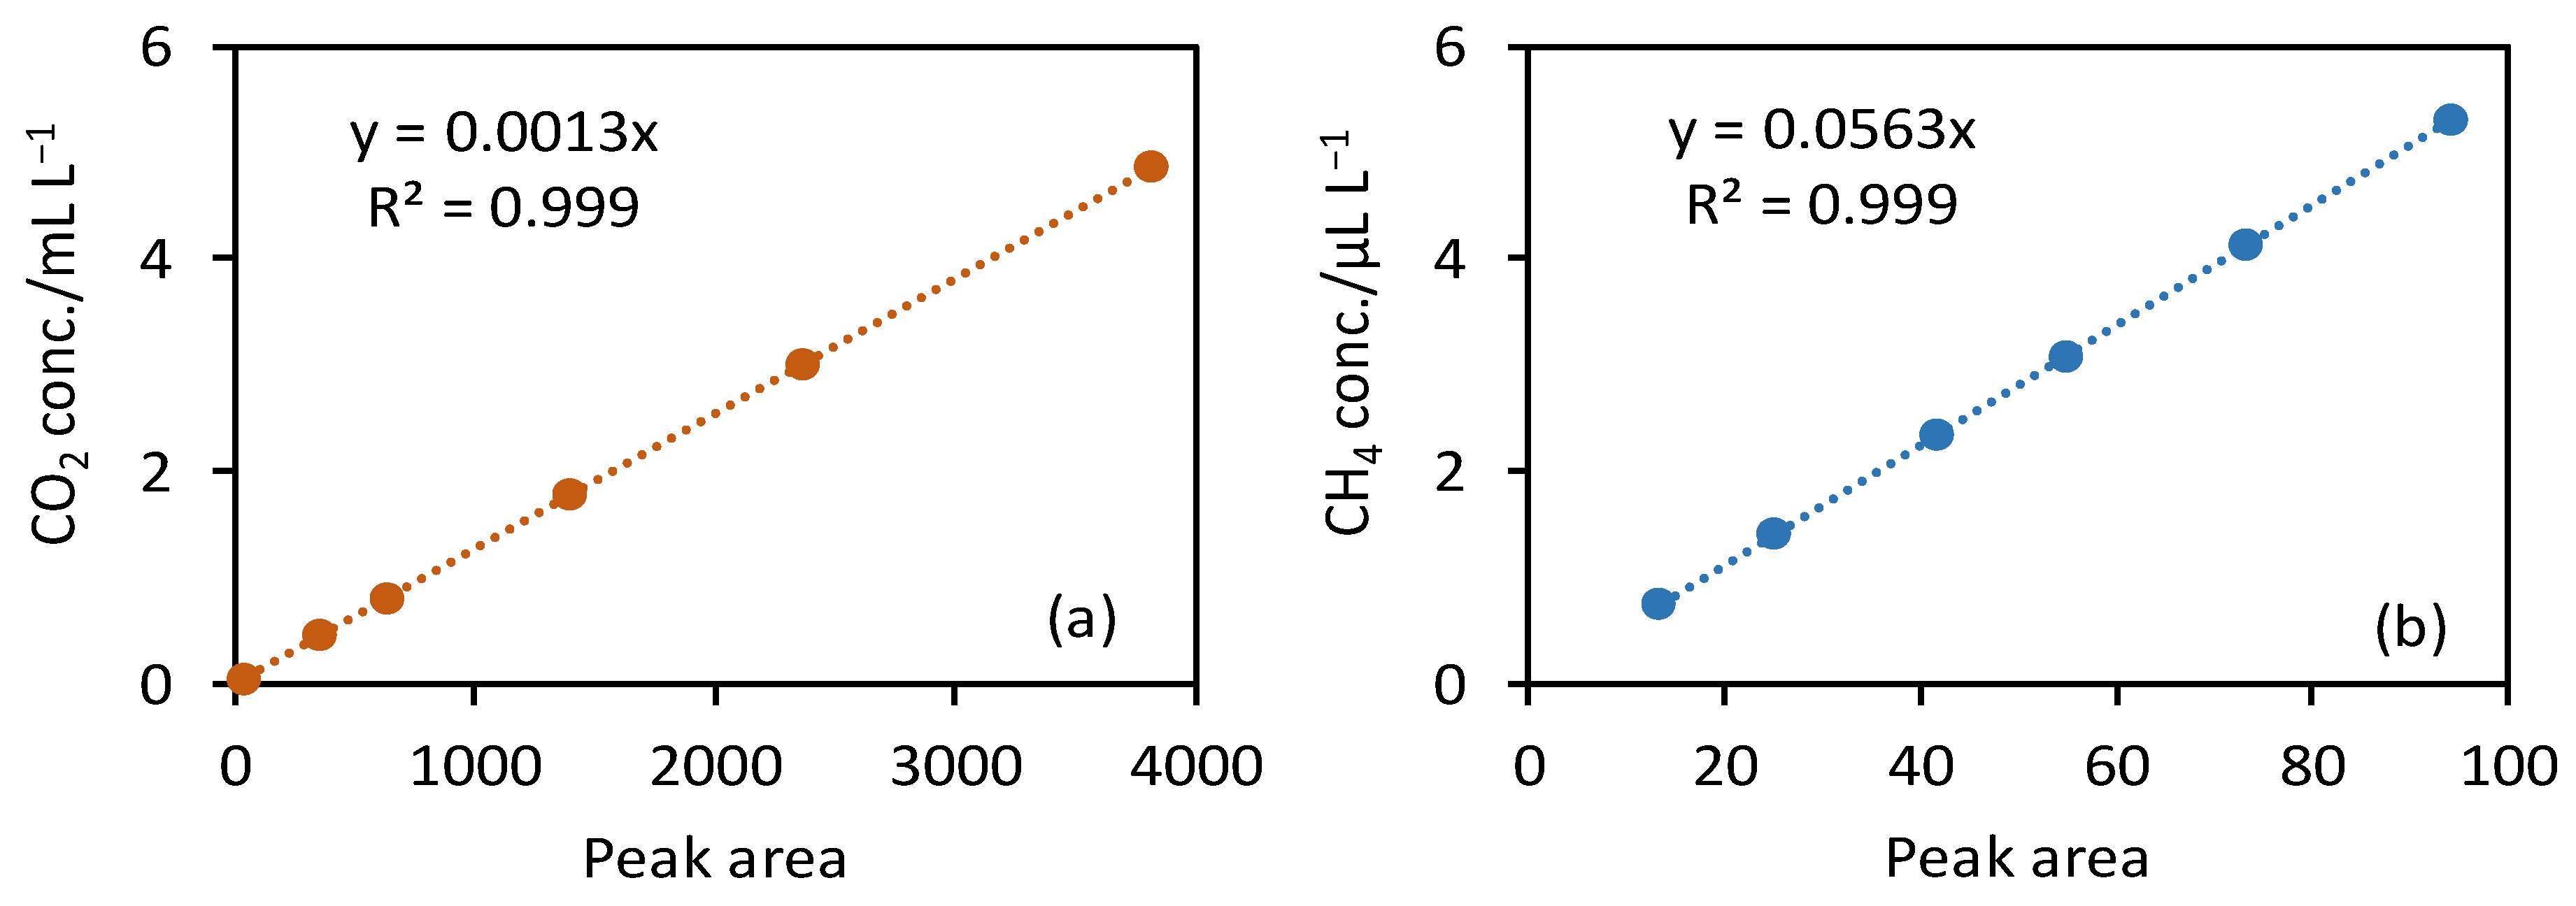
Geothermometers were used for measuring soil temperature at soil depths of 5, 10, 15, and 20 cm at 16:00 every day (Figure 1). The soil was sampled at depths of 0–10 and 10–20 cm during jointing (March), heading (April), and grain filling (May) stages of wheat growth. Soil water content, organic matter content, pH value and soil nutrient (N, P, and K) content were determined according to the methods of Bao [30], and the soil enzymatic activities (urease, alkaline phosphatase, sucrase) were assayed as per Guan’s methods [26]. To calculate soil water content, an electric oven set to 105 °C was used; for calculating soil organic matter content, titration-based wet combustion was used; and for calculating soil pH value in 1:2.5 soil water extract, a pH meter (FG3-ELK, Mettler-Toledo International Trading Co., Ltd., Shanghai, China) was used. Available P content was assayed spectrophotometrically (UV-5500PC Spectrophotometer, Shanghai Metash Instrument Co., Ltd., Shanghai, China); total N content was determined using an automatic Kjeldahl apparatus (K9840, Hanon Instrument, Jinan, China); and available K content was determined using a flame photometer (FP640, Shanghai INESA Scientific Instrument Co., Ltd., Shanghai, China). The released NH4+ was determined using 10% aqueous urea as substrate incubated at 37 °C for 24 h, and absorbance was measured spectrophotometrically at 578 nm wavelength. The urease activity is expressed as milligrams of NH4+-N (g soil 24 h)−1. For the determination of alkaline phosphatase activity, the disodium phenyl phosphate solution was used as a substrate and incubated at 37 °C for 24 h. The resulting phenol formation was determined spectrophotometrically at 600 nm wavelength, and alkaline phosphatase activity is expressed as milligrams of phenol (g soil 24 h)−1. For determination of sucrase activity, sucrose solution was used as the substrate and incubated at 37 °C for 24 h. After incubation, this solution was filtered, and the filtrate was boiled with 3 mL of 3,5-dinitrosalicylic acid (DNS) in a water bath for 5 min. The absorbance of the reducing sugar was measured at 508 nm wavelength, and sucrase activity is expressed as milligrams of glucose (g soil 24 h)−1.

2.3. Gas Collection

A syringe suction device was used to collect soil gas at soil depths of 0–5, 5–10, 10–20, and 20–40 cm. A rubber hose (4 mm inner radius and 1 mm-thick wall) with small pinholes was inserted into the abovementioned soil depths (Figure 1). The upper port of the hose was sealed with a rubber plug to prevent gas leakage after puncture. The soil gas was sucked from the hose using a needle and injected into a special vacuum bottle, which was put into a gas chromatograph (7890A, Agilent Technologies, Inc., Wilmington, NC, USA) to determine soil CO2 and CH4 concentrations. When measuring soil gas concentration, a 1/8-inch P.Q (80–100 meshes) column at 55 °C was used for gas separation. A flame ionization detector (FID) was used to analyze CH4 concentration, and the detector temperature was 200 °C. CO2 was reduced to CH4 using a nickel catalyst at 375 °C, then its concentration was determined as the method of measuring CH4 concentration. Highly pure (99.999%) nitrogen (flow rate 30 mL min−1), hydrogen (flow rate 50 mL min−1), and air (flow rate 450 mL min−1) were used as carrier gas, burning gas, and aiding gas for FID, respectively. The retention times for CO2 and CH4 were 1.4 min and 1.8 min, respectively, based on the chromatography. The calibration curves of CO2 and CH4 concentrations are shown in Figure 2. The concentrations of CO2 and CH4 are expressed as milliliters per liter and microliters per liter, respectively.

2.4. Plant Biometric Analysis

Plant height, tillering rate, and the number of leaves were calculated at various winter wheat growth stages. After harvesting, root traits were measured for the entire intact root system extracted from the micro-lysimeter and treated individually for each experimental replication. Cleaned fresh roots were scanned using Epson perfection V700 Photo (Epson America, Inc., Long Beach, CA, USA) and analyzed with WinRHIZO 2009 (Regent Instruments Inc., Quebec, QC, Canada), and root diameter and root length density were averaged and are expressed as millimeters and centimeters per cubic meter, respectively.

2.5. Statistical Analysis

One-way analysis of variance (ANOVA) was used to calculate significant differences between different treatments using SPSS version 21.0 (SPSS Inc., Chicago, IL, USA). A statistically significant ANOVA F-value was used to perform Tukey’s HSD test (significance level of p = 0.05) for the separation of the means. Simple linear regression and curve estimation were used to analyze the correlations between the soil CO2 and CH4 concentrations and soil water content, root biomass, soil nutrient contents, soil enzymatic activities. For Pearson correlation analysis, p ≤ 0.05 was considered as statistically significant.
The average values of soil CO2 and CH4 concentrations and soil water content, organic matter content, soil nutrient content, and soil enzymatic activities at 0–20 cm soil depth were used to analyze the correlations between soil CO2 and CH4 concentrations and the rest of the factors. The CO2 and CH4 concentrations at 0–40 cm soil depth were averaged and employed when wheat root biomass was involved in the establishment of correlations.

3. Results

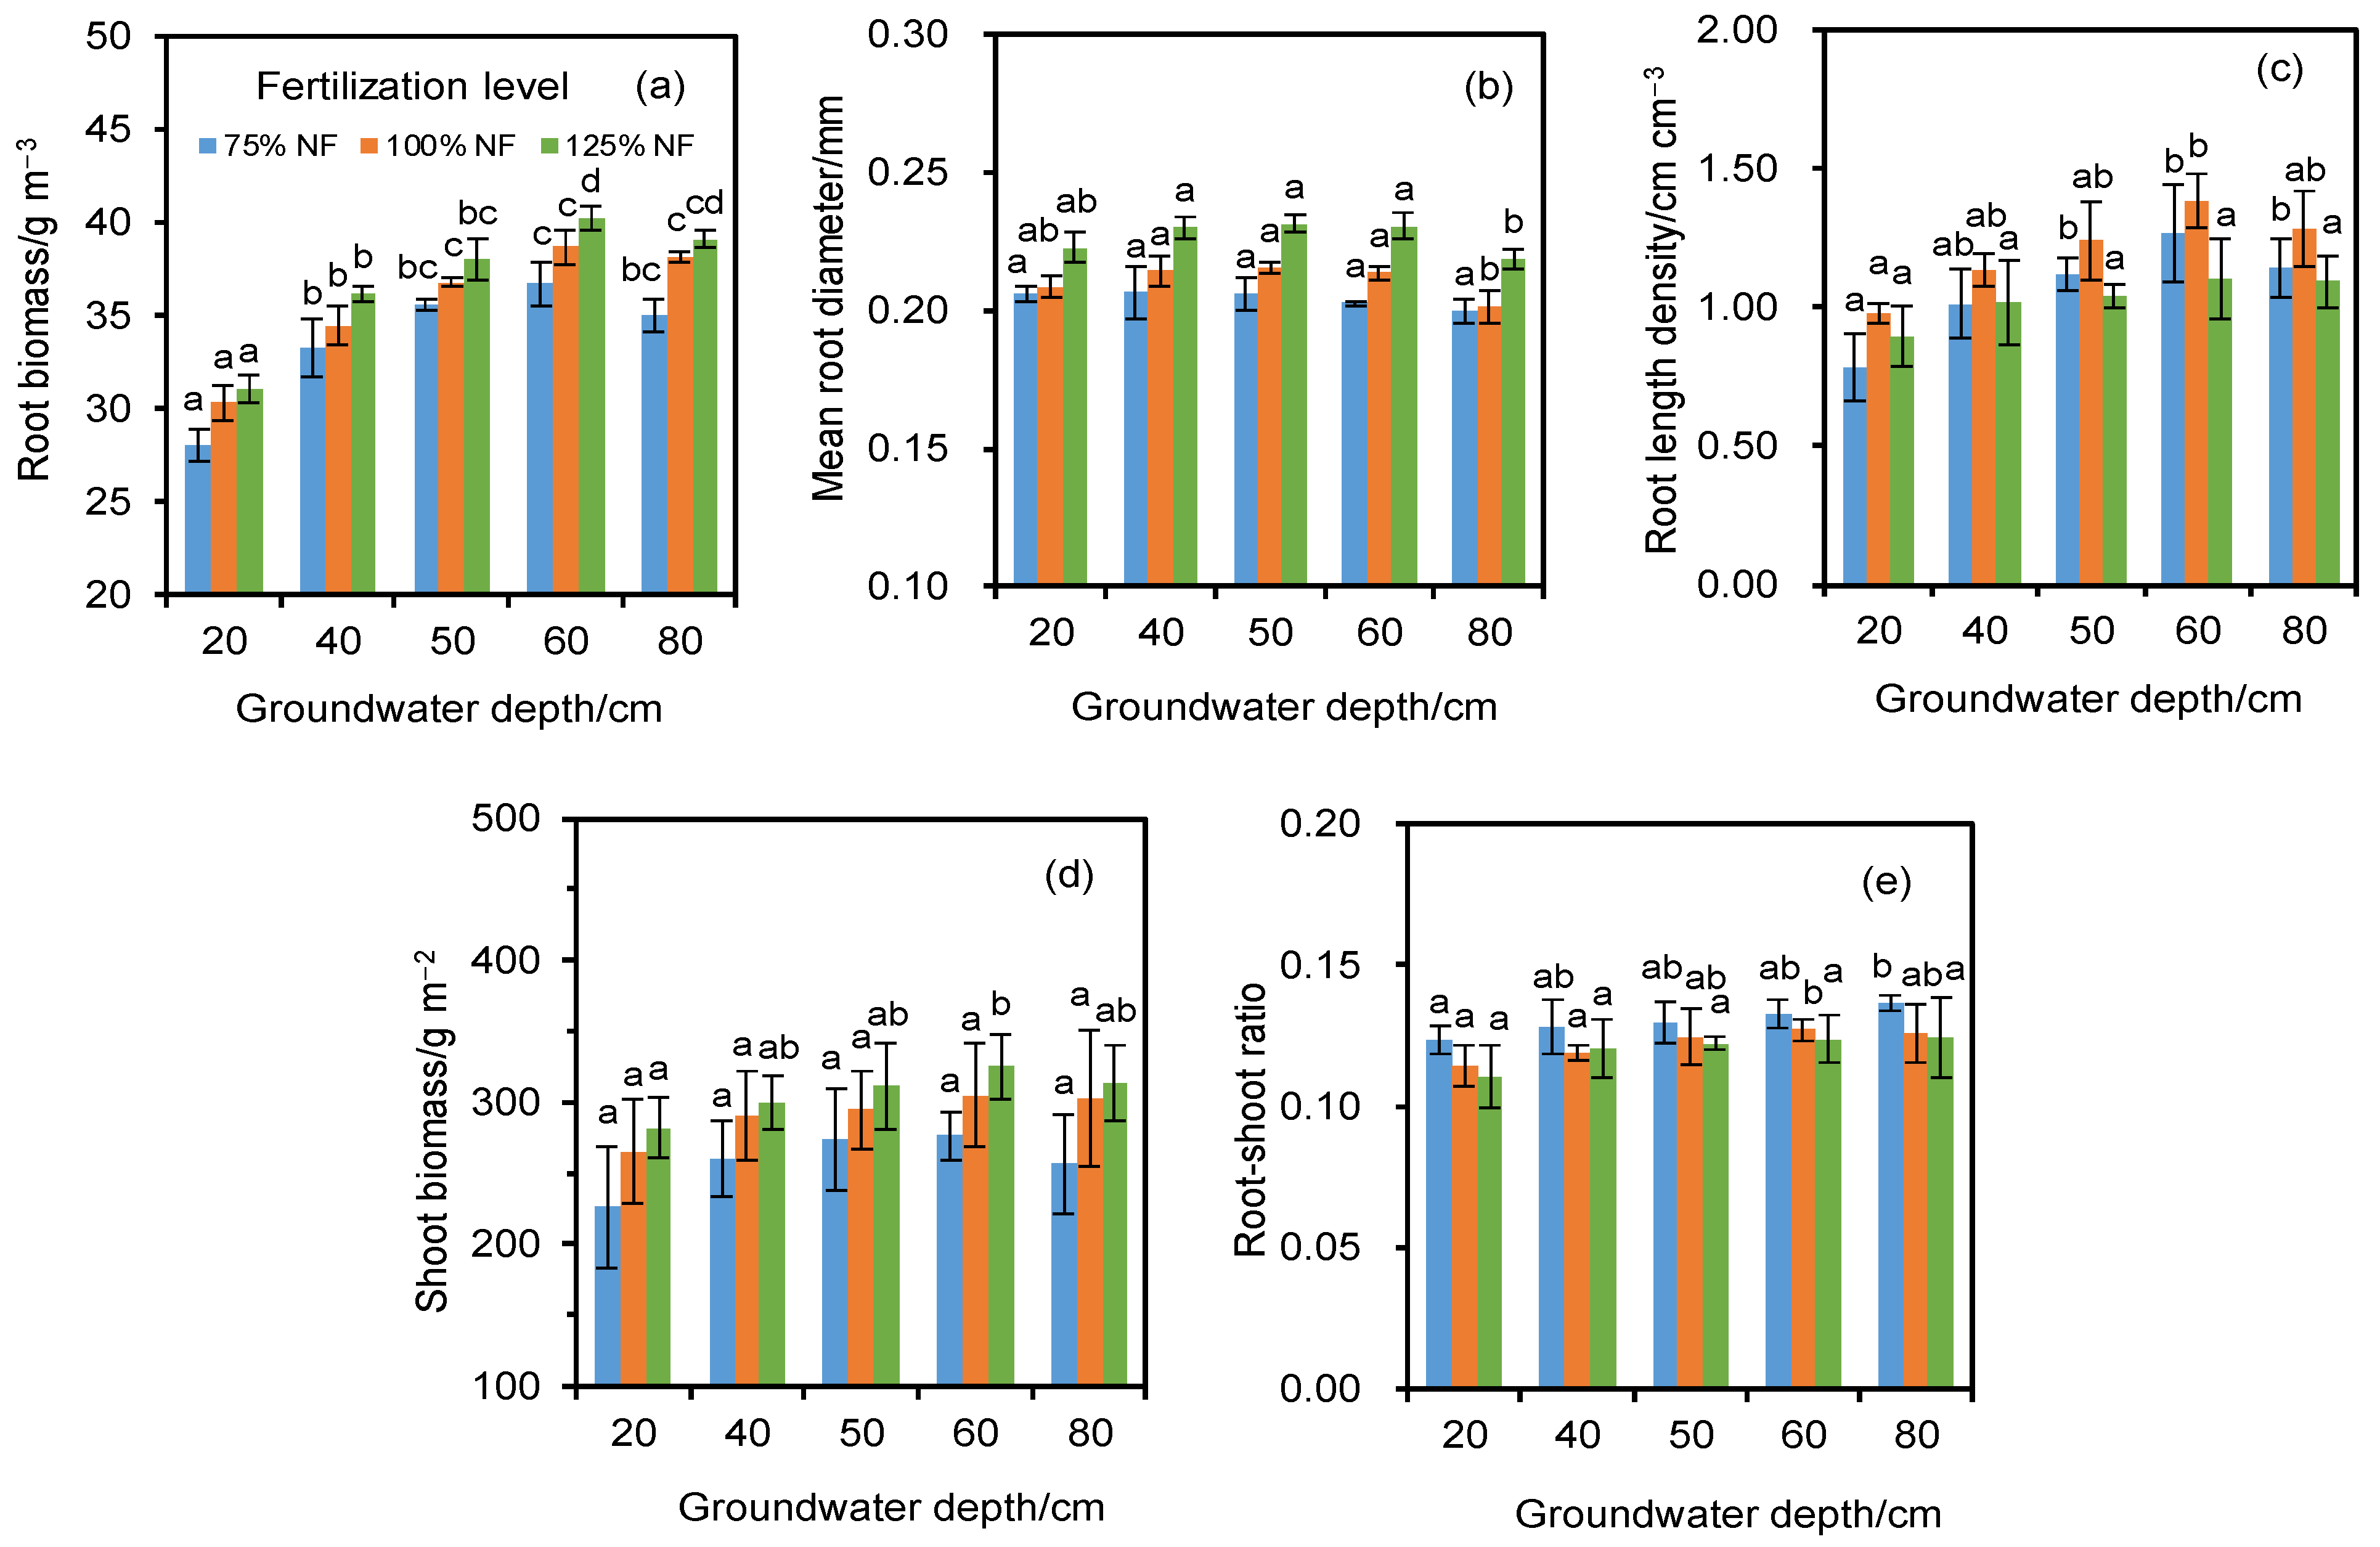
3.1. Root Parameters

As depicted in Figure 3a–c, total root biomass, mean root diameter, and root length density first increased and later decreased with increasing groundwater depth. The maximum values of root biomass and root length density were recorded at a groundwater depth of 60 cm, and maximum values of mean root diameter were recorded at a groundwater depth of about 50 cm (Figure 3a–c). This indicated that root diameter expansion was impacted more by the water shortage than root biomass accumulation and root extension. The root biomass and mean root diameter increased with increasing fertilization level (Figure 3a,b). Out of all the three fertilization levels tested, root length density at the normal fertilization level was 11.8–25.4% and 9.2–12.5% higher than in the high and low fertilization levels, respectively.

3.2. Shoot Biomass and Root:Shoot Ratio

Similar trends were observed in shoot and root biomass values affected by groundwater depth and fertilization level (Figure 3d). Shoot biomass increased with the declining groundwater level until the groundwater depth was 60 cm, and decreased with the further increase in groundwater depth (Figure 3d). A higher fertilization level led to higher shoot biomass (Figure 3d).
The root:shoot biomass ratio under low fertilization increased with the increasing groundwater depth (Figure 3e). Under normal and high fertilization levels, the root:shoot biomass ratio increased with groundwater depth till groundwater depth reached 60 cm; however, the root:shoot biomass ratio exhibited an inverse trend at groundwater depth > 60 cm (Figure 3e). This suggested that the groundwater level (>60 cm) impacted root growth more than shoot growth in wheat plants (Figure 3e). The root:shoot biomass ratio decreased with increasing soil fertilization (Figure 3e).

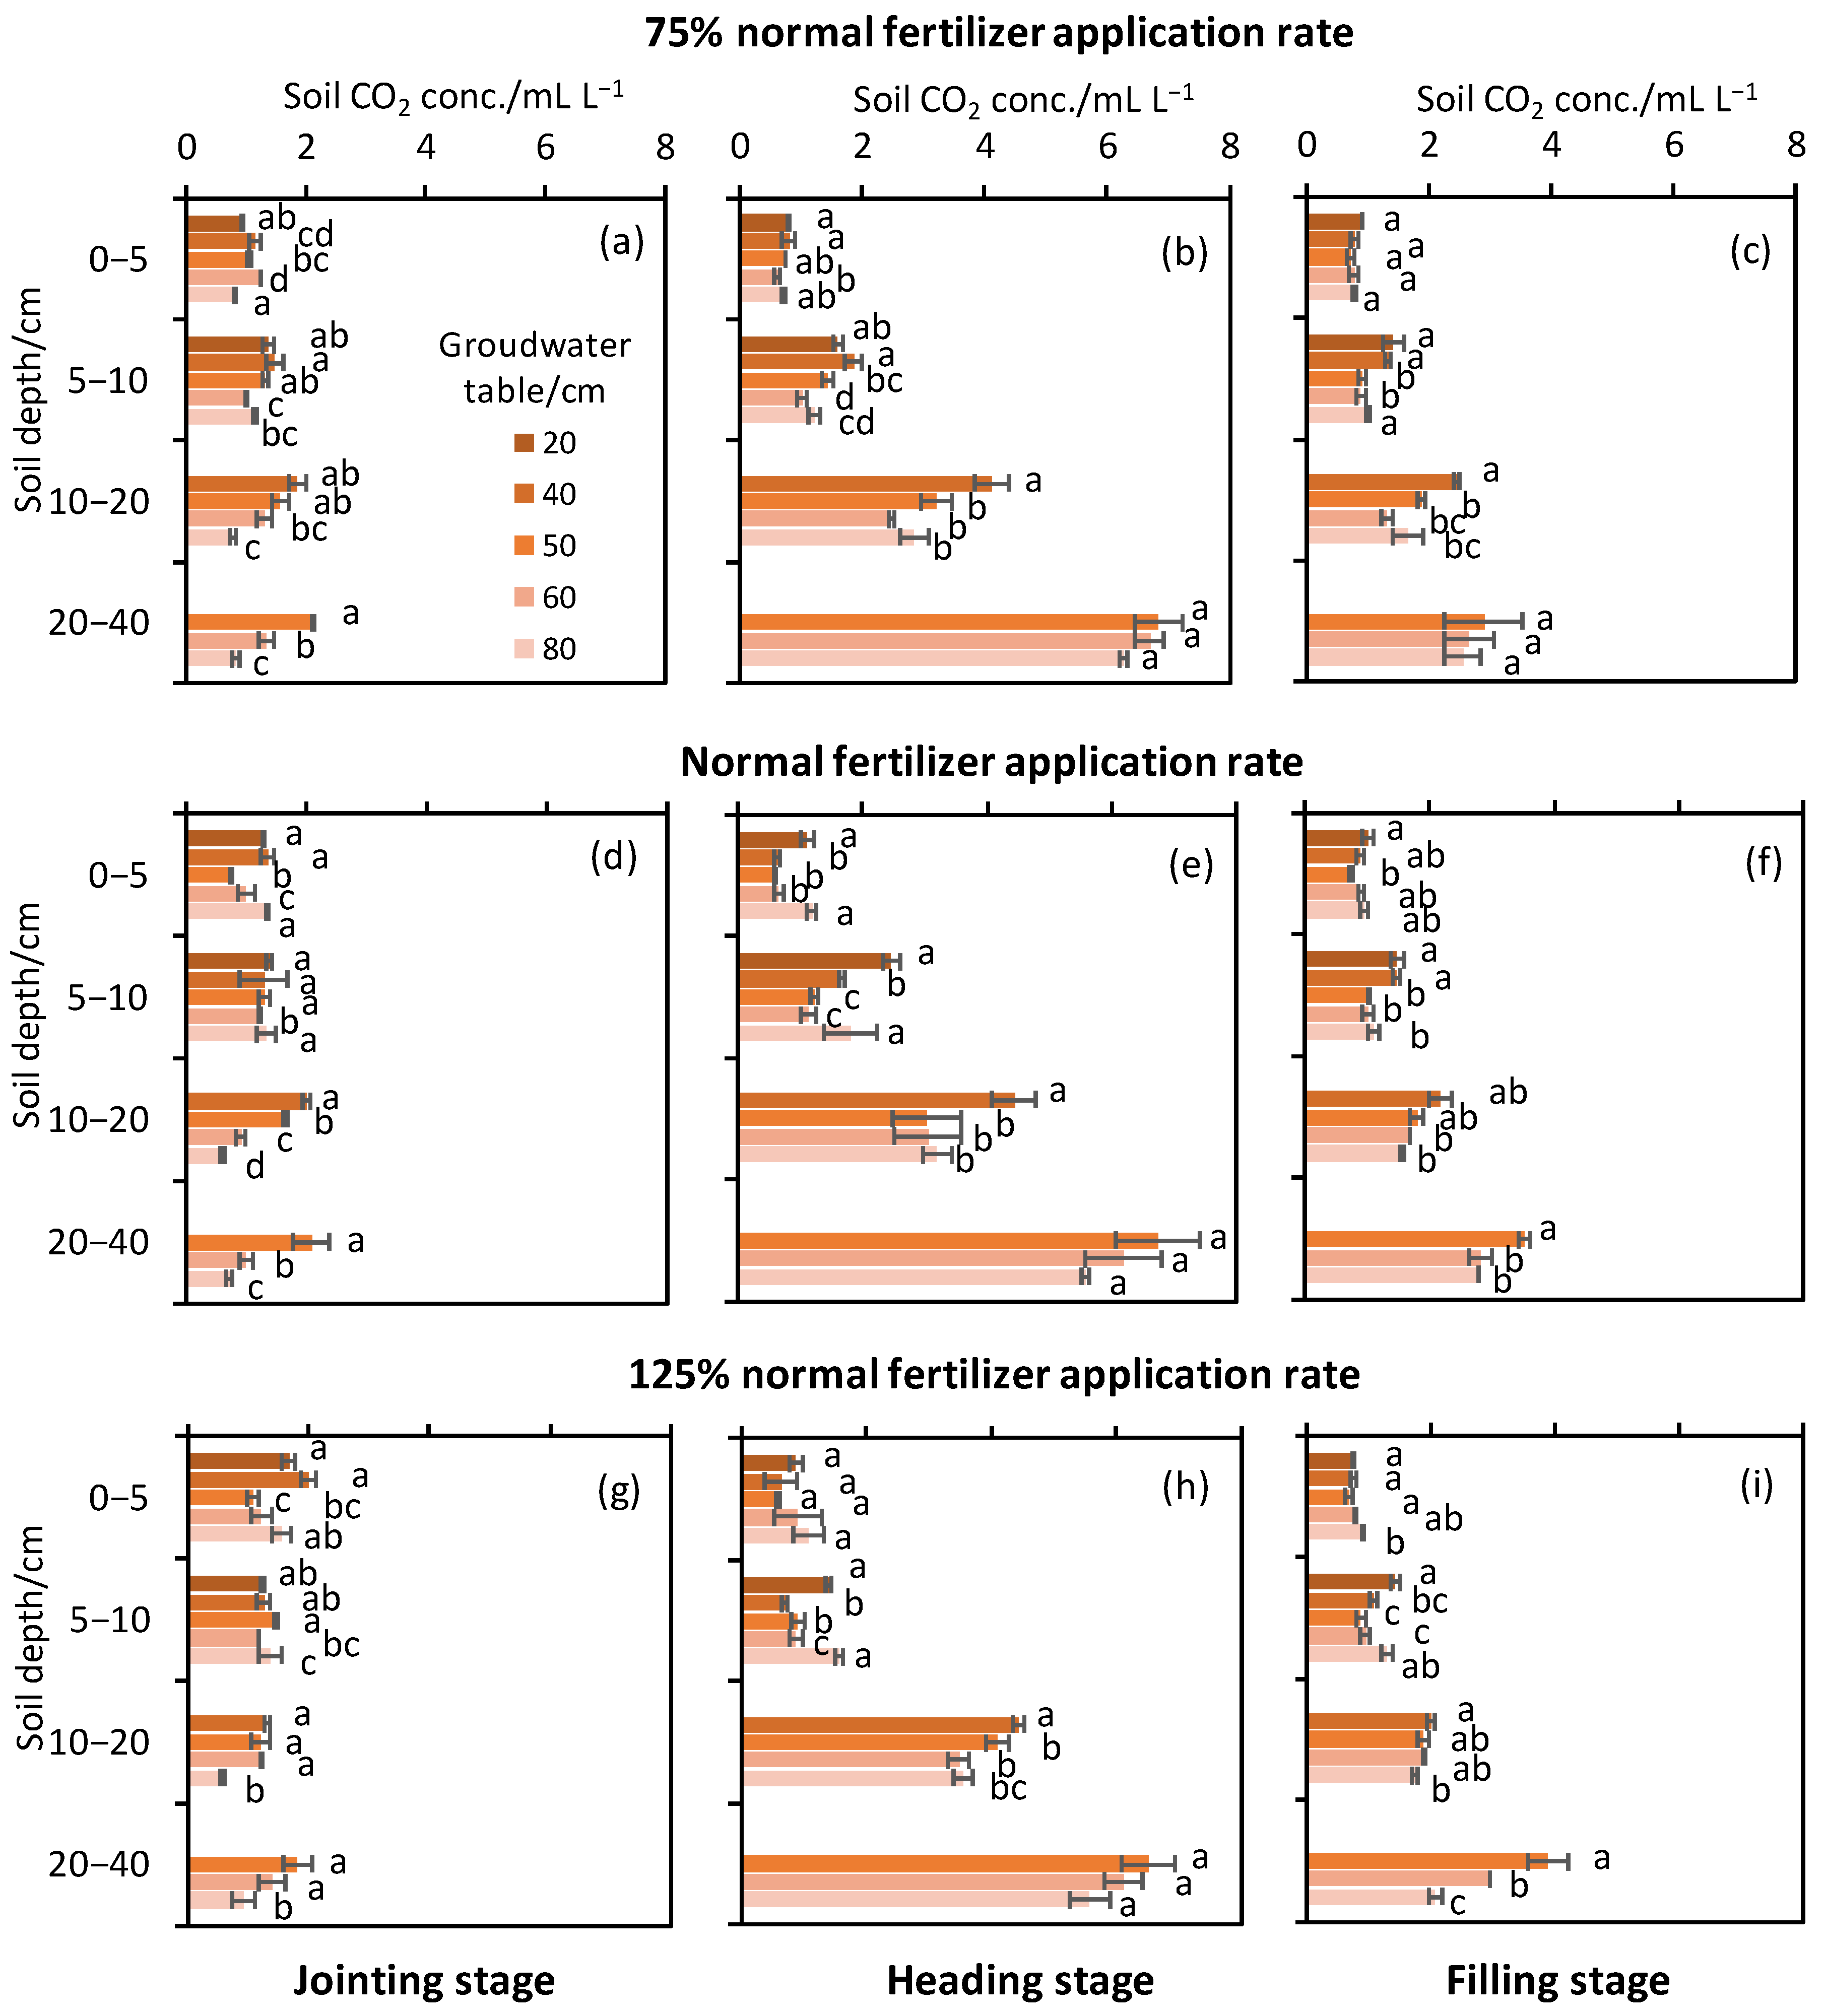
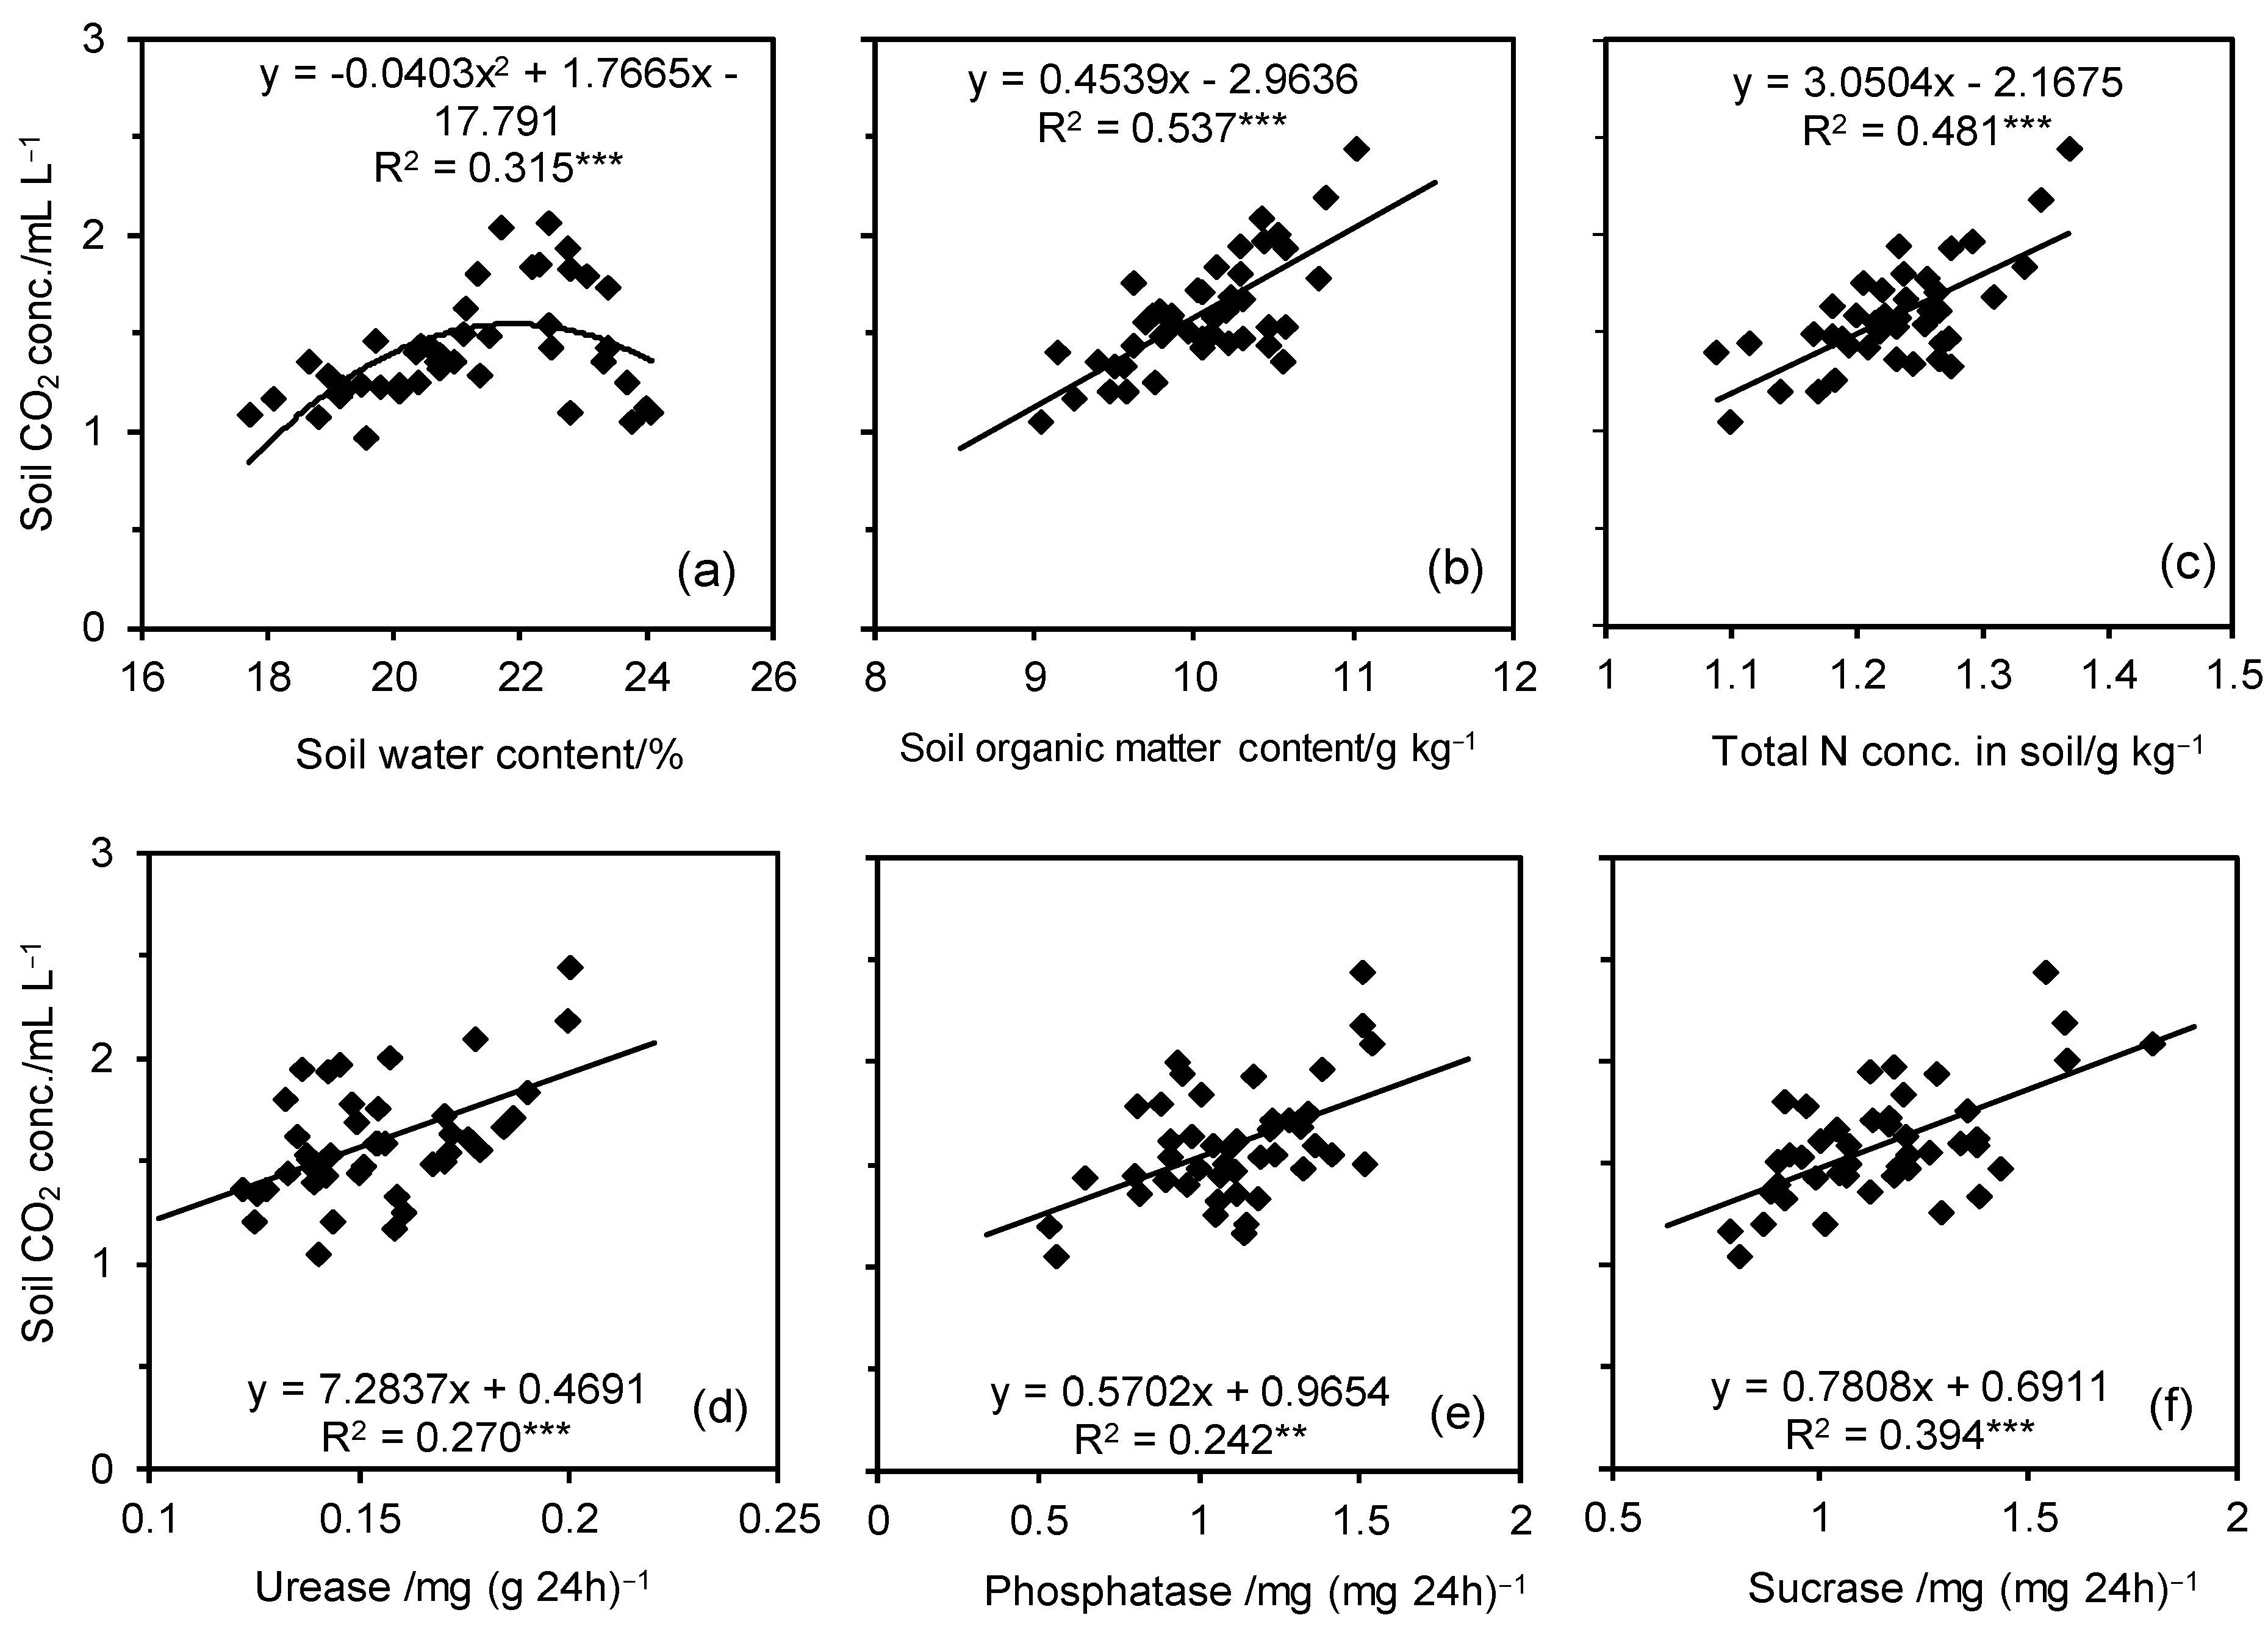
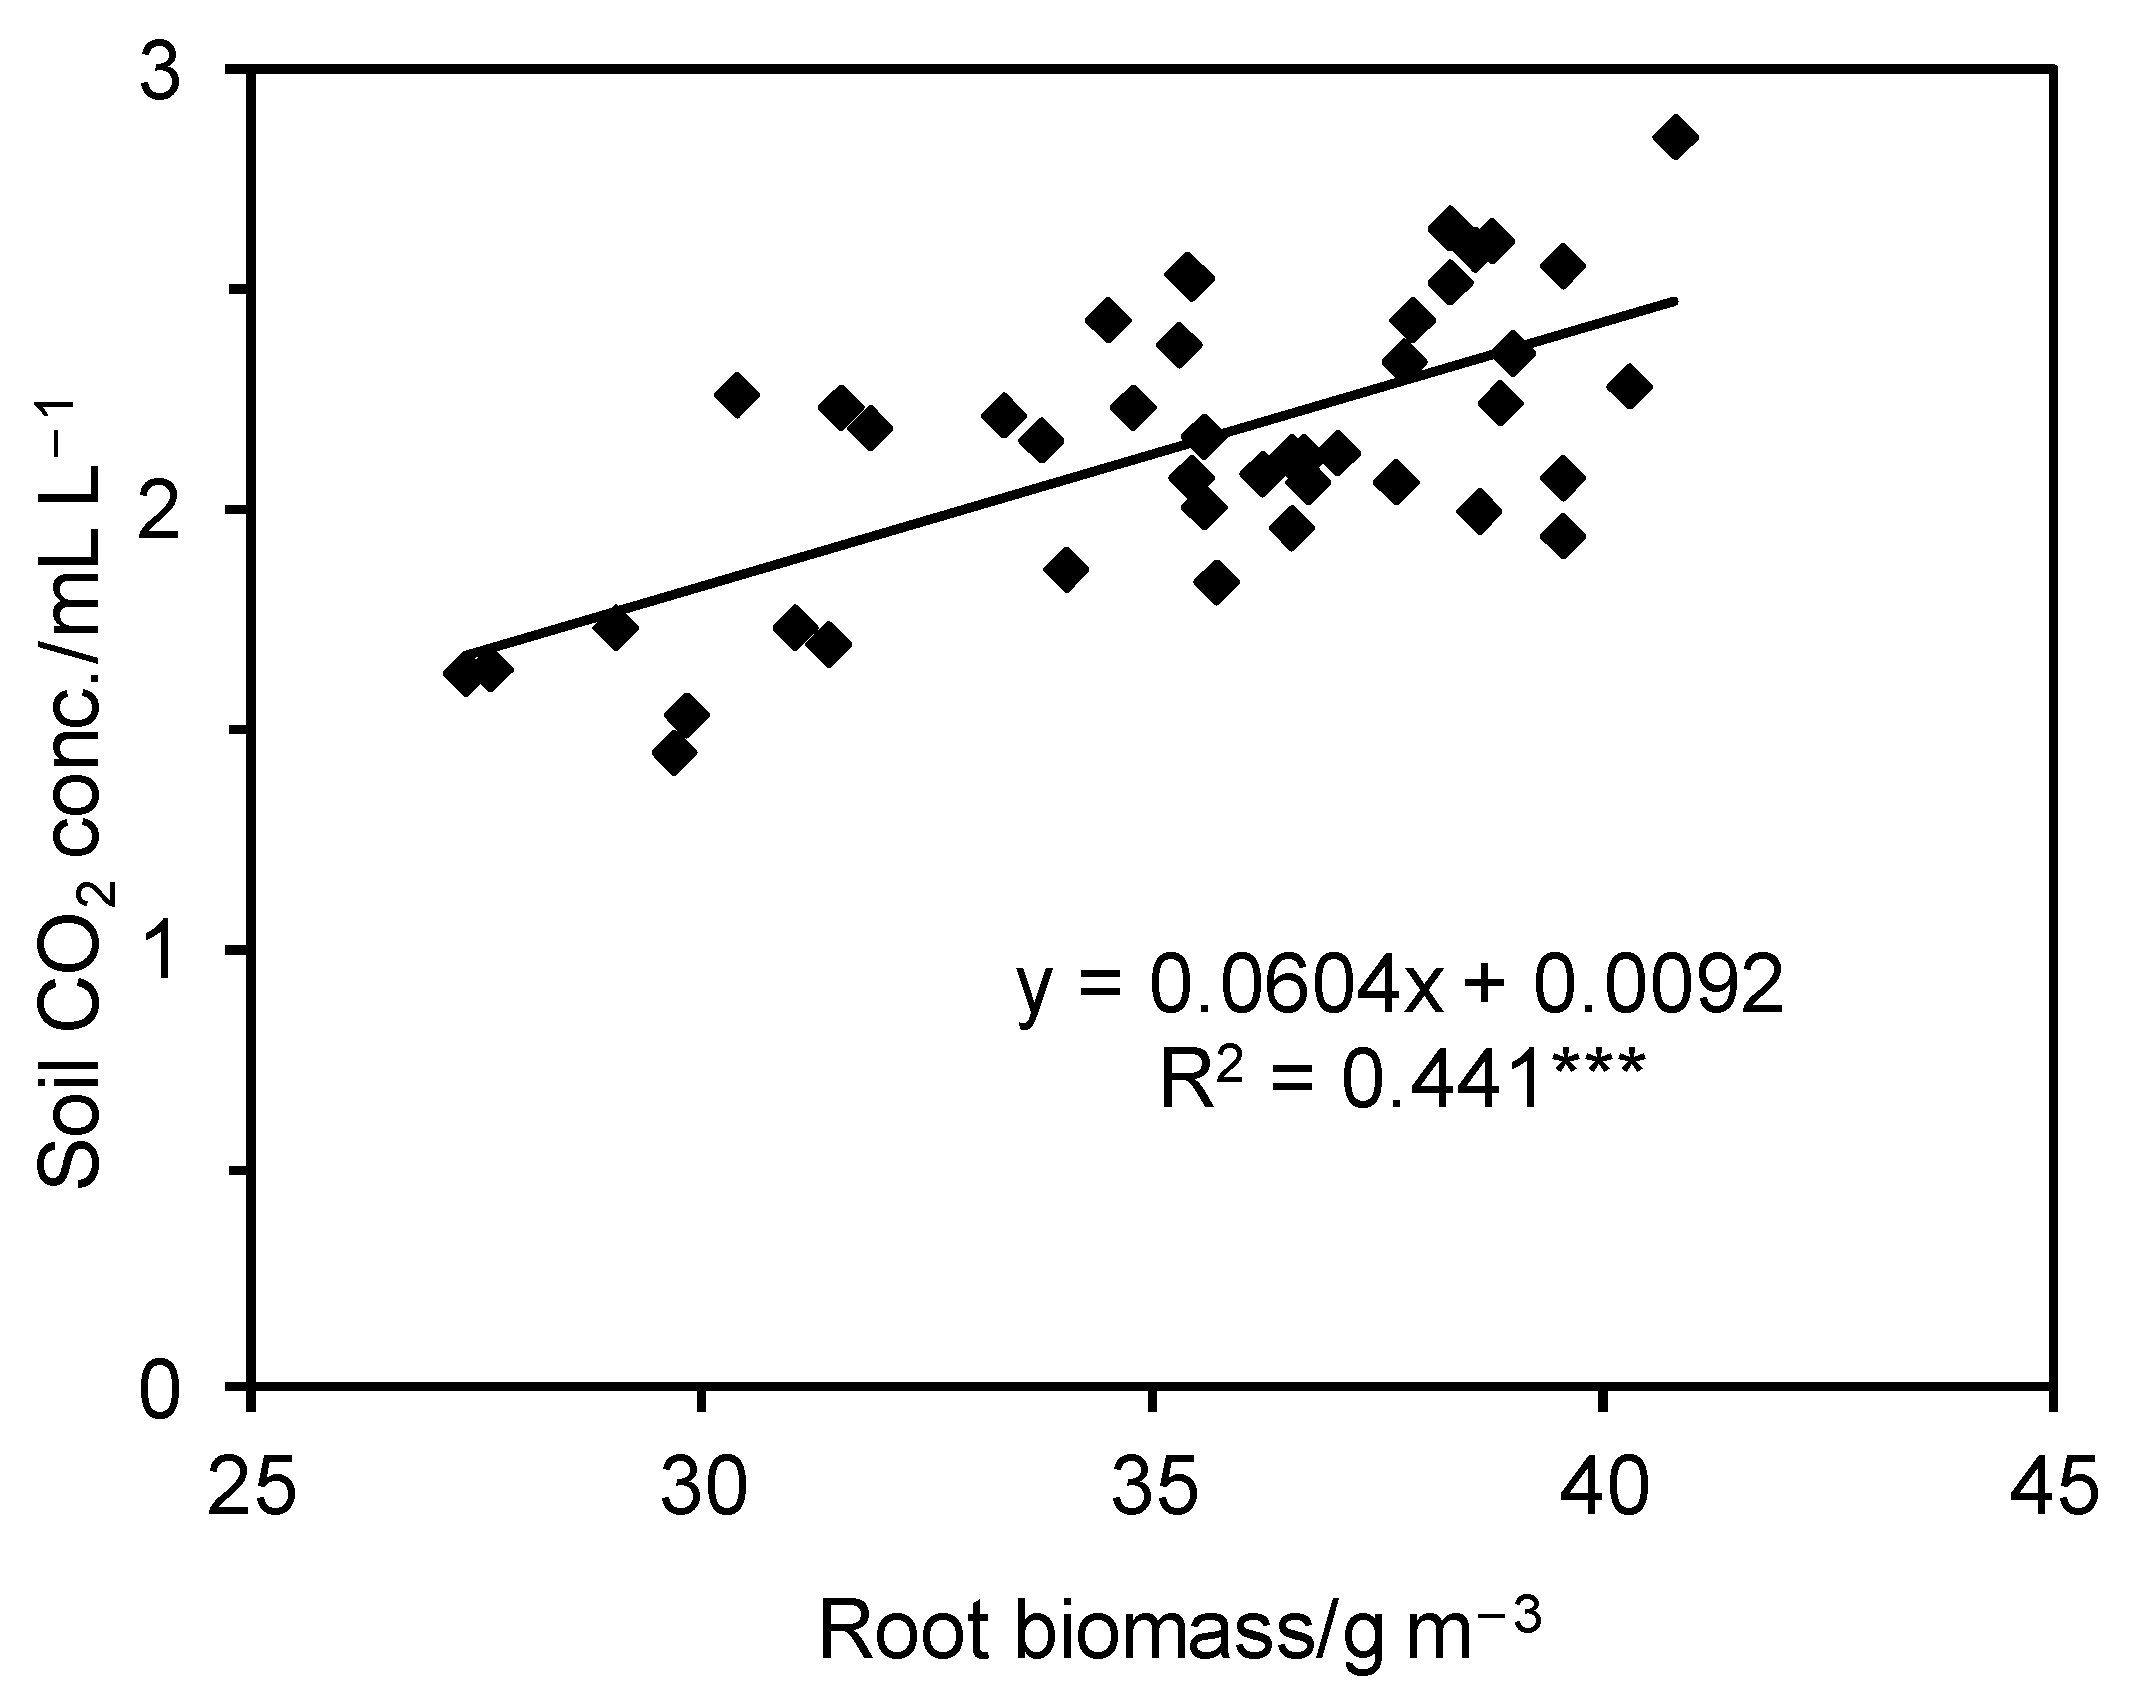
3.3. Soil CO2 Concentration

Variations in soil CO2 concentration with soil depth during three winter wheat stages at the different groundwater depths and fertilization levels are depicted in Figure 4. With the increasing duration of wheat growth, soil CO2 concentration for all sampling depths first increased and later decreased, and maximum values appeared during the heading stage of vigorous wheat growth (Figure 4). This suggested an enhanced effect of root and microbial respiration on CO2 emission during the vigorous wheat growth stage. Soil CO2 concentration increased with soil depth due to atmospheric gas exchange (Figure 4).
The CO2 concentration in shallow (≤10 cm) soil first decreased and later increased with increasing groundwater depth, and the minimum CO2 concentration values concentrated around a groundwater depth of 50–60 cm (Figure 4). When the sampling depth was >10 cm, soil CO2 concentration decreased with increasing groundwater depth (Figure 4). The fertilization level did not show any significant effect on soil CO2 concentration (Table 1). Average values of soil CO2 concentration at the three fertilization levels were 1.26–1.33, 2.55–2.63, and 1.48–1.59 mL/L during the jointing, heading, and filling stages of the wheat growth period, respectively, under experimental conditions (Figure 4).

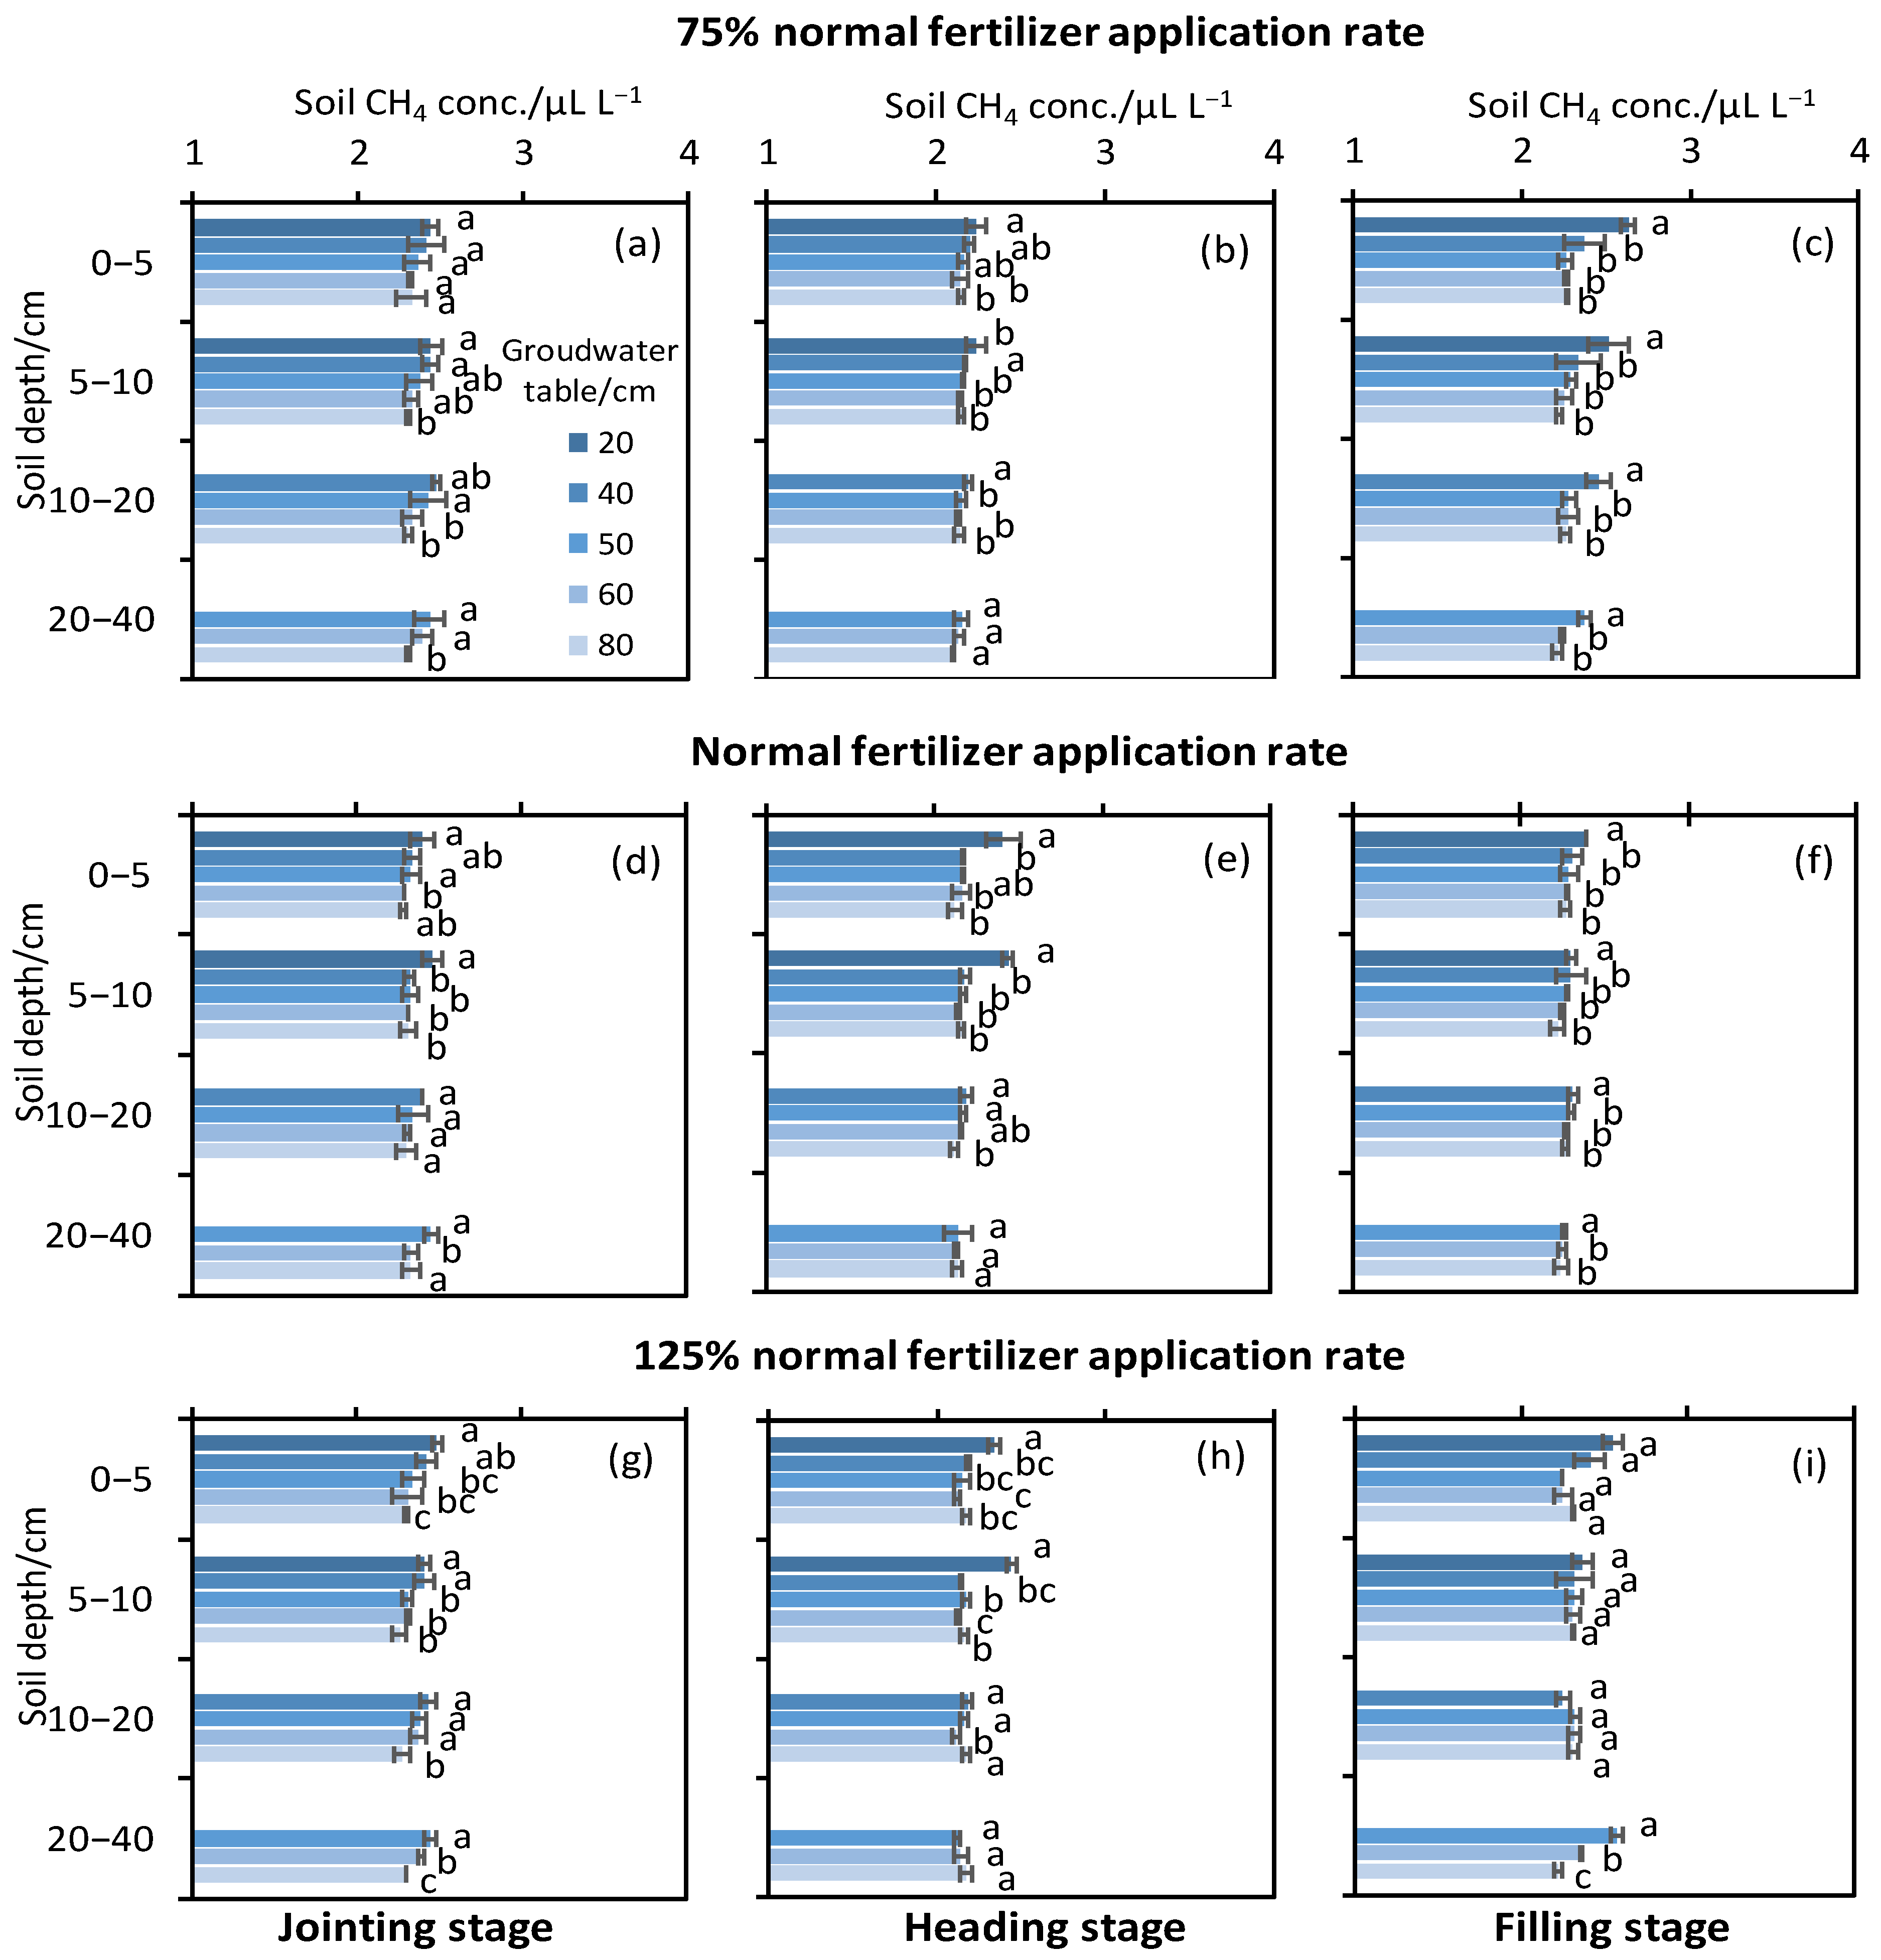
3.4. Soil CH4 Concentration

Soil CH4 concentration exhibited slight seasonal variations (Figure 5), indicated by the lower values during the heading stage compared to other wheat growth stages. Soil CH4 concentration decreased with increasing groundwater depth (Figure 5). The significantly higher CH4 concentration was observed at a sampling soil depth closer to the groundwater surface. However, soil CH4 concentration did not change significantly with soil depth or fertilization levels (Figure 5 and Table 1). The differences in CH4 concentration values at soil depths and fertilization levels were less than 7.3% and 13.7%, respectively.

4. Discussion

In this study, the statistical analysis of experimental data indicated that root parameters were significantly affected by groundwater depth (p ≤ 0.001) (Table 1). Higher root parameter values appeared at 50–60 cm of groundwater depth (Figure 3). The root system of winter wheat was mainly distributed at 10–35 cm soil depth [31]. Shallow groundwater creates a waterlogging environment, which affects wheat root growth and shoot biomass adversely [32] and inhibits wheat root respiration due to insufficient oxygen supply [31,33]. On the other hand, deep groundwater mitigates the absorption and utilization of groundwater by crops. Development of root system plasticity promoted root extension in deeper soil and increased the water access from the deeper-soil layer with higher water content [34,35,36]. Shoot biomass was insignificantly affected by the groundwater depth (Table 1). However, the root:shoot biomass ratio, which is an index for differential investment between aboveground and underground biomass, was significantly affected by groundwater depth (Table 1). A higher root:shoot biomass ratio was observed at a groundwater depth of 60 cm. This demonstrated that the adverse effect of the groundwater level on wheat root growth was higher than shoot growth at groundwater deeper than 60 cm.
The concentrations of soil CO2 and CH4 were significantly affected by groundwater depth (p ≤ 0.001) (Table 1). Groundwater depth was correlated with soil water status and soil aeration conditions, and it substantially influenced production, emission, and accumulation of CO2 and CH4 by affecting soil microbial activity, enzymatic activity, nutrient cycling, and so on [1,2,13,37,38]. Shallower groundwater increases soil water content significantly to reduce pore space for soil gas, creating anaerobic conditions [39]. It adversely affected the growth of aerobic microorganisms, and enhanced anaerobic microorganisms’ activity. However, deeper groundwater also inhibits the growth of aerobic microbes that rely on water for metabolism [40]. Consequently, soil CO2 concentration had a quadratic function relation (p ≤ 0.001) with soil water content (Figure 6a), and the soil CH4 concentration (Figure 7a) was found to be linearly correlated with soil water content (p ≤ 0.001).
Soil CO2 production depends on crop root growth. Root respiration represents the metabolism of root cells and respiratory activity, and higher root biomass showed a higher potential in increasing autotrophic root respiration [11]. Meanwhile, greater root residual input provided more C to rhizospheric microbes, which enhanced C decomposition and heterotrophic microbial respiration [12]. These findings were validated by the significant positive correlation (p ≤ 0.001) between the soil CO2 concentration and root biomass (Figure 8). However, CH4 concentration did not show a significant correlation with root biomass, as CH4 is not the product of root cell metabolism. Therefore, CH4 concentration was not significantly correlated with the growth status of the crop root system.
Organic matter and total N in soil are closely related with CO2 and CH4 production. This was further validated by the positive correlations between the concentrations of CO2 and CH4 and organic matter and total N (Figure 6b,c and Figure 7b,c). The increasing organic matter content increased CO2 and CH4 emissions. Soil CO2 and CH4 from soil respiration are derived from microbial decomposition of soil organic matter [12,41,42]. Higher soil organic matter resulted in a higher microbial population in the soil. However, in this study, the correlations of CO2 and CH4 concentrations with organic matter and total N contents might be due to the effect of groundwater depth. Previous studies have demonstrated that levels of organic matter and total N, the crucial soil nutrient, were lowest at a groundwater depth of 60 cm, and the enzymatic activities were highest due to the suitable soil moisture [15]. The CO2 and CH4 concentrations in soil should increase due to the fast nutrient cycling, but decreased near groundwater depth of 60 cm [15,40]. This might be due to the improved soil structure and the enhanced soil aeration conditions [39]. High levels of soil water content can deteriorate soil structure and make the soil denser to trap CO2 and CH4, resulting in higher CO2 and CH4 concentrations in the soil [43].
Soil P and K, crucial soil elements involved in protein synthesis, cation–anion balance, enzyme activation, and so on, are influenced by groundwater depth [44]. However, soil P and K did not show an apparent effect on soil CO2 concentration under the experimental conditions. Nevertheless, available K content showed a positive linear correlation (p ≤ 0.001) with CH4 concentration (Figure 7d). This might be due to K+-led inhibition of CH4 absorption in soil. The K+ concentration in soil solution increased osmotic pressure in methane-oxidizing microbial cells, inhibiting CH4 oxidation and increasing the CH4 concentration in soil [16].
Soil enzyme activity is involved in soil nutrient cycling. However, only phosphatase was affected by the groundwater depth, while all the three enzymes (urease, phosphatase and sucrase) were significantly affected by the fertilization level [15]. The correlations between the CO2 and CH4 concentrations with soil enzymatic activities are discussed below.
Currently, chemical fertilizer plays a vital role in meeting the increasing demand for staple grain. Appropriate nitrogen fertilizer application promotes photosynthesis and a strong root system for higher nutrient absorption [45,46], thus increasing dry matter accumulation [47]. In this study, fertilizer application resulted in increased wheat root biomass (Figure 3a), mean root diameter (Figure 3b), and shoot biomass (Figure 3d) due to higher nutrients in soil [35,46]. However, excessive N application not only increased the resource wastage and non-point source pollution but also reduced crop root length density, adversely impacting plant biomass and grain yield [33]. Also, fertility deficits certainly decrease photosynthetic activity and crop efficiency, hindering crop and root system growth [48]. These two factors might explain the increased root length density in treatment involving normal fertilization application compared to the other two fertilization treatments under the experimental conditions (Figure 3c).
Fertilizers, especially N fertilizers, significantly affect soil respiration [21,49]. However, as per the current study, the fertilizer application rate affected the soil CO2 and CH4 concentrations insignificantly (Table 1). Nitrogen supplementation inhibits microbial heterotrophic respiration in soil by suppressing soil microbial biomass but stimulating root respiration [50]. However, as per previous reports, insignificant changes in heterotrophic and soil respiration after N fertilization application did not affect microbial biomass significantly [14,40]. Thus, the precise mechanism for the effect of N fertilizer application on soil respiration needs further investigation.
Increased total N content leads to a decreased C/N ratio and improved soil CO2 flux [51,52]. Furthermore, soil N/P ratio also influenced autotrophic respiration and microbial activity. A balanced N/P ratio increases root biomass accumulation and soil CO2 concentration [3,51,52]. Nitrogen fertilizer application enhances the root respiration rate by increasing the availability of soil nutrients, N content in root, and photosynthate allocation below the ground (root biomass) [3]. This perhaps partially resulted in the significant correlation (p ≤ 0.001) of soil CO2 concentration with total N content (Figure 6c).
In addition to soil nutrients, the activities of soil enzymes, i.e., urease, phosphatase, and sucrase, were significantly influenced by fertilization levels [15] and linearly correlated with soil CO2 concentration (Figure 6d–f). Urease, phosphatase, and sucrase in the soil are mainly secreted by aerobic microbes in the soil and root cells [26,39]. This might be the reason for CH4 concentration not being correlated with soil enzymatic activities. Soil enzymatic activity can be used as an index of microbial activity for expressing soil respiration intensity [28,53]. Catalysis of soil enzymes can accelerate the microbial decomposition of soil organic matter [28,54]. Also, a high soil nutrient cycling rate increased the plant organic matter accumulation and root growth, which in turn increased the root respiration. Thus, the close correlations between soil CO2 concentration and soil enzymatic activities might be the outcome of the synergistic effects of fertilizer level on soil nutrition content, microbial activity, and crop root growth.
The total quantity and activity of soil microorganisms have a direct impact on soil respiration, soil enzyme activity, and soil nutrient cycling [4,24,41,55]. However, this study primarily focused on the relationship between microbial by-products and wheat growth, rather than exploring the role of soil microorganisms. Therefore, in order to comprehensively assess the effects of shallow groundwater and fertilization rates on plants, further research is needed to investigate changes in soil microorganisms and their correlation with soil fertility parameters and plant growth.

5. Conclusions

This study validated a portion of the hypothesis, demonstrating that soil CO2 and CH4 concentrations were primarily determined by groundwater depth. Soil CO2 had significant correlations with soil moisture, nutrient content, enzyme activity, and wheat root growth, which were influenced by groundwater depth and fertilization level. However, for CH4 concentration, alterations in soil moisture and nutrients (such as organic matter, total N and available K) played a predominant role. Overall findings suggested that maintaining a groundwater depth of 50–60 cm is optimal for regulating soil respiration, promoting root growth, and facilitating matter accumulation and distribution in winter wheat crops.

Author Contributions

Conceptualization, W.Z. and F.L.; Data curation, W.Z.; Writing—original draft, W.Z.; Writing—review & editing, C.G. and F.L.; Supervision, X.Z. and J.Z.; Funding acquisition, C.G. All authors have read and agreed to the published version of the manuscript.

Funding

This research was supported by the Science and Technology Project of Inner Mongolia Autonomous Region in China (2023YFHH0092) and the Fundamental Research Funds for the Central Universities (BLX202274).

Data Availability Statement

Data are contained within the article.

Conflicts of Interest

The authors do not have any pertinent financial or non-financial affiliations to declare.

References

  1. Zhang, Q.; Phillips, R.P.; Manzoni, S.; Scott, R.L.; Oishi, A.C.; Finzi, A.; Daly, E.; Vargas, R.; Novick, K.A. Changes in photosynthesis and soil moisture drive the seasonal soil respiration-temperature hysteresis relationship. Agric. For. Meteorol. 2018, 259, 184–195. [Google Scholar] [CrossRef]
  2. Buysse, P.; Flechard, C.R.; Hamon, Y.; Viaud, V. Impacts of water regime and land-use on soil CO2 efflux in a small temperate agricultural catchment. Biogeochemistry 2016, 130, 267–288. [Google Scholar] [CrossRef]
  3. Sun, Q.; Wang, R.; Wang, Y.; Du, L.; Zhao, M.; Gao, X.; Hu, Y.; Guo, S. Temperature sensitivity of soil respiration to nitrogen and phosphorous fertilization: Does soil initial fertility matter? Geoderma 2018, 325, 172–182. [Google Scholar] [CrossRef]
  4. Qu, L.; Kitaoka, S.; Koike, T. Factors controlling soil microbial respiration during the growing season in a mature larch plantation in Northern Japan. J. Soils Sediments 2018, 18, 661–668. [Google Scholar] [CrossRef]
  5. Lou, Y.; Gu, X.; Zhou, W. Effect of elevated UV-B radiation on microbial biomass C and soil respiration in different barley cultivars under field conditions. Water Air Soil Pollut. 2017, 228, 95–103. [Google Scholar] [CrossRef]
  6. Tong, X.; Li, J.; Nolan, R.H.; Yu, Q. Biophysical controls of soil respiration in a wheat-maize rotation system in the North China Plain. Agric. For. Meteorol. 2017, 246, 231–240. [Google Scholar] [CrossRef]
  7. Chen, X.; Peng, S.; Chen, C.; Chen, H.Y.H. Water availability regulates tree mixture effects on total and heterotrophic soil respiration: A three-year field experiment. Geoderma 2021, 402, 115259. [Google Scholar] [CrossRef]
  8. Li, X.; Guo, D.; Zhang, C.; Niu, D.; Fu, H.; Wan, C. Contribution of root respiration to total soil respiration in a semi-arid grassland on the Loess Plateau, China. Sci. Total Environ. 2018, 627, 1209–1217. [Google Scholar] [CrossRef] [PubMed]
  9. Acosta, M.; Darenova, E.; Krupková, L.; Pavelka, M. Seasonal and inter-annual variability of soil CO2 efflux in a Norway spruce forest over an eight-year study. Agric. For. Meteorol. 2018, 256–257, 93–103. [Google Scholar] [CrossRef]
  10. Savage, K.; Davidson, E.A.; Tang, J. Diel patterns of autotrophic and heterotrophic respiration among phenological stages. Glob. Chang. Biol. 2013, 19, 1151–1159. [Google Scholar] [CrossRef] [PubMed]
  11. Tomotsune, M.; Yoshitake, S.; Watanabe, S.; Koizumi, H. Separation of root and heterotrophic respiration within soil respiration by trenching, root biomass regression, and root excising methods in a cool-temperate deciduous forest in Japan. Ecol. Res. 2013, 28, 259–269. [Google Scholar] [CrossRef]
  12. Wertha, M.; Kuzyakov, Y. Root-derived carbon in soil respiration and microbial biomass determined by 14C and 13C. Soil Biol. Biochem. 2008, 40, 625–637. [Google Scholar] [CrossRef]
  13. Hu, Z.; Islam, A.T.; Chen, S.; Hu, B.; Shen, S.; Wu, Y.; Wang, Y. Effects of warming and reduced precipitation on soil respiration and N2O fluxes from winter wheat-soybean cropping systems. Geoderma 2019, 337, 956–964. [Google Scholar] [CrossRef]
  14. Zhong, Y.; Yan, W.; Zong, Y.; Shangguan, Z. Biotic and abiotic controls on the diel and seasonal variation in soil respiration and its components in a wheat field under long-term nitrogen fertilization. Field Crops Res. 2016, 199, 1–9. [Google Scholar] [CrossRef]
  15. Zhang, W.; Zhu, J.; Zhou, X.; Li, F. Effects of shallow groundwater table and fertilization level on soil physico-chemical properties, enzyme activities, and winter wheat yield. Agric. Water Manag. 2018, 208, 307–317. [Google Scholar] [CrossRef]
  16. Cai, Z.C.; Xu, H.; Ma, J. Methane and Nitrous Oxide Emissions from Rice-Based Ecosystem; University of Science and Technology of China Press: Hefei, China, 2009. [Google Scholar]
  17. Wang, Z.; Zeng, D.; Patrick, W.H. Methane emissions from natural wetlands. Methane Emiss. Nat. Wetl. 1996, 42, 143–161. [Google Scholar] [CrossRef] [PubMed]
  18. Aguilar, E.A.; Turner, D.W.; Gibbs, D.J.; Armstrong, W.; Sivasithamparam, K. Oxygen distribution and movement, respiration and nutrient loading in banana roots (Musa spp. L.) subjected to aerated and oxygen-depleted environments. Plant Soil 2003, 253, 91–102. [Google Scholar] [CrossRef]
  19. Pulford, I.D.; Tabatabai, M.A. Effect of waterlogging on enzyme activities in soils. Soil Biol. Biochem. 1988, 20, 215–219. [Google Scholar] [CrossRef]
  20. Cao, R.; Xi, X.; Yang, Y.; Wei, X.; Wu, X.; Sun, S. The effect of water table decline on soil CO2 emission of Zoige peatland on eastern Tibetan Plateau: A four-year in situ experimental drainage. Appl. Soil Ecol. 2017, 120, 55–61. [Google Scholar] [CrossRef]
  21. Creze, C.M.; Madramootoo, C.A. Water table management and fertilizer application impacts on CO2, N2O and CH4 fluxes in a corn agro-ecosystem. Sci. Rep. 2019, 9, 2692–2704. [Google Scholar] [CrossRef]
  22. Xue, Y.; Zhang, W.; Liu, D.; Yue, S.; Cui, Z.; Chen, X.; Zou, C. Effects of nitrogen management on root morphology and zinc translocation from root to shoot of winter wheat in the field. Field Crops Res. 2014, 161, 38–45. [Google Scholar] [CrossRef]
  23. Jurasinski, G.; Jordan, A.; Glatzel, S. Mapping soil CO2 efflux in an old-growth forest using regression kriging with estimated fine root biomass as ancillary data. For. Ecol. Manag. 2012, 263, 101–113. [Google Scholar] [CrossRef]
  24. Geisseler, D.; Scow, K.M. Long-term effects of mineral fertilizers on soil microorganisms—A review. Soil Biol. Biochem. 2014, 75, 54–63. [Google Scholar] [CrossRef]
  25. Gong, W.; Yan, X.; Wang, J. The effect of chemical fertilizer on soil organic carbon renewal and CO2 emission—A pot experiment with maize. Plant Soil 2011, 353, 85–94. [Google Scholar] [CrossRef]
  26. Guan, S. Methods of Soil Enzymology; China Agriculture Press: Beijing, China, 1986. [Google Scholar]
  27. Dick, R.P. Soil Enzyme Activities as Integrative Indicators of Soil Health; Biological indicators of soil health; CAB International: Wallingford, CT, USA, 1997. [Google Scholar]
  28. Iovieno, P.; Morra, L.; Leone, A.; Pagano, L.; Alfani, A. Effect of organic and mineral fertilizers on soil respiration and enzyme activities of two Mediterranean horticultural soils. Biol. Fertil. Soils 2009, 45, 555–561. [Google Scholar] [CrossRef]
  29. Singh, S.P.; Setter, T.L. Effect of waterlogging on element concentrations, growth and yield of wheat varieties under farmer’s sodic field conditions. Proc. Natl. Acad. Sci. USA India Sect. B Biol. Sci. 2017, 87, 513–520. [Google Scholar] [CrossRef]
  30. Bao, S. Soil Agro-Chemistrical Analysis(Ⅲ); China Agriculture Press: Beijing, China, 2008. [Google Scholar]
  31. Hodgkinson, L.; Dodd, I.C.; Binley, A.; Ashton, R.W.; White, R.P.; Watts, C.W.; Whalley, W.R. Root growth in field-grown winter wheat: Some effects of soil conditions, season and genotype. Eur. J. Agron. 2017, 91, 74–83. [Google Scholar] [CrossRef] [PubMed]
  32. de San Celedonio, R.P.; Abeledo, L.G.; Mantese, A.I.; Miralles, D.J. Differential root and shoot biomass recovery in wheat and barley with transient waterlogging during preflowering. Plant Soil 2017, 417, 481–498. [Google Scholar] [CrossRef]
  33. Chen, J.; Wang, P.; Ma, Z.; Lyu, X.; Liu, T.; Siddique, K.H. Optimum water and nitrogen supply regulates root distribution and produces high grain yields in spring wheat (Triticum aestivum L.) under permanent raised bed tillage in arid northwest China. Soil Tillage Res. 2018, 181, 117–126. [Google Scholar] [CrossRef]
  34. Becker, S.R.; Byrne, P.F.; Reid, S.D.; Bauerle, W.L.; McKay, J.K.; Haley, S.D. Root traits contributing to drought tolerance of synthetic hexaploid wheat in a greenhouse study. Euphytica 2015, 207, 213–224. [Google Scholar] [CrossRef]
  35. Ali, S.; Xu, Y.; Ahmad, I.; Jia, Q.; Ma, X.; Ullah, H.; Alam, M.; Adnan, M.; Daur, I.; Ren, X.; et al. Tillage and deficit irrigation strategies to improve winter wheat production through regulating root development under simulated rainfall conditions. Agric. Water Manag. 2018, 209, 44–54. [Google Scholar] [CrossRef]
  36. Guo, J.; Zheng, L.; Ma, J.; Li, X.; Chen, R. Meta-analysis of the effect of subsurface irrigation on crop yield and water productivity. Sustainability 2023, 15, 15716. [Google Scholar] [CrossRef]
  37. Sun, Q.; Hu, J.; Jiang, J.; Gu, K.; Zhu, C.; Pan, C.; Yin, W. Effect of soil volumetric water content on the CO2 diffusion coefficient. Sustainability 2023, 15, 1263. [Google Scholar] [CrossRef]
  38. Xiao, L.; Bao, L.; Ren, L.; Xie, Y.; Wang, H.; Wang, X.; Wang, J.; Qiao, C.; Xiao, X. Appropriate irrigation and fertilization regime restrain indigenous soil key ammonia-oxidizing archaeal and bacterial consortia to mitigate greenhouse gas emissions. Sustainability 2022, 14, 6113. [Google Scholar] [CrossRef]
  39. Wang, X.; Lu, Q. Effect of waterlogged and aerobic incubation on enzyme activities in paddy soil. Pedosphere 2006, 16, 532–539. [Google Scholar] [CrossRef]
  40. Liu, L.; Hu, C.; Yang, P.; Ju, Z.; Olesen, J.E.; Tang, J. Effects of experimental warming and nitrogen addition on soil respiration and CH4 fluxes from crop rotations of winter wheat–soybean/fallow. Agric. For. Meteorol. 2015, 207, 38–47. [Google Scholar] [CrossRef]
  41. Illeris, L.; Michelsen, A.; Jonasson, S. Soil plus root respiration and microbial biomass following water, nitrogen, and phosphorus application at a high arctic semi desert. Biogeochemistry 2003, 65, 15–29. [Google Scholar] [CrossRef]
  42. Li, L.J.; You, M.Y.; Shi, H.A.; Ding, X.L.; Qiao, Y.F.; Han, X.Z. Soil CO2 emissions from a cultivated Mollisol: Effects of organic amendments, soil temperature, and moisture. Eur. J. Soil Biol. 2013, 55, 83–90. [Google Scholar] [CrossRef]
  43. Yang, Y.; Li, C.; Li, J.; Schneider, R.; Lamberts, W. Growth dynamics of Chinese wingnut (Pterocarya stenoptera) seedlings and its effects on soil chemical properties under simulated water change in the Three Gorges Reservoir Region of Yangtze River. Environ. Sci. Pollut. Res. 2013, 20, 7112–7123. [Google Scholar] [CrossRef]
  44. Kering, M.K.; Butler, T.J.; Biermacher, J.T.; Mosali, J.; Guretzky, J.A. Effect of potassium and nitrogen fertilizer on switchgrass productivity and nutrient removal rates under two harvest systems on a low potassium soil. Bioenerg. Res. 2012, 6, 329–335. [Google Scholar] [CrossRef]
  45. Olmo, M.; Villar, R.; Salazar, P.; Alburquerque, J.A. Changes in soil nutrient availability explain biochar’s impact on wheat root development. Plant Soil 2015, 399, 333–343. [Google Scholar] [CrossRef]
  46. Hirte, J.; Leifeld, J.; Abiven, S.; Mayer, J. Maize and wheat root biomass, vertical distribution, and size class as affected by fertilization intensity in two long-term field trials. Field Crops Res. 2018, 216, 197–208. [Google Scholar] [CrossRef]
  47. Jiang, D.; Fan, X.; Dai, T.; Cao, W. Nitrogen fertiliser rate and post-anthesis waterlogging effects on carbohydrate and nitrogen dynamics in wheat. Plant Soil 2008, 304, 301–314. [Google Scholar] [CrossRef]
  48. Chen, Z.K.; Niu, Y.P.; Ma, H.; Hafeez, A.; Luo, H.H.; Zhang, W.F. Photosynthesis and biomass allocation of cotton as affected by deep-layer water and fertilizer application depth. Photosynthetica 2016, 55, 638–647. [Google Scholar] [CrossRef]
  49. Zhu, C.; Ma, Y.; Wu, H.; Sun, T.; La Pierre, K.J.; Sun, Z.; Yu, Q. Divergent efects of nitrogen addition on soil respiration in a semiarid grassland. Sci. Rep. 2016, 6, 33541. [Google Scholar] [CrossRef] [PubMed]
  50. Wang, J.; Wu, L.; Zhang, C.; Zhao, X.; Bu, W.; Gadow, K.V. Combined effects of nitrogen addition and organic matter manipulation on soil respiration in a Chinese pine forest. Environ. Sci. Pollut. Res. 2016, 23, 22701–22710. [Google Scholar] [CrossRef]
  51. Bellingrath-Kimura, S.D.; Kishimoto-Mo, A.W.; Oura, N.; Sekikawa, S.; Yonemura, S.; Sudo, S.; Hayakawa, A.; Minamikawa, K.; Takata, Y.; Hara, H. Differences in the spatial variability among CO2, CH4, and N2O gas fluxes from an urban forest soil in Japan. Ambio 2015, 44, 55–66. [Google Scholar] [CrossRef]
  52. Pires, C.V.; Schaefer, C.; Hashigushi, A.K.; Thomazini, A.; Filho, E.; Mendonca, E.S. Soil organic carbon and nitrogen pools drive soil C-CO2 emissions from selected soils in Maritime Antarctica. Sci. Total Environ. 2017, 596–597, 124–135. [Google Scholar] [CrossRef]
  53. You, G.; Zhang, Z.; Zhang, R. Temperature adaptability of soil respiration in short-term incubation experiments. J. Soils Sediments 2018, 19, 557–565. [Google Scholar] [CrossRef]
  54. Xiao, S.; You, H.; You, W.; Liu, J.; Cai, C.; Wu, J.; Ji, Z.; Zhan, S.; Hu, Z.; Zhang, Z.; et al. Rhizosphere and bulk soil enzyme activities in a Nothotsuga longibracteata forest in the Tianbaoyan National Nature Reserve, Fujian Province, China. J. For. Res. 2016, 28, 521–528. [Google Scholar] [CrossRef]
  55. Ortiz, A.; Sansinenea, E. The role of beneficial microorganisms in soil quality and plant health. Sustainability 2022, 14, 5358. [Google Scholar] [CrossRef]
Figure 1. Experimental setup for soil temperature monitoring and soil gas sampling in a lysimeter.
Sustainability 16 01396 g001
Figure 2. Calibration curves of CO2 (a) and CH4 (b) concentrations with peak area displayed by the gas chromatograph.
Sustainability 16 01396 g002
Figure 3. Variations in root biomass (a), mean root diameter (b), root length density (c), shoot biomass (d) and root:shoot biomass ratio (e) with groundwater depth at 75% (75% NF), 100% (100% NF), and 125% (125% NF) of normal fertilizer application rate. Bars are the standard deviations of means (n = 3). Means followed by different lowercase letters (a, b, c, d) are significantly different at p < 0.05, determined by Tukey’s HSD test.
Sustainability 16 01396 g003
Figure 4. Variation in soil CO2 concentrations at different soil depths during wheat growth stages under various fertilization levels and groundwater depths: (ac) represent 75% normal fertilizer application rate treatment at the jointing, heading, and filling stages; (df) represent normal fertilizer application rate treatment at the jointing, heading, and filling stages; (gi) represent 125% normal fertilizer application rate treatment at the jointing, heading, and filling stages of wheat growth period, respectively. Bars are the standard deviations of means (n = 3). Means followed by different lowercase letters (a, b, c, d) are significantly different at p < 0.05 as determined by Tukey’s HSD test.
Sustainability 16 01396 g004
Figure 5. Variation in soil CH4 concentrations at different soil depths during wheat growth stages under various fertilization levels and groundwater depths: (ac) represent 75% normal fertilizer application rate treatment at the jointing, heading, and filling stages; (df) represent normal fertilizer application rate treatment at the jointing, heading, and filling stages; (gi) represent 125% normal fertilizer application rate treatment at the jointing, heading, and filling stages of wheat growth period, respectively. Bars are the standard deviations of means (n = 3). Means followed by different lowercase letters (a, b, c) are significantly different at p < 0.05, as determined by the Turkey’s HSD test.
Sustainability 16 01396 g005
Figure 6. Relationships between soil CO2 concentration and soil water content (a), organic matter content (b), total N concentration (c) and activities of urease (d), phosphatase (e) and sucrase (f) averaged at a soil depth of 0–20 cm during the growing season for all tested groundwater levels and fertilization levels. ** and *** indicate statistical significance at the 0.01 and 0.001 probability levels, respectively.
Sustainability 16 01396 g006
Figure 7. Relationships between soil CH4 concentration and soil water content (a), organic matter content (b), total N (c) and available K (d) concentrations averaged at a soil depth of 0–20 cm during the growing season for all tested groundwater levels and fertilization levels. *, **, and *** indicate statistical significance at the 0.05, 0.01 and 0.001 probability levels, respectively.
Sustainability 16 01396 g007
Figure 8. Relationship between the averaged soil CO2 concentration at depth of 0–40 cm and root biomass for all tested groundwater depths and fertilization levels. *** indicates statistical significance at the 0.001 probability level.
Sustainability 16 01396 g008
Table 1. ANOVA results of between-subject effects and within-subject effects for groundwater depth (GD) and fertilization levels (FL) on soil CO2 and CH4 concentrations, root parameters, shoot biomass, and root:shoot ratio. *, **, and *** indicate statistical significance, respectively, at 0.05, 0.01, and 0.001 probability levels; NS indicates no significance at the 0.05 statistical level.
ItemsSoil CO2
Concentration
Soil CH4
Concentration
Root
Biomass
Root
Diameter
Root Length DensityShoot
Biomass
Root:Shoot Ratio
GD***************NS*
FLNSNS***********NS
GD × FLNSNSNSNSNSNSNS
Disclaimer/Publisher’s Note: The statements, opinions and data contained in all publications are solely those of the individual author(s) and contributor(s) and not of MDPI and/or the editor(s). MDPI and/or the editor(s) disclaim responsibility for any injury to people or property resulting from any ideas, methods, instructions or products referred to in the content.

