Abstract
The notion of the smart city offers significant benefits to citizens and enterprises alike. To realize these benefits, however, the city’s organizations and working processes need to undergo a digital transformation (DT) which reshapes work practices and demands a new mindset from city employees. The readiness of these employees to accept such a DT has an effect on the extent to which the city’s residents and businesses benefit from being in a smart city context. This raises the question of which factors have the most influence on employees’ acceptance of DT—a question that has thus far received limited attention from researchers. This study introduces a model that examines various influencing factors, using data collected from a survey of 1180 employees in 10 smart cities in Saudi Arabia. The factors examined take a variety of forms, including external elements such as management provision for employees and process complexity, which can lead to resistance to change, as well as internal elements, such as perceived advantages and inertia. The findings of the study show that management support for employees and the perceived advantages of DT have a positive relationship with acceptance by employees, while process complexity and inertia have a negative relationship with employees’ acceptance. These findings contribute to the growing body of literature concerning DT acceptance in a smart city context and will provide organizations with insights on which to base strategies for encouraging employee adaptation to evolving digital landscapes.
Keywords:
acceptance; digital transformation; resistance; smart city; smart government; urbanization 1. Introduction
The past few decades have seen important advances in the development and implementation of leading-edge technologies, such as artificial intelligence (AI), machine learning, cloud computing, and distributed ledger technologies (DLTs) such as blockchain. These advances are leading to a digital transformation (DT) of all levels of society, and have resulted in the emergence of the notion of the smart city—an urban environment in which advanced technologies are actively used to improve operational efficiency and management processes to deliver a better value of public service and citizen welfare [1,2]. The COVID-19 pandemic further spurred the growth of many smart cities, underscoring the value of technology and the need for cities to make a swift digital transformation [3,4,5]. Both researchers and practitioners concur that DT can bolster a city’s service provision and competitive edge [1,6].
The pervasive and visible impacts of DT and emerging digital urban models are attracting scholarly attention, with researchers across multiple disciplines reviewing and defining the smart city phenomenon [1,7]. Recent studies suggest that cities embracing advanced technology are better able to improve outcomes and devise new urban models [8,9]. DT is thus seen as a potent force that can fundamentally reshape how cities operate and the roles city employees adopt [10,11]. In essence, becoming a smart city through DT can redefine a city’s value suggestion and establish a new organizational identity [10,12].
However, the transition to smart city ‘status’ can be complex, and often has far-reaching effects on the city’s infrastructural systems. This can lead to a requirement for major changes in micro-level operational factors, such as the working practices of employees [10,13]. Facilitating these changes is not straightforward, and can require significant support and encouragement from management. Lack of appropriate support could result in the failure of the overall DT process [10,14]. Previous research has shown that employees often resist change due to a number of factors, such as familiarity with current practices, known as inertia [15], or due to a perceived threat to their job [4,16]. Such resistance by employees can have a greater impact than just slowing DT; it can also amplify any problems with, or errors in, extant working practices [4,17]. It is therefore critical to ensure that employees respond positively to the changes that result from DT if the DT process is to be successful.
While there exist studies of factors that determine successful DT [1], such research has been almost solely from an organizational perspective [18,19]. There have been very few studies that have attempted to identify the principal factors that drive city staff to accept DT and any innovative work performed that results [1]. However, understanding these factors could play a critical part in ensuring the successful transition to a smart city. This study seeks to address this knowledge gap. To do so, we look at both the external and the internal influences on employees’ reaction to DT, and assess whether these influences have a positive or negative impact on employees’ DT acceptance level.
In terms of external factors, management support for the needed changes required by DT can lead to improved positivity from employees [20,21]. However, earlier studies have also found that employees tend to resist changes in working processes [22,23], especially if the processes are relatively complex, as such changes can have an impact on established routines, and therefore demand significant mental and physical effort [4]. Therefore, managerial support and process complexity can be considered significant factors that affect city workers’ readiness to accept DT. As to the internal perspective, employees’ readiness to change, which is a function of their abilities and attitudes toward using digital technologies, can significantly influence their acceptance of new digital work practices [1]; however, the fear of losing their job due to DT can also (consciously or unconsciously) drive them to resist such changes [4,24]. Hence, digital familiarity and fear of loss of employment are considered factors in DT acceptance among city employees.
This paper is structured to include the following sections: (1) a wide literature review on DT and the relevance of its acceptance by city employees; (2) a discussion of the research model and hypotheses, followed by a description of the research methodology employed; (3) a discussion of the research findings; and (4) conclusions, including a discussion of the theoretical and practical implications, limitations, and future research directions.
2. Literature Review
2.1. Theoretical Foundation
Our aim is to explore how external and internal factors can impact, either positively or negatively, a citizen’s (specifically, a city employee’s) willingness to accept the changes imposed by the DT to a smart city. To achieve this, we adopt a paradox perspective [25], which has, at its core, the understanding that individuals are often torn between the decision to embrace or reject a particular initiative [26,27,28].
Previous research indicates that acceptance and resistance toward IT/IS can coexist independently in an individual, and are not necessarily inversely related [29,30,31]. Turel [26] further argues that, while such attitudes are seemingly contradictory, they may not only coexist but can have their own independent predictors and outcomes.
Applying this to the context of the transition to smart city status through DT, employees can hold two contrasting views simultaneously and independently. The paradox perspective is therefore a useful approach to understanding the acceptance and non-acceptance of smart city initiatives [32]. Moreover, opposing intentions and actions, such as trust/distrust [33,34,35] or satisfaction/dissatisfaction [3], might be influenced by different factors, so the motivations behind non-acceptance might differ from those driving acceptances, leading to distinct behaviors.
In the case of the acceptance of smart city technology, where certain behaviors could be seen as potentially problematic, this attitude construct and the conflicting behaviors that result are even more critical [32,36,37]. People’s behaviors are often shaped by their immediate needs, even after having considered the implications of the behavior in question, compared to what they believe they ought to do [3,38].
In the context of smart cities, employees usually encounter influences from both external factors (e.g., management) and internal aspects (e.g., personal perceptions of the technology). We claim that both factors have contradictory aspects that shape how the worker observes the transition to smart city technologies.
2.2. Adoption of Digital Technology in Smart Cities
Over the past two decades or so, cities have become closely engaged in investigating how evolving technologies can help them restructure and reshape their service infrastructures to improve their public services, as well as to become more attractive to commercial enterprises compared with ‘rival’ cities [18,39,40]. The result has been the emergence of the smart city, which puts advanced technologies, for instance machine learning, cloud computing, and AI, at the heart of its organization and processes [1]. While this provides many benefits, it has also had the consequent effect of requiring radical changes to work practices and processes, as well as to service structure and methods of citizen engagement [10,41,42]. Adapting to these changes is critical to the successful transformation to a smart city.
In recent years, researchers and other academics have attempted to create a full and meaningful definition of DT [10]. Initially, DT was defined as the process of deploying technology to enhance and streamline the infrastructural processes of a city or large organization [3,43,44,45], but this definition has been recently developed by Vial [1] to be more specific. According to Vial, DT is the act of improving an organizational structure (such as a city) by changing its fundamental character through the use of numerous technologies, such as communications, networks, and IT. Within the framework of this perspective, transitioning to a smart city implies the use of technology to radically restructure its operational model in order to advance public services and deliver better value to citizens. This definition was expanded by Wessel et al. [10], who argue that, in the setting of a smart city, a successful DT has two fundamental consequences: (a) it enhances the attractiveness of the city to residents and businesses (i.e., its value proposition), and (b) it begins the process of establishing a new city identity.
However, while DT offers notable benefits to cities, it can also redefine many operational processes, which can have a significant impact on working practices at a micro level. This can prove problematic to manage. Although there is research that has investigated optimal ways of managing DT, most of this research, such as that by AlNuaimi et al. [46], has considered the issue from the employer’s (the city) perspective [47,48], using organizational benefits as objectives of change. Few studies have considered the issue from an employee perspective, using internal personal benefits as motivators of DT acceptance.
This research adopts such a perspective, and identifies the key factors that influence an employee’s readiness to accept DT. These factors can be divided into two different groups: external (management support and organizational complexity) and internal (perceived benefits, both direct and indirect, and inertia). In the following sections, we examine each factor more closely.
3. Research Model and Hypotheses
The study framework is designed to identify and analyze the fundamental elements that affect the readiness of employees to accept the DT which results from the transition to a smart city. As we have noted, some of these elements originate from external sources, while others are better classified as internal motivators. In the external category, managerial support, in the form of positive leadership, can act as a facilitator by encouraging employees to accept DT, while organizational complexity can require major shifts in employee working practices, which can be a potential barrier. Internally, perceived (direct and indirect) advantages of DT can serve as motivators, while inertia (adherence to the familiar) can potentially inhibit employees’ willingness to accept change. The proposed research model goals to deliver a fuller understanding of the complex dynamics among these factors, thereby providing valuable insights into how DT can be more effectively implemented within the setting of smart cities [49]. A diagram of this model is provided in Figure 1. In the following sections, we will look at specific hypotheses concerning these factors.

Figure 1.
Research model.
3.1. Managerial Support
The importance of managerial support in influencing employees’ acceptance of digital technologies is well-documented [50,51,52]. For the purposes of this study, managerial support is well-defined to be the extent to which city employees feel that management considers their interests and views during the process of DT in a smart city setting [50,53].
The part of management is often closely related to the successful implementation of digital technologies [22,54,55]. This is mainly true in a smart city context, where the impact of DT can significantly alter operations and working practices [1]. In this case, management support is critical in fostering employees’ positive attitudes and behaviors toward DT.
Employees are more inclined to easily accept a shift to new working processes/methods when they perceive empathy and active support from their management. This is because management support creates a sense of psychological care and structural assurance among employees [56]. The inclination to accept change is further enhanced if employees associate such change with opportunities for career advancement or other rewards. This is particularly true when there exists a belief in management’s endorsement of DT [57,58], as strong management backing for DT can create a perception among employees that adopting new digital work practices will help them gain management recommendations for rewards and promotions [59,60].
While it is established, in a general context, that management support promotes the adoption of IT and new work models, the comprehensive changes that DT brings suggest that management support might be even more critical in the smart city context. Therefore, our hypothesis is:
H1.
Within the smart city context, management support has a positive influence on the intention to accept DT.
3.2. Process Complexity
Resistance to change (RTC) is a common phenomenon, leading to employees opposing, or deliberately defying, new practices associated with DT [22]. While RTC itself is an internal factor, similar to (but different from—see Section 3.3) inertia, it is often related to the external factor, process complexity (PC), as complex processes require greater change [61] (and therefore resistance).
This study defines RTC as purposeful actions by employees to resist DT [62]. Such resistance can be ‘contagious’, spreading to other employees and leading to a broader trend of reactive behaviors within the workforce [63]. It typically emerges when employees seek to keep the status quo in the face of pressure to change [62], and often results in negative or stressful feelings that inhibit DT adoption. As RTC is generally a function of PC, it is, in this paper, categorized as an external factor affecting DT.
Previous studies have identified RTC as a key inhibitor of the application of innovative digital technology [22], and the mitigation of this resistance requires helping workers appreciate the worth of DT and alleviating their anxieties [22,64]. Despite such support, RTC can remain a significant inhibitor of DT application due to the extensive changes it can demand in working practices [1]. Further, subconscious attitudes and lack of knowledge may undermine positive intentions toward DT, causing employees to resist adapting to new working practices [20,53,65,66].
Complex DT processes within an organization often cause substantial resistance [1]. Implementing an enterprise resource planning (ERP) system, for instance, can require significant changes to organizational processes and identities, which can be the source of employee resistance [67]. The perceived complexity of ERP can heighten employees’ emotional responses to change, further increasing their resistance levels [68]. Similarly, DT can face resistance due to its often radical and far-reaching impact on the organization [1]. This can be attributed to a typical employee’s preference for the status quo, known as status quo bias [22,69]. Misunderstandings and familiarity with existing processes may lead employees to perceive new practices as unnecessarily complex [70,71] and cause them to fear that their current skills might become obsolete, thereby further increasing resistance and reducing the willingness to embrace DT. Therefore, the following hypothesis is proposed:
H2.
Within the smart city context, RTC has a negative influence on the intention to accept DT.
3.3. Inertia
Although inertia and RTC may appear superficially the same, there are significant differences in their underlying causes and implications. Inertia, in the setting of smart cities, refers to the tendency to continue with existing actions and procedures, despite the presence of obviously better alternatives and compelling reasons for change. This reluctance to change, which is an essentially passive construct, often stems from the psychology of habit [72], an absence of motivation, or a deep emotive connection to traditional methodologies [15]. Inertia can help to explain why employees can seem wedded to old habits, even when they recognize their inefficiencies [73,74,75], and is an idea that signifies an individual’s concern that acceptance of change may have uncertain or adverse consequences.
RTC, on the other hand, may include active as well as passive behaviors, which extend beyond the passive reaction to DT, and which reflect a wider mindset. Consequently, we consider inertia to be a separate construct from RTC, and one of the key internal factors that impede the acceptance of change in overall, and DT in specific. Such inertia could negate the advantages of DT and adversely influence acceptance. Subsequently, we propose the following hypothesis:
H3.
Within the smart city context, inertia has a negative influence on the intention to accept DT.
3.4. Perceived (Direct) Benefits
For the purposes of this paper, we differentiate between direct and indirect advantages. Direct advantages are the immediate gains that employees realize from the DT process in a smart city context, and they are typically tangible, quantifiable, and easily comprehensible. They also tend to be experienced firsthand. As Fischhoff et al. [76] have suggested, individuals usually assess the advantages of a specific technology based on anticipated results; in other words, the likelihood of an individual embracing a new technology increases if they foresee benefits. An example is the use of EDI (electronic data interchange) technology. When a company in a smart city deploys EDI technology, employees might expect improved data accuracy, enhanced data security, and streamlined application procedures, all contributing to increased work efficiency and fewer clerical errors, thus encouraging employees to hold the innovative technology [77,78].
Therefore, when staff can see that DT is likely to be directly beneficial to their work within a smart city, their readiness to accept it increases. Hence, we propose the following hypothesis:
H4.
Within the smart city context, perceived direct benefits have a positive influence on the intention to accept DT.
3.5. Indirect Benefits
Perceived indirect benefits are defined as the degree to which staff believe that their organization gains an inexpensive advantage through the adoption of DT. These benefits, in contrast to direct ones, do not have a direct joining to employees’ working practices; instead, they result from enhanced organizational productivity via cooperation with stakeholders and clients [1]. Essentially, indirect benefits represent the ability of the organization to outperform its rivals due to its transition to the smart city framework [79,80], and therefore provide longer-term opportunities to its employees that would not otherwise have been possible. Consequently, perceived indirect benefits primarily refer to the employees’ recognition of the planned and inexpensive edge facilitated by DT [81].
DT has the capacity to enhance specific work practices at a micro level and redefine the value propositions and organizational/brand persona within the framework of a smart city [10,82]. However, despite making significant contributions to an organization’s strategic and competitive advantages as well as corporate reputation, these refined value propositions and brand organizational identities may not be explicitly recognized by employees. Whereas indirect benefits might not explicitly and immediately deliver advantages to employees, new value propositions can boost long-term profitability [1], potentially leading to enhanced internal service quality and ultimately benefiting employees [3]. As such, if an enterprise in a smart city can demonstrate the benefits of DT, its employees are likely to understand that they could potentially benefit from increased internal service quality. Based on this, we propose the following hypothesis:
H5.
Within the smart city context, perceived indirect benefits have a positive influence on the intention to accept DT.
Figure 1 illustrates the research model, demonstrating the interrelationships between the aforementioned hypotheses and the defined variables.
4. Research Methodology
4.1. Development of the Survey Instrument
Research data was gathered through a carefully constructed survey tool, which was adapted from previously validated questionnaires to meet the current study aim, e.g., [5,20,68,73,77]. It is divided into three sections: (1) A statement of the study’s aims and participant eligibility (experience in DT within a smart city context was required); (2) Collection of data on every metric of our research constructs, quantified on a five-point Likert scale; and (3) Evaluation of the demographic characteristics of respondents. The metrics employed within the survey are elaborated on in Table 1.

Table 1.
The constructs along with the corresponding survey items and their associated factor loadings.
The study was constructed according to the principles proposed by MacKenzie et al. [83,84]. Initially, a comprehensive analysis of the literature was carried out, and metrics were developed and tailored to our study, thereby ensuring face validity [12]. The primary modification was to verify that all items were related to staff involved in applying and accepting digital transformation (DT) within smart cities. To guarantee content validity, each item’s content was independently assessed by each of the five researchers. A discussion was held on each construct/factor and its items until a consensus was reached.
Regarding the construct of “Process Complexity”, for example, it is important to note that these items are designed to capture the level of complexity experienced by individuals involved in applying and accepting DT within smart cities. They aim to measure the perceived complexity of the processes rather than solely assessing participants’ inclination or affinity toward DT. Participants are encouraged to provide their honest responses based on their experiences with process complexity. The use of a five-point Likert scale allows for nuanced variations in participants’ perceptions. Therefore, while participants may generally lean toward agreement with these items due to the inherent complexity of DT processes, their responses will still provide valuable insights into the specific challenges and difficulties they perceive.
After finalizing an English version of the survey, a researcher with proficiency in both English and Arabic languages translated the survey items into Arabic. The translated items were then back-translated into English, following a process known as back-translation [12,83]. To assure translation accuracy, a pilot study was performed with a subsample of the intended sample, addressing aspects such as clarity, item sequence, descriptions, and any potentially ambiguous wording.
Additionally, demographic information was gathered from the respondents, including attributes such as gender, age, educational attainment, occupation, and experience with DT within smart cities. In the context of this study, these are viewed as control variables, allowing for a more effective management of the respondents’ background.
4.2. Sampling
This research examines the factors that influence individual preparedness to embrace DT in a smart city context, and the consequent acceptance or rejection of DT within their respective organizations. An online survey was chosen as the methodology for data collection, as such surveys are not limited by geography, typically have higher response rates compared to traditional methods [85], and are relatively cost-effective and flexible [86]. Online surveys also make it easier to use higher sample sizes.
To ascertain whether respondents had relevant experience with DT within the context of a smart city, a self-screening question was included at the start of the survey. For example: Have you ever been involved with applying DT in a smart city context? Respondents lacking DT experience within a smart city were omitted from our sample. To ensure that the sample was representative, a combination of methods was employed to reach a wide range of individuals working in different sectors and at different levels of seniority. Industries covered included both public and private sectors, in areas such as Information and Communications Technology (ICT), Urban Planning, Municipalities, Finance, Transportation, and the Environment. The roles of participants ranged from operational to managerial (e.g., Smart City Solutions Architect, Urban Data Analyst, Smart Grid Engineer, Intelligent Transportation Systems Manager, Digital Health Innovations Specialist, Smart City Policy Advisor, Smart City Funding Analyst, IoT Communication Network Engineer, and Sustainable Infrastructure Planner), and the DT challenges they faced varied from relatively simple requirements, such as restructuring or redefining single tasks, to strategic organizational change (Table 2).
Table 2.
An overview of the demographic characteristics of the respondents.
The survey was distributed through various channels, including collaboration with relevant city departments, professional networks, and industry associations. Over a period of six months, 1500 surveys were distributed, and 1295 responses were received. However, after filtering out respondents who lacked experience in DT within smart cities, and those with incomplete answers, the remaining sample size was 1180. All participants were volunteers, and no financial (or other) incentive was offered.
Table 2 shows the demographics of the eligible participants (profile summary). The researchers believe the sample to be adequately representative.
4.3. Non-Response Bias
To assess the potential for non-response bias, we followed the suggestions of Armstrong and Overton [87]. To evaluate for potential non-response bias, we compared the characteristics of the first and last quartiles of respondents, assuming that the final group of respondents is representative of non-respondents. The t-test did not disclose significant disparities between these groups for our primary research factors (p > 0.05), and a chi-squared test [88] comparing the gender and age of the two groups also produced non-significant results (p > 0.05). This means that non-response bias is very unlikely to be a concern in this research.
4.4. Method of Analysis
The study employs Partial Least Squares Structural Equation Modeling (PLS-SEM) for its analysis. This choice is driven by several factors. First and foremost, PLS-SEM is recognized for its effectiveness in theory development, as illustrated by many recognized sources [89,90,91]. Additionally, PLS-SEM is often chosen when the structural model is quite intricate, involving numerous constructs and/or model associations. Secondly, when the study is based on a fairly limited sample size, PLS-SEM is typically preferred over CB-SEM.
4.5. Ethics
Every participant received information, both through the early invitation and on the website hosting the survey, that the research adhered to all appropriate ethical guidelines (sanctioned by the Research Ethics Committee of King Saud University, KSU-HE-12-242). It was also made clear that all data gathering and processing would be completely anonymized. Although no rewards/incentives were provided to stimulate contribution, a minor contribution to a charitable organization was pledged for each completed and valid response.
5. Results
5.1. Testing the Measurement Model
In this research, factor analysis (FA) is used to recognize the hidden factors represented by a group of variables/items, in addition to examining model fit, convergent validity, and discriminant validity. To effectively employ FA, we primarily measured the appropriateness of the sample using the Kaiser–Meyer–Olkin (KMO) measure of sampling suitability. This resulted in a value of 0.881, which is greater than the suggested minimum of 0.7 [92]. Subsequently, Bartlett’s test of sphericity was employed to test the hypothesis that the correlation matrix is an identity matrix. The obtained result was statistically significant (p-value < 0.05). The findings from both the Kaiser–Meyer–Olkin (KMO) measure and Bartlett’s test of sphericity provided evidence supporting the appropriateness of factor analysis (FA) for this study.
In terms of the indices of model fit, all the derived values were confirmed to be within the adequate range, thus meeting the standards proposed by Hair et al. [93] and Hu and Bentler [94]. The indices of model fit for the structural model are presented in Table 3 below.
Table 3.
The indices of model fit.
Additionally, as revealed in Table 1, the factor loadings assigned to separate items were noteworthy, with values spanning 0.729 to 0.914. This underscores the convergent validity, confirming that every item properly measured its corresponding factor. As mentioned in Section 4.1, the items for process complexity were not specifically targeted toward capturing the surveyees’ inclination towards DT and its usefulness in building a smart city. To address this concern, we conducted an additional FA without including the process complexity construct to examine its impact on the FA structure. The results of this analysis can be found in Appendix A, where a slight change in the FA structure is observed. It is important to note that although the removal of the process complexity construct led to minor adjustments in the loadings and intercorrelations of the remaining constructs, the overall relationships among them were maintained. Based on the findings from this additional analysis, we have decided to include the process complexity construct in the remaining analysis. This decision is driven by the recognition that the construct, while not directly related to the surveyees’ inclination towards DT, still contributes valuable insights into the perceived challenges and difficulties associated with the implementation and acceptance of DT within smart cities. We will further discuss the implications of the process complexity construct in the discussion section of the manuscript.
Cronbach’s Alpha (CA) was employed as a measure of internal consistency. As exposed in Table 4, the CA result for each construct fluctuated between 0.78 and 0.85, while the Composite Reliability (CR) values exceeded the recommended edge of 0.70, with a range of 0.83 to 0.85. These outcomes denote robust internal consistency within each construct, implying accurate measurement of the intended latent construct [92,95]. Appendix A shows the results of Correlations, CR, CA, and AVE without including the process complexity construct in the analysis. It also exhibits a slight change in the results.
Table 4.
The result of Correlations, CR, CA, and AVE.
A discriminant validity assessment was also carried out to confirm acceptable differences between constructs and their corresponding measurements [93]. This evaluation associates the square root of the Average Variance Extracted (AVE) for individual constructs per its correlation result. The mandatory condition is that the square root of the AVE should exceed a correlation value of 0.50 [93]. As can be seen in Table 4, these critical conditions are successfully met in this study.
Finally, the study investigated multicollinearity, which occurs when there is a strong correlation among independent variables [91,92]. To evaluate this, both the Variance Inflation Factor (VIF) and tolerance values were examined. It was determined that the VIF value was under three, and the tolerance value was greater than two, thus conforming to the guidelines proposed by Hair et al. [89].
Drawing from the aforementioned findings, the measurement model can be considered both valid and reliable, exhibiting robust model fit, convergent validity, and discriminant validity.
5.2. Issue of Common Method Variance and Bias
Common Method Variance (CMV) represents a form of methodical error that can arise once data is collected from only one source [91]. As this is the case in this research, Harman’s single-factor assessment was used to inspect for CMV. However, the results of this test were negative (no evidence of CMV). A test for Common Method Bias (CMB) was also carried out. CMB is a specific form of CMV that can emerge once the equal response measure is used [89,91,96]. The CMB test used was the common latent factor method, which did not indicate the presence of CMB. It can consequently be concluded that neither CMV nor CMB had any impact on the study, thereby strengthening the reliability and validity of the outcomes.
5.3. Findings of the Research Hypotheses
A Structural Equation Modeling (SEM) methodology was used to evaluate the psychometric attributes of the measurement model and validate the proposed hypotheses. SEM is a statistical method that facilitates the inspection of correlations between various variables. As exposed in Figure 2, the analysis discovered that both management support and perceived indirect/direct benefits exert a positive impact on the intention to accept DT in smart cities, whereas process complexity (resulting in RTC) and inertia negatively affect the intention to adopt DT in smart cities (accounting for 71.3% of the variance). This finding supports hypotheses H1 through H5. Appendix A shows the result of SEM without including the process complexity construct in the analysis, which also exhibited a slight change in the results.

Figure 2.
Illustration of the research model (results of structural model). Note: ***: 0.001 significance.
Table 5 presents the t-values and standardized path coefficients of the model. All t-values were found to be significant, indicating statistically significant associations among the variables. The standardized path coefficients provide insights into the extent of these associations. In conclusion, the SEM analysis offers compelling support for the model proposed in this study.
Table 5.
The path coefficients and t-test value for the full sample.
6. Discussion and Conclusions
In this research, we investigated the attitudes of city and other organizational employees towards the acceptance or rejection of DT implementation in the setting of smart cities. Through a comprehensive analysis, we found both external and internal factors that either encourage or discourage employees’ decision to embrace DT. Our findings provide strong support for all the investigated hypotheses (H1 to H5), shedding light on the key determinants of DT acceptance within the smart city context.
In specific terms, we found that management support, direct benefits, and indirect benefits each have a positive relationship with intention to accept DT within the smart city context, while inertia and process complexity have a negative relationship with intention to accept DT. These findings underscore the importance of considering management support, direct benefits, indirect benefits, inertia, and process complexity when designing strategies for successful DT when transitioning to a smart city. By addressing these factors, organizations can create an environment that encourages employees to embrace and support DT initiatives, leading to more effective and successful transformation.
Previous studies on DT have mainly focused on defining and studying the phenomenon [1,40,81], although some have approached DT implementation from a strategic and innovative perspective [18,36,37]. Nevertheless, there are limited studies that explore the employee’s viewpoint, with a view to understanding how their mindset and reactions to DT can be influenced. This is a critical issue since DT typically brings about significant changes in working processes and practices at the micro level [1]. The outcomes of this study address this knowledge gap and contribute original insights to both the literature review and practice by demonstrating how to help the acceptance of DT among city and corporate employees and overcome potential obstacles.
6.1. Theoretical Implications
As the benefits of digital technology have become ever clearer, more and more cities across the globe have embarked on the journey to becoming ‘smart’—i.e., towards becoming a city that puts digital technologies at the heart of its operational model, in order to improve its public services and business models [1,35,97]. However, while the benefits of being a smart city are significant, the digital transformation (DT) process is complex, and usually requires major changes to the city’s management philosophy and processes. This, in turn, requires the definition and implementation of a range of new management roles, and the appointment of suitably experienced personnel to fill them [18,30,31]. DT can also result in the need for major changes in the working practices of employees, which can cause resentment and disruption.
Although the managerial and administrative aspects of the DT process are relatively well understood, less is known about how to minimize the disruptive effects of DT within the workforce. Persuading employees to embrace DT and its impact on working practices requires a more complete understanding of the factors that influence employees’ attitudes to DT and their readiness to accept and support change in a positive way. However, there are currently no studies that focus on this issue. This research aims to meet this gap. The researchers believe that its findings will prove useful to those involved with the implementation of DT.
One of these findings—that concerning management support—has a paradoxical nature, in that it both contradicts and supports the findings of previous research. This preceding research has found that management support plays a direct and positive part in successful DT [23,79,98,99]. However, although the current study found management support plays an important role in successful DT, it also found that this role is not direct—in fact, its positive influence is through the creation and delivery of indirect benefits. Administrative and managerial support, in other words, has a much more nuanced, though essentially positive, effect on successful DT.
The reason for this nuanced effect of management support lies in the previously noted fact that DT almost always demands major changes in working practices [8], which can require staff to re-train. This can place a responsibility on management personnel to go significantly beyond the provision of the necessary financial and logistical resources to enable change—they must also ensure that employees understand the need for DT and the benefits, both personal and societal, that will derive from it. This can require sophisticated communications and guidance strategies [19,79,80]. The successful implementation of such strategies can change employee mindsets, and thus have an indirect effect on encouraging them to embrace DT. This finding adds to the existing understanding of the role of management support and points to the need to consider indirect effects in future studies.
Another factor that contributes to the subtle character of the part of management support is organizational structure. This varies widely among different cities/organizations, and can result in a wide range of process complexity. More complex processes require higher levels of change and adaption, which typically results in greater resistance to change (RTC). Earlier studies have reported that the higher the levels of RTC, the greater the readiness of employees to embrace DT [22,82,84,100], and the outcomes of the present study support this finding. Process complexity is therefore considered to be a significant factor in employee readiness to accept DT, and can place a further burden on management to ensure positive employee attitudes through effective training and communication strategies.
Another factor that can affect worker attitudes towards DT is inertia, which, as was noted in Section 3.3, is a similar construct to RTC, but different in significant ways. The current study supports previous research [15] in finding that inertia negatively affects staff attitudes to DT. This study also emphasizes the need to consider the underlying psychology of employee inertia—that is, to consider the fact that inertia is usually a behavioral response to concerns about issues such as future employment status and personal competence. Management must therefore take appropriate steps to address these concerns.
Although inertia is different from RTC, this study found that inertia can act as a moderator between RTC and the readiness to embrace DT—i.e., that reducing the role of inertia can reduce or increase RTC, and therefore reduce or increase the readiness to accept DT. This is an addition to the existing knowledge base, as previous studies have considered only the direct relationship between inertia and DT acceptance [15]. The new insight could prove valuable to management and strategists, as it emphasizes the need to take into account indirect mechanisms for increasing the readiness to accept DT.
In summary, this study adds to the current knowledge on successful DT implementation strategies by exploring the subtle relationships between the factors that determine employee DT acceptance. The study’s findings show that there are internal and external influences, both of which can have a significant direct and indirect effect on employee attitudes to DT and, ultimately, their readiness to support change. The authors believe that the study offers insights for the managers and administrators of cities, as well as public and private organizations, that are implementing, or preparing to implement, the transition to a smart city. Further research could usefully seek to identify other factors that this study has not explored, and how their influence varies with social, political, and organizational context.
6.2. Practical Implications and Recommendations
The notion of the smart city is rapidly becoming firm across the world. It is a concept that is focused on the usage of connected digital technologies, also referred to as the IoT, to help make better decisions and expand the value of life for its residents [1,2,7]. These technologies typically deploy developments in areas such as machine intelligence and AI to build data sets that allow real-time decision-making, and create an infrastructure that addresses many different urban challenges. However, implementing these technologies, and developing a mindset that encourages their use, can be complex. This process, known as digital transformation (DT) is critical to the successful transition to a smart city [9,12,83]. Because DT requires significant change at an infrastructural level, which impacts all aspects of the organization, it is essential to achieve ‘buy-in’ from all personnel concerned. This is particularly true of the employees of the city (and subsidiary organizations), whose support (or lack of it) can, in principle, make the difference between a smooth and efficient DT process and total failure. This study has focused on this important group, with the aim of providing practical recommendations as to how to ensure its support for DT.
The findings of the study lead to some practical recommendations for ensuring an efficient and effective DT.
Awareness and training: Training strategies and programs should be designed and implemented to help employees understand the medium- and long-term benefits of DT, and to ensure they are equipped with appropriate skillsets to adapt to new working practices. Because of the dynamic and rapidly evolving nature of digital technology, a culture of continuous learning is most likely to ensure that workforce attitudes are matched to the aims of DT.
Involvement and collaboration: Workers who feel excluded or distanced from the DT process are likely to feel alienated from its goals, and show inertia and/or RTC. Management should therefore adopt an inclusive and collaborative approach, making sure that employees (or their representatives) play an active role in decision-making. Nurturing a value of collaboration, and inspiring employees to share thoughts, concepts, and feedback can inculcate positivity and support for the DT process.
Clear communications: Workforce concerns about the consequences of DT can lead to significant RTC, in both its active and passive forms. These concerns should therefore be minimized through the use of clear and honest communication channels that keep employees aware of changes that may affect them due to DT and the steps being taken by management to mitigate any potentially negative consequences.
Dedicated digital management team: Poor leadership in the form of ineffective planning and inexpert management often results in a lack of confidence from the workforce, leading to poor DT implementation. A leadership team that is highly experienced in transitioning from legacy infrastructures to digital technology should therefore be appointed. Such a team will not only inspire the confidence of employees, but understand the importance of liaising with them clearly, fairly, and effectively [10,13].
Personalized approach: To minimize the effects of inertia and RTC and maximize the direct/indirect benefits of management support, it is important to recognize that a workforce is comprised of individual workers who have individual needs/concerns. Management should exhibit a willingness to engage on an individual basis by providing privacy-assured channels that can deal with concerns or feedback on a personal level.
Incentives and rewards: Although all efforts should be made to encourage DT acceptance through the use of recommendations 1–5 above, rewards and incentives for active support by employees could be considered. These could take the form of promotion (with associated pay increases), employment benefits, etc. However, these incentives should be treated with care, so as not to attract cynicism and accusations of ‘bribery’, which could ultimately have the opposite effect to that desired.
7. Limitations and Future Research
This study provides valuable insights into how to improve the DT process in the setting of smart cities, but it is also vital to recognize that the research has some boundaries. First, as the research relies predominantly on data from Saudi municipal employees, its findings may not be universally applicable, especially in regions outside of the Middle East. Therefore, it would be valuable for future research to gather data from various countries, enabling a more generalizable understanding of the factors that help or impede the acceptance of DT in the setting of smart cities.
Another possible limitation of the study is the range of factors that impact employees’ readiness to embrace DT. Although this study has identified five key constructs and has shown them to be important, it is probable that others also exist, such as expectations, pressure, and satisfaction, each of which could influence employees’ willingness to accept DT. Future research may well practically add these factors into the model and consider using additional control variables to account for confounding factors.
Third, the research model of this research relies on cross-sectional data, suggesting that the findings denote correlations rather than causality. Subsequent studies might consider the use of longitudinal data to expand the current model, in order to provide a more precise perspective on the dynamics of DT adoption in smart cities over time. Further, our survey included over twenty-five items, which may have caused respondent fatigue, potentially leading to reduced response rates, hasty or negligent responses, or incomplete data. Future researchers could decrease the number of items to reduce the possibility of fatigue. Moreover, although an analysis for non-response bias found no statistically significant bias in this study (Section 4.3), future research should be mindful of this possibility, which can lead to an under-representation of certain perspectives and experiences, thereby constraining the generalizability of results. Lastly, this study, which primarily relies on quantitative research, may not fully capture the nuanced and in-depth insights necessary to understand the complex dynamics of DT within smart cities. Therefore, future research endeavors in the field of smart cities and DT could consider incorporating qualitative approaches to gain a richer and more comprehensive understanding of the multifaceted nature of these phenomena.
Author Contributions
Conceptualization, I.M. and A.A.; methodology, I.M. and A.A.; validation, I.M. and A.A.; formal analysis, I.M. and A.A.; writing—original draft preparation, I.M. and A.A.; writing—review and editing, I.M. and A.A. All authors have read and agreed to the published version of the manuscript.
Funding
This research was funded by the Researchers Supporting Project number (RSP2024R233), King Saud University, Riyadh, Saudi Arabia.
Institutional Review Board Statement
The study was carried out in accordance with the principles outlined in the Declaration of Helsinki and received approval from the Institutional Review Board (Human and Social Research) at King Saud University.
Informed Consent Statement
All participants involved in the study provided informed consent.
Data Availability Statement
Data can be made available upon request to ensure privacy restrictions are upheld.
Acknowledgments
The authors are grateful for the facilities and other support given by the Researchers Supporting Project number (RSP2024R233), King Saud University, Riyadh, Saudi Arabia.
Conflicts of Interest
The author declares no conflicts of interest.
Appendix A
Table A1.
The constructs (without process complexity) along with the corresponding survey items and their associated factor loadings.
Table A1.
The constructs (without process complexity) along with the corresponding survey items and their associated factor loadings.
| Construct/Factor | Item | Factor Loading |
|---|---|---|
| Intention | I plan to support any changes required by the digital transformation (DT) process. | 0.743 |
| I intend to be as helpful as I reasonably can to ensure a smooth digital transformation (DT) process. | 0.770 | |
| I can see the value in a digital transformation to a smart city. | 0.756 | |
| Inertia | I will continue using my current methods in my role, as changing to digital methods could be stressful. | 0.838 |
| I will keep using my current methods in my job, unless there is a clear benefit to me in changing to digital methods. | 0.811 | |
| I will not switch to digital methods, even though they may be more efficient and effective. | 0.891 | |
| Managerial Support | The management supports employees in deploying the DT requirements of a smart city. | 0.744 |
| The management recognizes the potential benefits of supporting employees through the DT process. | 0.829 | |
| The management encourages DT to smart city status. | 0.799 | |
| The management provides employees with all necessary resources to facilitate DT in our smart city initiatives. | 0.785 | |
| Direct Benefits | Implementing DT will help me work more efficiently and effectively. | 0.834 |
| The process of implementing DT will provide me with new and exciting opportunities in my job. | 0.801 | |
| Implementing DT will make my role easier and less prone to error. | 0.843 | |
| Indirect Benefits | Implementing DT can enhance our city’s reputation as a smart city | 0.771 |
| The deployment of DT can increase our city’s attractiveness to enterprises. | 0.896 | |
| Implementing DT can support other urban management practices. | 0.844 | |
| Deploying DT can improve our city’s services to citizens. | 0.901 | |
| Implementing DT can strengthen relationships with our smart city partners. | 0.842 |
Table A2.
The constructs (without process complexity) result of Correlations, CR, CA, and AVE.
Table A2.
The constructs (without process complexity) result of Correlations, CR, CA, and AVE.
| Construct/Factor | CA | CR | AVE | Correlations | ||||
|---|---|---|---|---|---|---|---|---|
| 1 | 2 | 3 | 4 | 5 | ||||
| Intention | 0.86 | 0.87 | 0.77 | 0.88 | ||||
| Inertia | 0.83 | 0.84 | 0.75 | 0.54 | 0.87 | |||
| Managerial Support | 0.81 | 0.86 | 0.69 | 0.65 | 0.67 | 0.83 | ||
| Direct Benefits | 0.84 | 0.81 | 0.66 | 0.58 | 0.62 | 0.71 | 0.81 | |
| Indirect Benefits | 0.84 | 0.79 | 0.66 | 0.55 | 0.62 | 0.65 | 0.53 | 0.81 |
Note: the square root of AVE is highlighted in bold.
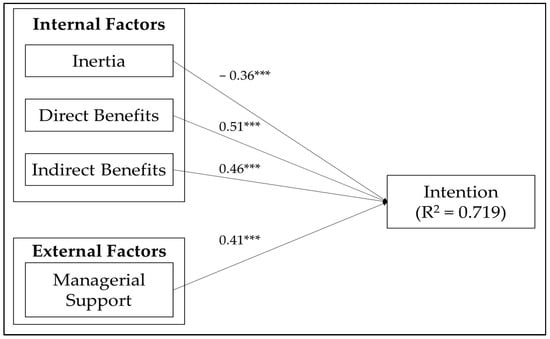
Figure A1.
Illustration of the research model (results of structural model) (without process complexity). Note: ***: 0.001 significance.
References
- Vial, G. Understanding Digital Transformation: A Review and a Research Agenda. J. Strateg. Inf. Syst. 2019, 28, 118–144. [Google Scholar] [CrossRef]
- Burns, R.; Welker, P. Interstitiality in the Smart City: More than Top-down and Bottom-up Smartness. Urban Stud. 2023, 60, 308–324. [Google Scholar] [CrossRef]
- Turel, O. Quitting the Use of a Habituated Hedonic Information System: A Theoretical Model and Empirical Examination of Facebook Users. Eur. J. Inf. Syst. 2015, 24, 431–446. [Google Scholar] [CrossRef]
- Tabrizi, B.; Lam, E.; Girard, K.; Irvin, V. Digital Transformation Is Not About Technology. Harv. Bus. Rev. 2019, 13, 1–6. [Google Scholar]
- Skóra, A.; Srebalová, M.; Papáčová, I. Administrative Judiciary Is Looking for a Balance in a Crisis. Jurid. Trib. 2022, 12, 5–20. [Google Scholar] [CrossRef]
- Mora, L.; Bolici, R.; Deakin, M. The First Two Decades of Smart-City Research: A Bibliometric Analysis. J. Urban. Technol. 2017, 24, 3–27. [Google Scholar] [CrossRef]
- Ji, T.; Chen, J.-H.; Wei, H.-H.; Su, Y.-C. Towards People-Centric Smart City Development: Investigating the Citizens’ Preferences and Perceptions about Smart-City Services in Taiwan. Sustain. Cities Soc. 2021, 67, 102691. [Google Scholar] [CrossRef]
- Verhoef, P.C.; Broekhuizen, T.; Bart, Y.; Bhattacharya, A.; Qi Dong, J.; Fabian, N.; Haenlein, M. Digital Transformation: A Multidisciplinary Reflection and Research Agenda. J. Bus. Res. 2021, 122, 889–901. [Google Scholar] [CrossRef]
- Calzada, I. (Un)Plugging Smart Cities with Urban Transformations towards Multi-Stakeholder City-Regional Complex Urbanity? RBS Rev. Estud. Urbanos Cienc. Soc. 2016, 6, 25–45. [Google Scholar]
- Wessel, L.; Baiyere, A.; Ologeanu-Taddei, R.; Cha, J.; Blegind Jensen, T. Unpacking the Difference Between Digital Transformation and IT-Enabled Organizational Transformation. J. Assoc. Inf. Syst. 2021, 22, 102–129. [Google Scholar] [CrossRef]
- Pavelek, O.; Zajíčková, D. Compensation for Non-Material Damage Caused to Legal Entities in the Decision-Making Practice of the CJEU and the ECHR. Jurid. Trib. 2023, 13, 331–345. [Google Scholar] [CrossRef]
- Kitchin, R.; Moore-Cherry, N. Fragmented Governance, the Urban Data Ecosystem and Smart City-Regions: The Case of Metropolitan Boston. Reg. Stud. 2020, 55, 1913–1923. [Google Scholar] [CrossRef]
- Akbari, A. Authoritarian Smart City: A Research Agenda. Surveill. Soc. 2022, 20, 441–449. [Google Scholar] [CrossRef]
- Principale, S.; Cosentino, A.; Lombardi, R.; Rocchi, A. Public Administration in Smart City: A Bibliometric Analysis. J. Public Aff. 2023, 23, e2863. [Google Scholar] [CrossRef]
- Polites, G.L.; Karahanna, E. Shackled to the Status Quo: The Inhibiting Effects of Incumbent System Habit, Switching Costs, and Inertia on New System Acceptance. MIS Q. 2012, 36, 21. [Google Scholar] [CrossRef]
- Visvizi, A. Computers and Human Behavior in the Smart City: Issues, Topics, and New Research Directions. Comput. Hum. Behav. 2023, 140, 107596. [Google Scholar] [CrossRef]
- Tomáš, P. A Few Remarks on the (Im)Perfection of the Term Securities: A Theoretical Study. Jurid. Trib. 2021, 11, 135–149. [Google Scholar] [CrossRef]
- Davison, R.M.; Wong, L.H.; Peng, J. The Art of Digital Transformation as Crafted by a Chief Digital Officer. Int. J. Inf. Manag. 2023, 69, 102617. [Google Scholar] [CrossRef]
- Števček, M.; Ivančo, M. The Conception of Civil Procedure in the Slovak Republic. Jurid. Trib. J. = Trib. Jurid. 2017, 17, 119–135. [Google Scholar]
- Venkatesh, V.; Bala, H. Technology Acceptance Model 3 and a Research Agenda on Interventions. Decis. Sci. 2008, 39, 273–315. [Google Scholar] [CrossRef]
- Peráček, T. Flexibility of Creating and Changing Employment in the Options of the Slovak Labor Code. Probl. Perspect. Manag. 2021, 19, 373–382. [Google Scholar] [CrossRef]
- Kim, H.W.; Kankanhalli, A. Investigating User Resistance to Information Systems Implementation: A Status Quo Bias Perspective. MIS Q. 2009, 33, 567. [Google Scholar] [CrossRef]
- Julsrud, T.E.; Krogstad, J.R. Is There Enough Trust for the Smart City? Exploring Acceptance for Use of Mobile Phone Data in Oslo and Tallinn. Technol. Forecast. Soc. Chang. 2020, 161, 120314. [Google Scholar] [CrossRef]
- Khorsand, P.N.N.-H. Implementation of a Working Time Recording System as a Digital Management Tool in Public Administration. Adm. Sci. 2023, 13, 253. [Google Scholar] [CrossRef]
- Hahn, T.; Figge, F.; Pinkse, J.; Preuss, L. A Paradox Perspective on Corporate Sustainability: Descriptive, Instrumental, and Normative Aspects. J. Bus. Ethics 2018, 148, 235–248. [Google Scholar] [CrossRef]
- Turel, O.; Zhang, Y.J. Should I E-Collaborate with This Group? A Multilevel Model of Usage Intentions. Inf. Manag. 2011, 48, 62–68. [Google Scholar] [CrossRef]
- Asharq Al Awsat. Saudi Arabia Adopts Smart City Strategy. 9 February 2022. Available online: https://english.aawsat.com/home/article/3464921/saudi-arabia-adopts-smart-city-strategy (accessed on 23 September 2023).
- Dameri, R.P. Smart City Definition, Goals and Performance; Progress in IS; Springer: Cham, Switzerland, 2017; pp. 1–22. [Google Scholar] [CrossRef]
- Liang, H.; Xue, Y. Avoidance of Information Technology Threats: A Theoretical Perspective. MIS Q. 2009, 33, 71. [Google Scholar] [CrossRef]
- Lytras, M.D.; Visvizi, A. Information Management as a Dual-Purpose Process in the Smart City: Collecting, Managing and Utilizing Information. Int. J. Inf. Manag. 2021, 56, 102224. [Google Scholar] [CrossRef]
- Hollands, R.G. Will the Real Smart City Please Stand Up? City 2008, 12, 303–320. [Google Scholar] [CrossRef]
- Cacioppo, J.T.; Berntson, G.G. Relationship between Attitudes and Evaluative Space: A Critical Review, with Emphasis on the Separability of Positive and Negative Substrates. Psychol. Bull. 1994, 115, 401–423. [Google Scholar] [CrossRef]
- Kramer, R.M. Trust and Distrust in Organizations: Emerging Perspectives, Enduring Questions. Annu. Rev. Psychol. 1999, 50, 569–598. [Google Scholar] [CrossRef]
- Cristina Elena POPA. About the Human Rights and Consumer Protection in the Digital Age of Digital Services Act 2022 or What Aspects Interested Investors Should Pay Attention To. Int. Investig. Law J. 2023, 3, 121. [Google Scholar]
- Hollands, R.G. Critical Interventions into the Corporate Smart City. Camb. J. Reg. Econ. Soc. 2015, 8, 61–77. [Google Scholar] [CrossRef]
- Dirsehan, T.; van Zoonen, L. Smart City Technologies from the Perspective of Technology Acceptance. IET Smart Cities 2022, 4, 197–210. [Google Scholar] [CrossRef]
- Adje, K.D.C.; Ben Letaifa, A.; Haddad, M.; Habachi, O. Smart City Based on Open Data: A Survey. IEEE Access 2023, 11, 56726–56748. [Google Scholar] [CrossRef]
- Martin, W.; Tomas, P. Data management in industrial companies: The case of Austria. Int. J. Qual. Res. 2023, 17, 847–866. [Google Scholar] [CrossRef]
- Bakıcı, T.; Almirall, E.; Wareham, J. A Smart City Initiative: The Case of Barcelona. J. Knowl. Econ. 2013, 4, 135–148. [Google Scholar] [CrossRef]
- Jiang, H.; Jiang, P.; Wang, D.; Wu, J. Can Smart City Construction Facilitate Green Total Factor Productivity? A Quasi-Natural Experiment Based on China’s Pilot Smart City. Sustain. Cities Soc. 2021, 69, 102809. [Google Scholar] [CrossRef]
- Fontaine, P.; Minner, S.; Schiffer, M. Smart and Sustainable City Logistics: Design, Consolidation, and Regulation. Eur. J. Oper. Res. 2023, 307, 1071–1084. [Google Scholar] [CrossRef]
- Liu, F.; Damen, N.; Chen, Z.; Shi, Y.; Guan, S.; Ergu, D. Identifying Smart City Leaders and Followers with Machine Learning. Sustainability 2023, 15, 9671. [Google Scholar] [CrossRef]
- Al Sharif, R.; Pokharel, S. Smart City Dimensions and Associated Risks: Review of Literature. Sustain. Cities Soc. 2022, 77, 103542. [Google Scholar] [CrossRef]
- Abu-Rayash, A.; Dincer, I. Development and Application of an Integrated Smart City Model. Heliyon 2023, 9, e14347. [Google Scholar] [CrossRef]
- Chang, S.; Smith, M.K. Residents’ Quality of Life in Smart Cities: A Systematic Literature Review. Land 2023, 12, 876. [Google Scholar] [CrossRef]
- AlNuaimi, B.K.; Kumar Singh, S.; Ren, S.; Budhwar, P.; Vorobyev, D. Mastering Digital Transformation: The Nexus between Leadership, Agility, and Digital Strategy. J. Bus. Res. 2022, 145, 636–648. [Google Scholar] [CrossRef]
- Sweeting, D.; de Alba-Ulloa, J.; Pansera, M.; Marsh, A. Easier Said than Done? Involving Citizens in the Smart City. Environ. Plan. C Politics Space 2022, 40, 1365–1381. [Google Scholar] [CrossRef]
- Russo, F.; Rindone, C.; Panuccio, P. The Process of Smart City Definition at an EU Level. WIT Trans. Ecol. Environ. 2014, 191, 979–989. [Google Scholar] [CrossRef]
- Mutambik, I.; Lee, J.; Almuqrin, A.; Alkhanifer, A.; Baihan, M. Gulf Cooperation Council Countries and Urbanisation: Are Open Government Data Portals Helping? Sustainability 2023, 15, 12823. [Google Scholar] [CrossRef]
- Sharma, R.; Yetton, P. The Contingent Effects of Management Support and Task Interdependence on Successful Information Systems Implementation. MIS Q. 2003, 27, 533. [Google Scholar] [CrossRef]
- Nam, T.; Pardo, T.A. Conceptualizing Smart City with Dimensions of Technology, People, and Institutions. In Proceedings of the 12th Annual International Digital Government Research Conference: Digital Government Innovation in Challenging Times, College Park, MD, USA, 12–15 June 2011; ACM: New York, NY, USA, 2011; pp. 282–291. [Google Scholar] [CrossRef]
- Lee, S. The Acceptance Model of Smart City Service: Focused on Seoul. Sustainability 2023, 15, 2695. [Google Scholar] [CrossRef]
- Kaššaj, M. Sustainable Connectivity—Integration of Mobile Roaming, WiFi4EU and Smart City Concept in the European Union. Sustainability 2024, 16, 788. [Google Scholar] [CrossRef]
- Chen, Z.; Chan, I.C.C. Smart Cities and Quality of Life: A Quantitative Analysis of Citizens’ Support for Smart City Development. Inf. Technol. People 2023, 36, 263–285. [Google Scholar] [CrossRef]
- Lytras, M.; Visvizi, A. Who Uses Smart City Services and What to Make of It: Toward Interdisciplinary Smart Cities Research. Sustainability 2018, 10, 1998. [Google Scholar] [CrossRef]
- Edmondson, A. Psychological Safety and Learning Behavior in Work Teams. Adm. Sci. Q. 1999, 44, 350–383. [Google Scholar] [CrossRef]
- Kim, S.-C.; Hong, P.; Lee, T.; Lee, A.; Park, S.-H. Determining Strategic Priorities for Smart City Development: Case Studies of South Korean and International Smart Cities. Sustainability 2022, 14, 10001. [Google Scholar] [CrossRef]
- Vidiasova, L.; Cronemberger, F. Discrepancies in Perceptions of Smart City Initiatives in Saint Petersburg, Russia. Sustain. Cities Soc. 2020, 59, 102158. [Google Scholar] [CrossRef]
- Ismagilova, E.; Hughes, L.; Rana, N.P.; Dwivedi, Y.K. Security, Privacy and Risks Within Smart Cities: Literature Review and Development of a Smart City Interaction Framework. Inf. Syst. Front. 2022, 24, 393–414. [Google Scholar] [CrossRef]
- Breslow, H. The Smart City and the Containment of Informality: The Case of Dubai. Urban. Stud. 2021, 58, 471–486. [Google Scholar] [CrossRef]
- El-Taliawi, O.G. Resistance to Organizational Change. In Global Encyclopedia of Public Administration, Public Policy, and Governance; Springer International Publishing: Cham, Switzerland, 2018; pp. 1–4. [Google Scholar] [CrossRef]
- Ali, M.; Zhou, L.; Miller, L.; Ieromonachou, P. User Resistance in IT: A Literature Review. Int. J. Inf. Manag. 2016, 36, 35–43. [Google Scholar] [CrossRef]
- Fang, Y.; Shan, Z. How to Promote a Smart City Effectively? An Evaluation Model and Efficiency Analysis of Smart Cities in China. Sustainability 2022, 14, 6512. [Google Scholar] [CrossRef]
- Lee, D.; Lee, S. Investigating Media-User Interaction for Public Play Space in a Smart City. Appl. Sci. 2022, 12, 11882. [Google Scholar] [CrossRef]
- Hadi Khorsand, P.N.N.; Bajzíková, Ľ. The Link between Knowledge Management and the Implementation of a Working Time Recording System in the Home Office. Cogent Soc. Sci. 2023, 9, 2281287. [Google Scholar] [CrossRef]
- Novackova, D.; Peracek, T. Financial Crime in Economic Affairs: Case Study of the Slovak Republic. Jurid. Trib. 2020, 10, 142. [Google Scholar]
- Lee, N.C.-A.; Chang, J.Y.T. Adapting ERP Systems in the Post-Implementation Stage: Dynamic IT Capabilities for ERP. Pac. Asia J. Assoc. Inf. Syst. 2020, 12, 28–59. [Google Scholar] [CrossRef]
- Freeze, R.D.; Schmidt, P.J. To Use or Not to Use—ERP Resistance Is the Question: The Roles of Tacit Knowledge and Complexity. Decis. Sci. J. Innov. Educ. 2015, 13, 247–272. [Google Scholar] [CrossRef]
- Li, L.; Taeihagh, A.; Tan, S.Y. What Factors Drive Policy Transfer in Smart City Development? Insights from a Delphi Study. Sustain. Cities Soc. 2022, 84, 104008. [Google Scholar] [CrossRef]
- Samuelson, W.; Zeckhauser, R. Status Quo Bias in Decision Making. J. Risk Uncertain. 1988, 1, 7–59. [Google Scholar] [CrossRef]
- Yigitcanlar, T.; Kankanamge, N.; Vella, K. How Are Smart City Concepts and Technologies Perceived and Utilized? A Systematic Geo-Twitter Analysis of Smart Cities in Australia. J. Urban. Technol. 2021, 28, 135–154. [Google Scholar] [CrossRef]
- Wood, W.; Rünger, D. Psychology of Habit. Annu. Rev. Psychol. 2016, 67, 289–314. [Google Scholar] [CrossRef]
- Prakash, A.V.; Das, S. Medical Practitioner’s Adoption of Intelligent Clinical Diagnostic Decision Support Systems: A Mixed-Methods Study. Inf. Manag. 2021, 58, 103524. [Google Scholar] [CrossRef]
- Michelotto, F.; Joia, L.A. Unveiling the Smart City Concept: Perspectives from an Emerging Market via the Social Representation Theory. Sustainability 2023, 15, 8155. [Google Scholar] [CrossRef]
- Mora, L.; Deakin, M.; Reid, A. Strategic Principles for Smart City Development: A Multiple Case Study Analysis of European Best Practices. Technol. Forecast. Soc. Chang. 2019, 142, 70–97. [Google Scholar] [CrossRef]
- Fischhoff, B.; Slovic, P.; Lichtenstein, S.; Read, S.; Combs, B. How Safe Is Safe Enough? A Psychometric Study of Attitudes towards Technological Risks and Benefits. Policy Sci. 1978, 9, 127–152. [Google Scholar] [CrossRef]
- Kuan, K.K.Y.; Chau, P.Y.K. A Perception-Based Model for EDI Adoption in Small Businesses Using a Technology–Organization–Environment Framework. Inf. Manag. 2001, 38, 507–521. [Google Scholar] [CrossRef]
- Mutambik, I.; Almuqrin, A.; Lee, J.; Gauthier, J.; Homadi, A. Open Government Data in Gulf Cooperation Council Countries: An Analysis of Progress. Sustainability 2022, 14, 7200. [Google Scholar] [CrossRef]
- Kashef, M.; Visvizi, A.; Troisi, O. Smart City as a Smart Service System: Human-Computer Interaction and Smart City Surveillance Systems. Comput. Hum. Behav. 2021, 124, 106923. [Google Scholar] [CrossRef]
- Shao, Z.; Feng, Y.; Hu, Q. Impact of Top Management Leadership Styles on ERP Assimilation and the Role of Organizational Learning. Inf. Manag. 2017, 54, 902–919. [Google Scholar] [CrossRef]
- Rjab, A.B.; Mellouli, S.; Corbett, J. Barriers to Artificial Intelligence Adoption in Smart Cities: A Systematic Literature Review and Research Agenda. Gov. Inf. Q. 2023, 40, 101814. [Google Scholar] [CrossRef]
- Joh, E.E. Policing the Smart City. Int. J. Law. Context 2019, 15, 177–182. [Google Scholar] [CrossRef]
- Hanelt, A.; Bohnsack, R.; Marz, D.; Antunes Marante, C. A Systematic Review of the Literature on Digital Transformation: Insights and Implications for Strategy and Organizational Change. J. Manag. Stud. 2021, 58, 1159–1197. [Google Scholar] [CrossRef]
- Oh, D.-S.; Phillips, F.Y.; Mohan, A.V. Smart City 2.0; World Scientific: Singapore, 2023; Volume 8. [Google Scholar] [CrossRef]
- Kaplowitz, M.D.; Hadlock, T.D.; Levine, R. A Comparison of Web and Mail Survey Response Rates. Public. Opin. Q. 2004, 68, 94–101. [Google Scholar] [CrossRef]
- Denscombe, M. Web-Based Questionnaires and the Mode Effect. Soc. Sci. Comput. Rev. 2006, 24, 246–254. [Google Scholar] [CrossRef]
- Armstrong, J.S.; Overton, T.S. Estimating Nonresponse Bias in Mail Surveys. J. Mark. Res. 1977, 14, 396–402. [Google Scholar] [CrossRef]
- Cristina Elena POPA. Ranking of Treatment Standards in International Investments. Int. Investig. Law J. 2021, 1, 79–87. [Google Scholar]
- Hair, J.F.; Ringle, C.M.; Sarstedt, M. PLS-SEM: Indeed a Silver Bullet. J. Mark. Theory Pract. 2011, 19, 139–152. [Google Scholar] [CrossRef]
- Rigdon, E.E.; Sarstedt, M.; Ringle, C.M. On Comparing Results from CB-SEM and PLS-SEM: Five Perspectives and Five Recommendations. Mark. ZFP 2017, 39, 4–16. [Google Scholar] [CrossRef]
- Hair, J.F., Jr.; Matthews, L.M.; Matthews, R.L.; Sarstedt, M. PLS-SEM or CB-SEM: Updated Guidelines on Which Method to Use. Int. J. Multivar. Data Anal. 2017, 1, 107. [Google Scholar] [CrossRef]
- Field, A.P. Discovering Statistics Using IBM SPSS Statistics: And Sex and Drugs and Rock “n” Roll; Sage: Los Angeles, CA, USA, 2013. [Google Scholar]
- Hair, J.F.; Howard, M.C.; Nitzl, C. Assessing Measurement Model Quality in PLS-SEM Using Confirmatory Composite Analysis. J. Bus. Res. 2020, 109, 101–110. [Google Scholar] [CrossRef]
- Hu, L.; Bentler, P.M. Cutoff Criteria for Fit Indexes in Covariance Structure Analysis: Conventional Criteria versus New Alternatives. Struct. Equ. Model. 1999, 6, 1–55. [Google Scholar] [CrossRef]
- Bagozzi, R.P.; Yi, Y. On the Evaluation of Structural Equation Models. J. Acad. Mark. Sci. 1988, 16, 74–94. [Google Scholar] [CrossRef]
- Kalidien, S.; van Witzenburg, R.; Choenni, S. Developing, Implementing, and Evaluating a Web Interface in the Field of E-Government; IGI Global: Hershey, PA, USA, 2014; pp. 60–70. [Google Scholar] [CrossRef]
- Lytras, M.; Visvizi, A.; Sarirete, A. Clustering Smart City Services: Perceptions, Expectations, Responses. Sustainability 2019, 11, 1669. [Google Scholar] [CrossRef]
- Gangwar, H.; Date, H.; Raoot, A.D. Review on IT Adoption: Insights from Recent Technologies. J. Enterp. Inf. Manag. 2014, 27, 488–502. [Google Scholar] [CrossRef]
- Praharaj, S.; Han, H. Cutting through the Clutter of Smart City Definitions: A Reading into the Smart City Perceptions in India. City Cult. Soc. 2019, 18, 100289. [Google Scholar] [CrossRef]
- Del-Real, C.; Ward, C.; Sartipi, M. What Do People Want in a Smart City? Exploring the Stakeholders’ Opinions, Priorities and Perceived Barriers in a Medium-Sized City in the United States. Int. J. Urban. Sci. 2023, 27 (Suppl. S1), 50–74. [Google Scholar] [CrossRef]
Disclaimer/Publisher’s Note: The statements, opinions and data contained in all publications are solely those of the individual author(s) and contributor(s) and not of MDPI and/or the editor(s). MDPI and/or the editor(s) disclaim responsibility for any injury to people or property resulting from any ideas, methods, instructions or products referred to in the content. |
© 2024 by the authors. Licensee MDPI, Basel, Switzerland. This article is an open access article distributed under the terms and conditions of the Creative Commons Attribution (CC BY) license (https://creativecommons.org/licenses/by/4.0/).