Article

Spatial Distribution of Soil Carbon and Nitrogen Content in the Danjiangkou Reservoir Area and Their Responses to Land-Use Types

1
College of Earth Sciences, Jilin University, Changchun 130061, China
2
Hubei Key Laboratory of Wetland Evolution & Ecological Restoration, Wuhan Botanical Garden, Chinese Academy of Sciences, Wuhan 430074, China
3
Danjiangkou Wetland Ecosystem Field Scientific Observation and Research Station, The Chinese Academy of Sciences & Hubei Province, Wuhan 430074, China
*
Authors to whom correspondence should be addressed.
Sustainability 2024, 16(1), 444; https://doi.org/10.3390/su16010444
Submission received: 6 December 2023 / Revised: 29 December 2023 / Accepted: 2 January 2024 / Published: 4 January 2024
(This article belongs to the Special Issue BRICS Soil Management for Sustainable Agriculture)

Abstract

:
Understanding the spatial distribution of soil properties is essential for comprehending soil fertility, predicting ecosystem productivity, enhancing environmental quality, promoting sustainable agriculture, and addressing global climate change. This study focuses on investigating the spatial distribution and influencing factors of soil carbon (C) and nitrogen (N) in the Danjiangkou Reservoir area, a vital water source for the South-to-North Water Transfer Project. Utilizing both geostatistical and traditional statistical methods, this research explores the impact of various land-use types—such as orchards, drylands, paddy fields, and Hydro-Fluctuation Belts (HF belts)—on soil C and N content. The findings reveal predominantly low levels of soil organic carbon (SOC) (ranging from 2.95 to 21.50 g·kg−1), total nitrogen (TN) (ranging from 0.27 to 2.44 g·kg−1), and available nitrogen (AN) (ranging from 18.20 to 170.45 mg·kg−1), mostly falling into deficient categories. Notably, spatial variability is observed, especially in agriculturally developed regions, leading to areas of enrichment. Paddy fields and HF belts are identified as influential contributors to increased SOC and nitrogen content compared to orchards and drylands. Correlation and stepwise regression analyses unveil intricate interactions among SOC, TN, AN, and environmental factors, underscoring the necessity for a holistic approach to soil management. This study emphasizes the critical role of adopting rational land-use types and sustainable agricultural practices for effective soil management in the Danjiangkou Reservoir area.

1. Introduction

Soil, a naturally intricate entity shaped by factors such as climate, biology, parent material, topography, soil formation time, and human activities, exhibits complex spatiotemporal variability [1]. Soil carbon (C) and nitrogen (N) are not only vital components of ecosystem health but also pivotal indicators for assessing soil quality [2]. Serving as essential nutrients for plant growth and metabolism, they facilitate soil organic matter (SOM) formation, regulate water cycles, maintain soil fertility, enhance plant stress resistance, and participate in biogeochemical cycles [3]. The study of soil C and N content and their spatial distribution is crucial for comprehending soil fertility, predicting ecosystem productivity, enhancing environmental quality, promoting sustainable agriculture, and addressing global climate change [4].
The rapid evolution of precision soil management has attracted considerable attention, especially concerning the spatial variability of soil C and N nutrients [4,5]. Researchers employ geostatistical analysis, semivariogram functions, random forest methods, support vector machines, and other approaches to investigate the spatial variability, distribution patterns, and variation laws of soil nutrients [6,7,8]. Extensive research has concentrated on indicators such as SOM, N, phosphorus, potassium, and soil acidity–alkalinity [1,9,10,11]. Additionally, studies building on spatial analysis explore factors influencing spatial variation patterns through correlation analyses with climate, topography, soil physicochemical properties, and other elements [4,12]. As our understanding of the spatial variability of soil C and N deepens, its applications expand, providing scientific foundations for decision-making in agriculture management, land-use planning, ecological restoration, and related fields [13].
Land use emerges as a pivotal factor shaping the spatial distribution of soil C and N, evident in shifts in land-use types, variations in land utilization intensity, the interplay between land-use types and climate change, and soil management practices [8,14]. These dynamics can lead to the depletion or accrual of SOM and N, significantly influencing soil fertility and ecosystem functions [14]. Distinct land-use types yield varying levels of soil C and N content [15]. Forests and grasslands, for instance, foster the accumulation of SOM. In contrast, agricultural fields may exhibit lower SOM due to cultivation, fertilization, and pollution, yet they may harbor higher N content [16,17]. The transformation of forests or grasslands into agricultural fields, coupled with excessive development and over-cultivation, can diminish SOM and N [18]. Conversely, conservation tillage and organic farming practices have the potential to enhance SOM and N content [19]. The impact of land use on soil C and N distribution is intricate, involving diverse factors and processes [17]. Investigating this influence provides a scientific basis for formulating judicious land-use and -management strategies, safeguarding the ecological environment, and fostering sustainable agricultural development [18].
The Danjiangkou Reservoir, a vital water source for the Middle Route Project of the South-to-North Water Transfer, is situated in the transitional zone between southern and northern climates. Boasting over 50% rocky mountainous terrain and hilly gullies, the region’s diverse land use includes water resource conservation areas (comprising forests, grasslands, shrublands, hydro-fluctuation belt (HF belt) wetlands, and water bodies), agricultural development zones (encompassing paddy fields, dryland, and orchards), as well as construction and industrial areas [6]. In the realm of landscape ecology, certain ecosystems like cultivated land, orchards, bare land, urban residential zones, and industrial areas are often labeled as “source” landscapes, emitting substantial environmental pollutants such as N, phosphorus, and sediment [6]. Conversely, “sink” landscapes, comprising forests, grasslands, wetlands, and water bodies, not only emit fewer pollutants but also possess the capacity to reduce environmental contaminants [18]. Even in a watershed dominated by “source” landscapes, the presence of “sink” landscapes like wetlands near the watershed outlet or in proximity to the reservoir can significantly diminish the influx of pollutants [20]. The efficient trapping capability of wetlands plays a pivotal role in this reduction [21]. Presently, our comprehension of soil C and N distribution and dynamics in the “source” and “sink” landscapes of the Danjiangkou Reservoir area is limited [20]. Urgent and extensive research is imperative to deepen our understanding of these aspects and inform effective environmental management strategies [22].
This study centers on the Danjiangkou Reservoir region, a pivotal component of the Middle Route Project of the South-to-North Water Transfer. This area is characterized by notable topographical variations and diverse land use and soil composition. The primary objective is to scrutinize the spatial distribution patterns of soil C and N content. Employing a synergistic approach that combines traditional statistical methods with geostatistical analyses, this research undertakes a comprehensive examination of the entire region, conducting a differential analysis based on various land-use types. The study delves into the influence of environmental factors, including land use, soil properties, and altitude, on soil C and N content. Regression prediction equations are formulated to establish a solid foundation for the development of a precision management system tailored to the local conditions of the studied area.

2. Materials and Methods

2.1. Description of Study Area

The study area is situated in the Danjiangkou Reservoir region, serving as the water source for the Middle Route Project of the South-to-North Water Transfer (Figure 1). Positioned within the North Subtropical Monsoon Climate Zone, it lies in the transitional zone between the climates of northern and southern China. The region maintains an average annual temperature of 15.8 degrees Celsius and an average annual precipitation of 804.3 mm. Notably, precipitation is concentrated mainly from July to September, constituting approximately half of the total annual precipitation.
Diverse land-use types characterize the Danjiangkou Reservoir region, encompassing farmland (including dryland, paddy fields, and orchards), forests, grasslands, and hydro-fluctuation (HF) belts. Traditional agricultural methods are typically employed to cultivate winter wheat, summer corn, and peanuts in dryland areas. Paddy fields undergo rotations between summer rice and winter wheat, while orchards predominantly cultivate citrus fruits, pomegranates, and kiwis. The predominant natural vegetation consists of deciduous broadleaf and coniferous trees, covering approximately 23%, including pine and Chinese fir. Moreover, with a shoreline extending over 6000 km, the HF-belt wetlands in the Danjiangkou Reservoir are a crucial land-use type, featuring a significant amount of submerged farmland. Consequently, the region provides an ideal setting for studying the spatial distribution patterns of soil C and N content and their responses to various land-use types.

2.2. Field Sampling

The primary objective of this study is to investigate the soil quality of farmland and provide references for sustainable farmland management. To achieve this goal, the study selected various land-use types related to agriculture, including orchards, drylands, paddy fields, and HF-belt farmland, for sampling and analysis. In December 2019, following principles of randomness and accessibility, we sampled 120 sites from four land-use types (orchards, drylands, paddy fields, and HF belts) around the Danjiangkou Reservoir area, comprising 25 orchard sites, 47 dryland sites, 14 paddy field sites, and 34 HF-belt sites (Figure 1). At the watershed scale, orchards and drylands typically occupy higher-altitude slope areas, while paddy fields are situated in lower-altitude flat areas. HF belts align along the reservoir shoreline, with elevations generally ranging from 160 to 170 m. Throughout the sampling process, soil samples were collected from the 0 to 20 cm depth range at each sampling site, utilizing a five-point sampling method. Concurrently, latitude, longitude, elevation, and topography data for each site were recorded, and an investigation into land-use history and human activities was conducted.

2.3. Soil Analysis Methods and Classification Standards

The testing parameters encompass soil organic C (SOC), soil inorganic C (SIC), total N (TN), available N (AN), total phosphorus (TP), available phosphorus (AP), pH value, soil mechanical composition, and >0.25 cm water-stable aggregates (WSAs). The specific testing methods are outlined below: combustion method for SOC and SIC; Kjeldahl digestion method for TN; alkaline diffusion method for AN; soil samples undergo H2SO4-HClO4 digestion for TP, and AP is extracted using sodium bicarbonate, with the phosphorus content determined by the molybdenum antimony anti-colorimetric method; pH values are determined using a composite electrode with a soil-to-water ratio of 2.5:1; soil mechanical composition is measured using a laser particle size analyzer; >0.25 cm WSA content is determined through the wet-sieving method [17].
Soil C and N content classification standards adhere to the second soil survey classification standards, as presented in Table 1. SOC (referencing organic matter), TN, and AN content are categorized into six levels: Level 1—Very Rich, Level 2—Rich, Level 3—Moderate, Level 4—Deficient, Level 5—Very Deficient, and Level 6—Extremely Deficient.

2.4. Statistical Analysis

In the data-processing phase, we conducted traditional statistical analysis, analysis of variance, and plotting using Excel (2019) and Origin (2021). For geographic information system (GIS) applications, we employed Google Earth and ArcGIS 10.0 for digitization, sampling point design, spatial analysis, and mapping tasks. In terms of geostatistical analysis, we utilized the Geostatistical Analyst extension module within ArcGIS. Geostatistical methods, relying on semivariogram functions and Kriging interpolation as fundamental tools, enable the study of the spatial distribution of variables that possess both randomness and structure [17]. Moreover, this study, employing analysis methods such as Pearson correlation and stepwise regression, analyzed the driving factors of spatial variation in soil C and N content. Regression prediction equations were established to model and predict the soil C and N content.

3. Results

3.1. Descriptive and Geostatistical Analysis of Soil C and N Content

Figure 2 illustrates the levels of SOC, SIC, TN, and AN in the Danjiangkou Reservoir area. Regarding SOC content levels, the distribution ranges from 2.95 to 21.50 g·kg−1 (Figure 2A). Approximately 66% of sampling points fall within the 8 to 14 g·kg−1 range, corresponding to the third and fourth levels according to the second soil survey standards. This indicates relatively low levels of SOC in the region. SIC content is primarily influenced by soil parent material, with values ranging from 0.06 to 3.43 g·kg−1, averaging at 1.65 g·kg−1. For soil N content, both TN and AN levels are generally low, averaging 0.92 g·kg−1 and 70.14 mg·kg−1, respectively. The distribution spans from 0.27 to 2.44 g·kg−1 for TN and 18.20 to 170.45 mg·kg−1 for AN. The majority of sampling points fall into the deficient (level 4) and very deficient (level 5) categories. Consequently, the overall soil C and N nutrient levels in the Danjiangkou Reservoir area are relatively low, emphasizing the need for soil management strategies focused on enhancing soil fertility. Implementing effective measures to increase soil C and N input while reducing soil erosion is crucial [23].
Descriptive statistical results (Figure 2) indicate that SOC and SIC content exhibit clear normal distribution characteristics. Although TN and AN do not follow a normal distribution, log-transformed data show normal distribution characteristics. Geostatistical analysis, based on SOC and SIC content, as well as log-transformed TN and AN data, yielded optimal fitting models. Exponential models are optimal for SOC, while spherical models are optimal for SIC, TN, and AN. The high determination coefficients and small residuals in the semivariogram models for each indicator affirm the accuracy of soil physicochemical property interpolation, meeting the predictive requirements for C and N spatial distribution (Table 2).

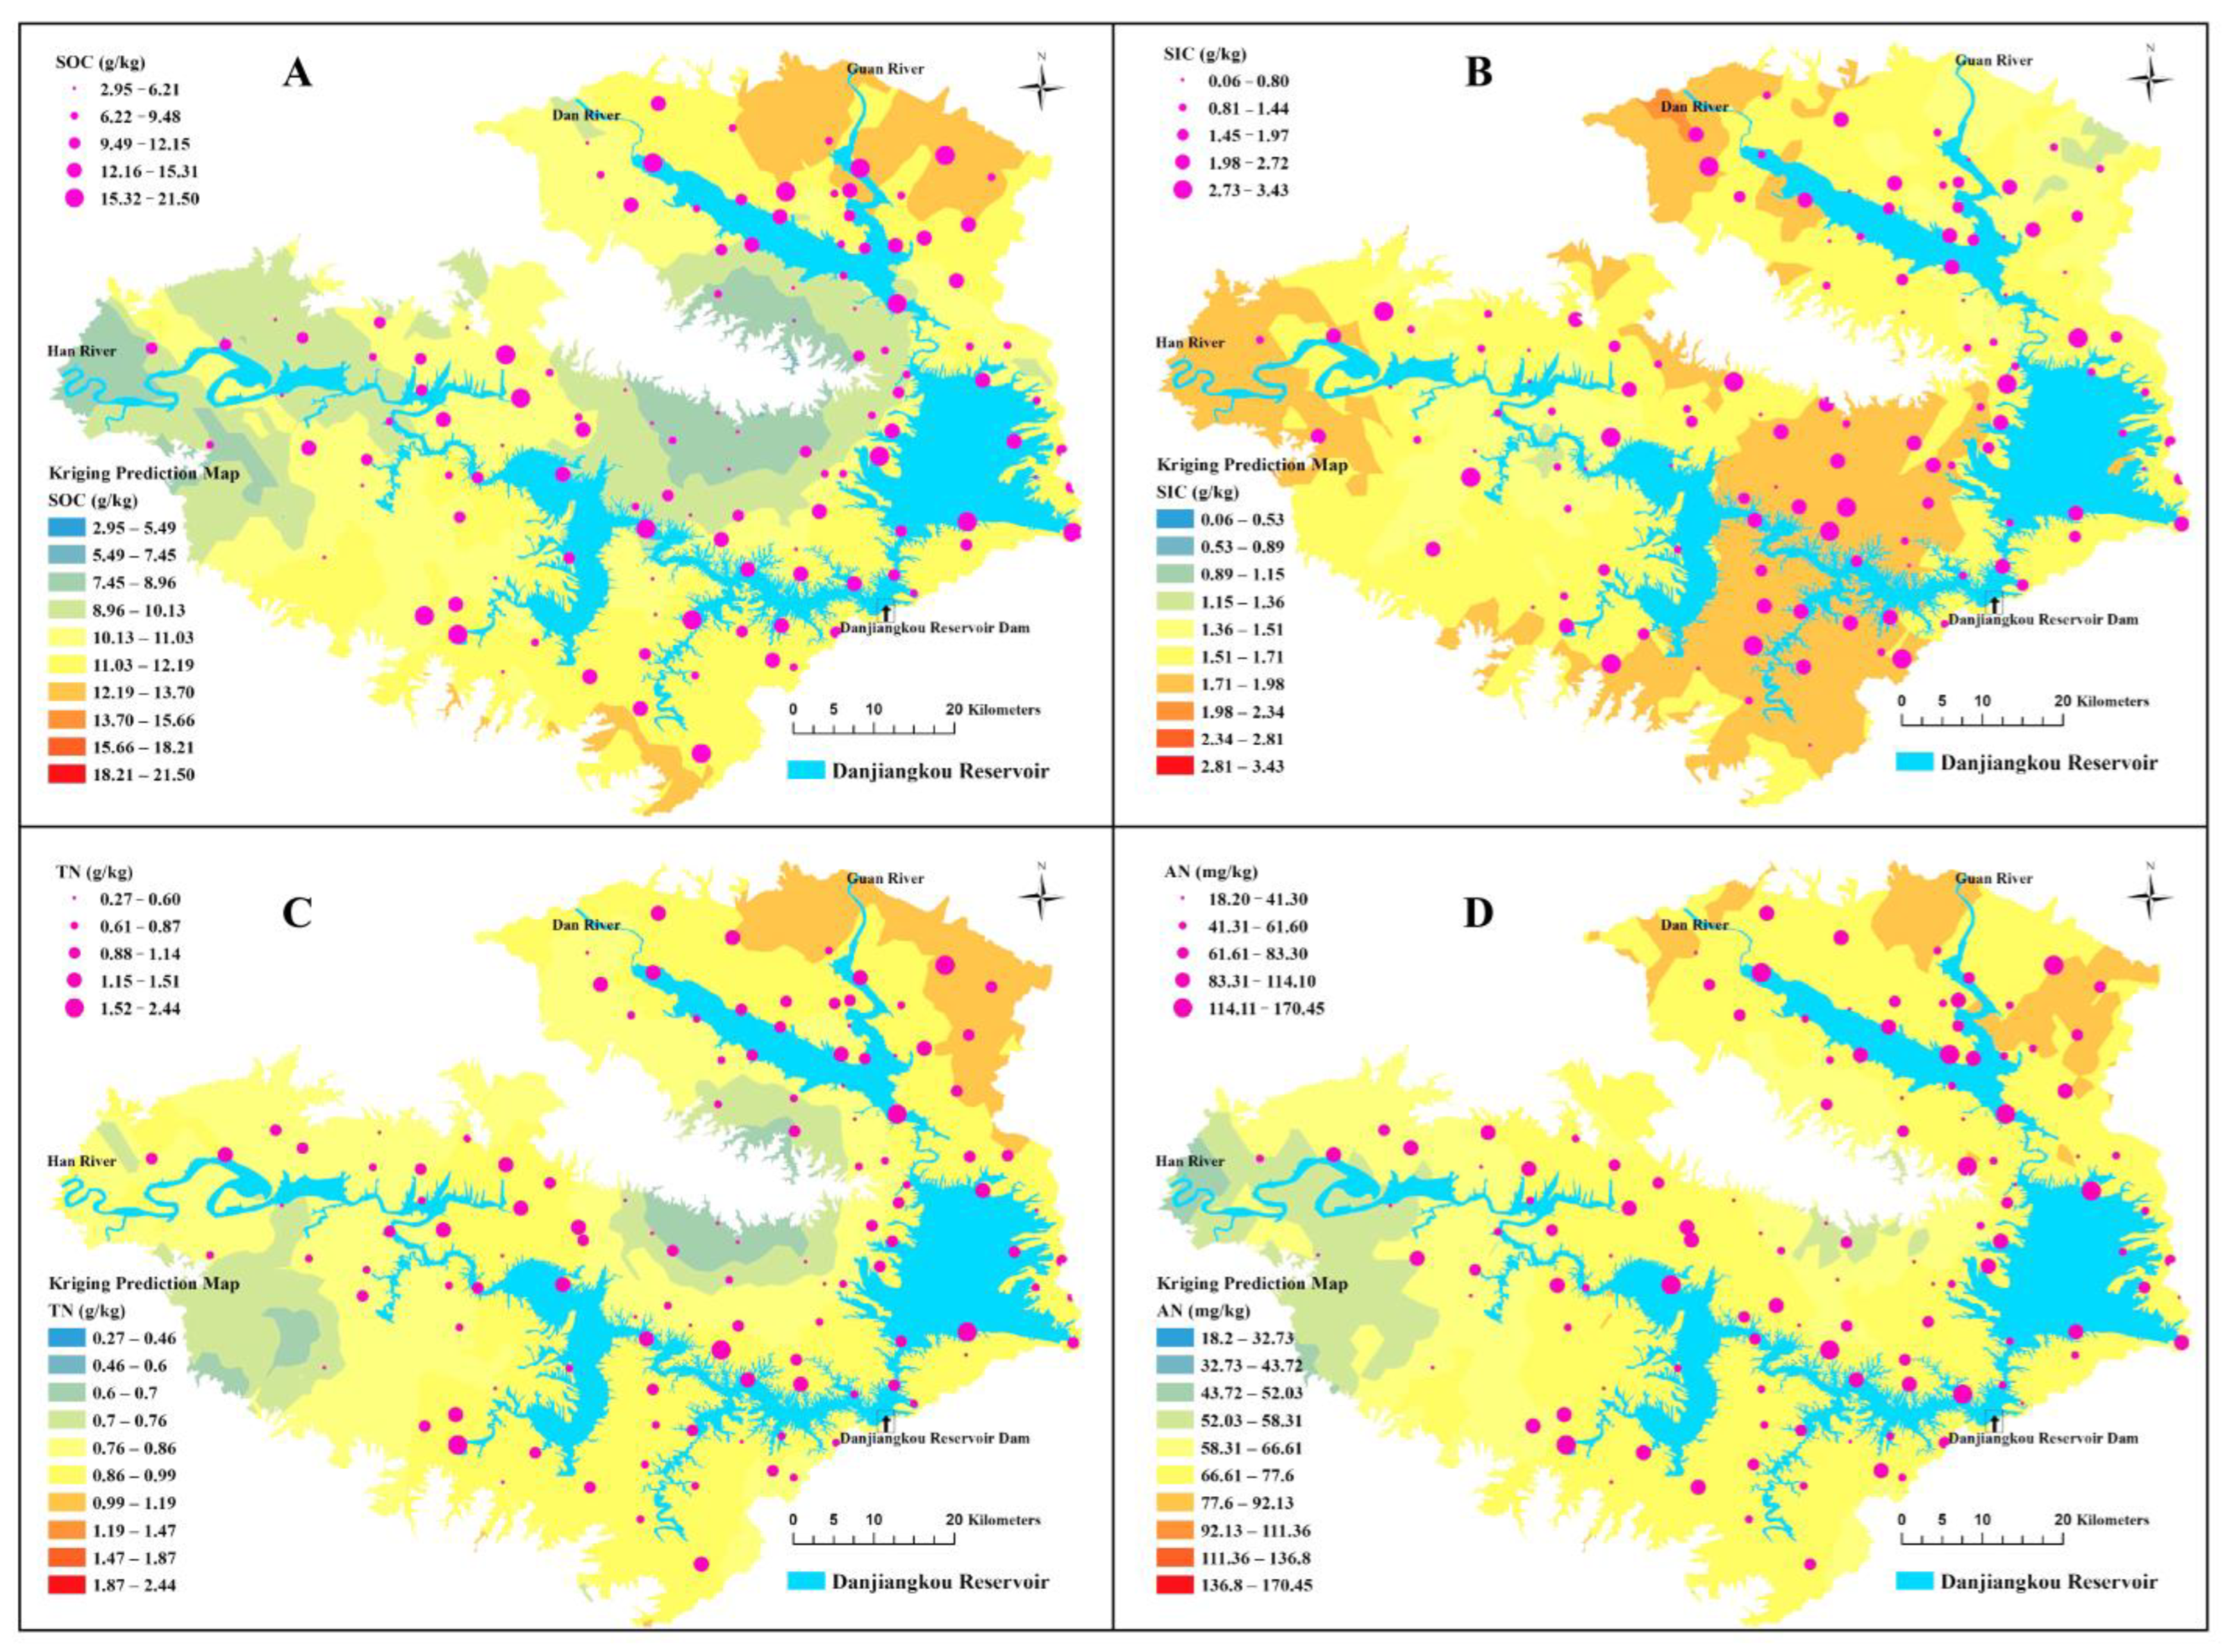
3.2. Spatial Distribution Characteristics of Soil C and N Content in the Danjiangkou Reservoir Area

This study utilized ArcGIS and its Geostatistical Analyst extension module to visualize the spatial distribution of soil C and N content. From a spatial perspective, distinct spatial variations in soil C and N content are observed in the Danjiangkou Reservoir area. SOC, TN, and AN display similar spatial distribution patterns (Figure 3). In the Guan River basin (northeastern region of the map), there is a significant enrichment of SOC, TN, and AN. This enrichment is primarily attributed to the area’s status as a crucial agricultural production zone in the Danjiangkou Reservoir region, with substantial fertilizer input. Additionally, the relatively flat terrain in this region favors the accumulation of SOM and N. Conversely, the southwestern corner and central areas of the Han River basin in the Danjiangkou Reservoir area exhibit comparatively lower levels of SOC, TN, and AN. This is mainly due to these areas being susceptible to soil erosion in mountainous terrain, characterized by significant altitude variations and relatively thin soil layers, posing challenges for the accumulation of soil C and N nutrients.
Moreover, regions with an enrichment of SIC are primarily distributed in the central part of the Danjiangkou Reservoir area, specifically the inflow area of the Han River and Dan River. These areas are characterized by high degrees of rocky desertification, thin soil layers, sparse vegetation, and low soil development. This indicates that the spatial distribution of SIC is primarily influenced by soil parent material and the degree of soil development.

3.3. Differential Characteristics of Soil C and N Content in Different Land-Use Types

Significant variations exist in SOC content among different land-use types. Paddy fields exhibit the highest organic matter content at 13.84 g·kg−1, followed by the HF belt (12.63 g·kg−1), orchards (9.56 g·kg−1), and dryland (9.02 g·kg−1) (Figure 4). The organic matter content in paddy fields and the HF belt is notably higher than that in orchards and dryland (p < 0.05), potentially due to the flooding process in paddy fields and HF belts favoring the accumulation of organic matter. In contrast, the distribution characteristics of SIC under different land-use types are precisely the opposite, with dryland > orchards > HF belt > paddy fields (Figure 4). The differences in SIC content between dryland and orchards compared to the HF belt and paddy fields reach a significant level (p < 0.05). This phenomenon may be primarily related to soil erosion processes. Dryland and orchards, often located in higher-altitude areas of the watershed, experience more significant soil erosion. The surface-rich matured soil with abundant SOC is prone to substantial loss during soil erosion, leading to the exposure of SIC-enriched subsoil, causing the accumulation of SIC.
Soil N serves as both an essential nutrient in the ecosystem and a major source of N in water bodies. In agricultural soils in the Danjiangkou Reservoir area, the overall TN content is relatively low, with significant differences among different land-use types (Figure 4). Specifically, paddy fields have the highest TN content (1.06 g·kg−1), followed by the HF belt (1.01 g·kg−1), orchards (0.88 g·kg−1), and dryland (0.85 g·kg−1). The TN content in dryland is significantly lower than that in paddy fields and the HF belt (p < 0.05), while the TN content in orchards falls between paddy fields and the HF belt, with no significant statistical difference among these three land-use types. The distribution characteristics of AN mirror those of TN under different land-use types, with relatively higher AN content in paddy fields and the HF belt, but still at a deficient (level four) level. In summary, N content in agricultural soils in the Danjiangkou Reservoir area is generally low, with significant differences among different land-use types. Paddy fields and the HF belt have relatively higher N content, while orchards and dryland have lower N content.

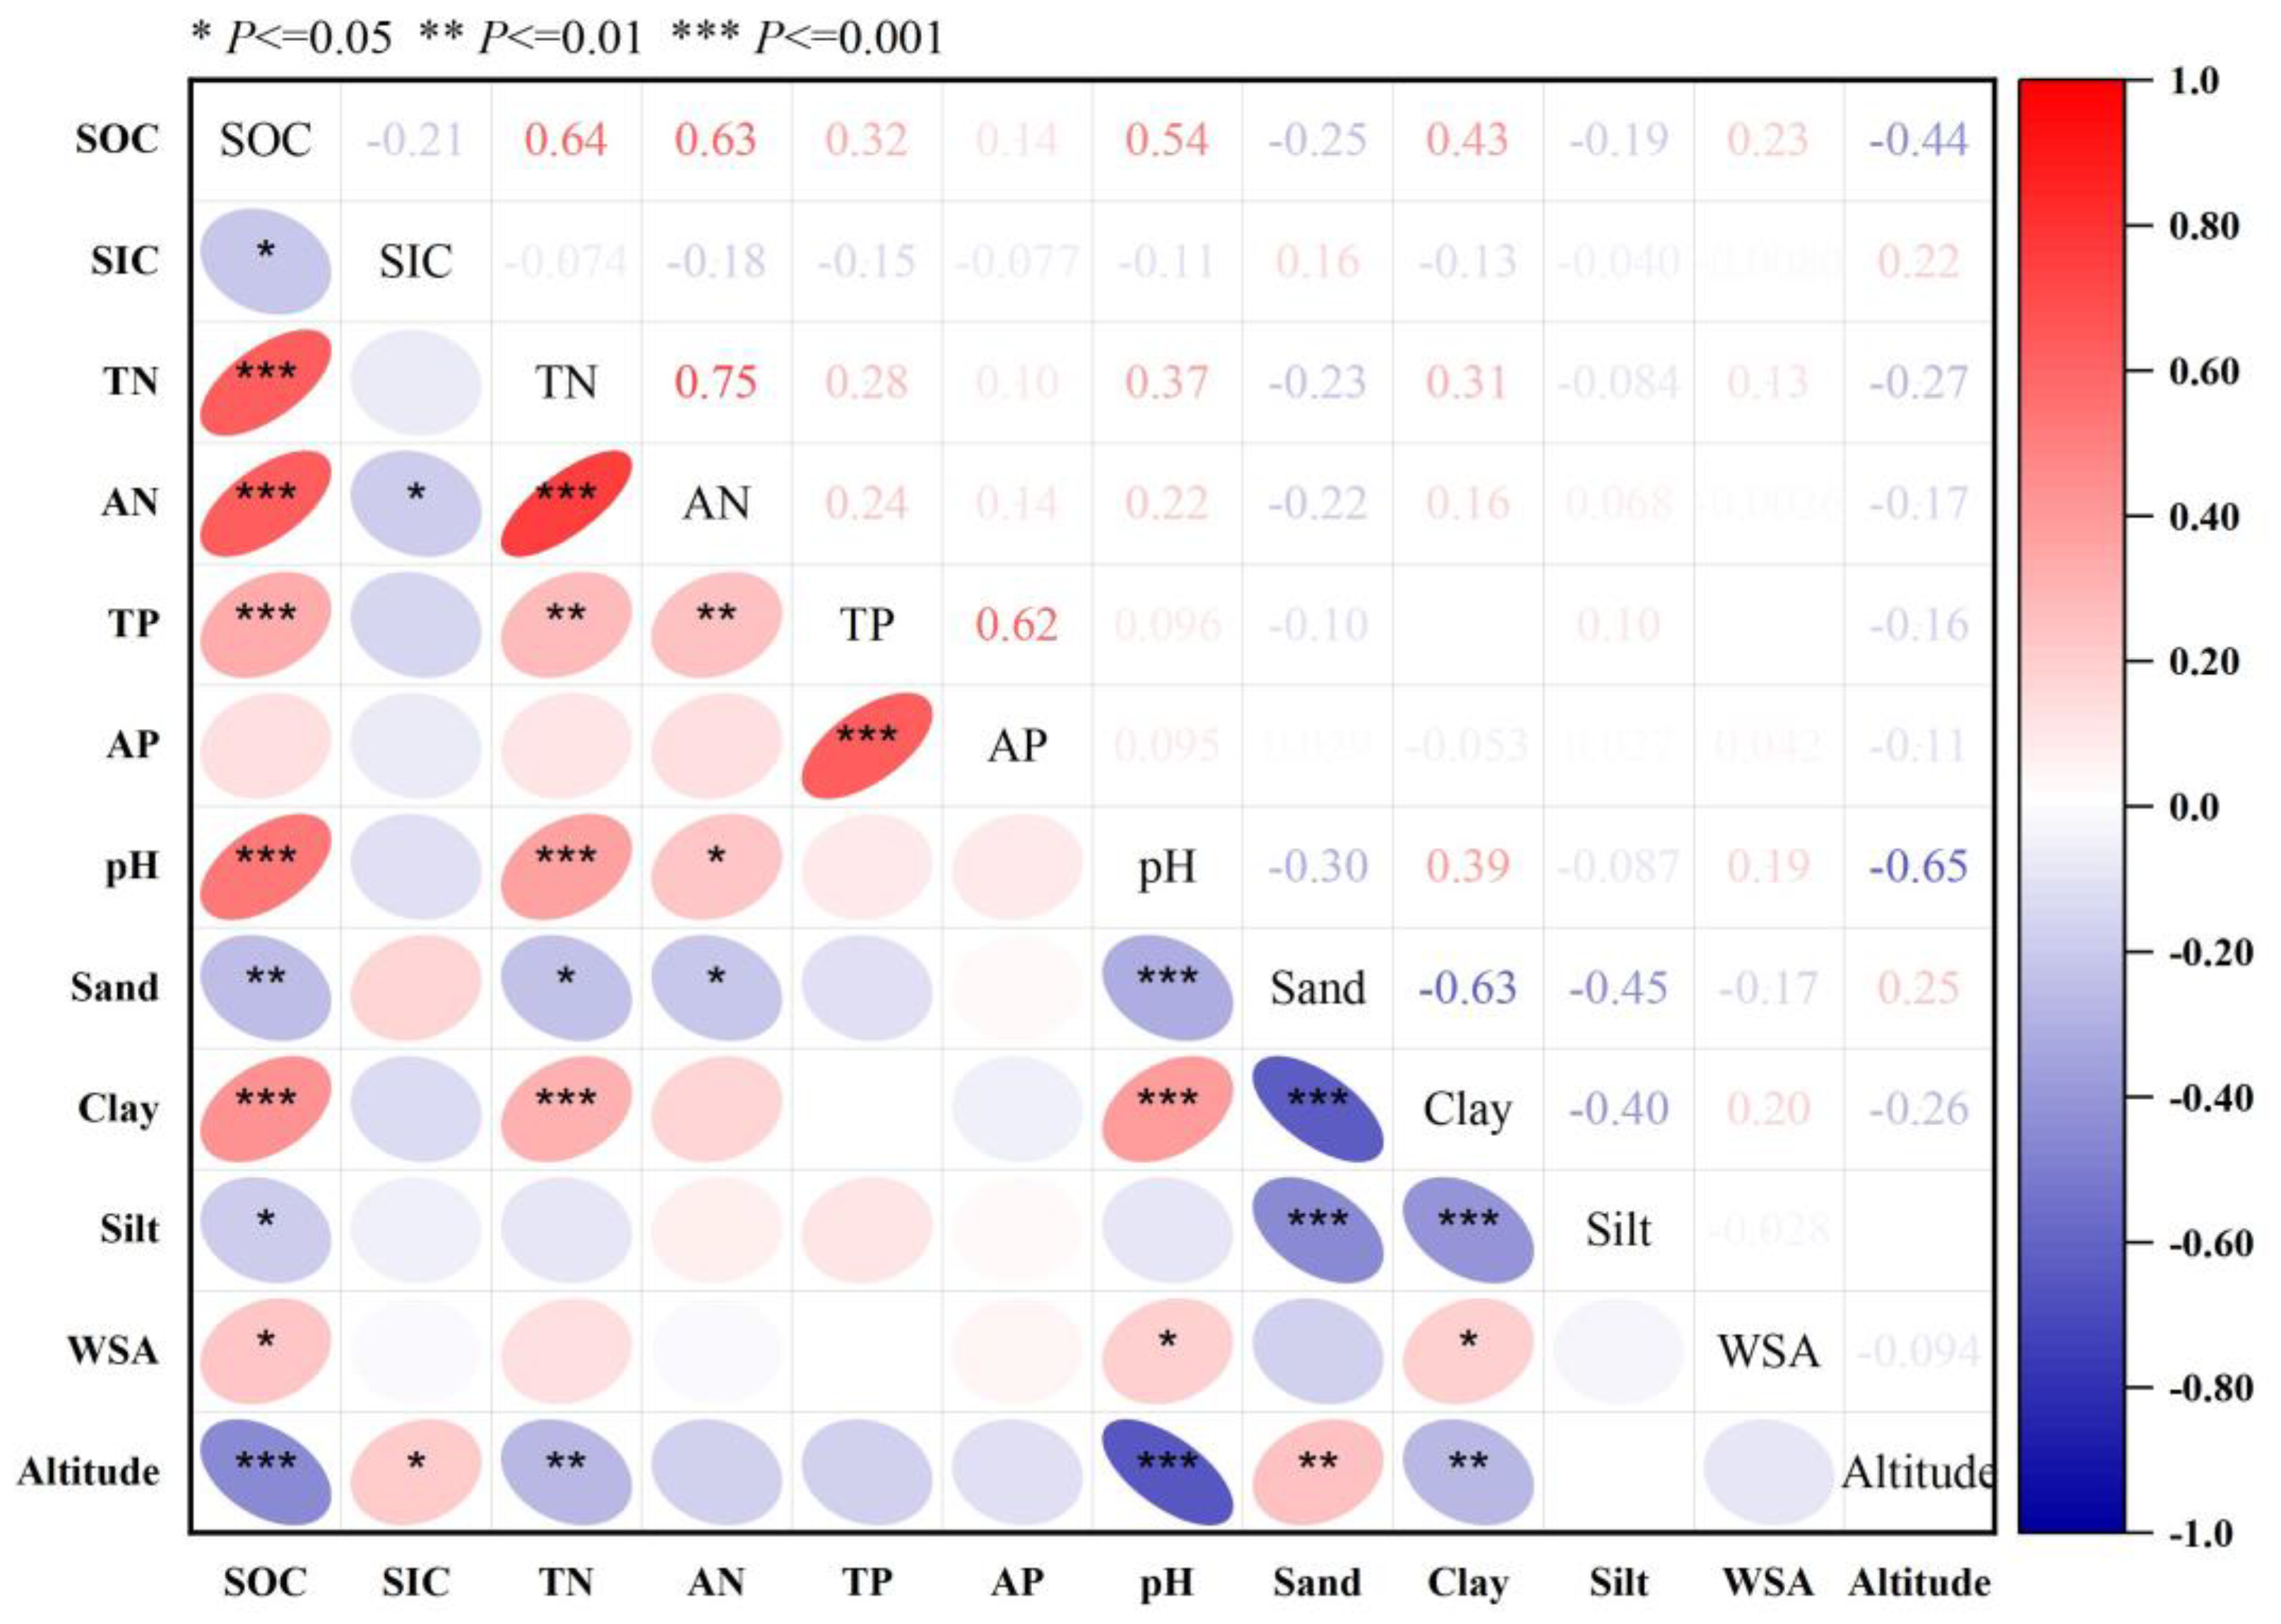
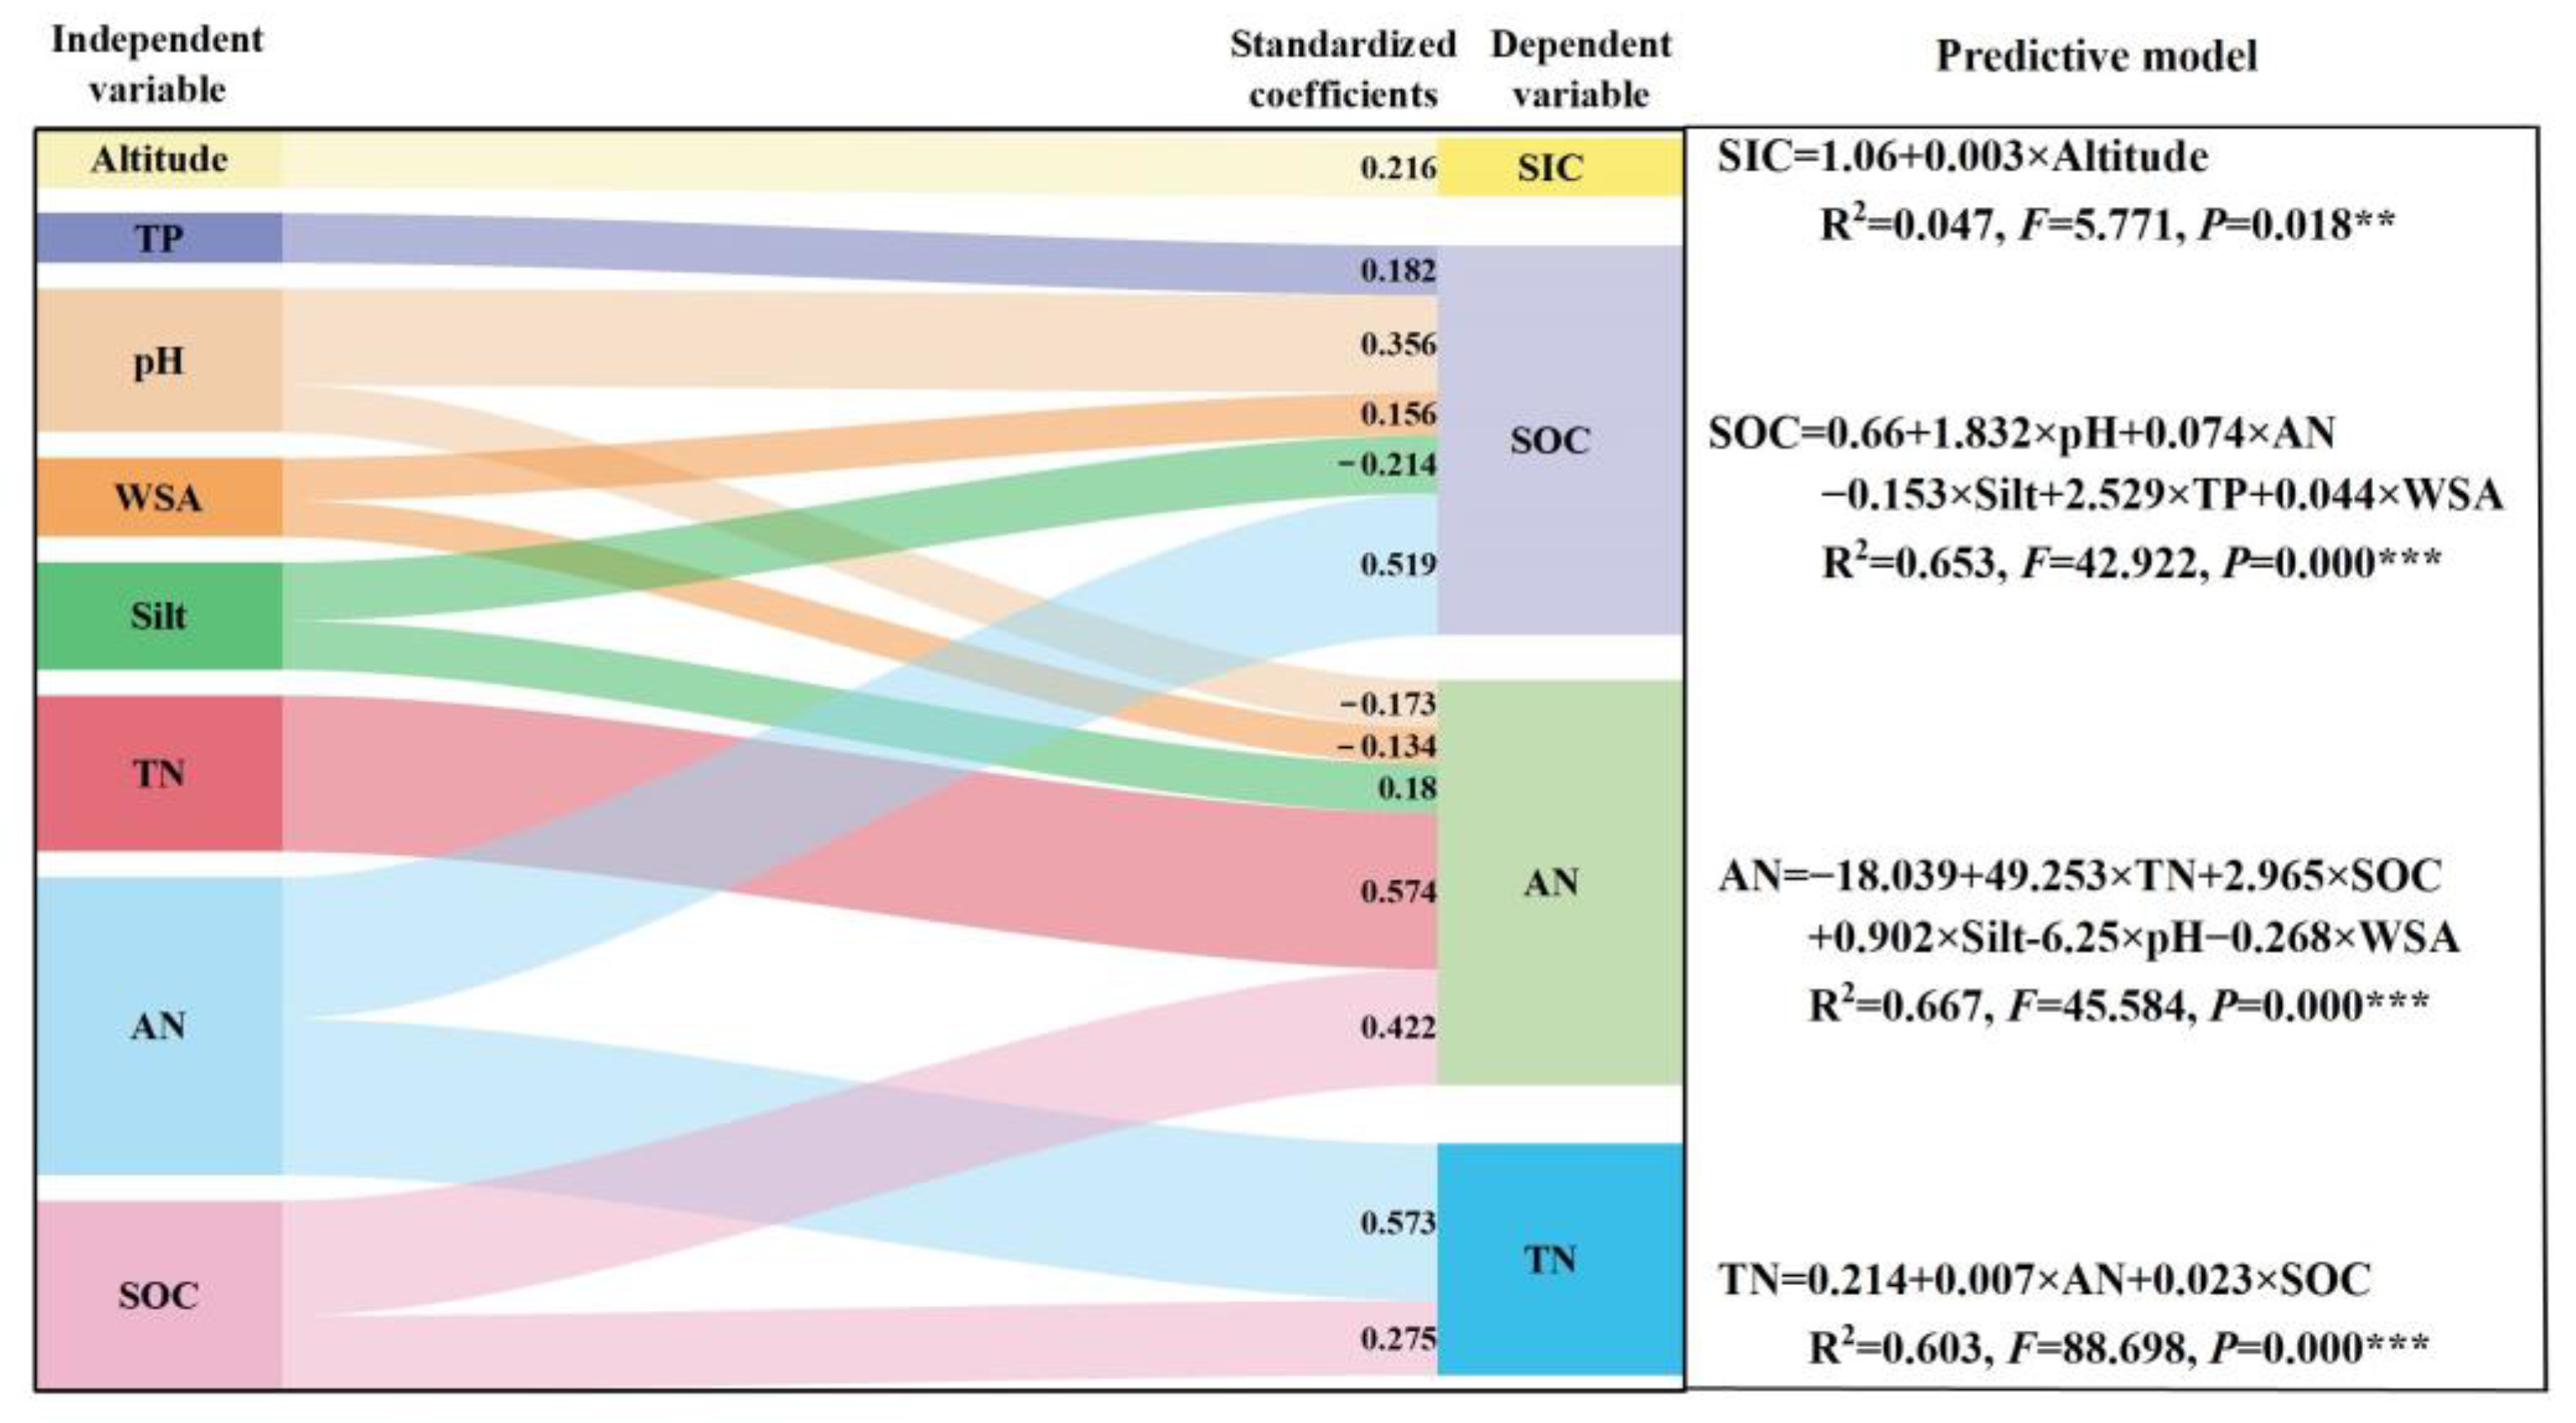
3.4. Driving Factors of Spatial Variation in Soil C and N Content

In this study, the correlation between soil C and N content and various soil physicochemical indicators and altitude was analyzed using Pearson correlation analysis. Overall, SOC, TN, and AN exhibited more significant correlations with environmental factors (Figure 5). SOC demonstrated significant positive correlations with TN, AN, TP, pH, clay, and WSA, and significant negative correlations with SIC, sand, silt, and altitude. TN showed significant positive correlations with SOC, AN, TP, pH, and clay, and significant negative correlations with sand and altitude. AN exhibited significant positive correlations with SOC, TN, TP, and pH, and significant negative correlations with SIC and sand. Regarding SIC, the factors most correlated with it were SOC, AN, and altitude, with SOC and AN showing negative correlations and altitude showing a positive correlation. These results indicate that SOC, TN, and AN are more closely related to environmental factors, while SIC is more influenced by soil parent material.
Building upon this, the present study utilized a stepwise regression method to construct predictive models for SIC, SOC, AN, and TN, respectively. All predictive models achieved statistical significance, with p-values less than 0.05 (Figure 6). Examining the predictive models, SIC was solely influenced by altitude, with a standardized coefficient of 0.216. The predictive model for SOC retained variables such as pH, AN, silt, TP, and WSA, with standardized coefficients of 0.356, 0.519, −0.214, 0.182, and 0.156, respectively. Variables influencing AN included TN, SOC, silt, pH, and WSA, with standardized coefficients of 0.574, 0.422, 0.18, −0.173, and −0.134, respectively. Additionally, TN was primarily driven by AN and SOC, with standardized coefficients of 0.573 and 0.275, respectively. Therefore, the results of the stepwise regression also indicate a closer relationship between SOC and AN with environmental factors.

4. Discussion

4.1. Soil C and N Content in the Danjiangkou Reservoir Area

The Danjiangkou Reservoir area, situated in the Qinling-Bashan mountainous region, exhibits extensive mountainous terrain [6]. The relatively low soil C and N content in this region can be attributed to several factors. Firstly, the challenging topography and soil conditions make it difficult for organic matter to accumulate [8]. The mountainous nature of the Danjiangkou Reservoir area, with steep terrain and thin soil layers, obstructs the accumulation of organic matter [17]. Additionally, long-term influences of soil erosion have resulted in a relatively low accumulation of organic matter in the soil [24]. Zhang et al.’s survey in a small watershed of the Danjiangkou Reservoir revealed significant spatial variability in SOC content, ranging from 2.46 to 16.29 g·kg−1, with different land-use types showing varying averages, such as 8.65 g·kg−1, 7.62 g·kg−1, and 4.73 g·kg−1 for the upland field, paddy field, and orchard, respectively [8]. The SOC content (2.95 to 21.50 g·kg−1) investigated in this study aligns closely with previous research findings [16,17]. Secondly, agricultural management practices significantly contribute to the lower soil C and N content [8]. The region is predominantly agricultural, but outdated farming practices, including traditional cultivation methods and insufficiently scientific fertilization and crop rotation measures, contribute to nutrient losses and a gradual decline in soil quality [19]. An accelerated multiphase water transformation in the mountains may pose some impacts on the soil C and N in this region [25]. In summary, the low soil C and N contents in the Danjiangkou Reservoir area result from a combination of factors, including topographic characteristics, soil erosion, agricultural management practices, and over-exploitation [26]. To improve soil quality, a comprehensive approach is needed, involving enhanced land management; rational use of fertilizers, biochar, and pesticides; adoption of advanced agricultural production technologies; and ecological environment protection [27,28].

4.2. The Impact of Land-Use Types on Soil C and N Content

Land-use types play a pivotal role in influencing soil C and N content [29]. The impact of different land-use types on the accumulation and decomposition of SOC and N is diverse [30]. Agricultural cultivation methods, in particular, can significantly influence soil C and N cycling processes [19]. Monoculture or repetitive cultivation practices can accelerate the decomposition and release of SOC and N, leading to a decline in their content [31]. On the other hand, diversified planting methods, such as rice–wheat rotation, have the potential to increase SOC accumulation [32]. This study’s results align with these observations, highlighting that the organic matter content in paddy fields and hydro-fluctuation belts (HF belts) is significantly higher than in upland agricultural fields (orchards and dryland). This difference is primarily attributed to the periodic flooding in paddy fields and HF belts, creating anaerobic conditions that reduce microbial decomposition capacity, consequently promoting the accumulation of SOM [33]. Additionally, during soil erosion processes, a significant amount of C and N may be transported to lower altitudes and low-lying areas [26]. In this study, the strategic location of paddy fields and HF belts in channels or areas with lower elevations makes them susceptible to the depositions of C and N migrating through soil erosion. Therefore, rational agricultural land planning and the adoption of scientifically sound agricultural management measures emerge as crucial components for maintaining the accumulation of soil C and N. Implementing diversified planting methods and sustainable cultivation practices, such as rice–wheat rotation, can be instrumental in mitigating the loss of organic matter and fostering the long-term health of soils in agricultural landscapes.

4.3. Driving Factors of Spatial Variation in Soil C and N Content

The correlation analysis and stepwise regression results shed light on the intricate interactions between SOC, SIC, TN, AN, and various environmental factors. SOC exhibits more complex relationships with environmental factors compared to SIC, which can be attributed to their distinct sources and environmental conditions. SOC primarily originates from plant secretions or residues fixed in the soil, with its input rate directly determined by vegetation growth conditions [34]. It plays a crucial role in biogeochemical cycles, influencing various physicochemical properties of the soil [35]. Additionally, human activities, such as changes in land use or cultivation practices, can impact SOC content [36]. On the other hand, SIC, composed mainly of soil carbonates, primarily derives from the soil matrix. In regions prone to soil erosion, often located at higher altitudes, surface soils rich in SOC may be easily transported during erosion, leading to the exposure of subsurface soils rich in SIC. This phenomenon results in the enrichment of SIC, with altitude being the sole variable influencing it in this study.
Regarding the interaction of soil TN and AN with environmental factors, TN content is closely related to various factors, including SOC, AN, TP, pH, clay, sand, and altitude. However, the stepwise regression results indicate that only SOC and AN are significant drivers of TN content. This could be attributed to TN encompassing both inorganic and organic N, where organic N and SOC often coexist in fixed C–N ratios in SOM. In contrast, AN represents almost all inorganic N. Therefore, TN and SOC, as well as TN and AN, may exhibit a certain degree of co-occurrence. For AN, representing the biologically available portion of N in the soil, this study indicates significant correlations with various environmental factors. In the stepwise regression model with AN as the dependent variable, the retained independent variables include TN, SOC, silt, pH, and Water-Stable Aggregates (WSA). This underscores the susceptibility of AN to changes in soil environmental conditions, highlighting the importance of considering multiple dimensions and pathways in soil N management [29]. Rational land-use types and agricultural methods emerge as crucial components for maintaining a balanced nutrient status in the soil.

5. Conclusions

The soil properties of SOC, SIC, TN, and AN in the Danjiangkou Reservoir area generally exhibit low levels, falling within the distribution ranges of 2.95–21.50 g·kg−1, 0.06–3.43 g·kg−1, 0.27–2.44 g·kg−1, and 18.20–170.45 mg·kg−1, respectively. These levels are mostly categorized as deficiency and severe deficiency according to the standards of the Second National Soil Survey. This study reveals a certain degree of spatial variability in SOC, TN, and AN content, particularly in regions with higher levels of agricultural development, where enrichment is observed. Land-use types significantly influence C and N content in the soil, with paddy fields and HF belts significantly increasing SOC and N (TN and AN) content in the soil. Correlation analysis and stepwise regression results highlight the intricate interactions between SOC, TN, AN, and various environmental factors, emphasizing the pronounced relationships compared to SIC. In conclusion, soil management strategies should be comprehensive and multi-faceted. Prioritizing soil fertilization while ensuring strict control over soil erosion and nutrient loss is crucial.

Author Contributions

Conceptualization: B.X., Y.L. (Yi Liu), and Y.L. (Yuefen Li); investigation: B.X.; methodology: B.X. and Y.L. (Yi Liu); writing—original draft: B.X. and Y.L. (Yi Liu); supervision: Y.L. (Yi Liu) and Y.L. (Yuefen Li); funding acquisition: Y.L. (Yi Liu) and Y.L. (Yuefen Li); data curation: Y.L. (Yi Liu); validation: Y.L. (Yi Liu); software: Y.L. (Yi Liu); formal analysis: Y.L. (Yi Liu); writing—review and editing: B.X., Y.L. (Yi Liu), and Y.L. (Yuefen Li); project administration: Y.L. (Yi Liu) and Y.L. (Yuefen Li). All authors have read and agreed to the published version of the manuscript.

Funding

This work was financially supported by the National Natural Science Foundation of China (grant no.31971532, 32171648 and 42177447) as well as the Science and Technology Development Plan Project of Jilin Province (grant nos. 20210203010SF, 20220508124RC).

Institutional Review Board Statement

Not applicable.

Informed Consent Statement

Not applicable.

Data Availability Statement

Data are available upon request.

Conflicts of Interest

The authors declare no conflict of interest.

References

  1. Wang, T.; Kang, F.F.; Cheng, X.Q.; Han, H.R.; Bai, Y.C.; Ma, J.Y. Spatial variability of organic carbon and total nitrogen in the soils of a subalpine forested catchment at Mt. Taiyue, China. Catena 2017, 155, 41–52. [Google Scholar] [CrossRef]
  2. Wang, J.M.; Yang, R.X.; Bai, Z.K. Spatial variability and sampling optimization of soil organic carbon and total nitrogen for Minesoils of the Loess Plateau using geostatistics. Ecol Eng 2015, 82, 159–164. [Google Scholar] [CrossRef]
  3. Jalpa, L.; Mylavarapu, R. Current tomato production practices and their effects on plant and soil carbon and nitrogen dynamics. J. Plant Nutr. 2023, 46, 3905–3917. [Google Scholar] [CrossRef]
  4. Funes, I.; Save, R.; Rovira, P.; Molowny-Horas, R.; Alcaniz, J.M.; Ascaso, E.; Herms, I.; Herrero, C.; Boixadera, J.; Vayreda, J. Agricultural soil organic carbon stocks in the north-eastern Iberian Peninsula: Drivers and spatial variability. Sci Total Environ 2019, 668, 283–294. [Google Scholar] [CrossRef] [PubMed]
  5. Godoy, V.A.; Zuquette, L.V.; Gomez-Hernandez, J.J. Spatial variability of hydraulic conductivity and solute transport parameters and their spatial correlations to soil properties. Geoderma 2019, 339, 59–69. [Google Scholar] [CrossRef]
  6. Li, Z.G.; Zhang, R.H.; Liu, C.; Zhang, R.Q.; Chen, F.; Liu, Y. Phosphorus spatial distribution and pollution risk assessment in agricultural soil around the Danjiangkou reservoir, China. Sci. Total Environ. 2020, 699, 134417. [Google Scholar] [CrossRef] [PubMed]
  7. Sanches, G.M.; Magalhaes, P.S.G.; Franco, H.C.J. Site-specific assessment of spatial and temporal variability of sugarcane yield related to soil attributes. Geoderma 2019, 334, 90–98. [Google Scholar] [CrossRef]
  8. Zhang, Y.N.; Zhang, G.S.; Pan, J.F.; Fan, Z.H.; Chen, F.; Liu, Y. Soil organic carbon distribution in relation to terrain & land use-a case study in a small watershed of Danjiangkou reservoir area, China. Glob. Ecol. Conserv. 2019, 20, e00731. [Google Scholar] [CrossRef]
  9. Gao, X.S.; Xiao, Y.; Deng, L.J.; Li, Q.Q.; Wang, C.Q.; Li, B.; Deng, O.P.; Zeng, M. Spatial variability of soil total nitrogen, phosphorus and potassium in Renshou County of Sichuan Basin, China. J. Integr. Agric. 2019, 18, 279–289. [Google Scholar] [CrossRef]
  10. Fei, Y.H.; She, D.L.; Fang, K. Identifying the Main Factors Contributing to the Spatial Variability of Soil Saline-Sodic Properties in a Reclaimed Coastal Area. Vadose Zone J. 2018, 17, 180118. [Google Scholar] [CrossRef]
  11. Hu, W.; Shao, M.A.; Wan, L.; Si, B.C. Spatial variability of soil electrical conductivity in a small watershed on the Loess Plateau of China. Geoderma 2014, 230, 212–220. [Google Scholar] [CrossRef]
  12. Bai, Y.X.; Zhou, Y.C. The main factors controlling spatial variability of soil organic carbon in a small karst watershed, Guizhou Province, China. Geoderma 2020, 357, 113938. [Google Scholar] [CrossRef]
  13. Wang, H.L.; Wang, J.C.; Wang, J.Y.; Yan, W.D. Insights into the Distribution of Soil Organic Carbon in the Maoershan Mountains, Guangxi Province, China: The Role of Environmental Factors. Sustainability 2023, 15, 8716. [Google Scholar] [CrossRef]
  14. Yavitt, J.B.; Burtis, J.C.; Smemo, K.A.; Welsch, M. Plot-scale spatial variability of methane, respiration, and net nitrogen mineralization in muck-soil wetlands across a land use gradient. Geoderma 2018, 315, 11–19. [Google Scholar] [CrossRef]
  15. Paul, O.O.; Sekhon, B.S.; Sharma, S. Spatial variability and simulation of soil organic carbon under different land use systems: Geostatistical approach. Agroforest Syst 2019, 93, 1389–1398. [Google Scholar] [CrossRef]
  16. Cheng, X.L.; Yang, Y.H.; Li, M.; Dou, X.L.; Zhang, Q.F. The impact of agricultural land use changes on soil organic carbon dynamics in the Danjiangkou Reservoir area of China. Plant Soil 2013, 366, 415–424. [Google Scholar] [CrossRef]
  17. Liu, Y.; Liu, W.Z.; Wu, L.H.; Liu, C.; Wang, L.; Chen, F.; Li, Z.G. Soil aggregate-associated organic carbon dynamics subjected to different types of land use: Evidence from C-13 natural abundance. Ecol. Eng. 2018, 122, 295–302. [Google Scholar] [CrossRef]
  18. Zhang, Q.; Zhang, D.D.; Wu, J.J.; Li, J.S.; Feng, J.; Cheng, X.L. Soil nitrogen-hydrolyzing enzyme activity and stoichiometry following a subtropical land use change. Land Degrad. Dev. 2021, 32, 4277–4287. [Google Scholar] [CrossRef]
  19. Wang, L.; Yuan, X.L.; Liu, C.; Li, Z.G.; Chen, F.; Li, S.Q.; Wu, L.H.; Liu, Y. Soil C and N dynamics and hydrological processes in a maize-wheat rotation field subjected to different tillage and straw management practices. Agric. Ecosyst. Environ. 2019, 285, 106616. [Google Scholar] [CrossRef]
  20. Wang, H.; Han, Y.P.; Pan, L.D. Spatial-temporal variation of nitrogen and diffusion flux across the water-sediment interface at the hydro-fluctuation belt of Danjiangkou reservoir in China. Water Supply 2020, 20, 1241–1252. [Google Scholar] [CrossRef]
  21. Liu, W.Z.; Liu, G.H.; Zhang, Q.F. Influence of Vegetation Characteristics on Soil Denitrification in Shoreline Wetlands of the Danjiangkou Reservoir in China. Clean-Soil Air Water 2011, 39, 109–115. [Google Scholar] [CrossRef]
  22. Wang, M.; Houlton, B.Z.; Wang, S.; Ren, C.; van Grinsven, H.J.M.; Chen, D.; Xu, J.; Gu, B. Human-caused increases in reactive nitrogen burial in sediment of global lakes. Innovation 2021, 2, 100158. [Google Scholar] [CrossRef] [PubMed]
  23. Sanchez, E.; Zabaleta, R.; Fabani, M.P.; Rodriguez, R.; Mazza, G. Effects of the amendment with almond shell, bio-waste and almond shell-based biochar on the quality of saline-alkali soils. J. Environ. Manag. 2022, 318, 115604. [Google Scholar] [CrossRef] [PubMed]
  24. Han, F.P.; Zheng, J.Y.; Hu, W.; Du, F.; Zhang, X.C. Spatial variability and distribution of soil nutrients in a catchment of the Loess Plateau in China. Acta Agr Scand B-S P 2010, 60, 48–56. [Google Scholar] [CrossRef]
  25. Li, Z.; Feng, Q.; Wang, X.; Li, Z.; Wang, Q.J.; Chen, D.; Zhang, B.; Gui, J. Accelerated multiphase water transformation in global mountain regions since 1990. Innov. Geosci. 2023, 1, 100033. [Google Scholar] [CrossRef]
  26. Song, X.; Du, L.P.; Kou, C.L.; Ma, Y.L. Assessment of Soil Erosion in Water Source Area of the Danjiangkou Reservoir Using USLE and GIS. Lect. Notes Comput. Sci. 2011, 7030, 57–64. [Google Scholar]
  27. Hu, Y.J.; Zhang, Y.A.; Liu, J.W.; Chen, X.H.; Zhang, J.; Yao, Y.C. Nitrogen-rich animal and plant wastes as fertilizer improve the soil carbon/nitrogen ratio and plant branching and thickening of young walnut trees under deficit irrigation conditions. Arch Agron Soil Sci 2023, 69, 2966–2981. [Google Scholar] [CrossRef]
  28. Zabaleta, R.; Sánchez, E.; Fabani, P.; Mazza, G.; Rodriguez, R. Almond shell biochar: Characterization and application in soilless cultivation of Eruca sativa. Biomass Convers. Biorefinery 2023. [Google Scholar] [CrossRef]
  29. Zhang, S.R.; Xia, C.L.; Li, T.; Wu, C.G.; Deng, O.P.; Zhong, Q.M.; Xu, X.X.; Li, Y.; Jia, Y.X. Spatial variability of soil nitrogen in a hilly valley: Multiscale patterns and affecting factors. Sci. Total Environ. 2016, 563, 10–18. [Google Scholar] [CrossRef]
  30. Deng, Q.; Cheng, X.L.; Yang, Y.H.; Zhang, Q.F.; Luo, Y.Q. Carbon-nitrogen interactions during afforestation in central China. Soil Biol. Biochem. 2014, 69, 119–122. [Google Scholar] [CrossRef]
  31. Cislaghi, A.; Bordoni, M.; Meisina, C.; Bischetti, G.B. Soil reinforcement provided by the root system of grapevines: Quantification and spatial variability. Ecol. Eng. 2017, 109, 169–185. [Google Scholar] [CrossRef]
  32. Yang, H.S.; Xu, M.M.; Koide, R.T.; Liu, Q.; Dai, Y.J.; Liu, L.; Bian, X.M. Effects of ditch-buried straw return on water percolation, nitrogen leaching and crop yields in a rice-wheat rotation system. J. Sci. Food Agric. 2016, 96, 1141–1149. [Google Scholar] [CrossRef] [PubMed]
  33. Huang, B.; Sun, W.X.; Zhao, Y.C.; Zhu, J.; Yang, R.Q.; Zou, Z.; Ding, F.; Su, J.P. Temporal and spatial variability of soil organic matter and total nitrogen in an agricultural ecosystem as affected by farming practices. Geoderma 2007, 139, 336–345. [Google Scholar] [CrossRef]
  34. Wang, Y.L.; Wu, P.N.; Qiao, Y.B.; Li, Y.M.; Liu, S.M.; Gao, C.K.; Liu, C.S.; Shao, J.; Yu, H.L.; Zhao, Z.H.; et al. The potential for soil C sequestration and N fixation under different planting patterns depends on the carbon and nitrogen content and stability of soil aggregates. Sci. Total Environ. 2023, 897, 165430. [Google Scholar] [CrossRef]
  35. Neupane, A.; Herndon, E.M.; Whitman, T.; Faiia, A.M.; Jagadamma, S. Manganese effects on plant residue decomposition and carbon distribution in soil fractions depend on soil nitrogen availability. Soil Biol. Biochem. 2023, 178, 108964. [Google Scholar] [CrossRef]
  36. Li, Q.X.; Feng, J.; Wu, J.J.; Jia, W.; Zhang, Q.; Chen, Q.; Zhang, D.D.; Cheng, X.L. Spatial variation in soil microbial community structure and its relation to plant distribution and local environments following afforestation in central China. Soil Tillage Res. 2019, 193, 8–16. [Google Scholar] [CrossRef]
Figure 1. Distribution of sampling points and land cover of Danjiangkou Reservoir area. (A,B) represent the serial number of the image.
Sustainability 16 00444 g001
Figure 2. Descriptive statistical analysis of soil carbon (SOC and SIC) and nitrogen (TN and AN) content in Danjiangkou Reservoir area. (AF) represent the serial number of the image.
Sustainability 16 00444 g002
Figure 3. Spatial distribution characteristics of SOC, SIC, TN, and AN in the Danjiangkou Reservoir area. (AD) represent the serial number of the image.
Sustainability 16 00444 g003
Figure 4. Differentiation characteristics of soil SOC, SIC, TN, and AN under different land-use types in the Danjiangkou Reservoir area. (AD) represent the serial number of the image.
Sustainability 16 00444 g004
Figure 5. Pearson’s correlation analysis between soil physicochemical properties and environmental indicators.
Sustainability 16 00444 g005
Figure 6. Stepwise regression path and prediction model between SOC, SIC, TN, AN, and soil physicochemical properties and environmental indicators. The width of the lines indicates the standardized coefficients. *** p < 0.001, ** p < 0.05.
Sustainability 16 00444 g006
Table 1. Soil carbon and nitrogen nutrient classification standards.
Indicator123456
SOM (g·kg−1)>4030–4020–3010–206–10<6
SOC (g·kg−1)>23.217.4–23.211.6–17.45.8–11.63.5–5.8<3.5
TN (g·kg−1)>21.5–21–1.50.75–10.5–0.75<0.5
AN (mg·kg−1)>150120–15090–12060–9030–60<30
Table 2. Geostatistical analysis of SOC, SIC, TN, and AN.
IndicatorTheoretical ModelNugget
C0
Sill C0+CRange
Km
Proportion
C0/(C0+C)
R2RSS
SOC (g·kg−1)Exponential4.85019.059.60.7450.61625.81
SIC (g·kg−1)Spherical0.1230.6846.90.8200.6810.017
TN (g·kg−1)Spherical0.0210.1546.20.8640.7620.002
AN (mg·kg−1)Spherical0.0000.2247.11.0000.7570.009
R2: coefficient of determination; RSS: residual sum of squares.
Disclaimer/Publisher’s Note: The statements, opinions and data contained in all publications are solely those of the individual author(s) and contributor(s) and not of MDPI and/or the editor(s). MDPI and/or the editor(s) disclaim responsibility for any injury to people or property resulting from any ideas, methods, instructions or products referred to in the content.

