Abstract
Artificial afforestation is considered as one of the key ecological restoration measures. The early large-scale, single-species afforestation method is considered detrimental to the environment. However, there is still a lack of empirical research on the differences in understory biodiversity between monoculture and mixed forests, as well as the response mechanisms of understory plants to environmental factors. We compared the differences in understory plant diversity in different types of plantations and analyzed the differences in understory species composition and the impact of understory plants on local scales (soil organic matter, soil-available phosphorus, and distance from the road) and landscape scales (patch density, landscape fragmentation, and patch diversity) and environmental variable response mechanisms in a mountainous area. Our findings revealed that there was no significant difference in overall understory plant diversity between monoculture and mixed forests, but the perennial species and native species in the mixed forest were significantly higher than those in the monoculture. In monoculture plots, the disparity in species composition was more pronounced compared to that observed in mixed plots. Soil organic matter had a positive effect on understory plant diversity, and soil available phosphorus and distance from the road significantly affected plant diversity in monoculture forests but had no effect in mixed forests. Landscape-scale environmental factors have no effect on understory species diversity. The findings of the current study emphasize the disparities in the plant species composition between mixed and monoculture forest plantations, as well as their respective reactions to environmental factors.
1. Introduction
Many countries have adopted the practice of artificial afforestation as a strategy to protect and preserve mountainous ecosystems. Mountain ecosystems have received increasing attention from ecologists in recent decades. Due to its physical isolation from other ecosystems, the mountain ecosystem can often form unique habitats that support the survival of specific species [1]. However, compared to other ecosystems, mountain ecosystems are more fragile and more susceptible to human disturbance. Afforestation is widely used as a strategy to protect mountain ecosystems by restoring forest cover, thereby mitigating climate change, conserving biodiversity and achieving sustainable development [2].
China has been carrying out large-scale afforestation activities since the 1980s. Chongli District in Zhangjiakou City, Hebei Province, is a major corridor for wind and sand intrusion into Beijing from the Inner Mongolian Plateau. In order to prevent soil erosion and green the ecological environment of the Beijing–Tianjin area, the government has implemented key national greening projects such as the “Three North Protective Forests” and the construction of the “Saibei Forestry Farm”. After many years of afforestation, the species of artificial forests include spruce, camphor pine, white birch, tufted white birch, five-horned maple, tufted five-horned maple, Mongolian oak, tufted Mongolian oak, Hebei poplar, silver poplar, Beijing poplar, etc., with the heights of the seedlings ranging from 70 cm to 3 m, and the design of afforestation heights ranging from 4 m to 10 m; the shrubs include saffron grass and sandy cypress.
As an important part of terrestrial ecosystems, planted forests play an important role in restoring and rebuilding forest ecosystems, providing forest products, increasing forest carbon sinks, and improving the ecological environment [3]. However, afforestation activities have caused extensive habitat changes, which will inevitably lead to variations in biodiversity. Some scientists have carried out research on related issues [4,5]; however, most related studies focus on large-scale assessments, and there is still a lack of specific empirical studies on the impact of plantations on biodiversity [6].
In artificial forests, plant diversity is mainly reflected through understory vegetation due to the homogeneity of stand types [7]. The presence of understory vegetation plays a significant role in plantation ecosystems, influencing the flow of energy and the cycling of nutrients within forest ecosystems [8]. Understory vegetation responds quickly to natural and anthropogenic disturbances, and if the environment changes, the diversity of understory plants will change significantly, which in turn will affect other species [9]. Studies have verified that understory plant diversity is highly correlated with soil microorganisms [10], Coleoptera [11], bees [12], and other organisms’ diversity; therefore, understory plants can be used as indicator species for biodiversity in plantation ecosystems. At present, research on understory biodiversity in plantations has mostly targeted oak, pine, etc., and has focused on natural forests, secondary forests, and other stand types, while research on understory biodiversity in plantation forests is still lacking [13].
There is controversy over differences in understory plant diversity between monoculture and mixed forests. At present, the artificial forests in most areas are monoculture plantations. Studies have found that although monocultures are good at supporting carbon emissions and soil and water conservation ecological services, their impact on biodiversity is controversial [14]. Many studies have found that monocultures may have problems such as low nutrient turnover efficiency, poor stand stability, low productivity, and weak disease resistance due to their simple structure [15]. However, ecological processes in mixed forests are more complex and stable, and interspecific competition among tree species has been observed over an extended period of time in these forests [16]. Also in young stands, mixed plantation forests store more carbon than monoculture forests [17]. Therefore, artificial afforestation in many areas has begun to adopt multi-species mixed planting methods. However, evidence suggests that biodiversity in mixed multi-species woodlands is not always better than in monoculture forests [18], that differences in understory biodiversity may only be reflected in species composition rather than species number, and that significant differences in species often take at least 10 years to develop [19]. There is still a lack of research on specific species, the completion of which will help to further reveal the causes and patterns of biodiversity differences in monocultures and mixed forests.
Many environmental factors affect the diversity of understory vegetation. At the local scale, the distribution of plant species is influenced by various factors such as the species of the upper trees, the soil pH, organic matter, nitrogen, phosphorus, and potassium [20]. Studies have found that the spatial heterogeneity of soil organic matter in mountainous areas is high, which may make soil organic matter a decisive factor affecting plant diversity [21]. In addition, human interference is an important but sometimes overlooked influencing factor; cars, pedestrians, and other activities may disperse plant seeds, dust, grazing, trampling, and other disturbances may change the plant community [22]. In recent years, research has gradually paid attention to environmental variables at the landscape scale. Some studies have found that patch area has a significant positive effect on plant species diversity [23], and habitat fragmentation can lead to biodiversity loss [24]; nevertheless, drivers of biodiversity in fragmented habitats are complex and controversial [25,26]. Fragmented landscapes may increase landscape heterogeneity, which may have a positive effect on plant diversity within the habitat [27]. At present, there are few studies that explore the influence of understory plant diversity by multi-scale environmental factors; the responses of different types of forests to environmental factors are still unclear [6]. This is not conducive to predicting and assessing the ecological impacts of afforestation, as well as to the development of management measures for planted forests.
In this research, the mountainous regions situated in North China were chosen as a case study to examine two distinct types of plantation forests: monoculture (MON) and mixed (MIX). We analyzed the differences in plant diversity in different types of plantations in mountainous areas and explored the influencing mechanism of environmental factors on plant diversity under the forest. We evaluated (1) whether there are differences in understory plant diversity between two different types of plantations. (2) What are the differences in the composition of understory vegetation communities between two different types of plantations? (3) Does understory plant diversity respond consistently to environmental variables in pure and mixed forests?
2. Materials and Methods
The study area is located in Chongli District, Zhangjiakou City, Hebei Province (40°47′~41°17′ N, 114°17′~115°34′ E). This is the transition zone between the Inner Mongolian Plateau and the North China Plain, which belongs to the East Asian continental monsoon climate and is in the middle temperate sub-arid zone. The overall temperature in this area is low, the annual average temperature is −2 °C~12 °C, the winter is cold and long, the summer is cool and short, and the temperature difference between day and night is large. Eight percent of the total area of Chongli District is mountainous, with steep mountains, and the altitude ranges from 813 to 2174 m. Due to the protection of forests and artificial afforestation, the overall forest cover of the area exceeds 52%.
2.1. Plantation Situation
Before the 1960s, the forest coverage rate of Chongli District was only 15%, and the forest and grass coverage was less than 50%. The types of forest soil are mainly brown soil, chestnut soil, gray forest soil, brown soil, and meadow soil. The primary tree species are Pinus tabuliformis, Larix gmelinii, Cinnamomum camphora, Ulmus pumila, and other species. In order to improve the ecology and benefit the people, the implementation of large-scale afforestation activities commenced. Since 2009, the local construction of larch, Cinnamomum camphora, and other pure forest and mixed forest plantings has been undertaken (Figure A1).
2.2. Vegetation Data
In June and mid-September 2016, sample plots of monoculture and mixed forest plantings were introduced in Chongli District, with coniferous forest comprising the monoculture and a mixture of additional species composing the mixed coniferous forest component. A total of 18 sample plots were selected, 9 each from the monoculture forest and the mixed forest (Figure 1). The age of the forests in which all samples are located is at least 10 years old, and the largest difference in the age of the forests between the samples is within 10 years (Table A1). All of the plantations in the study area are less than 20 years old, and the organic matter in the forest is low. In the study area, monoculture and mixed forest patches with similar forest ages and similar altitudes were selected, and the area of all forest patches was greater than 30,000 m2, and the distance between the edges of each patch was greater than 1 km. The method of stratified random sampling was used in the plot studies, with 50 m × 50 m designated plots located at the center of each woodland patch. Three 20 m × 20 m subplots were randomly established within each plot to record tree and shrub species and cover and four 1 m × 1 m subplots were randomly selected to allow for the recording of herbaceous species and cover. The data in all of the subplots were combined as averages. Plant species were identified on-site or specimen collections were made and brought back for expert identification (Table A2). Plant species that can adapt to the local environment of Chongli for a long time and grow well are regarded as native species [27]. For determining native species, refer to the Flora of China (http://www.iplant.cn/frps accessed on 1 December 2022).
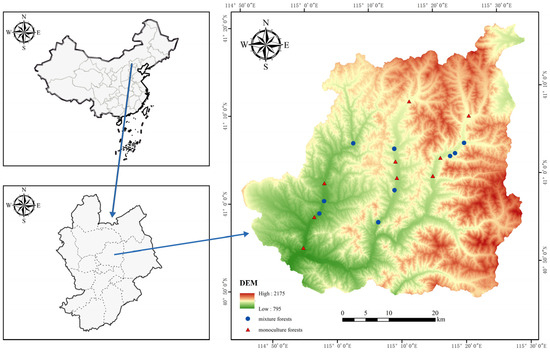
Figure 1.
The location of the study area in Chongli District, Zhangjiakou City, Hebei Province. (DEM: digital elevation model).
2.3. Environmental Factors at the Local Scale
Among the environmental factors at the local scale, because we controlled the other variables such as sunlight and terrain in the selection of plots, only soil physical and human disturbance were selected as local variables. Available phosphorus, soil organic matter, and the distance from the road were selected as key environmental indicators at the local scale. In each plot, the soil was randomly drilled three times with a soil drill, and the topsoil (0–20 cm) was collected, mixed into one soil sample, air-dried, and passed through a 2 mm sieve. The content of total soil organic matter and available phosphorus was determined using an element analyzer.
2.4. Environmental Factors at the Landscape Scale
We used Google remote sensing images with a resolution of 0.2 m in our study area to develop site and plot maps. Using the remote sensing image as the base map with a radius of 1 km around the center of all sample points, digital mapping was carried out according to the site research purpose and the land use composition of the study area on the basis of field verification. Landscapes with a minimum side length greater than 2 m were recorded as patches, and landscapes with a maximum side length of less than 2 m were recorded as linear landscapes or spots. Through manual digitization, the information obtained from the survey was converted into a unified GIS database, and after digitization was completed, layer stitching, correction, and registration were carried out, and the necessary repairs were implemented to obtain a complete spatial vector data layer that met the topological requirements. Three indicators were calculated at each sample site, including the patch density, landscape fragmentation, and Shannon diversity index value.
2.4.1. Landscape Fragmentation
Fragmentation analysis refers to the degree of distribution of landscape elements in the study area, which consists of the number of patches (NP), the patch density (PD), and the average patch area (AREA_MN). Patch density refers to the number of patches per unit area in a landscape that includes all heterogeneous landscape element patches and is able to characterize the degree of fragmentation of the landscape pattern. The calculation formula is as follows:
where n is the total number of landscape types, Mi is the number of landscape patches of category i, and LA is the total area of the landscape within the study area.
2.4.2. Patch Shannon Diversity Index (SHDI)
The Shannon diversity index is an important indicator reflecting the heterogeneity of the landscape, which can more accurately identify the spatial non-equilibrium distribution of each patch type in the landscape. The calculation formula is as follows:
where pi is the ratio occupied by landscape patch type i.
2.5. Biodiversity Index
The species richness index (R) and Simpson diversity index (D) were used to assess biodiversity. The calculation formula is as follows:
where S is the number of species in the simple plot and Pi is the proportion of individuals of this species to the total number of individuals.
2.6. Statistical Analyses
In the process of data analysis, the species richness and Simpson diversity indices of plants in the monoculture and mixed forest groups were calculated. One-way ANOVA and the t-test were used to analyze the significance of the difference between the indices of understory plant diversity. NMDS analysis based on the Bray–Curtis distance algorithm was used to analyze the species composition. Stepwise linear regression was utilized to analyze the influence of organic matter and other factors on understory plant diversity. Linear regression analysis was performed on different types of forest understory plant diversity and different environmental variables. PAST 3.0 and SPSS 26.0 software were used for statistical analysis. ArcGIS 10.0 software was employed for the landscape survey and digitization. Fragstats4.0 software was utilized for landscape index calculation. Origin 2021 software was used for mapping.
3. Results
3.1. Comparison of Understory Plant Diversity between the Monoculture and Mixed Forests
Our results showed that there was no significant difference in total understory plant diversity between monocultures (MON) and mixed forest conditions (MIX) and that there was no difference both in species richness and Simpson diversity index values (p > 0.05). The mean species richness of the MIX was 30.5 and the average species richness of the MON was 25.1. The average Simpson diversity value of the MIX was 0.926, and the average value of Simpson diversity of the MON was 0.885. The average species richness and Simpson diversity of the MIX were higher than that of the MON. Nevertheless, comparisons between the two groups showed no significant differences (Figure 2).
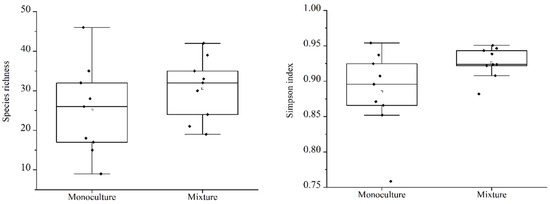
Figure 2.
A comparison of total understory species richness and plant diversity in different types of forests.
Comparing the total understory species richness and Simpson diversity index values of native species (Figure 3), perennial species (Figure 4), and annual species (Figure 5), the results indicate that between the different types of woodlands, only the perennial species richness and Simpson diversity index values found in the MIX were significantly higher than in the MON, with no significant differences in the other species groups. The mean values of species richness (7.22, 7.00) and diversity (0.69, 0.67) in the MON were slightly higher than those in the MIX.
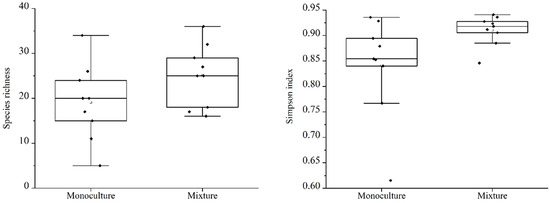
Figure 3.
A comparison of the native understory species richness index and plant diversity in different types of forests.
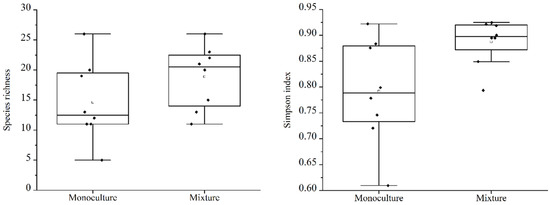
Figure 4.
A comparison of perennial understory native species richness and plant diversity in the different types of forests.
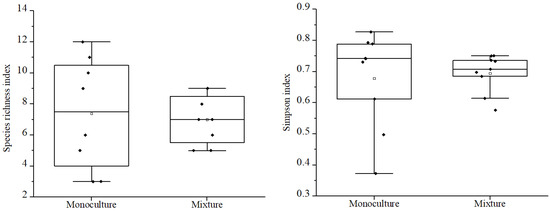
Figure 5.
A comparison of annual understory species richness and plant diversity in the different types of forests.
The results of non-metric multidimensional scaling (NMDS) analysis showed that there were differences in species composition between the MON and the MIX (Figure 6). Although the values of the different types of plots are not completely separated, the distribution of the pure understory plots is relatively scattered in the figure, indicating that the species composition differences between the different plots are relatively large, the distribution of mixed understory plants is relatively concentrated, and the species composition differences are small, presenting a nested structure as a whole.
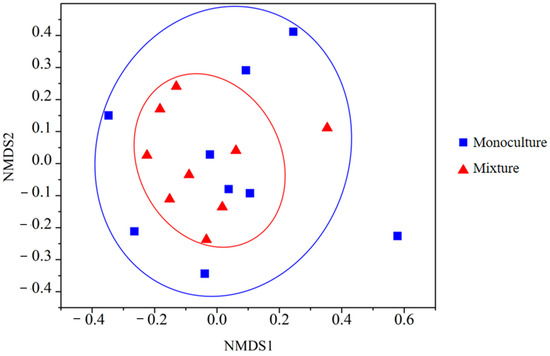
Figure 6.
Results of the non-metric multidimensional scale analysis.
3.2. Response Analysis of Understory Plants to Environmental Factors
In the stepwise regression model, the independent variables are total soil nitrogen, soil-available phosphorus, soil organic matter, soil pH value, patch density, landscape fragmentation, the Shannon patch diversity index, and the distance from the road. Only variables that are significantly correlated with the independent variable are shown (Table 1). Soil organic matter showed a significant effect (p < 0.05) on plant diversity in all models. For all plant species, native species, and perennials, there was no significant effect of other variables except soil organic matter. For annual plants, soil organic matter, soil-available phosphorus, and road distance had significant effects on species richness.

Table 1.
Stepwise regression analysis results of environmental factors on plant diversity under monoculture and mixed forest conditions.
We conducted a regression analysis on the understory plant diversity and environmental variables in the two different types of forests. Since the stepwise regression analysis shows that the landscape-scale environmental variables have no significant effect on the species richness, only the local scale variables, soil organic matter, soil-available phosphorus, and the distance from a road, were analyzed (only the results with differences are shown). The results indicate that soil organic matter had positive effects on plant species richness in both the MON and the MIX. The regression analysis results of soil-available phosphorus, the distance from the road, and plant species richness (Figure 7 and Figure 8) show that in the MON, understory plant species richness increases with soil-available phosphorus and also increases with the distance from the road. However, in the MIX, the species richness of understory plants was not significantly correlated with soil-available phosphorus and the distance from the road.
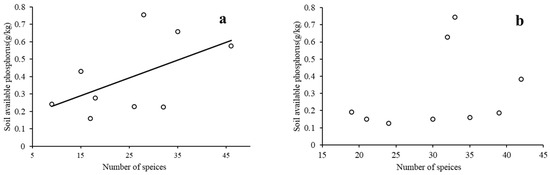
Figure 7.
Linear regression between understory plant species richness and soil-available phosphorus in different types of forests ((a): monoculture, p = 0.02; (b): mixed forest, p = 0.48; no trendline for insignificant cases).
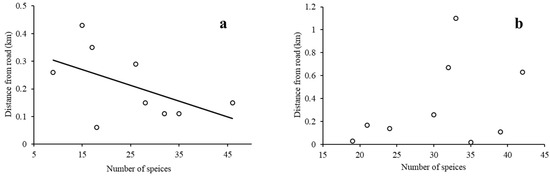
Figure 8.
Linear regression between understory plant species richness and distance from the road in different types of forests ((a): monoculture, p = 0.02; (b): mixed forest, p = 0.36; no trendline for insignificant cases).
4. Discussion
4.1. Differences in Plant Understory Diversity under Different Mixtures of Tree Species
Our results show no significant difference in overall plant diversity in the MON and the MIX, a result that has been seen in other studies [19]. The understory plant diversity of monoculture and mixed forests is not always different. One possible reason for this is that some studies have found that only diversified vertical structures in woodlands can effectively increase ecological niches [28]. The vertical structure of forests in mountainous areas in temperate regions is generally simple. There are few niches in both the MON and the MIX, so there was no significant difference in plant diversity. Another reason is the overlapping canopy of the MIX, which may lead to less sunlight under the forest and could have a negative impact on understory plant diversity [29]. Therefore, in the process of afforestation, we should not only consider the type of plantation forest but also give full consideration to its planting structure, light harvesting, and other factors.
In this study, although there was no difference in total understory plant diversity between the MON and the MIX, there were significant differences in understory perennial and native plant diversity. Studies have found that the MIX is more resistant to alien species than the MON [30]. At the sites surveyed in this study, the site canopy density of mixed forests was higher than that of pure forests. Non-indigenous invasive plant species usually disperse in abiotic ways, while the proportion of abiotic dispersal species in native plants is very low. High canopy density in mixed forests may prevent the spread of wind-borne seeds [31]. This leads to the dispersal advantage of native species. In addition, the stability of the MON and MIX ecosystems is different. The stability of the MIX is higher than that of the MON, its ability to resist external disturbance is strong, and the understory environment is relatively stable [32]. According to Grime’s three main ecological strategies, species are competitors, they differ in their tolerance of stress, and they can be ruderal (CSR plant strategies) [33]. Most perennial species belong to the C (competitor) strategy; they adapt to a relatively stable environment and have strong competitiveness (it is easier to gain an advantage in mixed forests), so the diversity of perennials in the MIX is higher than that in the MON. However, most annual plants belong to the ruderal strategy and can adapt to different environments, so there is no difference between the MON and the MIX.
The results of non-metric multidimensional scaling analysis (NMDS) show that the species difference in the MIX is smaller than that in the MON. Mixed forests can resist external interference to a certain extent and maintain a relatively stable environment. A long-term stable environment is conducive to the formation of a stable community structure. Once a stable community is formed, the species turnover rate will soon decline [34]. Therefore, if the climatic conditions are similar, the ability of mixed forests to resist disturbance may make the understory microclimate environment very close, which will also lead to the consistency of understory plant species [19]. However, in the MON, the environment is easily disturbed and changes and the understory species will also change accordingly. Because the MON cannot provide diversified living conditions and the ecological niche is limited, when annual plants and non-native plants successfully colonize at the beginning of habitat establishment, rapid reproduction is an advantage and other species have little opportunity to invade again [35]. Consequently, the MON’s understory species composition will show higher heterogeneity.
4.2. The Response of Plant Diversity to Environmental Factors
The results of the stepwise regression analysis (Table 1) show that soil organic matter had a significant impact on plant diversity in all groups. All of the plantations in the study area are younger than 20 years old, and the organic matter in the forest soils is low. Many studies have found that soil organic matter is significantly correlated with plant diversity. Organic matter not only plays a decisive role in soil structure but also determines the biomass and diversity of soil microorganisms [36,37]. The slope of mountainous forest land is relatively large, coupled with the low average temperature, and makes it difficult to accumulate organic matter in the soil. Soil organic matter may be a limiting factor for plant diversity in the early stages of plant establishment in mountain areas. Therefore, before afforestation, we recommend that the land be fully investigated to understand the regional soil organic matter content and evaluate its suitability for afforestation, thus providing a basis for the selection of afforestation sites.
Our results showed that soil-available P had a positive effect on the species richness of annuals but not perennials. Therefore, when planting, soil-available phosphorus should be fully considered, the land should be fully surveyed, and annual plants should be preferentially selected for planting in areas rich in available phosphorus. Soil-available phosphorus is very important for plant growth and reproduction, but the utilization efficiency of soil-available phosphorus is highly correlated with the life form of plants. The utilization rate of soil-available phosphorus for annual plants is significantly higher than that of perennial plants [38]. In this study, the perennial plants were well represented in the mixed forest and were less susceptible to the limitation of soil-available P. Thus, there was no correlation between them.
The distance to the closest road affects the retention of soil organic matter, the diversity of soil microorganisms, and a series of human disturbances such as air pollution, trampling, and light grazing [39,40]. In this study, it was found that species richness was negatively correlated with road distance in the MON but not in the MIX. This may indicate that the MON is less resistant to stress than the MIX. Perennial plants in mixed forests can resist the impact of human disturbance to a certain extent due to their high resistance to abiotic stress [41]. Therefore, in areas with high intensity of human disturbance, we should prioritize the limited consideration of planting mixed forests to resist the effects of human disturbance.
In this study, there was no correlation between landscape-scale environmental factors and understory plant diversity, which may be due to the low landscape heterogeneity in the study area, and the lack of complex landscape composition around the sample plot, which did not form a landscape gradient. Another possibility is that some studies have found that landscape composition in many cases does not have an impact on plant diversity [42]. If the habitat itself is relatively harsh and only allows some habitat-specific species to survive, the role of the landscape pattern will be weakened [43,44]. Our study area is located in a mountainous area with a relatively high altitude and the site and study location experiences long-term drought and low temperatures every year. This stressful climate condition may be one of the reasons why the landscape pattern does not have an impact.
5. Conclusions
This study examined the variations in plant diversity and species composition across several forest types and the underlying mechanisms that influence understory plant diversity in plantation environments. The diversity of understory perennial plants and native plants in mixed forests was found to be significantly greater compared to monoculture forests. The difference in species composition between plots in the monoculture forests was larger than that in the mixed forest. Environmental factors at the local scale have a significant impact on plant diversity, and soil organic matter plays an important role in different types of forests. Due to variations in environmental stability and plant species composition, different types of forests exhibit inconsistent responses to soil phosphorus availability and their proximity to roads. Species richness in the monoculture was significantly affected by soil-available phosphorus and the distance from the road but not in mixed forests. Landscape-scale environmental variables had no significant impact on understory plant diversity. This study found that although there is no difference in overall plant diversity between the two types of forests as whole plant floras, annual plants, and non-native plants account for more of the species richness in monoculture forests and that the species are vulnerable to environmental changes and less stable than in mixed forests. Our research shows that afforestation projects should focus on the construction of mixed forests and soil conditions, especially the content of soil organic matter should be taken into consideration during afforestation.
Author Contributions
Conceptualization, X.L. and M.F.S.; methodology, X.L.; software, Z.Q. and J.L.; formal analysis, Z.Q.; investigation, X.L. and G.A.; data curation, J.L.; writing—original draft preparation, X.L., M.F.S. and Z.Q.; writing—review and editing, J.L.; visualization, J.L.; supervision, M.F.S.; project administration, M.F.S.; funding acquisition, X.L. and M.F.S. All authors have read and agreed to the published version of the manuscript.
Funding
This research was funded by the National Natural Science Foundation of China (No. 32201429). This work was jointly supported by the Fellowship of China Postdoctoral Science Foundation (2023M742083) and the Qingdao Postdoctoral Research Supporting Project (QDBSH20230202002) awarded to Dr. Muhammad Fahad Sardar. The authors would like to extend their sincere appreciation and acknowledgment; to the research supporting project (RSP-2024/95, King Saud University, Riyadh, Saudi Arabia).
Institutional Review Board Statement
Not applicable.
Informed Consent Statement
Not applicable.
Data Availability Statement
The authors will provide the raw data supporting the conclusions of this article upon request, without undue delay.
Conflicts of Interest
The authors declare that they do not have any commercial or financial relationships that could be perceived as conflicts of interest.
Appendix A
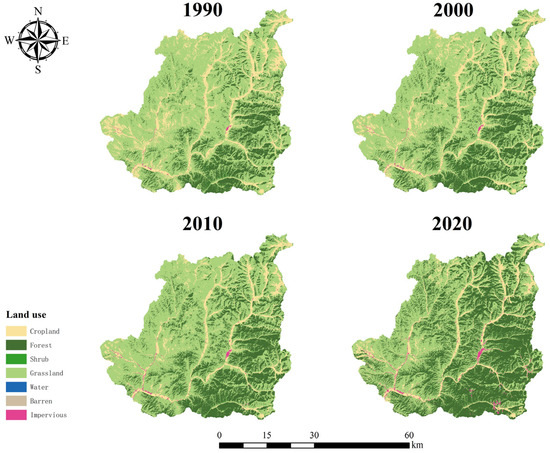
Figure A1.
Land use cover change in Chongli District 1990–2020.
Table A1.
Overview of sample plots in plantation forests of different ages.
Table A1.
Overview of sample plots in plantation forests of different ages.
| Sample Plots | Latitude | Longitude | Forest Age |
|---|---|---|---|
| DP1 | 41°01’06.13 | 115°11’47.45 | 14 |
| DP2 | 41°02’59.15 | 115°11’49.76 | 16 |
| DP3 | 41°09’39.71 | 115°14’54.75 | 19 |
| XP1 | 40°54’13.24 | 114°56’09.61 | 18 |
| XP2 | 40°57’36.30 | 114°58’19.56 | 14 |
| XP3 | 41°01’20.53 | 115°00’25.75 | 13 |
| ZP1 | 41°00’54.34 | 115°17’24.40 | 11 |
| ZP2 | 41°02’53.02 | 115°18’52.32 | 12 |
| ZP3 | 41°07’20.27 | 115°23’58.20 | 15 |
| DM1 | 40°56’16.24 | 115°08’11.29 | 15 |
| DM2 | 40°59’43.75 | 115°11’13.39 | 16 |
| DM3 | 41°04’26.88 | 115°11’50.83 | 13 |
| XM1 | 40°57’57.00 | 114°59’10.23 | 16 |
| XM2 | 40°59’17.95 | 115°00’06.52 | 15 |
| XM3 | 41°05’33.41 | 115°05’32.48 | 18 |
| ZM1 | 41°02’58.02 | 115°20’24.44 | 19 |
| ZM2 | 41°03’14.03 | 115°21’13.41 | 18 |
| ZM3 | 41°04’17.31 | 115°22’47.92 | 19 |
P: monoculture forest. M: mixed forest.
Table A2.
List of plant species found in the study areas.
Table A2.
List of plant species found in the study areas.
| Latin Name | Family Name | Generic Name |
|---|---|---|
| Sonchus arvensis | Composite | Sonchus |
| Chenopodium glaucum | Amaranthaceae | Chenopodium |
| Poa annua | Gramineae | Poa |
| Leymus chinensis | Gramineae | Leymus |
| Geranium wilfordii | Geraniaceae | Geranium |
| Brassica oleracea | Cress | Brassica |
| Fraxinus mandschurica | Oleaceae | Fraxinus |
| Tamarix chinensis | Tamaricaceae | Tamarix |
| Plantago depressa | Plantaginaceae | Plantago |
| Ixeris polycephala | Composite | Ixeris |
| Leonurus sibiricus | Labiatae | Leonurus |
| Leonurus artemisia | Labiatae | Leonurus |
| Ixeris dissecta | Composite | Ixeris |
| Arundinella anomala | Gramineae | Arundinella |
| Glycine soja | Leguminosae | Glycine |
| Oxytropis racemosa | Leguminosae | Oxytropis |
| Caragana korshinskii | Leguminosae | Caragana |
| Taraxacum mongolicum | Composite | Taraxacum |
| Viola prionantha | Violaceae | Viola |
| Carex duriuscula subsp. stenophylloides | Eriospermaceae | Carex |
| Rosa bella | Rosaceae | Rosa |
| Spiraea pubescens | Rosaceae | Spiraea |
| Agrimonia pilosa | Rosaceae | Agrimonia |
| Euphorbia fischeriana | Ellphorbiaceae | Euphorbia |
| Stellera chamaejasme | Thymelaeaceae | Stellera |
| Aconitum barbatum var. puberulum | Ranunculaceae | Aconitum |
| Dracocephalum moldavica | Labiatae | Dracocephalum |
| Ampelopsis aconitifolia | Vitaceae | Ampelopsis |
| Artemisia annua | Composite | Artemisia |
| Viola variegata | Violaceae | Viola |
| Viola pseudo-bambusetorum | Violaceae | Viola |
| Thalictrum squarrosum | Ranunculaceae | Thalictrum |
| Clematis aethusifolia | Ranunculaceae | Clematis |
| Papaver nudicaule | Papaveraceae | Papaver |
| Oplismenus compositus | Gramineae | Oplismenus |
| Astragalus adsurgens | Leguminosae | Astragalus |
| Arabis pendula | Cruciferae | Arabis |
| Astragalus membranaceus | Leguminosae | Astragalus |
| Vicia unijuga | Leguminosae | Vicia |
| Equisetum arvense | Equisetaceae | Equisetum |
| Sanguisorba officinalis | Rosaceae | Sanguisorba |
| Datura stramonium | Solanaceae | Datura |
| Armeniaca sibirica | Rosaceae | Armeniaca |
| Polygala tenuifolia | Polygalaceae | Polygala |
| Potentilla supina | Rosaceae | Potentilla |
| Roegneria kamoji | Gramineae | Roegneria |
| Melilotus officinalis | Leguminosae | Melilotus |
| Medicago lupulina | Leguminosae | Medicago |
| Saussurea japonica | Laminariaceae | Saussurea |
| Artemisia scoparia | Composite | Artemisia |
| Euphorbia esula | Ellphorbiacea | Euphorbia |
| Artemisia argyi | Composite | Artemisia |
| Elymus dahuricus | Gramineae | Elymus |
| Vicia cracca | Leguminosae | Vicia |
| Artemisia capillaris | Composite | Artemisia |
| Campylotropis macrocarpa | Leguminosae | Campylotropis |
| Dendranthema chanetii | Composite | Dendranthema |
| Potentilla flagellaris | Rosaceae | Potentilla |
| Poa sphondylodes | Gramineae | Poa |
| Inula japonica | Composite | Inula |
| Ostryopsis davidiana | Betulaceae | Ostryopsis |
| Hippophae rhamnoides | Elaeagnaceae | Hippophae |
| Deyeuxia arundinacea | Gramineae | Deyeuxia |
| Leontopodium leontopodioides | Composite | Leontopodium |
| Corydalis yanhusuo | Papaveraceae | Corydalis |
| Vicia sativa | Leguminosae | Vicia |
| Geranium sibiricum | Geraniaceae | Geranium |
| Bidens parviflora | Composite | Bidens |
| Adenophora polyantha | Campanulaceae | Adenophora |
| Galium verum | Bubiaceae | Galium |
| Rubia cordifolia | Bubiaceae | Rubia |
| Halerpestes ruthenica | Ranunculaceae | Halerpestes |
| Pteridium aquilinum var. latiusculum | Polypodiaceae | Pteridium |
| Sonchus oleraceus | Composite | Sonchus |
| Myosoton aquaticum | Caryophyllaceae | Myosoton |
| Scorzonera sinensis | Composite | Scorzonera |
| Polygala tenuifolia | Poiygalaceae | Polygala |
| Hemistepta lyrata | Composite | Hemistepta |
| Agropyron cristatum | Gramineae | Agropyron |
| Bupleurum chinense | Apiaceae | Bupleurum |
| Thymus mongolicus | Labiatae | Thymus |
| Caragana jubata | Leguminosae | Caragana |
| Iris dichotoma | Iridaceae | Iris |
| Salsola collina | Amaranthaceae | Salsola |
| Lepidium apetalum | Cruciferae | Lepidium |
| Saussurea davurica | Composite | Saussurea |
| Potentilla multicaulis | Rosaceae | Potentilla |
| Argentina anserina | Rosaceae | Argentina |
| Phragmites australis | Gramineae | Phragmites |
| Caragana rosea | Leguminosae | Caragana |
| Cynanchum chinense | Apocynaceae | Cynanchum |
| Populus simonii | Salicaceae | Populus |
| Cirsium setosum | Composite | Cirsium |
| Duchesnea indica | Rosaceae | Duchesnea |
| Equisetum ramosissimum | Equisetaceae | Equisetum |
| Commelina diffusa | Dayflower | Commelina |
| Unknown | Apiaceae | |
| Saposhnikovia divaricata | Apiaceae | Saposhnikovia |
| Allium senescens | Liliaceae | Allium |
| Imperata cylindrica | Gramineae | Imperata |
| Cynanchum thesioides | Asclepiadaceae | Cynanchum |
| Polygonatum sibiricum | Asparagaceae | Polygonatum |
| Medicago sativa | Leguminosae | Medicago |
| Clematis florida | Ranunculaceae | Clematis |
| Elsholtzia ciliata | Labiatae | Elsholtzia |
| Saussurea ussuriensis | Composite | Saussurea |
| Gentiana macrophylla | Gentianaceae | Gentiana |
| Scabiosa tschiliensis | Dipsacaceae | Scabiosa |
| Vigna radiata | Leguminosae | Vigna |
| Sibbaldianthe bifurca | Rosaceae | Sibbaldianthe |
| Unknown | Composite | |
| Aster tataricus | Composite | Aster |
| Setaria viridis | Gramineae | Setaria |
| Parthenocissus tricuspidata | Vitaceae | Parthenocissus |
| Oxytropis coerulea | Leguminosae | Oxytropis |
| Potentilla kleiniana | Rosaceae | Potentilla |
| Iris lactea var. chinensis | Freesia | Iris |
| Heracleum hemsleyanum | Apiaceae | Heracleum |
| Echinops sphaerocephalus | Composite | Echinops |
| Melilotus officinalis | Leguminosae | Melilotus |
| Clinopodium chinense | Labiatae | Clinopodium |
| Oxalis corniculata | Oxalidaceae | Oxalis |
| Halenia corniculata | Gentianaceae | Halenia |
| Halerpestes ruthenica | Ranunculaceae | Halerpestes |
| Avena fatua | Gramineae | Avena |
| Potentilla chinensis | Rosaceae | Potentilla |
| Vicia sepium | Leguminosae | Vicia |
| Stemmacantha uniflora | Composite | Stemmacantha |
| Medicago ruthenica | Leguminosae | Medicago |
| Lomatogonium carinthiacum | Gentianaceae | Lomatogonium |
| Patrinia scabiosaefolia | Valerianaceae | Patrinia |
| Adenophora paniculata | Campanulaceae | Adenophora |
| Paraixeris serotina | Compositae | Paraixeris |
| Plantago asiatica | Plantaginaceae | Plantago |
| Bidens pilosa | Composite | Bidens |
| Cirsium setosum | Composite | Cirsium |
| Asparagus schoberioides | Liliaceae | Asparagus |
| Pinus thunbergii | Pinaceae | Pinus |
| Stipa capillata | Gramineae | Stipa |
| Kalimeris lautureana | Composite | Kalimeris |
| Populus tomentosa | Salicaceae | Populus |
| Larix gmelinii | Pinaceae | Larix |
| Rhamnus parvifolia | Rhamnaceae | Rhamnus |
References
- Hurni, H.; von Dach, S.W.; Zimmermann, A. (Agro)Biodiversity in Mountains. Mt. Res. Dev. 2010, 30, 191. [Google Scholar] [CrossRef]
- Di Sacco, A.; Hardwick, K.A.; Blakesley, D.; Brancalion, P.H.S.; Breman, E.; Cecilio Rebola, L.; Chomba, S.; Dixon, K.; Elliott, S.; Ruyonga, G.; et al. Ten Golden Rules for Reforestation to Optimize Carbon Sequestration, Biodiversity Recovery and Livelihood Benefits. Glob. Chang. Biol. 2021, 27, 1328–1348. [Google Scholar] [CrossRef] [PubMed]
- Messier, C.; Bauhus, J.; Sousa-Silva, R.; Auge, H.; Baeten, L.; Barsoum, N.; Bruelheide, H.; Caldwell, B.; Cavender-Bares, J.; Dhiedt, E.; et al. For the Sake of Resilience and Multifunctionality, Let’s Diversify Planted Forests! Conserv. Lett. 2022, 15, e12829. [Google Scholar] [CrossRef]
- Delaux, P.M.; Schornack, S. Plant evolution driven by interactions with symbiotic and pathogenic microbes. Science 2021, 371, eaba6605. [Google Scholar] [CrossRef] [PubMed]
- Zhang, Y.Z.; Qian, L.S.; Spalink, D.; Sun, L.; Chen, J.G.; Sun, H. Spatial phylogenetics of two topographic extremes of the Hengduan Mountains in southwestern China and its implications for biodiversity conservation. Plant Divers. 2021, 43, 181–191. [Google Scholar] [CrossRef] [PubMed]
- Lan, G.; Chen, B.; Yang, C.; Sun, R.; Wu, Z.; Zhang, X. Main drivers of plant diversity patterns of rubber plantations in the Greater Mekong Subregion. Biogeosciences 2022, 19, 1995–2005. [Google Scholar] [CrossRef]
- Isbell, F.; Calcagno, V.; Hector, A.; Connolly, J.; Harpole, W.S.; Reich, P.B.; Scherer-Lorenzen, M.; Schmid, B.; Tilman, D.; Van Ruijven, J.; et al. High Plant Diversity Is Needed to Maintain Ecosystem Services. Nature 2011, 477, 199–202. [Google Scholar] [CrossRef]
- Dănescu, A.; Albrecht, A.T.; Bauhus, J. Structural diversity promotes productivity of mixed, uneven-aged forests in southwestern Germany. Oecologia 2016, 182, 319–333. [Google Scholar] [CrossRef]
- Duan, W.; Ren, H.; Fu, S.; Wang, J.; Zhang, J.; Yang, L.; Huang, C. Community Comparison and Determinant Analysis of Understory Vegetation in Six Plantations in South China. Restor. Ecol. 2010, 18, 206–214. [Google Scholar] [CrossRef]
- Mboukou-Kimbatsa, I.; Bernhard-Reversat, F.; Loumeto, J.-J.; Ngao, J.; Lavelle, P. Understory vegetation, soil structure and soil invertebrates in Congolese eucalypt plantations, with special reference to the invasive plant Chromolaena odorata and earthworm populations. Eur. J. Soil Biol. 2007, 43, 48–56. [Google Scholar] [CrossRef]
- Li, X.; Liu, Y.; Duan, M.; Yu, Z.; Axmacher, J.C. Different response patterns of epigaeic spiders and carabid beetles to varying environmental conditions in fields and semi-natural habitats of an intensively cultivated agricultural landscape. Agric. Ecosyst. Environ. 2018, 264, 54–62. [Google Scholar] [CrossRef]
- Bihaly, D.; Kovács-Hostyánszki, A.; Szalai, M.; Sárospataki, M. Nesting activity of cavity-nesting bees and wasps is lower in small-scale apple orchards compared to nearby semi-natural habitats. Agric. For. Entomol. 2021, 23, 49–58. [Google Scholar] [CrossRef]
- Wang, C.; Zhang, W.; Li, X.; Wu, J. A global meta-analysis of the impacts of tree plantations on biodiversity. Glob. Ecol. Biogeogr. 2022, 31, 576–587. [Google Scholar] [CrossRef]
- Lu, H.; Mohren, G.M.J.; Del Río, M.; Schelhaas, M.-J.; Bouwman, M.; Sterck, F.J. Species Mixing Effects on Forest Productivity: A Case Study at Stand-, Species- and Tree-Level in the Netherlands. Forests 2018, 9, 713. [Google Scholar] [CrossRef]
- Liu, C.L.C.; Kuchma, O.; Krutovsky, K.V. Mixed-Species versus Monocultures in Plantation Forestry: Development, Benefits, Ecosystem Services and Perspectives for the Future. Glob. Ecol. Conserv. 2018, 15, e00419. [Google Scholar] [CrossRef]
- Mina, M.; del Río, M.; Huber, M.O.; Thürig, E.; Rohner, B. The symmetry of competitive interactions in mixed Norway spruce, silver fir and European beech forests. J. Veg. Sci. 2018, 29, 775–787. [Google Scholar] [CrossRef]
- Warner, E.; Cook-Patton, S.C.; Lewis, O.T.; Brown, N.; Koricheva, J.; Eisenhauer, N.; Ferlian, O.; Gravel, D.; Hall, J.S.; Jactel, H.; et al. Young Mixed Planted Forests Store More Carbon than Monocultures—A Meta-Analysis. Front. For. Glob. Chang. 2023, 6, 1226514. [Google Scholar] [CrossRef]
- Mestre, L.; Toro-Manríquez, M.; Soler, R.; Huertas-Herrera, A.; Martínez-Pastur, G.; Lencinas, M.V. The influence of canopy-layer composition on understory plant diversity in southern temperate forests. For. Ecosyst. 2017, 4, 6. [Google Scholar] [CrossRef]
- Gong, C.; Tan, Q.; Liu, G.; Xu, M. Impacts of tree mixtures on understory plant diversity in China. For. Ecol. Manag. 2021, 498, 119545. [Google Scholar] [CrossRef]
- Tardy, Y.; Schaul, R.; Duplay, J. Thermodynamic stability fields of humus, microflora and plants. Comptes Rendus De L Acad. Des Sci. Ser. Ii Fasc. A-Sci. De La Terre Et Des Planetes 1997, 324, 969–976. [Google Scholar]
- Li, X.; Hu, W.; Yu, Z. Importance of Soil Organic Matter and the Species Pool for Local Species Richness in Montane Ecosystems. Sustainability 2021, 13, 10634. [Google Scholar] [CrossRef]
- Chi, Y.; Wang, E.; Wang, J. Identifying the anthropogenic influence on the spatial distribution of plant diversity in an estuarine island through multiple gradients. Glob. Ecol. Conserv. 2020, 21, e00833. [Google Scholar] [CrossRef]
- Arellano-Rivas, A.; De-Nova, J.A.; Munguía-Rosas, M.A. Patch isolation and shape predict plant functional diversity in a naturally fragmented forest. J. Plant Ecol. 2018, 11, 136–146. [Google Scholar] [CrossRef]
- Souza, D.G.; Sfair, J.C.; Arroyo-Rodríguez, V.; Santos, J.C.; Tabarelli, M. Depauperation and divergence of plant-specialist herbivore assemblages in a fragmented tropical landscape. Ecol. Entomol. 2019, 44, 172–181. [Google Scholar] [CrossRef]
- Beaune, D.; Bretagnolle, F.; Bollache, L.; Bourson, C.; Hohmann, G.; Fruth, B. Ecological services performed by the bonobo (Pan paniscus): Seed dispersal effectiveness in tropical forest. J. Trop. Ecol. 2013, 29, 367–380. [Google Scholar] [CrossRef]
- Stevenson, P.R.; Link, A.; Onshuus, A.; Quiroz, A.J.; Velasco, M. Estimation of Seed Shadows Generated by Andean Woolly Monkeys (Lagothrix lagothricha lugens). Int. J. Primatol. 2014, 35, 1021–1036. [Google Scholar] [CrossRef]
- Tscharntke, T.; Tylianakis, J.M.; Rand, T.A.; Didham, R.K.; Fahrig, L.; Batáry, P.; Bengtsson, J.; Clough, Y.; Crist, T.O.; Dormann, C.F.; et al. Landscape moderation of biodiversity patterns and processes-eight hypotheses. Biol. Rev. 2012, 87, 661–685. [Google Scholar] [CrossRef]
- Jonsson, M.; Bengtsson, J.; Gamfeldt, L.; Moen, J.; Snäll, T. Levels of forest ecosystem services depend on specific mixtures of commercial tree species. Nat. Plants 2019, 5, 141–147. [Google Scholar] [CrossRef]
- Forrester, D.I.; Ammer, C.; Annighöfer, P.J.; Barbeito, I.; Bielak, K.; Bravo-Oviedo, A.; Coll, L.; del Río, M.; Drössler, L.; Heym, M.; et al. Effects of crown architecture and stand structure on light absorption in mixed and monospecific Fagus sylvatica and Pinus sylvestris forests along a productivity and climate gradient through Europe. J. Ecol. 2018, 106, 746–760. [Google Scholar] [CrossRef]
- Wills, J.; Herbohn, J.; Moreno, M.O.M.; Avela, M.S.; Firn, J. Next-generation tropical forests: Reforestation type affects recruitment of species and functional diversity in a human-dominated landscape. J. Appl. Ecol. 2017, 54, 772–783. [Google Scholar] [CrossRef]
- Qin, X.; Liu, Z.; Liu, M.; Liang, W.; Baskin, C.C.; Baskin, J.M.; Xin, Z.; Li, X.; Wang, Z.; Zhou, Q.; et al. Shrub canopy interception of diaspores dispersed by wind. Seed Sci. Res. 2020, 30, 310–318. [Google Scholar] [CrossRef]
- Felton, A.; Nilsson, U.; Sonesson, J.; Felton, A.M.; Roberge, J.-M.; Ranius, T.; Ahlström, M.; Bergh, J.; Björkman, C.; Boberg, J.; et al. Replacing monocultures with mixed-species stands: Ecosystem service implications of two production forest alternatives in Sweden. Ambio 2016, 45, S124–S139. [Google Scholar] [CrossRef]
- Grime, J.P. Evidence for the Existence of Three Primary Strategies in Plants and Its Relevance to Ecological and Evolutionary Theory. Am. Nat. 1977, 111, 1169–1194. [Google Scholar] [CrossRef]
- Robroek, B.J.M.; Martí, M.; Svensson, B.H.; Dumont, M.G.; Veraart, A.J.; Jassey, V.E.J. Rewiring of peatland plant-microbe networks outpaces species turnover. Oikos 2021, 130, 339–353. [Google Scholar] [CrossRef]
- Stamps, W.T.; Linit, M.J. Plant diversity and arthropod communities: Implications for temperate agroforestry. Agrofor. Syst. 1997, 39, 73–89. [Google Scholar] [CrossRef]
- Pisani, O.; Hills, K.M.; Courtier-Murias, D.; Haddix, M.L.; Paul, E.A.; Conant, R.T.; Simpson, A.J.; Arhonditsis, G.B.; Simpson, M.J. Accumulation of aliphatic compounds in soil with increasing mean annual temperature. Org. Geochem. 2014, 76, 118–127. [Google Scholar] [CrossRef]
- Yao, L.; Guo, N.; He, Y.; Xiao, Y.; Li, Y.; Gao, J.; Guo, Y. Variations of soil organic matters and plant cuticular waxes along an altitude gradient in Qinghai-Tibet Plateau. Plant Soil 2021, 458, 41–58. [Google Scholar] [CrossRef]
- He, M.; Dijkstra, F.A.; Zhang, K.; Li, X.; Tan, H.; Gao, Y.; Li, G. Leaf nitrogen and phosphorus of temperate desert plants in response to climate and soil nutrient availability. Sci. Rep. 2015, 4, 6932. [Google Scholar] [CrossRef]
- Zeng, S.L.; Zhang, T.T.; Gao, Y.; Ouyang, Z.T.; Chen, J.K.; Li, B.; Zhao, B. Effects of road age and distance on plant biodiversity: A case study in the Yellow River Delta of China. Plant Ecol. 2011, 212, 1213–1229. [Google Scholar] [CrossRef]
- Feng, L.; Li, X.R.; Zhang, J.G.; Li, X.J.; Su, J.Q. Vegetation Alteration in Response to Highway Construction in the Desertified Steppe Zone of the Tengger Desert, North China. Arid Land Res. Manag. 2012, 26, 59–78. [Google Scholar] [CrossRef]
- Sanaei, A.; Ali, A. What is the role of perennial plants in semi-steppe rangelands? Direct and indirect effects of perennial on annual plant species. Ecol. Indic. 2019, 98, 389–396. [Google Scholar] [CrossRef]
- Woodward, G.; Gessner, M.O.; Giller, P.S.; Gulis, V.; Hladyz, S.; Lecerf, A.; Malmqvist, B.; McKie, B.G.; Tiegs, S.D.; Cariss, H.; et al. Chauvet, Continental-Scale Effects of Nutrient Pollution on Stream Ecosystem Functioning. Science 2012, 336, 1438–1440. [Google Scholar] [CrossRef] [PubMed]
- Acosta, A.; Carranza, M.L.; Izzi, C.F. Are there habitats that contribute best to plant species diversity in coastal dunes? Biodivers. Conserv. 2009, 18, 1087–1098. [Google Scholar] [CrossRef]
- Malavasi, M.; Conti, L.; Carboni, M.; Cutini, M.; Acosta, A.T. Multifaceted Analysis of Patch-Level Plant Diversity in Response to Landscape Spatial Pattern and History on Mediterranean Dunes. Ecosystems 2016, 19, 850–864. [Google Scholar] [CrossRef]
Disclaimer/Publisher’s Note: The statements, opinions and data contained in all publications are solely those of the individual author(s) and contributor(s) and not of MDPI and/or the editor(s). MDPI and/or the editor(s) disclaim responsibility for any injury to people or property resulting from any ideas, methods, instructions or products referred to in the content. |
© 2024 by the authors. Licensee MDPI, Basel, Switzerland. This article is an open access article distributed under the terms and conditions of the Creative Commons Attribution (CC BY) license (https://creativecommons.org/licenses/by/4.0/).