
Barriers to Implementing Lean Six Sigma in the Chemical Process Industry: The Case of Brazil


Abstract
1. Introduction
2. Literature Review
2.1. Lean Six Sigma
2.2. Chemical Process Industry
2.3. Barriers to LSS Implementation

| Authors | Main Findings |
|---|---|
| Jadhav, [21] | Identified 24 barriers to Lean implementation across sectors and geographies. The top barriers were a lack of investment resources, senior management involvement, and workers’ resistance to Lean. Emphasized understanding the correlations between barriers and collective mitigation. |
| Panwar et al. [1] | Found Lean to be rarely adopted in Indian process industries, especially in the chemical sector. The main barriers included small production batches, hiring Lean experts, communication, and employee training. Lean was valued for reducing waste and increasing quality when adopted. |
| Abolhassani et al. [27] | Highlighted differences between Lean practitioners and nonpractitioners in the U.S. Practitioners identified a lack of technical knowledge and employee resistance as critical issues. On the other hand, nonpractitioners viewed top management commitment and Lean’s suitability for continuous processes as the main barriers to implementation. |
| Lodgaard et al. [22] | A two-year case study found that top managers, middle managers, and workers in a Norwegian company faced different barriers to Lean implementation. The barriers were categorized under management, organization for Lean, Lean tools, and knowledge. Success was limited due to these multilevel challenges. |
| Panwar et al. [26] | Found that lack of familiarity, expertise, education, training, and management support were major reasons for not implementing Lean in India’s process industry. Unique process characteristics and cultural barriers were considered less significant factors. |
| Muganyi et al. [12] | Reviewed the tools for LSSI in the CPI in South Africa. Concluded that LSSI effectively improves performance, including financial and quality gains. The strategic positioning of LSSI is critical for innovation and success in the CPI. |
| Kaswan and Rathi [9] | Analyzed enablers for Green LSS implementation. Identified data assimilation, Lean Green matrices, and organizational readiness as critical enablers for successful GLSS. |
| Rathi et al. [29] | Prioritized the barriers to LSSI in Indian micro, small, and medium enterprises (MSMEs). Management-related barriers were the most significant, followed by organization-related ones, highlighting the importance of leadership and organizational support for successful LSSI implementation. |
| Yadav et al. [23] | Explored Lean implementation barriers in SMEs in India. The main barriers were a lack of management commitment, leadership, and resources, poor communication, and insufficient knowledge of Lean’s benefits. Findings were consistent with larger organizations. |
| Ali et al. [20] | Developed a framework applied to an apparel manufacturing company. Found that lack of training, insufficient investments, and poor information sharing were the main barriers to LSSI implementation in Bangladesh. Addressing these issues was critical for success. |
| Chaple et al. [14] | Prioritized the barriers to Lean implementation in India. The most critical were insufficient management time, supervisory skills, and senior management skills. Cost and funding-related barriers were considered less significant. |
| Ramadas and Satish [30] | Identified the barriers to Lean in SMEs in India, including inadequate training programs, low-quality materials from suppliers, and poor communication between supervisors and workers. |
| Abu et al. [24] | The key barriers to Lean implementation in manufacturing industries in India were found to be a lack of understanding of Lean, insufficient resources, and employee resistance. Synergetic effects were identified between cultural, human attitudinal, and resource-related issues. |
| Swarnakar et al. [10] | Developed a hierarchical model to assess critical success factors (CSFs) for sustainable LSS in hospitals. Environmental and social responsibility, senior management leadership, and efficient resource usage were key factors. |
| Leite et al. [11] | Categorized Lean barriers into six groups: behavioral/cultural, organizational strategy, leadership, technical limitations, process-based issues, and resource constraints. Proposed eight measures to mitigate barriers. |
| Puram et al. [25] | Provided a systemic understanding of Lean barriers across sectors, including lack of resources, expertise, training, Lean principles knowledge, and co-ordination issues. |
| Patel and Patel [31] | Investigated LSSI adoption in Indian SMEs. Found that consultants are crucial for awareness and skills development. Top management commitment is vital, while resistance to change is a significant challenge. |
| Mano et al. [28] | Identified seven critical factors for Lean Construction in Brazil: team co-operation, performance measurement, decision-making involvement, leadership openness, and information flow. |
| Kumar et al. [32] | Identified and prioritized the barriers to LSSI in Indian manufacturing industries in the context of Industry 4.0 (I4.0). The main barriers include a lack of leadership, insufficient advisory and monitoring support, unclear understanding of the economic benefits, and inadequate integration of LSS with Industry 4.0 initiatives. |
| Abu-Salim et al. [33] | Investigated the barriers to LSSI in the service industry in India and suggested that the top barriers are lack of top management commitment, lack of customer focus, resistance to change management, and lack of alignment between the LSS and organizational strategy. |
| Mohan, Kaswan, and Rathi [34] | Examined the implementation of green LSS in Indian MSMEs and found that the primary barriers include insufficient top leadership support, a lack of adequate employees to carry out new strategies, and the absence of a technological plan for LSSI. |
2.4. Justification of the Research
3. Methods and Materials
3.1. ISM and MICMAC Analysis
3.2. Delphi Survey
3.3. Focus Group Discussion
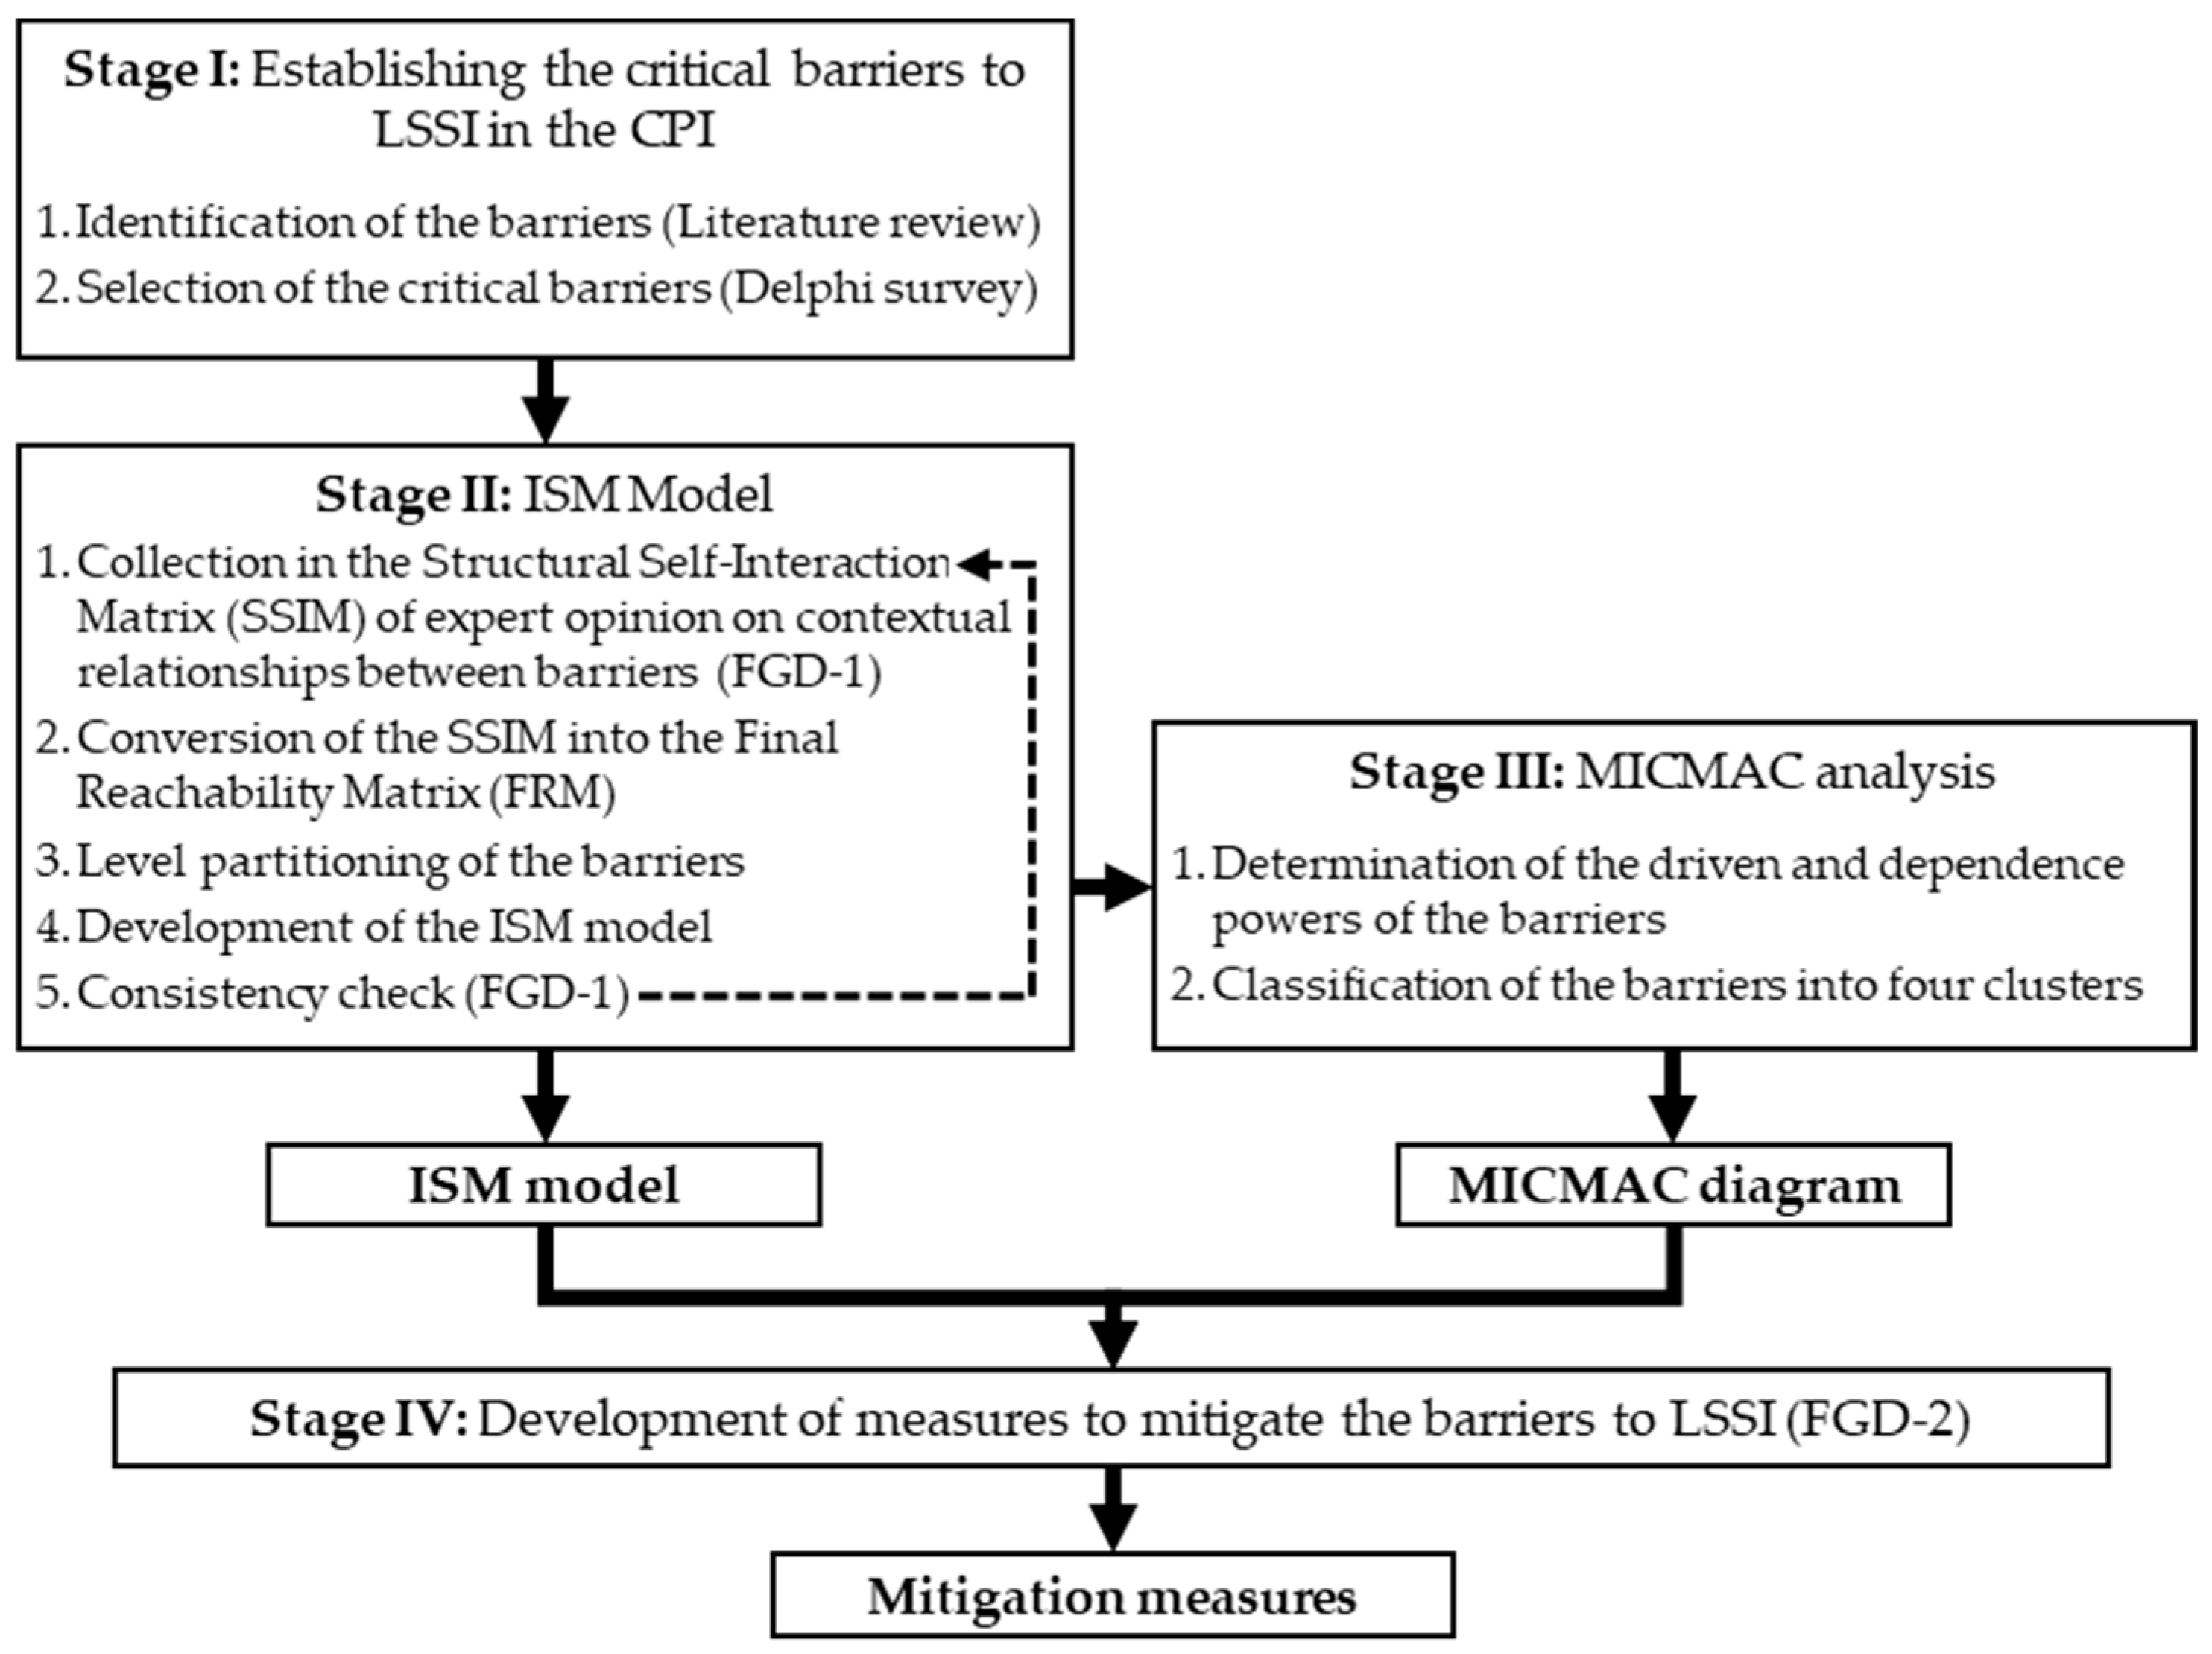
3.4. Methodological Framework
3.4.1. Stage I: Establishing the Critical Barriers to LSSI in the CPI
3.4.2. Stage II: ISM Model
- “V”—barrier i influences or aggravates the impact of barrier j;
- “A”—barrier j influences or aggravates the impact of barrier i;
- “X”—barriers i and j influence each other;
- “O”—there is no relationship between barriers i and j.
- If SSIM(i,j) = “V”, then IRM(i,j) = 1 and IRM(j,i) = 0;
- If SSIM(i,j) = “A”, then IRM(i,j) = 0 and IRM(j,i) = 1;
- If SSIM(i,j) = “X”, then IRM(i,j) = IRM(j,i) = 1;
- If SSIM(i,j) = “O”, then IRM(i,j) = IRM(j,i) = 0.
3.4.3. Stage III: MICMAC Analysis
3.4.4. Stage IV: Development of Mitigation Measures
4. Results
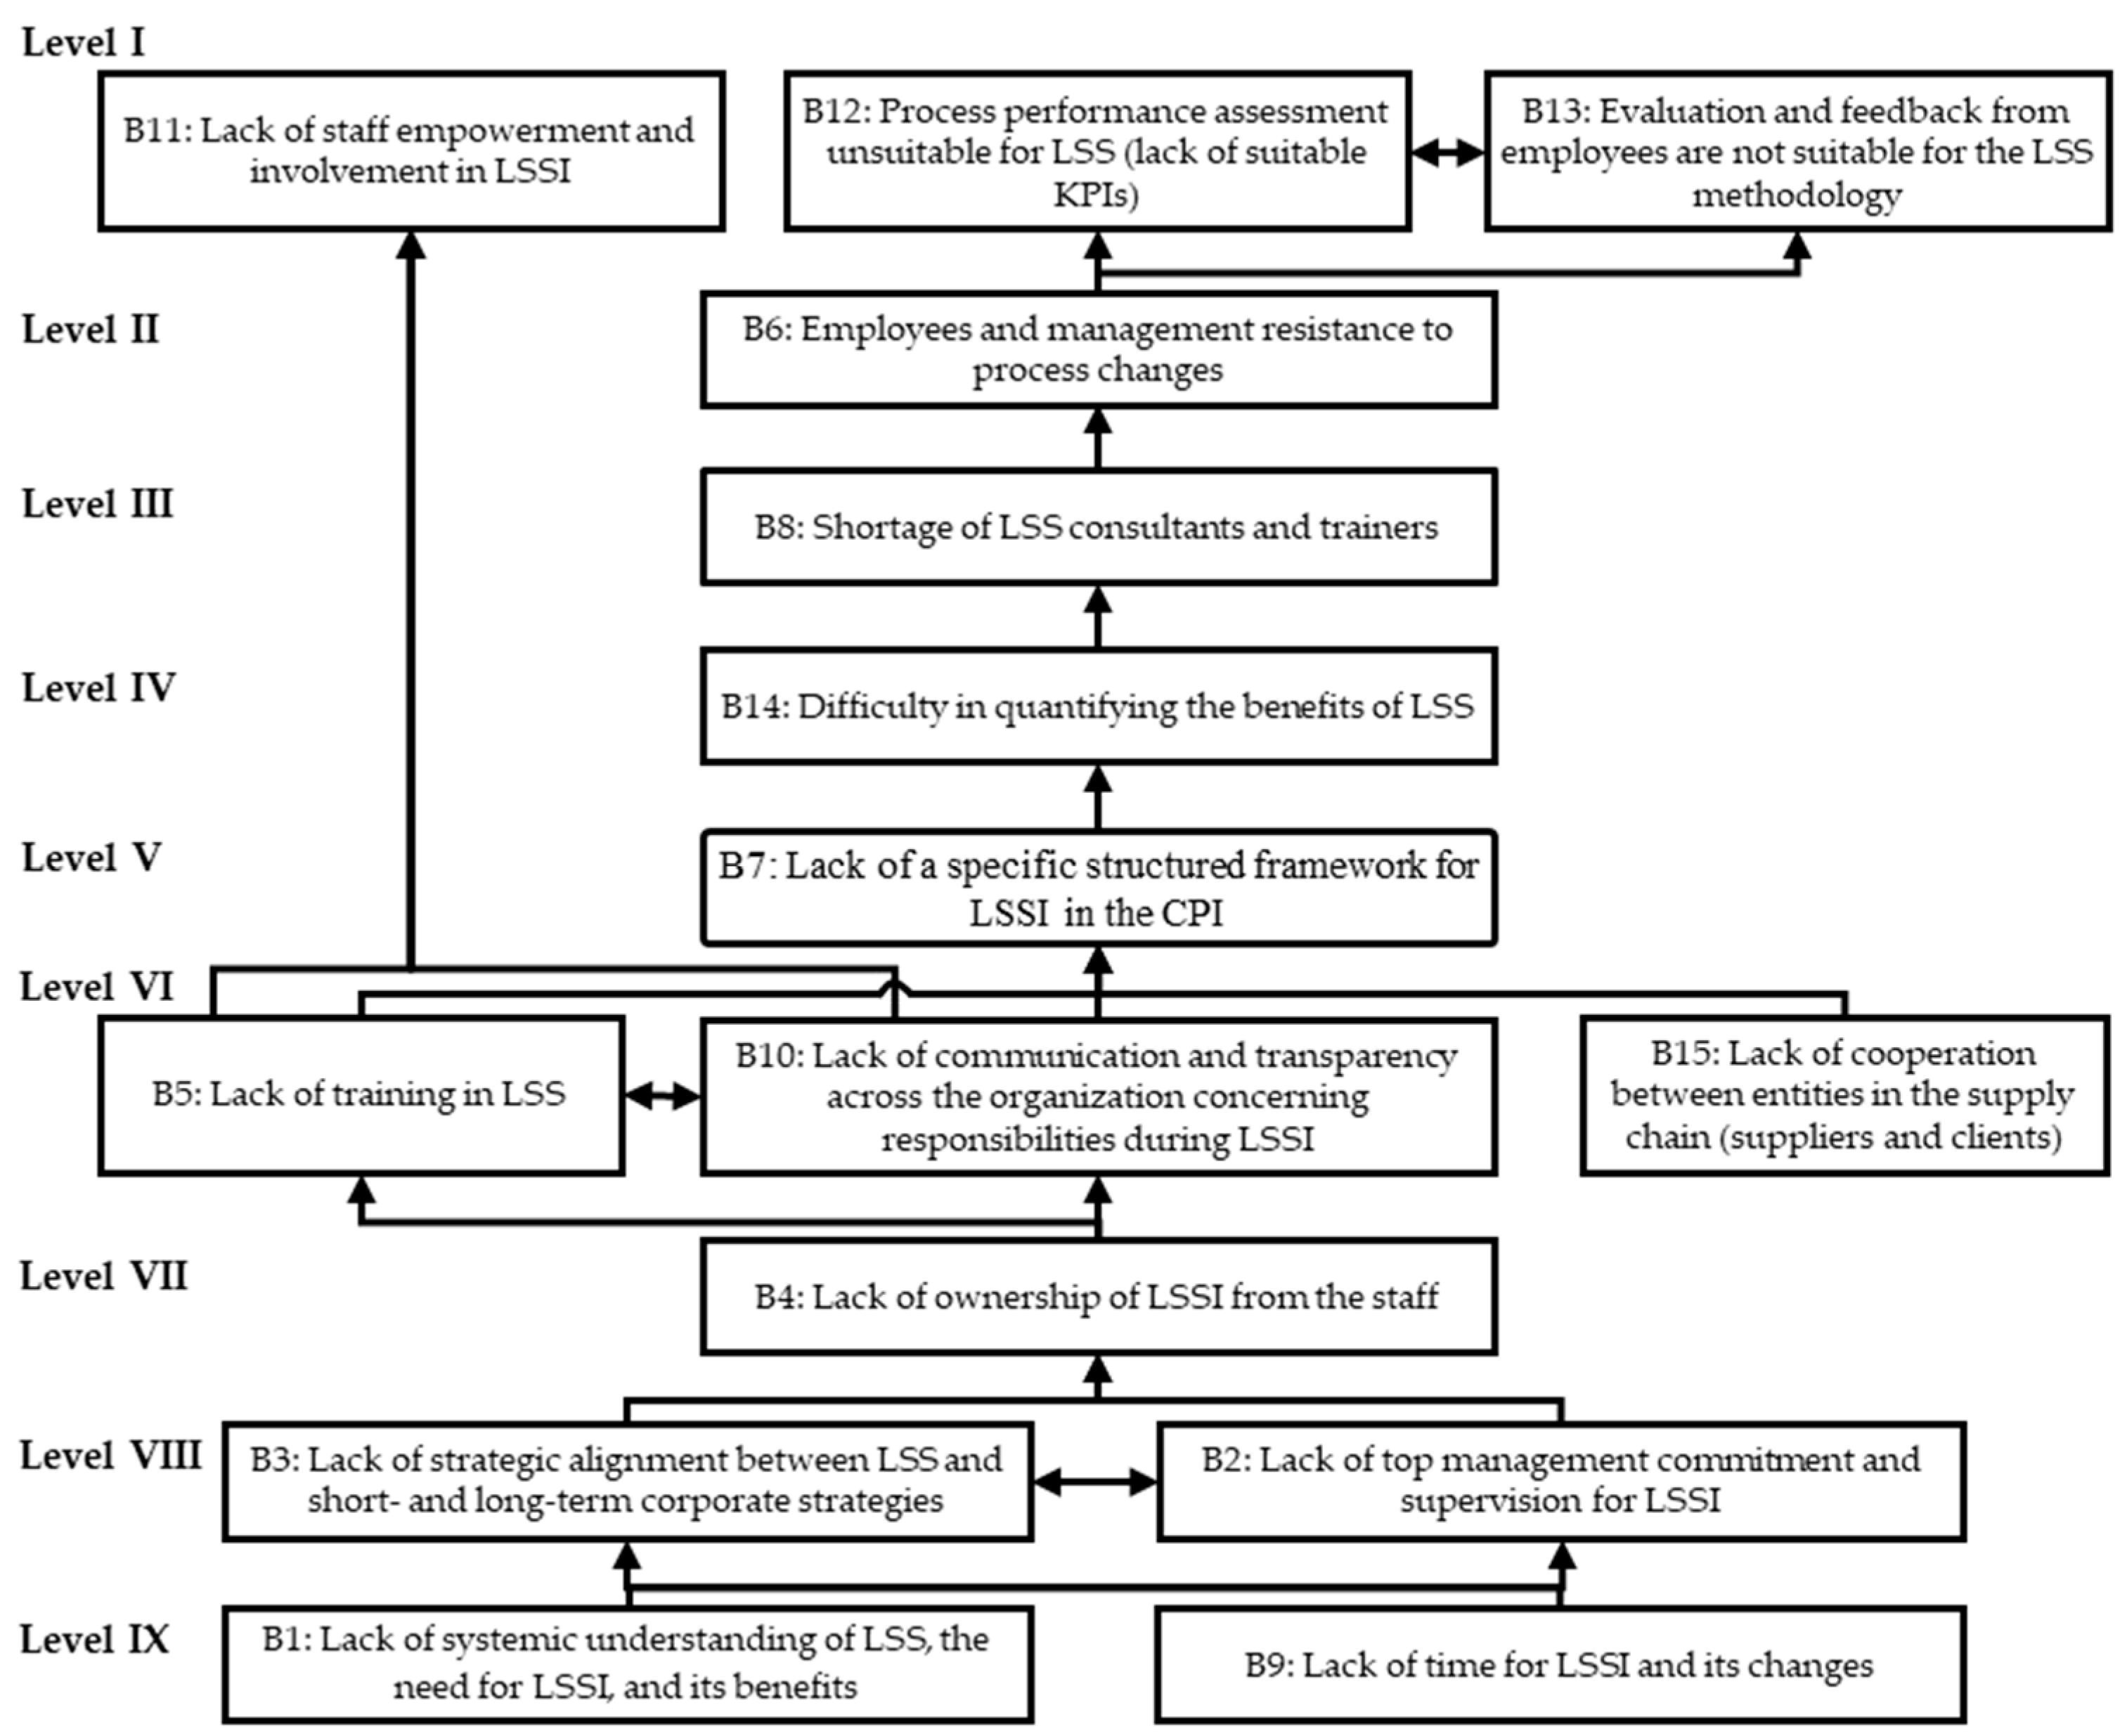
4.1. ISM Model
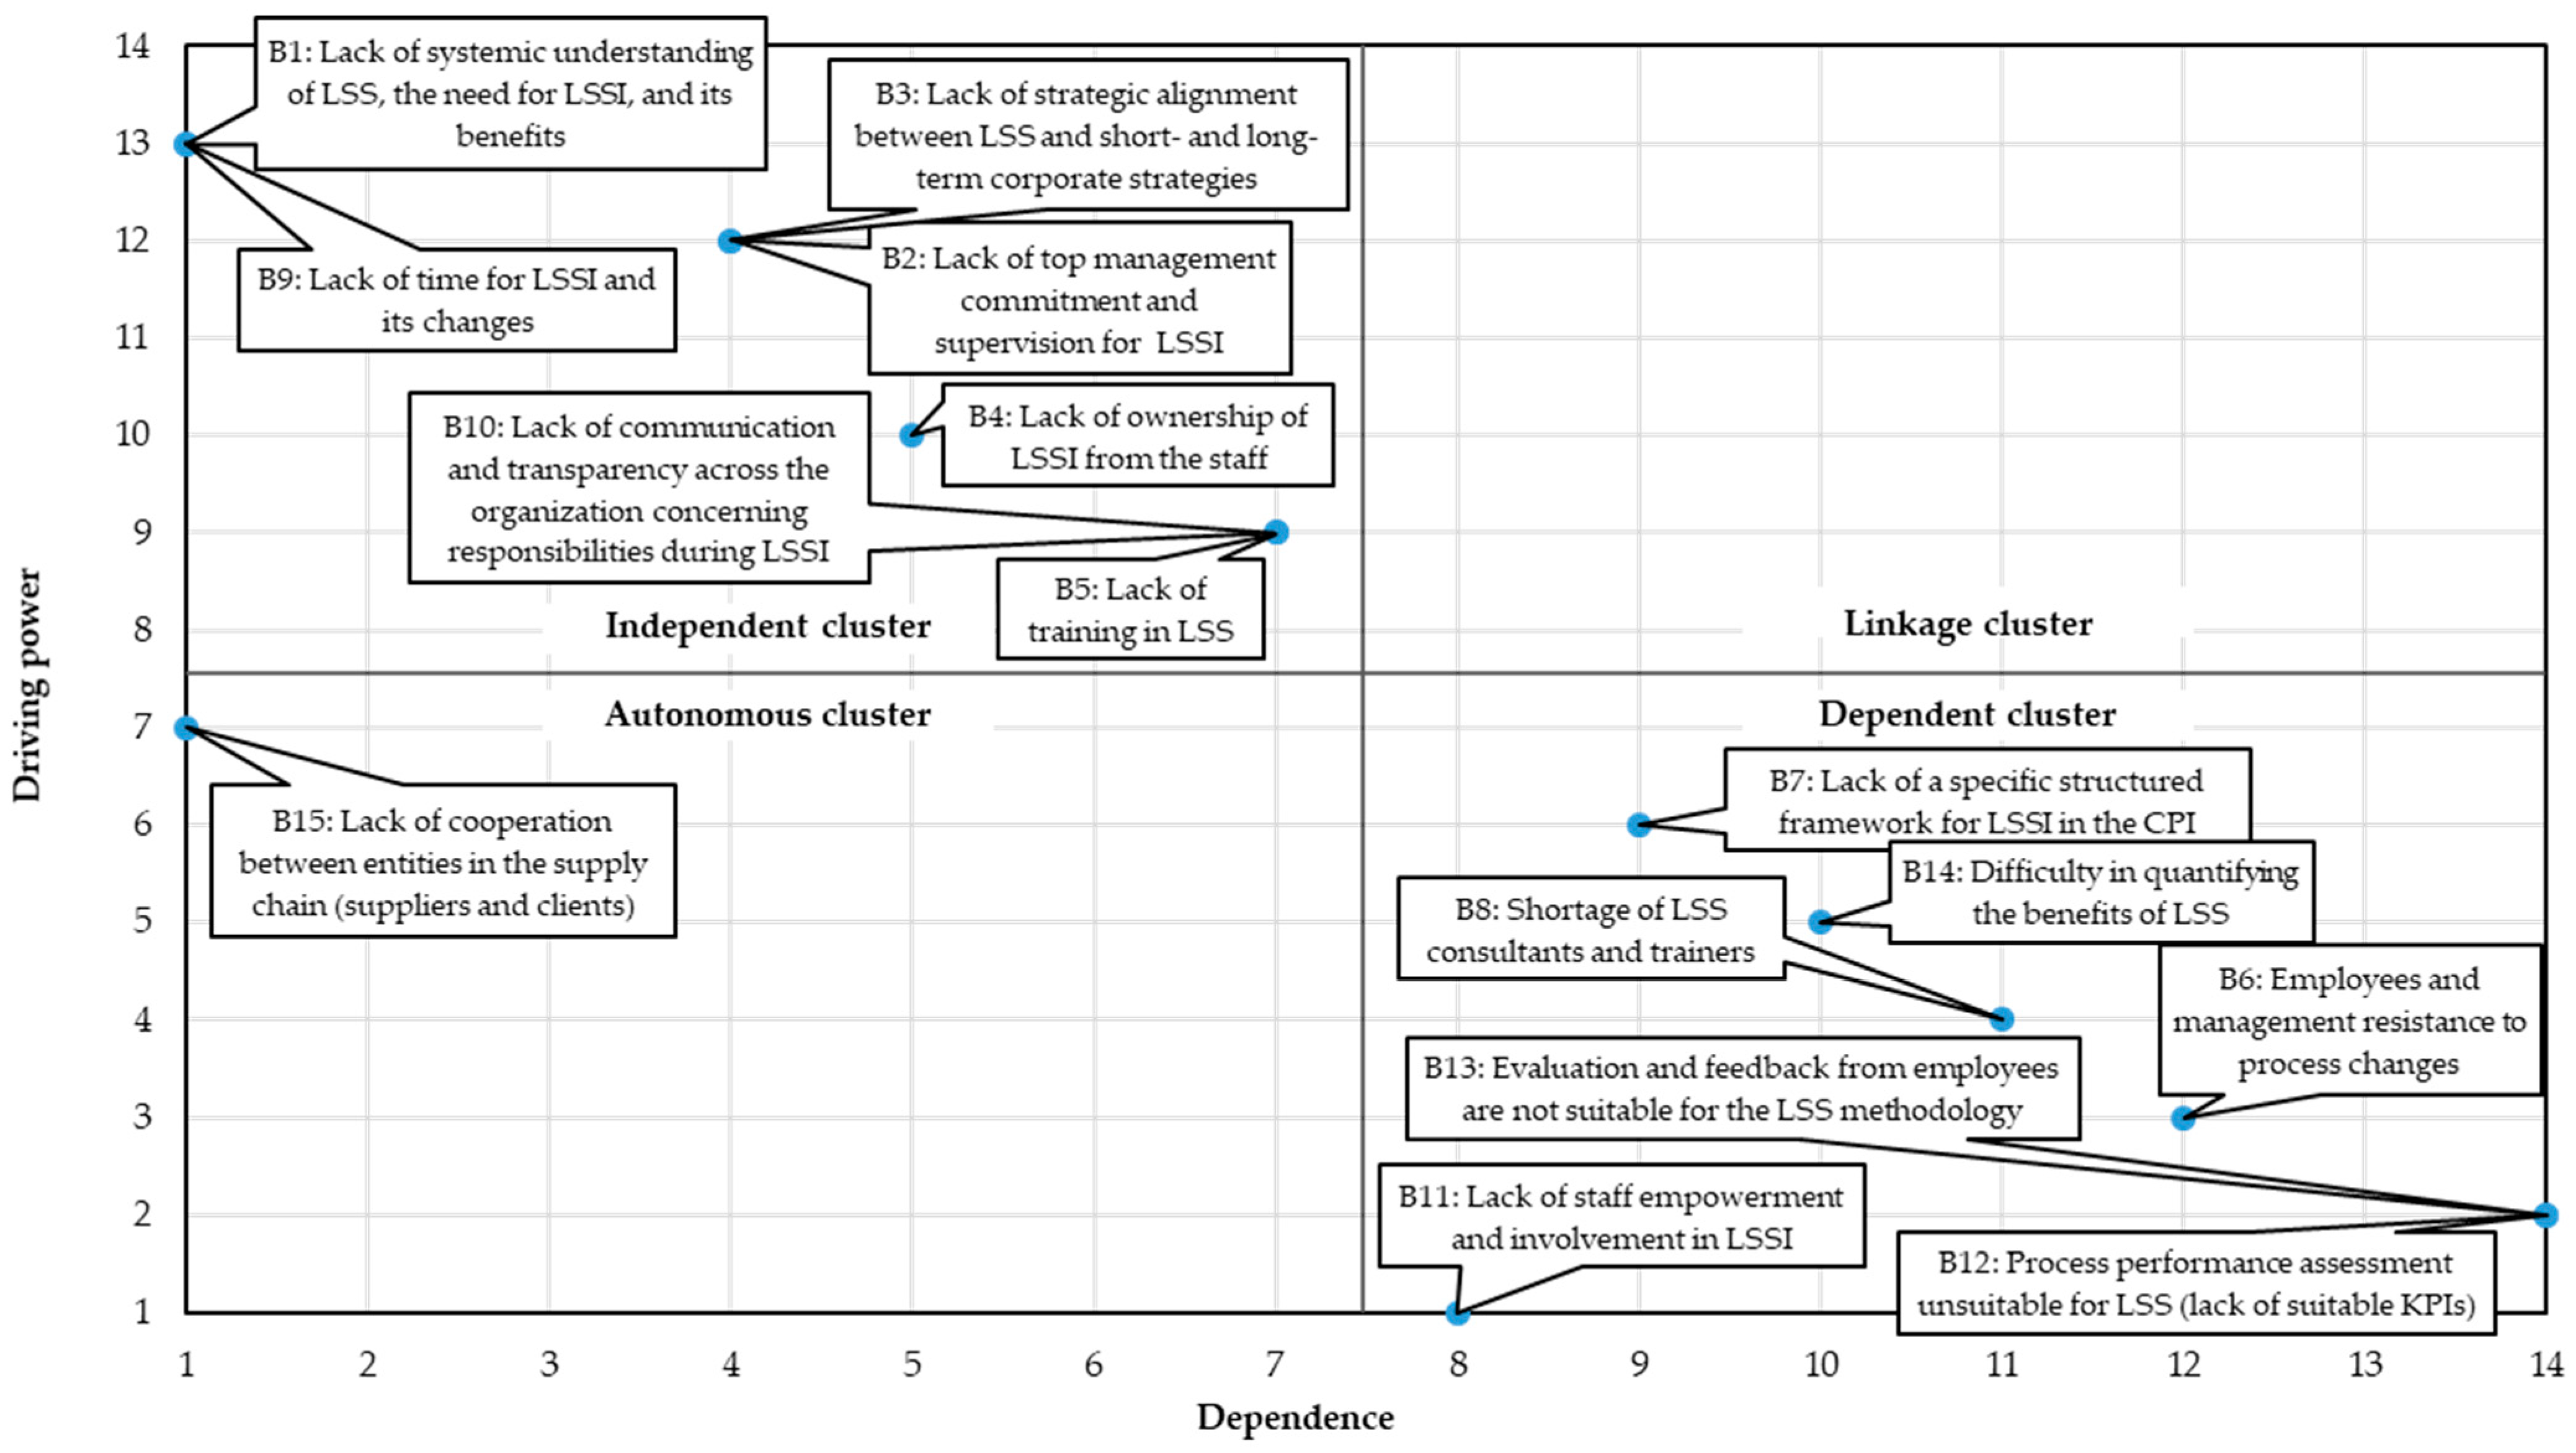
4.2. MICMAC Analysis
5. Discussion and Mitigation Measures
5.1. Discussion
5.2. Mitigation Measures
6. Conclusions
Author Contributions
Funding
Institutional Review Board Statement
Informed Consent Statement
Data Availability Statement
Acknowledgments
Conflicts of Interest
Appendix A. Level Partitioning of the Final Reachability Matrix
| Barrier | Reachability Set | Antecedent Set | Intersection Set | Level/ Iteration |
|---|---|---|---|---|
| 1 | B: 1; 2; 3; 4; 5; 6; 7; 8; 10; 11; 12; 13; 14 | B1 | B1 | |
| 2 | B: 2; 3; 4; 5; 6; 7; 8; 10; 11; 12; 13; 14 | B: 1; 2; 3; 9 | B: 2; 3 | |
| 3 | B: 2; 3; 4; 5; 6; 7; 8; 10; 11; 12; 13; 14 | B: 1; 2; 3; 9 | B: 2; 3 | |
| 4 | B: 4; 5; 6; 7; 8; 10; 11; 12; 13; 14 | B: 1; 2; 3; 4; 9 | B4 | |
| 5 | B: 5; 6; 7; 8; 10; 11; 12; 13; 14 | B: 1; 2; 3; 4; 5; 9; 10 | B: 5; 10 | |
| 6 | B: 6; 12; 13 | B: 1; 2; 3; 4; 5; 6; 7; 8; 9; 10; 14; 15 | B6 | |
| 7 | B: 6; 7; 8; 12; 13; 14 | B: 1; 2; 3; 4; 5; 7; 9; 10; 15 | B7 | |
| 8 | B: 6; 8; 12; 13 | B: 1; 2; 3; 4; 5; 7; 8; 9; 10; 14; 15 | B8 | |
| 9 | B: 2; 3; 4; 5; 6; 7; 8; 9; 10; 11; 12; 13; 14 | B9 | B9 | |
| 10 | B: 5; 6; 7; 8; 10; 11; 12; 13; 14 | B: 1; 2; 3; 4; 5; 9; 10 | B: 5; 10 | |
| 11 | B: 11 | B: 1; 2; 3; 4; 5; 9; 10; 11 | B11 | I |
| 12 | B: 12; 13 | B: 1; 2; 3; 4; 5; 6; 7; 8; 9; 10; 12; 13; 14; 15 | B: 12; 13 | I |
| 13 | B: 12; 13 | B: 1; 2; 3; 4; 5; 6; 7; 8; 9; 10; 12; 13; 14; 15 | B: 12; 13 | I |
| 14 | B: 6; 8; 12; 13; 14 | B: 1; 2; 3; 4; 5; 7; 9; 10; 14; 15 | B14 | |
| 15 | B: 6; 7; 8; 12; 13; 14; 15 | B15 | B15 | |
| 1 | B: 1; 2; 3; 4; 5; 6; 7; 8; 10; 14 | B1 | B1 | |
| 2 | B: 2; 3; 4; 5; 6; 7; 8; 10; 14 | B: 1; 2; 3; 9 | B: 2; 3 | |
| 3 | B: 2; 3; 4; 5; 6; 7; 8; 10; 14 | B: 1; 2; 3; 9 | B: 2; 3 | |
| 4 | B: 4; 5; 6; 7; 8; 10; 14 | B: 1; 2; 3; 4; 9 | B4 | |
| 5 | B: 5; 6; 7; 8; 10; 14 | B: 1; 2; 3; 4; 5; 9; 10 | B: 5; 10 | |
| 6 | B6 | B: 1; 2; 3; 4; 5; 6; 7; 8; 9; 10; 14; 15 | B6 | II |
| 7 | B: 6; 7; 8; 14 | B: 1; 2; 3; 4; 5; 7; 9; 10; 15 | B7 | |
| 8 | B: 6; 8 | B: 1; 2; 3; 4; 5; 7; 8; 9; 10; 14; 15 | B8 | |
| 9 | B: 2; 3; 4; 5; 6; 7; 8; 9; 10; 14 | B9 | B9 | |
| 10 | B: 5; 6; 7; 8; 10; 14 | B: 1; 2; 3; 4; 5; 9; 10 | B: 5; 10 | |
| 14 | B: 6; 8; 14 | B: 1; 2; 3; 4; 5; 7; 9; 10; 14; 15 | B14 | |
| 15 | B: 6; 7; 8; 14; 15 | B15 | B15 | |
| 1 | B: 1; 2; 3; 4; 5; 7; 8; 10; 14 | B1 | B1 | |
| 2 | B: 2; 3; 4; 5; 7; 8; 10; 14 | B: 1; 2; 3; 9 | B: 2; 3 | |
| 3 | B: 2; 3; 4; 5; 7; 8; 10; 14 | B: 1; 2; 3; 9 | B: 2; 3 | |
| 4 | B: 4; 5; 7; 8; 10; 14 | B: 1; 2; 3; 4; 9 | B4 | |
| 5 | B: 5; 7; 8; 10; 14 | B: 1; 2; 3; 4; 5; 9; 10 | B: 5; 10 | |
| 7 | B: 7; 8; 14 | B: 1; 2; 3; 4; 5; 7; 9; 10; 15 | B7 | |
| 8 | B8 | B: 1; 2; 3; 4; 5; 7; 8; 9; 10; 14; 15 | B8 | III |
| 9 | B: 2; 3; 4; 5; 7; 8; 9; 10; 14 | B9 | B9 | |
| 10 | B: 5; 7; 8; 10; 14 | B: 1; 2; 3; 4; 5; 9; 10 | B: 5; 10 | |
| 14 | B: 8; 14 | B: 1; 2; 3; 4; 5; 7; 9; 10; 14; 15 | B14 | |
| 15 | B: 7; 8; 14; 15 | B15 | B15 | |
| 1 | B: 1; 2; 3; 4; 5; 7; 10; 14 | B1 | B1 | |
| 2 | B: 2; 3; 4; 5; 7; 10; 14; | B: 1; 2; 3; 9 | B: 2; 3 | |
| 3 | B: 2; 3; 4; 5; 7; 10; 14 | B: 1; 2; 3; 9 | B: 2; 3 | |
| 4 | B: 4; 5; 7; 10; 14 | B: 1; 2; 3; 4; 9 | B4 | |
| 5 | B: 5; 7; 10; 14 | B: 1; 2; 3; 4; 5; 9; 10 | B: 5; 10 | |
| 7 | B: 7; 14 | B: 1; 2; 3; 4; 5; 7; 9; 10; 15 | B7 | |
| 9 | B: 2; 3; 4; 5; 7; 9; 10; 14 | B9 | B9 | |
| 10 | B: 5; 7; 10; 14 | B: 1; 2; 3; 4; 5; 9; 10 | B: 5; 10 | |
| 14 | B14 | B: 1; 2; 3; 4; 5; 7; 9; 10; 14; 15 | B14 | IV |
| 15 | B: 7; 14; 15 | B15 | B15 | |
| 1 | B: 1; 2; 3; 4; 5; 7; 10 | B1 | B1 | |
| 2 | B: 2; 3; 4; 5; 7; 10 | B: 1; 2; 3; 9 | B: 2; 3 | |
| 3 | B: 2; 3; 4; 5; 7; 10 | B: 1; 2; 3; 9 | B: 2; 3 | |
| 4 | B: 4; 5; 7; 10 | B: 1; 2; 3; 4; 9 | B4 | |
| 5 | B: 5; 7; 10 | B: 1; 2; 3; 4; 5; 9; 10 | B: 5; 10 | |
| 7 | B7 | B: 1; 2; 3; 4; 5; 7; 9; 10; 15 | B7 | V |
| 9 | B: 2; 3; 4; 5; 7; 9; 10 | B9 | B9 | |
| 10 | B: 5; 7; 10 | B: 1; 2; 3; 4; 5; 9; 10 | B: 5; 10 | |
| 15 | B: 7; 15 | B15 | B15 | |
| 1 | B: 1; 2; 3; 4; 5; 10 | B1 | B1 | |
| 2 | B: 2; 3; 4; 5; 10 | B: 1; 2; 3; 9 | B: 2; 3 | |
| 3 | B: 2; 3; 4; 5; 10 | B: 1; 2; 3; 9 | B: 2; 3 | |
| 4 | B: 4; 5; 10 | B: 1; 2; 3; 4; 9 | B4 | |
| 5 | B: 5; 10 | B: 1; 2; 3; 4; 5; 9; 10 | B: 5; 10 | VI |
| 9 | B: 2; 3; 4; 5; 9; 10 | B9 | B9 | |
| 10 | B: 5; 10 | B: 1; 2; 3; 4; 5; 9; 10 | B: 5; 10 | VI |
| 15 | B15 | B15 | B15 | VI |
| 1 | B: 1; 2; 3; 4 | B1 | B1 | |
| 2 | B: 2; 3; 4 | B: 1; 2; 3; 9 | B: 2; 3 | |
| 3 | B: 2; 3; 4 | B: 1; 2; 3; 9 | B: 2; 3 | |
| 4 | B4 | B: 1; 2; 3; 4; 9 | B4 | VII |
| 9 | B: 2; 3; 4; 9 | B9 | B9 | |
| 1 | B: 1; 2; 3 | B1 | B1 | |
| 2 | B: 2; 3 | B: 1; 2; 3; 9 | B: 2; 3 | VIII |
| 3 | B: 2; 3 | B: 1; 2; 3; 9 | B: 2; 3 | VIII |
| 9 | B: 2; 3; 9 | B9 | B9 | |
| 1 | B1 | B1 | B1 | IX |
| 9 | B9 | B9 | B9 | IX |
References
- Panwar, A.; Jain, R.; Rathore, A.P.S. Lean Implementation in Indian Process Industries—Some Empirical Evidence. J. Manuf. Technol. Manag. 2015, 26, 131–160. [Google Scholar] [CrossRef]
- Alarcón, F.J.; Calero, M.; Pérez-Huertas, S.; Martín-Lara, M.Á. State of the Art of Lean Six Sigma and Its Implementation in Chemical Manufacturing Industry Using a Bibliometric Perspective. Appl. Sci. 2023, 13, 7022. [Google Scholar] [CrossRef]
- Luiz, L.C.; Tybuszeusky, J.M.L.; De Genaro Chiroli, D.M. Implementation of the Lean Six Sigma Methodology in a Chemical Industry. Navus—Rev. Gestão e Tecnol. 2020, 10, 1–18. [Google Scholar] [CrossRef]
- da Silva, E.; Hrycylo, D.A.A.; Moura, A.d.S. Relatório de Estatísticas Do Comércio Exterior—RECE; ABIQUIM: São Paulo, Brazil, 2002. [Google Scholar]
- Singh, M.; Rathi, R. A Structured Review of Lean Six Sigma in Various Industrial Sectors. Int. J. Lean Six Sigma 2019, 10, 622–664. [Google Scholar] [CrossRef]
- Ali, Y.; Younus, A.; Khan, A.U.; Pervez, H. Impact of Lean, Six Sigma and Environmental Sustainability on the Performance of SMEs. Int. J. Product. Perform. Manag. 2021, 70, 2294–2318. [Google Scholar] [CrossRef]
- Norman, W.; MacDonald, C. Getting to the Bottom of “Triple Bottom Line”. Bus. Ethics Q. 2004, 14, 243–262. [Google Scholar] [CrossRef]
- Panwar, A.; Nepal, B.P.; Jain, R.; Rathore, A.P.S. On the Adoption of Lean Manufacturing Principles in Process Industries. Prod. Plan. Control 2015, 26, 564–587. [Google Scholar] [CrossRef]
- Kaswan, M.S.; Rathi, R. Analysis and Modeling the Enablers of Green Lean Six Sigma Implementation Using Interpretive Structural Modeling. J. Clean. Prod. 2019, 231, 1182–1191. [Google Scholar] [CrossRef]
- Swarnakar, V.; Bagherian, A.; Singh, A.R. Modeling Critical Success Factors for Sustainable LSS Implementation in Hospitals: An Empirical Study. Int. J. Qual. Reliab. Manag. 2021, 39, 1249–1280. [Google Scholar] [CrossRef]
- Leite, H.; Radnor, Z.; Bateman, N. Meaningful Inhibitors of the Lean Journey: A Systematic Review and Categorisation of over 20 Years of Literature. Prod. Plan. Control 2022, 33, 403–426. [Google Scholar] [CrossRef]
- Muganyi, P.; Madanhire, I.; Mbohwa, C. Business Survival and Market Performance through Lean Six Sigma in the Chemical Manufacturing Industry. Int. J. Lean Six Sigma 2019, 10, 566–600. [Google Scholar] [CrossRef]
- Scheller, A.C.; Sousa-Zomer, T.T.; Cauchick-Miguel, P.A. Lean Six Sigma in Developing Countries: Evidence from a Large Brazilian Manufacturing Firm. Int. J. Lean Six Sigma 2021, 12, 3–22. [Google Scholar] [CrossRef]
- Chaple, A.P.; Narkhede, B.E.; Akarte, M.M.; Raut, R. Modeling the Lean Barriers for Successful Lean Implementation: TISM Approach. Int. J. Lean Six Sigma 2021, 12, 98–119. [Google Scholar] [CrossRef]
- Womack, J.P.; Jones, D.T. Lean Thinking—Banish Waste and Create Wealth in Your Corporation. J. Oper. Res. Soc. 1997, 48, 1144–1150. [Google Scholar] [CrossRef]
- Antony, J. A SWOT Analysis on Six Sigma: Some Perspectives from Leading Academics and Practitioners. Int. J. Product. Perform. Manag. 2012, 61, 691–698. [Google Scholar] [CrossRef]
- Antony, J. Six Sigma vs Lean: Some Perspectives from Leading Academics and Practitioners. Int. J. Product. Perform. Manag. 2011, 60, 185–190. [Google Scholar] [CrossRef]
- Antony, J.; Snee, R.; Hoerl, R. Lean Six Sigma: Yesterday, Today and Tomorrow. Int. J. Qual. Reliab. Manag. 2017, 34, 1073–1093. [Google Scholar] [CrossRef]
- Sharma, A.; Bhanot, N.; Gupta, A.; Trehan, R. Application of Lean Six Sigma Framework for Improving Manufacturing Efficiency: A Case Study in Indian Context. Int. J. Product. Perform. Manag. 2022, 71, 1561–1589. [Google Scholar] [CrossRef]
- Ali, S.M.; Hossen, M.A.; Mahtab, Z.; Kabir, G.; Paul, S.K.; Adnan, Z. ul H. Barriers to Lean Six Sigma Implementation in the Supply Chain: An ISM Model. Comput. Ind. Eng. 2020, 149, 106843. [Google Scholar] [CrossRef]
- Jadhav, J.R.; Mantha, S.S.; Rane, S.B. Exploring Barriers in Lean Implementation. Int. J. Lean Six Sigma 2014, 5, 122–148. [Google Scholar] [CrossRef]
- Lodgaard, E.; Ingvaldsen, J.A.; Gamme, I.; Aschehoug, S. Barriers to Lean Implementation: Perceptions of Top Managers, Middle Managers and Workers. Procedia CIRP 2016, 57, 595–600. [Google Scholar] [CrossRef]
- Yadav, V.; Jain, R.; Mittal, M.L.; Panwar, A.; Sharma, M.K. An Appraisal on Barriers to Implement Lean in SMEs. J. Manuf. Technol. Manag. 2019, 30, 195–212. [Google Scholar] [CrossRef]
- Abu, F.; Gholami, H.; Saman, M.Z.M.; Zakuan, N.; Streimikiene, D.; Kyriakopoulos, G.L. An SEM Approach for the Barrier Analysis in Lean Implementation in Manufacturing Industries. Sustainability 2021, 13, 1978. [Google Scholar] [CrossRef]
- Puram, P.; Sony, M.; Antony, J.; Gurumurthy, A. A Conceptual Framework for a Systemic Understanding of Barriers during Lean Implementation. TQM J. 2022, 34, 1469–1484. [Google Scholar] [CrossRef]
- Panwar, A.; Jain, R.; Rathore, A.P.S. Obstacles in Lean Implementation in Developing Countries—Some Cases from the Process Sector of India. Int. J. Lean Enterp. Res. 2016, 2, 26–45. [Google Scholar] [CrossRef]
- Abolhassani, A.; Layfield, K.; Gopalakrishnan, B. Lean and US Manufacturing Industry: Popularity of Practices and Implementation Barriers. Int. J. Product. Perform. Manag. 2016, 65, 875–897. [Google Scholar] [CrossRef]
- Mano, A.P.; da Costa, S.E.G.; de Lima, E.P.; Mergulhão, R.C. Exploratory Factor Analysis of Barriers to Lean Construction Based on Brazilian Managers’ Perceptions. Int. J. Lean Six Sigma 2023, 14, 94–114. [Google Scholar] [CrossRef]
- Rathi, R.; Kumar, A.; Khanduja, D. Identification and Prioritization Lean Six Sigma Barriers in MSMEs. J. Phys. Conf. Ser. 2019, 1240, 012062. [Google Scholar] [CrossRef]
- Ramadas, T.; Satish, K.P. Identification and Modeling of Process Barriers: Implementing Lean Manufacturing in Small-and Medium-Size Enterprises. Int. J. Lean Six Sigma 2021, 12, 61–77. [Google Scholar] [CrossRef]
- Patel, A.S.; Patel, K.M. Status of Lean Six Sigma Implementation in Indian Industries: A Cross-Sectional National Survey. Int. J. Lean Six Sigma 2023, 14, 791–814. [Google Scholar] [CrossRef]
- Kumar, P.; Brar, P.S.; Singh, D.; Bhamu, J. Fuzzy AHP Approach for Barriers to Implement LSS in the Context of Industry 4.0. Int. J. Product. Perform. Manag. 2023, 72, 2559–2583. [Google Scholar] [CrossRef]
- Abu-Salim, T.Y.; Agarwal, P.; Abu Elrub, E.; Haoum, L.; Almashgari, M.H. Investigation and Modelling Lean Six Sigma Barriers in Service Industries: A Hybrid ISM-Fuzzy MICMAC Approach. Meas. Bus. Excell. 2023, 27, 379–402. [Google Scholar] [CrossRef]
- Mohan, J.; Kaswan, M.S.; Rathi, R. Identification and Investigation into the Barriers to Green Lean Six Sigma Implementation: A Micro Small and Medium Enterprises Perspective. Int. J. Interact. Des. Manuf. 2024, 18, 6161–6175. [Google Scholar] [CrossRef]
- de Freitas, J.G.; Costa, H.G. Impacts of Lean Six Sigma over Organizational Sustainability: A Systematic Literature Review on Scopus Base. Int. J. Lean Six Sigma 2017, 8, 89–108. [Google Scholar] [CrossRef]
- Belhadi, A.; Kamble, S.S.; Gunasekaran, A.; Zkik, K.; Dileep Kumar, M.; Touriki, F.E. A Big Data Analytics-Driven Lean Six Sigma Framework for Enhanced Green Performance: A Case Study of Chemical Company. Prod. Plan. Control 2023, 34, 767–790. [Google Scholar] [CrossRef]
- Panwar, A.; Nepal, B.P.; Jain, R.; Rathore, A.P.S.; Lyons, A. Understanding the Linkages between Lean Practices and Performance Improvements in Indian Process Industries. Ind. Manag. Data Syst. 2017, 117, 346–364. [Google Scholar] [CrossRef]
- Abowitz, D.A.; Toole, T.M. Mixed Method Research: Fundamental Issues of Design, Validity, and Reliability in Construction Research. J. Constr. Eng. Manag. 2010, 136, 108–116. [Google Scholar] [CrossRef]
- Sushil Interpreting the Interpretive Structural Model. Glob. J. Flex. Syst. Manag. 2012, 13, 87–106. [CrossRef]
- Gorane, S.J.; Kant, R. Modelling the SCM Implementation Barriers An Integrated ISM-Fuzzy MICMAC Approach. J. Model. Manag. 2015, 10, 158–178. [Google Scholar] [CrossRef]
- Ambekar, S.; Roy, D.; Hiray, A.; Prakash, A.; Patyal, V.S. Barriers to Adoption of Reverse Logistics: A Case of Construction, Real Estate, Infrastructure and Project (CRIP) Sectors. Eng. Constr. Archit. Manag. 2021, 29, 2878–2902. [Google Scholar] [CrossRef]
- Kitzinger, J. Qualitative Research: Introducing Focus Groups. Bmj 1995, 311, 299. [Google Scholar] [CrossRef]
- Pimentel, M.; Arantes, A.; Cruz, C.O. Barriers to the Adoption of Reverse Logistics in the Construction Industry: A Combined ISM and MICMAC Approach. Sustainability 2022, 14, 15786. [Google Scholar] [CrossRef]
- Arantes, A.; Ferreira, L.M.D.F. Development of Delay Mitigation Measures in Construction Projects: A Combined Interpretative Structural Modeling and MICMAC Analysis Approach. Prod. Plan. Control 2024, 35, 1164–1179. [Google Scholar] [CrossRef]
- Ribeiro, A.M.; Arantes, A.; Cruz, C.O. Barriers to the Adoption of Modular Construction in Portugal: An Interpretive Structural Modelling Approach. Buildings 2022, 12, 1509. [Google Scholar] [CrossRef]
- Needham, R.D.; de Loë, R.C. The Policy Delphi: Purpose, Structure, and Application. Can. Geogr./Le Géographe Can. 1990, 34, 133–142. [Google Scholar] [CrossRef]
- Skitmore, M.; Smyth, H. Marketing and Pricing Strategy. In Construction Supply Chain Management: Concepts and Case Studies; Pryke, S., Ed.; Wiley-Blackwell: Oxford, UK, 2009; pp. 92–111. ISBN 1444319418. [Google Scholar]
- Yazdani, M.; Torkayesh, A.E.; Chatterjee, P. An Integrated Decision-Making Model for Supplier Evaluation in Public Healthcare System: The Case Study of a Spanish Hospital. J. Enterp. Inf. Manag. 2020, 33, 965–989. [Google Scholar] [CrossRef]
- Ahmad, N.; Jadaun, R.; Mehta, R.K.; Rai, M.; Siddiquee, M.S.; Yadav, O.P. Modelling of Barriers of PPP in Infrastructure. Int. Res. J. Eng. Technol. 2017, 4, 3474–3482. [Google Scholar]
- Singh, C.; Singh, D.; Khamba, J.S. Developing a Conceptual Model to Implement Green Lean Practices in Indian Manufacturing Industries Using ISM-MICMAC Approach. J. Sci. Technol. Policy Manag. 2020, 12, 587–608. [Google Scholar] [CrossRef]
- Francescatto, M.; Júnior, A.N.; Kubota, F.I.; Guimarães, G.; de Oliveira, B. Lean Six Sigma Case Studies Literature Overview: Critical Success Factors and Difficulties. Int. J. Product. Perform. Manag. 2023, 72, 1–23. [Google Scholar] [CrossRef]
- Aqlan, F.; Mustafa Ali, E. Integrating Lean Principles and Fuzzy Bow-Tie Analysis for Risk Assessment in Chemical Industry. J. Loss Prev. Process Ind. 2014, 29, 39–48. [Google Scholar] [CrossRef]
| No. | Barrier | GM | Rank | References |
|---|---|---|---|---|
| 1 | Lack of strategic alignment between LSS and corporate strategies for the short and long term (B3) | 5.86 | 3 | [12,14,16,22,23,25,27,29,31,35,48,49] |
| 2 | Lack of systemic understanding of LSS, the need for LSSI, and its benefits (B1) | 6.21 | 1 | [12,13,14,16,22,24,25,27,29,48,50] |
| 3 | Lack of top management commitment and supervision for LSSI (B2) | 6.11 | 2 | [12,14,22,24,25,26,27,29,35,36,50] |
| 4 | Lack of ownership of LSSI from the staff (B4) | 5.79 | 4 | [11,21,22,23,25] |
| 5 | Lack of co-operation between entities in the supply chain (B15) | 4.00 | 15 | [11,21,23,25,50] |
| 6 | Lack of staff empowerment and involvement in LSSI (B11) | 4.56 | 11 | [21,23,29,34] |
| 7 | Employees and management resistance to process changes (B6) | 5.29 | 6 | [1,14,16,22,23,25,26,29,31,35,50] |
| 8 | Lack of time for LSSI and its changes (B9) | 4.70 | 9 | [14,23,24] |
| 9 | Shortage of LSS consultants and trainers (B8) | 4.92 | 8 | [14,21,25] |
| 10 | Quality problems with the supplied material | 3.69 | 19 | [21] |
| 11 | Lack of logistic support | 3.77 | 17 | [21] |
| 12 | Regulations incompatible with LSSI | 2.70 | 25 | [50] |
| 13 | Lack of communication and transparency across the organization concerning responsibilities during LSSI (B10) | 4.68 | 10 | [1,9,20,21,22,25,50] |
| 14 | Process performance assessment unsuitable for LSS (lack of suitable KPIs) (B12) | 4.43 | 12 | [21,23,25] |
| 15 | Uncertain demand and high product variation make it challenging to achieve process stability and capacity for LSSI | 3.09 | 21 | [11,25,29] |
| 16 | Lack of a specific structured framework for LSSI in CPPs (B7) | 5.23 | 7 | [1,9,20,21,22,24,25] |
| 17 | Difficulty of process adaptation with technological changes in the industry proposed by LSS | 3.04 | 22 | [25,34,50] |
| 18 | Evaluation and feedback from industrial employees are not suitable for LSS methodology (B13) | 4.25 | 13 | [9,29] |
| 19 | Lack of LSS expertise and skills for implementation | 3.92 | 16 | [11,14,22,23,24,25,27,29] |
| 20 | Lack of training in LSS (B5) | 5.46 | 5 | [9,20,21,23,25,29,50] |
| 21 | Difficulty in quantifying the benefits of LSS (B14) | 4.01 | 14 | [25] |
| 22 | Lack of capital in the LSS implementation phase | 3.74 | 18 | [1,9,11,14,21,23,24,29,50] |
| 23 | High investment and maintenance costs | 3.38 | 20 | [14,27] |
| 24 | Difficulty in applying Lean in batch production processes, common in the chemical sector | 2.94 | 23 | [1] |
| 25 | Dependence of (chemical) processes on temperature, chemical reaction time, and sequence makes LSSI challenging | 2.60 | 26 | [1] |
| 26 | The need to change machines and layout configuration makes LSSI difficult | 2.88 | 24 | [9,21,29] |
| ID | Barrier—Description |
|---|---|
| B1 | Lack of systemic understanding of LSS, the need for LSSI, and its benefits—despite its growing popularity in certain industries, LSS remains underutilized in the CPI, leading to challenges in comprehending its concepts, benefits, and the rationale for its implementation [2]. |
| B2 | Lack of top management commitment and supervision for LSSI—since managers oversee processes, expenses, and teams, their exemplary dedication and supervision are crucial for adopting necessary changes, as is the case with any process or structural modification. Implementing LSS requires a tailored approach to process and personnel evaluation [51]. |
| B3 | Lack of strategic alignment between LSS and corporate strategies for the short and long term—LSS is a dynamic and adaptable approach that can be applied across various industry sectors [50]. However, successful implementation requires alignment with the organization’s infrastructure and corporate strategies. Without this adaptation, LSS is likely to fail [20]. |
| B4 | Lack of ownership of LSSI from the staff—leadership must move away from traditional, control-oriented management systems by sharing ownership of LSSI with technicians and operators. This collaborative approach is essential for successful implementation and the widespread adoption of LSS within the organization [21]. |
| B5 | Lack of training in LSS—LSSI leads to significant organizational changes. This requires employees to undergo training, receive proper documentation, and study implementation examples to acquire the skills and knowledge necessary for successful LSS adoption [29]. |
| B6 | Employees and management resistance to process changes—resistance to change spans all organizational levels and is particularly significant in the case of LSSI [27]. This challenge is aggravated in the CPI, where process changes are often complicated and complex, requiring substantial time and cost investments. |
| B7 | Lack of a specific structured framework for LSSI in the CPI—LSS and its tools were historically developed for assembly-based industries rather than those characterized by continuous processes mixed with batch operations and reliant on physical and chemical variables, as is the case in the CPI [1]. |
| B8 | Shortage of LSS consultants and trainers—training is crucial for success when a company is unfamiliar with LSS or is still in the early stages of adoption [52]. External trainers are essential during the initial phases of LSSI to develop and qualify a group of in-house experts. Later, consultants are needed to support the remaining phases of LSSI. |
| B9 | Lack of time for LSSI and its changes—since LSS processes are often not explicitly prioritized, employees tend to view them as secondary tasks, leaving them unable to allocate sufficient time for their study or implementation [27]. |
| B10 | Lack of communication and transparency across the organization concerning responsibilities during LSSI—a lack of communication or transparency regarding employee roles and responsibilities during LSSI can lead to failure [14]. Employees need to understand the motivations, goals, and benefits of LSSI. |
| B11 | Lack of staff empowerment and involvement in LSSI—engaging employees at every step of the process is crucial to ensuring that LSS is both implemented and consistently sustained in their daily activities. This involves soliciting their insights, opinions, and concerns while actively empowering them to participate in the process [23]. |
| B12 | Process performance assessment not suitable for LSS (lack of suitable KPIs)—once adopted, the metrics for measuring performance in areas such as effectiveness, quality, and productivity must be updated, added, or transformed. Inadequate follow-up on these metrics can lead to incorrect assessments of LSSI success, significantly hindering its effectiveness [37]. |
| B13 | Evaluation and feedback from employees are not suitable for LSS—LSSI typically leads to structural changes within the company, introducing new activities, metrics, and daily tasks. The entire employee evaluation process must be reviewed and updated to align with these changes [21]. |
| B14 | Difficulty in quantifying the benefits of LSS—LSSI requires a significant initial investment and ongoing expenditures to maintain new structures, consultants, programs, and other elements related to process changes through LSS adoption. This makes it challenging to quantify the benefits [21]. Translating employee skills and product quality improvements into financial indicators to justify the investment is particularly difficult. |
| B15 | Lack of co-operation between entities in the supply chain (suppliers and clients)—LSS requires an initial investment, changes, new implementations, and new ways of working. However, entities often lack the means or willingness to adopt it, leading to misalignments. Without co-operation, these misalignments can create significant challenges for LSSI across the supply chain [11]. |
| B(i/j) | 1 | 2 | 3 | 4 | 5 | 6 | 7 | 8 | 9 | 10 | 11 | 12 | 13 | 14 | 15 |
|---|---|---|---|---|---|---|---|---|---|---|---|---|---|---|---|
| 1 | - | V | V | V | O | O | V | O | O | O | O | O | O | V | O |
| 2 | - | - | X | V | V | O | O | O | A | V | V | O | O | O | O |
| 3 | - | - | - | O | O | V | O | O | O | V | O | V | V | O | O |
| 4 | - | - | - | - | V | O | O | V | O | O | V | O | O | V | O |
| 5 | - | - | - | - | - | O | V | O | A | X | V | O | O | O | O |
| 6 | - | - | - | - | - | - | O | A | O | O | O | V | O | A | A |
| 7 | - | - | - | - | - | - | - | O | O | A | O | O | V | V | A |
| 8 | - | - | - | - | - | - | - | - | O | A | O | V | O | A | O |
| 9 | - | - | - | - | - | - | - | - | - | O | O | O | O | O | O |
| 10 | - | - | - | - | - | - | - | - | - | - | O | O | V | O | O |
| 11 | - | - | - | - | - | - | - | - | - | - | - | O | O | O | O |
| 12 | - | - | - | - | - | - | - | - | - | - | - | - | X | A | O |
| 13 | - | - | - | - | - | - | - | - | - | - | - | - | - | O | O |
| 14 | - | - | - | - | - | - | - | - | - | - | - | - | - | - | O |
| 15 | - | - | - | - | - | - | - | - | - | - | - | - | - | - | - |
| B(i/j) | 1 | 2 | 3 | 4 | 5 | 6 | 7 | 8 | 9 | 10 | 11 | 12 | 13 | 14 | 15 |
|---|---|---|---|---|---|---|---|---|---|---|---|---|---|---|---|
| 1 | 1 | 1 | 1 | 0 | 0 | 0 | 1 | 0 | 0 | 0 | 0 | 0 | 0 | 1 | 0 |
| 2 | 0 | 1 | 1 | 1 | 1 | 0 | 0 | 0 | 0 | 1 | 1 | 0 | 0 | 0 | 0 |
| 3 | 0 | 1 | 1 | 0 | 0 | 1 | 0 | 0 | 0 | 1 | 0 | 1 | 1 | 0 | 0 |
| 4 | 0 | 0 | 0 | 1 | 1 | 0 | 0 | 1 | 0 | 0 | 1 | 0 | 0 | 1 | 0 |
| 5 | 0 | 0 | 0 | 0 | 1 | 0 | 1 | 0 | 0 | 1 | 1 | 0 | 0 | 0 | 0 |
| 6 | 0 | 0 | 0 | 0 | 0 | 1 | 0 | 0 | 0 | 0 | 0 | 1 | 0 | 0 | 0 |
| 7 | 0 | 0 | 0 | 0 | 0 | 0 | 1 | 0 | 0 | 0 | 0 | 0 | 1 | 1 | 0 |
| 8 | 0 | 0 | 0 | 0 | 0 | 1 | 0 | 1 | 0 | 0 | 0 | 1 | 0 | 0 | 0 |
| 9 | 0 | 1 | 0 | 0 | 1 | 0 | 0 | 0 | 1 | 0 | 0 | 0 | 0 | 0 | 0 |
| 10 | 0 | 0 | 0 | 0 | 1 | 0 | 1 | 1 | 0 | 1 | 0 | 0 | 1 | 0 | 0 |
| 11 | 0 | 0 | 0 | 0 | 0 | 0 | 0 | 0 | 0 | 0 | 1 | 0 | 0 | 0 | 0 |
| 12 | 0 | 0 | 0 | 0 | 0 | 0 | 0 | 0 | 0 | 0 | 0 | 1 | 1 | 0 | 0 |
| 13 | 0 | 0 | 0 | 0 | 0 | 0 | 0 | 0 | 0 | 0 | 0 | 1 | 1 | 0 | 0 |
| 14 | 0 | 0 | 0 | 0 | 0 | 1 | 0 | 1 | 0 | 0 | 0 | 1 | 0 | 1 | 0 |
| 15 | 0 | 0 | 0 | 0 | 0 | 1 | 1 | 0 | 0 | 0 | 0 | 0 | 0 | 0 | 1 |
| B(i/j) | 1 | 2 | 3 | 4 | 5 | 6 | 7 | 8 | 9 | 10 | 11 | 12 | 13 | 14 | 15 | DVP |
|---|---|---|---|---|---|---|---|---|---|---|---|---|---|---|---|---|
| 1 | 1 | 1 | 1 | 1* | 1* | 1* | 1 | 1* | 0 | 1* | 1* | 1* | 1* | 1 | 0 | 13 |
| 2 | 0 | 1 | 1 | 1 | 1 | 1* | 1* | 1* | 0 | 1 | 1 | 1* | 1* | 1* | 0 | 12 |
| 3 | 0 | 1 | 1 | 1* | 1* | 1 | 1* | 1* | 0 | 1 | 1* | 1 | 1 | 1* | 0 | 12 |
| 4 | 0 | 0 | 0 | 1 | 1 | 1* | 1* | 1 | 0 | 1* | 1 | 1* | 1* | 1 | 0 | 10 |
| 5 | 0 | 0 | 0 | 0 | 1 | 1* | 1 | 1* | 0 | 1 | 1 | 1* | 1* | 1* | 0 | 9 |
| 6 | 0 | 0 | 0 | 0 | 0 | 1 | 0 | 0 | 0 | 0 | 0 | 1 | 1* | 0 | 0 | 3 |
| 7 | 0 | 0 | 0 | 0 | 0 | 1* | 1 | 1* | 0 | 0 | 0 | 1* | 1 | 1 | 0 | 6 |
| 8 | 0 | 0 | 0 | 0 | 0 | 1 | 0 | 1 | 0 | 0 | 0 | 1 | 1* | 0 | 0 | 4 |
| 9 | 0 | 1 | 1* | 1* | 1 | 1* | 1* | 1* | 1 | 1* | 1* | 1* | 1* | 1* | 0 | 13 |
| 10 | 0 | 0 | 0 | 0 | 1 | 1* | 1 | 1 | 0 | 1 | 1* | 1* | 1 | 1* | 0 | 9 |
| 11 | 0 | 0 | 0 | 0 | 0 | 0 | 0 | 0 | 0 | 0 | 1 | 0 | 0 | 0 | 0 | 1 |
| 12 | 0 | 0 | 0 | 0 | 0 | 0 | 0 | 0 | 0 | 0 | 0 | 1 | 1 | 0 | 0 | 2 |
| 13 | 0 | 0 | 0 | 0 | 0 | 0 | 0 | 0 | 0 | 0 | 0 | 1 | 1 | 0 | 0 | 2 |
| 14 | 0 | 0 | 0 | 0 | 0 | 1 | 0 | 1 | 0 | 0 | 0 | 1 | 1* | 1 | 0 | 5 |
| 15 | 0 | 0 | 0 | 0 | 0 | 1 | 1 | 1* | 0 | 0 | 0 | 1* | 1* | 1* | 1 | 7 |
| DEP | 1 | 4 | 4 | 5 | 7 | 12 | 9 | 11 | 1 | 7 | 8 | 14 | 14 | 10 | 1 |
| Barrier | Reachability Set | Antecedent Set | Intersection Set | Level |
|---|---|---|---|---|
| B11 | B11 | B: 1; 2; 3; 4; 5; 9; 10; 11 | B11 | I |
| B12 | B: 12; 13 | B: 1; 2; 3; 4; 5; 6; 7; 8; 9; 10; 12; 13; 14; 15 | B: 12; 13 | I |
| B13 | B: 12; 13 | B: 1; 2; 3; 4; 5; 6; 7; 8; 9; 10; 12; 13; 14; 15 | B: 12; 13 | I |
| B6 | B6 | B: 1; 2; 3; 4; 5; 6; 7; 8; 9; 10; 14; 15 | B6 | II |
| B8 | B8 | B: 1; 2; 3; 4; 5; 7; 8; 9; 10; 14; 15 | B8 | III |
| B14 | B14 | B: 1; 2; 3; 4; 5; 7; 9; 10; 14; 15 | B14 | IV |
| B7 | B7 | B: 1; 2; 3; 4; 5; 7; 9; 10; 15 | B7 | V |
| B5 | B: 5; 10 | B: 1; 2; 3; 4; 5; 9; 10 | B: 5; 10 | VI |
| B10 | B: 5; 10 | B: 1; 2; 3; 4; 5; 9; 10 | B: 5; 10 | VI |
| B15 | B: 15 | B15 | B15 | VI |
| B4 | B4 | B: 1; 2; 3; 4; 9 | B4 | VII |
| B2 | B: 2; 3 | B: 1; 2; 3; 9 | B: 2; 3 | VIII |
| B3 | B: 2; 3 | B: 1; 2; 3; 9 | B: 2; 3 | VIII |
| B1 | B1 | B1 | B1 | IX |
| B9 | B9 | B9 | B9 | IX |
| B(i/j) | B11 | B12 | B13 | B6 | B8 | B14 | B7 | B5 | B10 | B15 | B4 | B2 | B3 | B1 | B9 |
|---|---|---|---|---|---|---|---|---|---|---|---|---|---|---|---|
| B11 | I | 0 | 0 | 0 | 0 | 0 | 0 | 0 | 0 | 0 | 0 | 0 | 0 | 0 | 0 |
| B12 | 0 | I | 1 | 0 | 0 | 0 | 0 | 0 | 0 | 0 | 0 | 0 | 0 | 0 | 0 |
| B13 | 0 | 1 | I | 0 | 0 | 0 | 0 | 0 | 0 | 0 | 0 | 0 | 0 | 0 | 0 |
| B6 | 0 | 1 | 1 | II | 0 | 0 | 0 | 0 | 0 | 0 | 0 | 0 | 0 | 0 | 0 |
| B8 | 0 | 1 | 1 | 1 | III | 0 | 0 | 0 | 0 | 0 | 0 | 0 | 0 | 0 | 0 |
| B14 | 0 | 1 | 1 | 1 | 1 | IV | 0 | 0 | 0 | 0 | 0 | 0 | 0 | 0 | 0 |
| B7 | 0 | 1 | 1 | 1 | 1 | 1 | V | 0 | 0 | 0 | 0 | 0 | 0 | 0 | 0 |
| B5 | 1 | 1 | 1 | 1 | 1 | 1 | 1 | VI | 1 | 0 | 0 | 0 | 0 | 0 | 0 |
| B10 | 1 | 1 | 1 | 1 | 1 | 1 | 1 | 1 | VI | 0 | 0 | 0 | 0 | 0 | 0 |
| B15 | 0 | 1 | 1 | 1 | 1 | 1 | 1 | 0 | 0 | VI | 0 | 0 | 0 | 0 | 0 |
| B4 | 1 | 1 | 1 | 1 | 1 | 1 | 1 | 1 | 1 | 0 | VII | 0 | 0 | 0 | 0 |
| B2 | 1 | 1 | 1 | 1 | 1 | 1 | 1 | 1 | 1 | 0 | 1 | VIII | 1 | 0 | 0 |
| B3 | 1 | 1 | 1 | 1 | 1 | 1 | 1 | 1 | 1 | 0 | 1 | 1 | VIII | 0 | 0 |
| B1 | 1 | 1 | 1 | 1 | 1 | 1 | 1 | 1 | 1 | 0 | 1 | 1 | 1 | IX | 0 |
| B9 | 1 | 1 | 1 | 1 | 1 | 1 | 1 | 1 | 1 | 0 | 1 | 1 | 1 | 0 | IX |
Disclaimer/Publisher’s Note: The statements, opinions and data contained in all publications are solely those of the individual author(s) and contributor(s) and not of MDPI and/or the editor(s). MDPI and/or the editor(s) disclaim responsibility for any injury to people or property resulting from any ideas, methods, instructions or products referred to in the content. |
© 2024 by the authors. Licensee MDPI, Basel, Switzerland. This article is an open access article distributed under the terms and conditions of the Creative Commons Attribution (CC BY) license (https://creativecommons.org/licenses/by/4.0/).
Share and Cite
Tortorelli, C.; Arantes, A. Barriers to Implementing Lean Six Sigma in the Chemical Process Industry: The Case of Brazil. Sustainability 2024, 16, 11257. https://doi.org/10.3390/su162411257
Tortorelli C, Arantes A. Barriers to Implementing Lean Six Sigma in the Chemical Process Industry: The Case of Brazil. Sustainability. 2024; 16(24):11257. https://doi.org/10.3390/su162411257
Chicago/Turabian StyleTortorelli, Caroline, and Amílcar Arantes. 2024. "Barriers to Implementing Lean Six Sigma in the Chemical Process Industry: The Case of Brazil" Sustainability 16, no. 24: 11257. https://doi.org/10.3390/su162411257
APA StyleTortorelli, C., & Arantes, A. (2024). Barriers to Implementing Lean Six Sigma in the Chemical Process Industry: The Case of Brazil. Sustainability, 16(24), 11257. https://doi.org/10.3390/su162411257